Project
Illumina Body Map 2 (GSE30611)
Navigation
Downloads
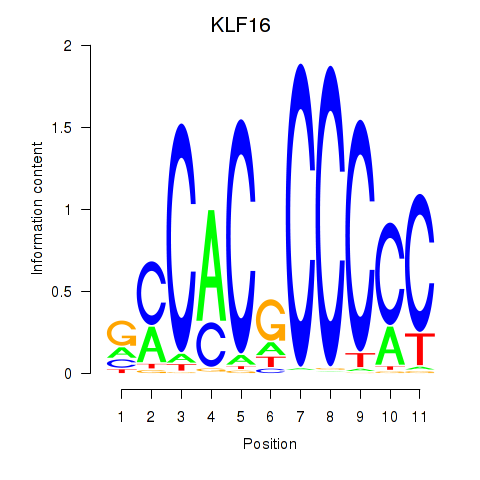
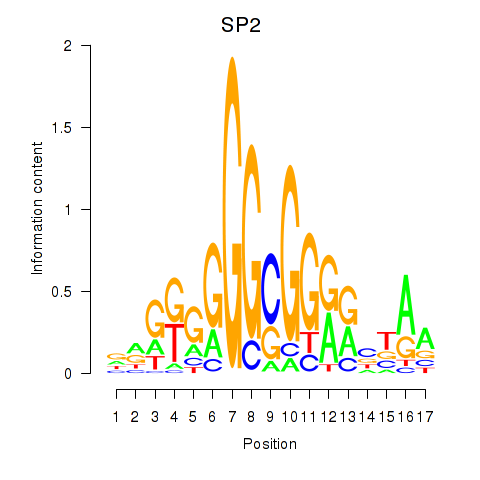
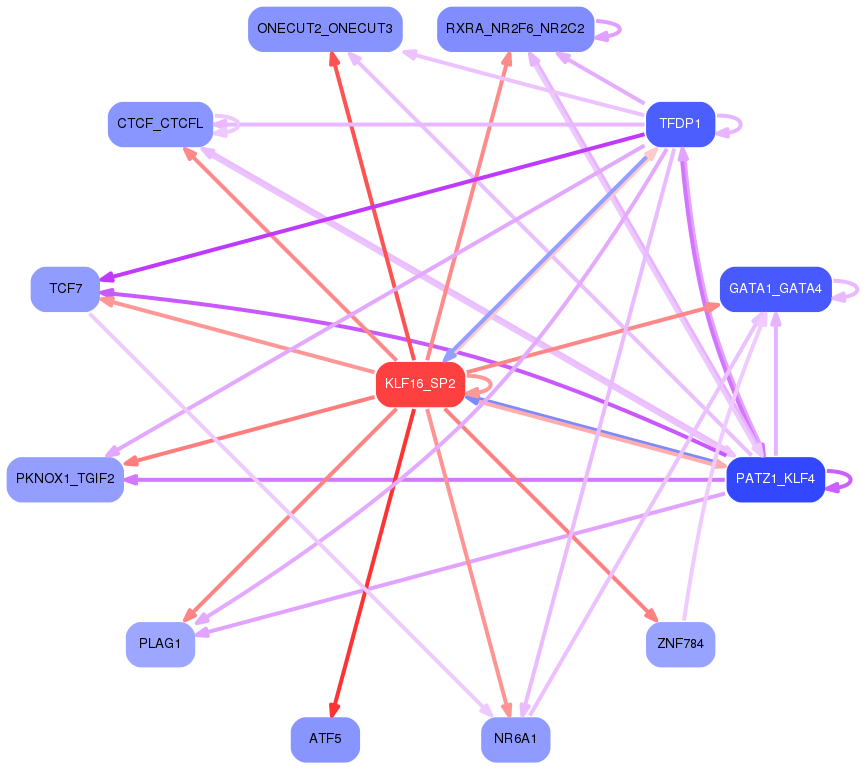
Results for KLF16_SP2
Z-value: 2.40
Motif logo
Transcription factors associated with KLF16_SP2
| Gene Symbol | Gene ID | Gene Info |
|---|---|---|
|
KLF16
|
ENSG00000129911.9 | Kruppel like factor 16 |
|
SP2
|
ENSG00000167182.15 | Sp2 transcription factor |
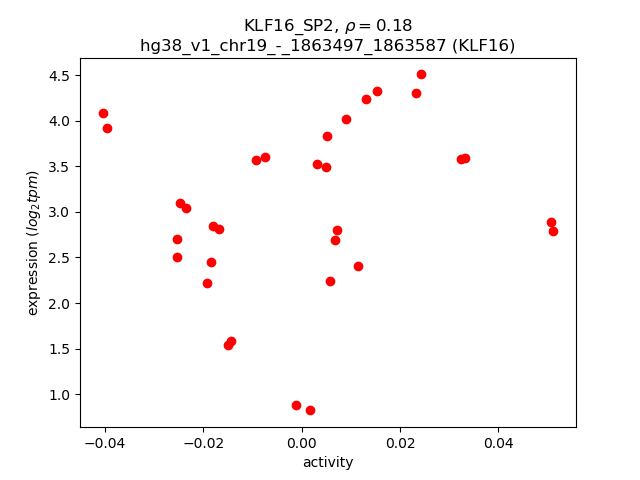
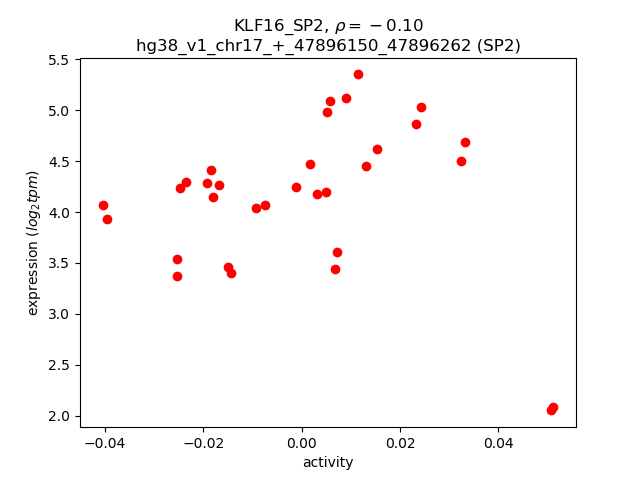
Activity-expression correlation:
| Gene | Promoter | Pearson corr. coef. | P-value | Plot |
|---|---|---|---|---|
| KLF16 | hg38_v1_chr19_-_1863497_1863587 | 0.18 | 3.2e-01 | Click! |
| SP2 | hg38_v1_chr17_+_47896150_47896262 | -0.10 | 5.9e-01 | Click! |
Activity profile of KLF16_SP2 motif
Sorted Z-values of KLF16_SP2 motif
Network of associatons between targets according to the STRING database.

First level regulatory network of KLF16_SP2
Gene Ontology Analysis
Gene overrepresentation in biological process category:
| Log-likelihood per target | Total log-likelihood | Term | Description |
|---|---|---|---|
| 2.4 | 7.2 | GO:0006867 | asparagine transport(GO:0006867) |
| 2.4 | 7.1 | GO:1903452 | regulation of G1 to G0 transition(GO:1903450) positive regulation of G1 to G0 transition(GO:1903452) |
| 2.2 | 13.1 | GO:0098707 | ferrous iron import into cell(GO:0097460) ferrous iron import across plasma membrane(GO:0098707) |
| 2.2 | 10.8 | GO:0010903 | negative regulation of very-low-density lipoprotein particle remodeling(GO:0010903) |
| 2.1 | 6.4 | GO:1903461 | Okazaki fragment processing involved in mitotic DNA replication(GO:1903461) |
| 2.1 | 8.4 | GO:0009447 | putrescine catabolic process(GO:0009447) |
| 1.9 | 13.6 | GO:0006535 | cysteine biosynthetic process from serine(GO:0006535) |
| 1.9 | 5.6 | GO:0051596 | methylglyoxal catabolic process to D-lactate via S-lactoyl-glutathione(GO:0019243) methylglyoxal catabolic process(GO:0051596) methylglyoxal catabolic process to lactate(GO:0061727) |
| 1.8 | 1.8 | GO:1990641 | response to iron ion starvation(GO:1990641) |
| 1.8 | 5.3 | GO:1903442 | response to methylamine(GO:0036255) response to lipoic acid(GO:1903442) |
| 1.6 | 6.2 | GO:0010900 | negative regulation of phosphatidylcholine catabolic process(GO:0010900) |
| 1.6 | 7.8 | GO:0046167 | glycerol-3-phosphate biosynthetic process(GO:0046167) |
| 1.5 | 7.6 | GO:0015887 | biotin transport(GO:0015878) pantothenate transmembrane transport(GO:0015887) |
| 1.5 | 6.0 | GO:0034445 | regulation of plasma lipoprotein particle oxidation(GO:0034444) negative regulation of plasma lipoprotein particle oxidation(GO:0034445) |
| 1.4 | 12.4 | GO:0031444 | slow-twitch skeletal muscle fiber contraction(GO:0031444) |
| 1.3 | 7.9 | GO:0033489 | cholesterol biosynthetic process via desmosterol(GO:0033489) cholesterol biosynthetic process via lathosterol(GO:0033490) |
| 1.3 | 3.9 | GO:1901301 | regulation of cargo loading into COPII-coated vesicle(GO:1901301) |
| 1.3 | 3.9 | GO:0060266 | negative regulation of respiratory burst involved in inflammatory response(GO:0060266) |
| 1.3 | 5.1 | GO:1990926 | short-term synaptic potentiation(GO:1990926) |
| 1.3 | 11.3 | GO:0035093 | spermatogenesis, exchange of chromosomal proteins(GO:0035093) |
| 1.3 | 5.0 | GO:0015910 | peroxisomal long-chain fatty acid import(GO:0015910) |
| 1.2 | 6.2 | GO:0071733 | transcriptional activation by promoter-enhancer looping(GO:0071733) gene looping(GO:0090202) dsDNA loop formation(GO:0090579) |
| 1.2 | 3.6 | GO:0046271 | phenylpropanoid catabolic process(GO:0046271) |
| 1.2 | 2.3 | GO:0007228 | positive regulation of hh target transcription factor activity(GO:0007228) |
| 1.2 | 4.7 | GO:0042939 | glutathione transport(GO:0034635) tripeptide transport(GO:0042939) |
| 1.1 | 4.6 | GO:0072302 | negative regulation of metanephric glomerulus development(GO:0072299) negative regulation of metanephric glomerular mesangial cell proliferation(GO:0072302) |
| 1.1 | 1.1 | GO:0019483 | beta-alanine biosynthetic process(GO:0019483) |
| 1.1 | 3.4 | GO:0035674 | tricarboxylic acid transmembrane transport(GO:0035674) |
| 1.1 | 11.2 | GO:0006572 | tyrosine catabolic process(GO:0006572) |
| 1.1 | 3.3 | GO:0045994 | positive regulation of translational initiation by iron(GO:0045994) |
| 1.1 | 3.3 | GO:0019464 | glycine catabolic process(GO:0006546) glycine decarboxylation via glycine cleavage system(GO:0019464) |
| 1.1 | 3.3 | GO:0006212 | uracil catabolic process(GO:0006212) |
| 1.1 | 6.5 | GO:0035063 | nuclear speck organization(GO:0035063) |
| 1.1 | 3.2 | GO:0006601 | creatine biosynthetic process(GO:0006601) |
| 1.1 | 8.5 | GO:1903382 | neuron intrinsic apoptotic signaling pathway in response to endoplasmic reticulum stress(GO:0036483) regulation of endoplasmic reticulum stress-induced neuron intrinsic apoptotic signaling pathway(GO:1903381) negative regulation of endoplasmic reticulum stress-induced neuron intrinsic apoptotic signaling pathway(GO:1903382) |
| 1.1 | 4.2 | GO:0048627 | myoblast development(GO:0048627) |
| 1.1 | 3.2 | GO:1901052 | sarcosine metabolic process(GO:1901052) sarcosine catabolic process(GO:1901053) |
| 1.1 | 5.3 | GO:0007290 | spermatid nucleus elongation(GO:0007290) |
| 1.0 | 4.1 | GO:0036146 | cellular response to mycotoxin(GO:0036146) |
| 1.0 | 3.0 | GO:0006097 | glyoxylate cycle(GO:0006097) |
| 1.0 | 3.0 | GO:0035526 | retrograde transport, plasma membrane to Golgi(GO:0035526) |
| 1.0 | 3.0 | GO:0046452 | dihydrofolate metabolic process(GO:0046452) |
| 1.0 | 3.0 | GO:0006059 | hexitol metabolic process(GO:0006059) |
| 1.0 | 5.0 | GO:0042441 | eye pigment biosynthetic process(GO:0006726) eye pigment metabolic process(GO:0042441) pigment metabolic process involved in developmental pigmentation(GO:0043324) pigment metabolic process involved in pigmentation(GO:0043474) |
| 1.0 | 3.0 | GO:2000797 | amniotic stem cell differentiation(GO:0097086) negative regulation of dense core granule biogenesis(GO:2000706) negative regulation of mesenchymal stem cell differentiation(GO:2000740) regulation of amniotic stem cell differentiation(GO:2000797) negative regulation of amniotic stem cell differentiation(GO:2000798) |
| 1.0 | 2.0 | GO:0001579 | medium-chain fatty acid transport(GO:0001579) |
| 1.0 | 3.9 | GO:0003290 | atrial septum secundum morphogenesis(GO:0003290) |
| 1.0 | 2.9 | GO:1903697 | negative regulation of microvillus assembly(GO:1903697) |
| 1.0 | 6.8 | GO:0006543 | glutamine catabolic process(GO:0006543) |
| 1.0 | 3.8 | GO:0019072 | viral genome packaging(GO:0019072) viral RNA genome packaging(GO:0019074) |
| 0.9 | 6.5 | GO:0046618 | drug export(GO:0046618) |
| 0.9 | 2.8 | GO:0008057 | eye pigment granule organization(GO:0008057) |
| 0.9 | 2.8 | GO:0019858 | cytosine metabolic process(GO:0019858) |
| 0.9 | 6.4 | GO:0019556 | histidine catabolic process to glutamate and formamide(GO:0019556) histidine catabolic process to glutamate and formate(GO:0019557) formamide metabolic process(GO:0043606) |
| 0.9 | 5.4 | GO:0009080 | alanine metabolic process(GO:0006522) alanine catabolic process(GO:0006524) pyruvate family amino acid metabolic process(GO:0009078) pyruvate family amino acid catabolic process(GO:0009080) |
| 0.9 | 6.3 | GO:0090206 | negative regulation of cholesterol biosynthetic process(GO:0045541) negative regulation of cholesterol metabolic process(GO:0090206) |
| 0.9 | 2.7 | GO:0060032 | notochord regression(GO:0060032) |
| 0.9 | 5.3 | GO:1901523 | leukotriene catabolic process(GO:0036100) leukotriene B4 catabolic process(GO:0036101) leukotriene B4 metabolic process(GO:0036102) icosanoid catabolic process(GO:1901523) fatty acid derivative catabolic process(GO:1901569) |
| 0.9 | 2.6 | GO:1902595 | regulation of DNA replication origin binding(GO:1902595) |
| 0.9 | 2.6 | GO:1990579 | protein trans-autophosphorylation(GO:0036290) peptidyl-serine trans-autophosphorylation(GO:1990579) |
| 0.9 | 9.6 | GO:0021707 | cerebellar granular layer formation(GO:0021684) cerebellar granule cell differentiation(GO:0021707) |
| 0.9 | 2.6 | GO:0015882 | L-ascorbic acid transport(GO:0015882) transepithelial L-ascorbic acid transport(GO:0070904) |
| 0.9 | 3.5 | GO:0014011 | Schwann cell proliferation involved in axon regeneration(GO:0014011) negative regulation of Schwann cell migration(GO:1900148) regulation of Schwann cell proliferation involved in axon regeneration(GO:1905044) negative regulation of Schwann cell proliferation involved in axon regeneration(GO:1905045) |
| 0.9 | 4.3 | GO:0070846 | misfolded protein transport(GO:0070843) polyubiquitinated protein transport(GO:0070844) polyubiquitinated misfolded protein transport(GO:0070845) Hsp90 deacetylation(GO:0070846) |
| 0.8 | 2.5 | GO:0006579 | amino-acid betaine catabolic process(GO:0006579) |
| 0.8 | 2.5 | GO:1904482 | response to tetrahydrofolate(GO:1904481) cellular response to tetrahydrofolate(GO:1904482) |
| 0.8 | 7.6 | GO:0006642 | triglyceride mobilization(GO:0006642) |
| 0.8 | 22.7 | GO:0006646 | phosphatidylethanolamine biosynthetic process(GO:0006646) |
| 0.8 | 4.2 | GO:0061034 | olfactory bulb mitral cell layer development(GO:0061034) |
| 0.8 | 4.1 | GO:0089712 | L-aspartate transport(GO:0070778) L-aspartate transmembrane transport(GO:0089712) |
| 0.8 | 8.2 | GO:0008063 | Toll signaling pathway(GO:0008063) |
| 0.8 | 2.5 | GO:0034769 | basement membrane disassembly(GO:0034769) |
| 0.8 | 4.1 | GO:0006669 | sphinganine-1-phosphate biosynthetic process(GO:0006669) |
| 0.8 | 4.0 | GO:0015772 | disaccharide transport(GO:0015766) sucrose transport(GO:0015770) oligosaccharide transport(GO:0015772) |
| 0.8 | 2.4 | GO:0015920 | lipopolysaccharide transport(GO:0015920) |
| 0.8 | 2.4 | GO:0090134 | mesendoderm migration(GO:0090133) cell migration involved in mesendoderm migration(GO:0090134) |
| 0.8 | 3.2 | GO:0034729 | histone H3-K79 methylation(GO:0034729) |
| 0.8 | 2.4 | GO:0071422 | succinate transport(GO:0015744) succinate transmembrane transport(GO:0071422) |
| 0.8 | 2.4 | GO:1904772 | hepatocyte homeostasis(GO:0036333) response to tetrachloromethane(GO:1904772) |
| 0.8 | 3.9 | GO:0009233 | menaquinone metabolic process(GO:0009233) |
| 0.8 | 4.6 | GO:1902361 | mitochondrial pyruvate transport(GO:0006850) mitochondrial pyruvate transmembrane transport(GO:1902361) |
| 0.8 | 5.4 | GO:0002933 | lipid hydroxylation(GO:0002933) |
| 0.8 | 5.4 | GO:0015015 | heparan sulfate proteoglycan biosynthetic process, enzymatic modification(GO:0015015) |
| 0.8 | 3.8 | GO:0060327 | cytoplasmic actin-based contraction involved in cell motility(GO:0060327) |
| 0.8 | 0.8 | GO:0006208 | pyrimidine nucleobase catabolic process(GO:0006208) thymine catabolic process(GO:0006210) thymine metabolic process(GO:0019859) |
| 0.8 | 1.5 | GO:1900186 | negative regulation of clathrin-mediated endocytosis(GO:1900186) |
| 0.7 | 5.2 | GO:0006741 | NADP biosynthetic process(GO:0006741) |
| 0.7 | 0.7 | GO:0006268 | DNA unwinding involved in DNA replication(GO:0006268) |
| 0.7 | 3.0 | GO:1904381 | Golgi apparatus mannose trimming(GO:1904381) |
| 0.7 | 2.9 | GO:1990108 | protein linear deubiquitination(GO:1990108) |
| 0.7 | 5.1 | GO:0006041 | glucosamine metabolic process(GO:0006041) |
| 0.7 | 2.2 | GO:0090031 | positive regulation of steroid hormone biosynthetic process(GO:0090031) |
| 0.7 | 4.2 | GO:1901908 | diadenosine polyphosphate metabolic process(GO:0015959) diadenosine polyphosphate catabolic process(GO:0015961) diphosphoinositol polyphosphate metabolic process(GO:0071543) diadenosine pentaphosphate metabolic process(GO:1901906) diadenosine pentaphosphate catabolic process(GO:1901907) diadenosine hexaphosphate metabolic process(GO:1901908) diadenosine hexaphosphate catabolic process(GO:1901909) adenosine 5'-(hexahydrogen pentaphosphate) metabolic process(GO:1901910) adenosine 5'-(hexahydrogen pentaphosphate) catabolic process(GO:1901911) |
| 0.7 | 2.1 | GO:0042938 | dipeptide transport(GO:0042938) |
| 0.7 | 3.5 | GO:1904021 | negative regulation of G-protein coupled receptor internalization(GO:1904021) |
| 0.7 | 2.8 | GO:0061092 | regulation of phospholipid translocation(GO:0061091) positive regulation of phospholipid translocation(GO:0061092) |
| 0.7 | 0.7 | GO:0072560 | type B pancreatic cell maturation(GO:0072560) |
| 0.7 | 2.7 | GO:0035498 | carnosine metabolic process(GO:0035498) |
| 0.7 | 2.0 | GO:0061699 | protein demalonylation(GO:0036046) peptidyl-lysine demalonylation(GO:0036047) protein desuccinylation(GO:0036048) peptidyl-lysine desuccinylation(GO:0036049) protein deglutarylation(GO:0061698) peptidyl-lysine deglutarylation(GO:0061699) |
| 0.7 | 2.7 | GO:0019254 | carnitine metabolic process, CoA-linked(GO:0019254) |
| 0.7 | 0.7 | GO:0006844 | acyl carnitine transport(GO:0006844) acyl carnitine transmembrane transport(GO:1902616) |
| 0.7 | 8.1 | GO:0007256 | activation of JNKK activity(GO:0007256) |
| 0.7 | 2.0 | GO:0016999 | antibiotic metabolic process(GO:0016999) |
| 0.7 | 2.7 | GO:0001831 | trophectodermal cellular morphogenesis(GO:0001831) |
| 0.7 | 6.0 | GO:0002034 | regulation of blood vessel size by renin-angiotensin(GO:0002034) renal control of peripheral vascular resistance involved in regulation of systemic arterial blood pressure(GO:0003072) |
| 0.7 | 2.0 | GO:0021722 | superior olivary nucleus development(GO:0021718) superior olivary nucleus maturation(GO:0021722) |
| 0.6 | 16.2 | GO:0021924 | cell proliferation in external granule layer(GO:0021924) cerebellar granule cell precursor proliferation(GO:0021930) |
| 0.6 | 2.6 | GO:1903633 | regulation of calcium-dependent ATPase activity(GO:1903610) negative regulation of calcium-dependent ATPase activity(GO:1903611) regulation of dUTP diphosphatase activity(GO:1903627) positive regulation of dUTP diphosphatase activity(GO:1903629) negative regulation of aminoacyl-tRNA ligase activity(GO:1903631) regulation of leucine-tRNA ligase activity(GO:1903633) negative regulation of leucine-tRNA ligase activity(GO:1903634) |
| 0.6 | 7.7 | GO:0032776 | DNA methylation on cytosine(GO:0032776) |
| 0.6 | 0.6 | GO:0006842 | tricarboxylic acid transport(GO:0006842) citrate transport(GO:0015746) |
| 0.6 | 2.5 | GO:0033152 | immunoglobulin V(D)J recombination(GO:0033152) |
| 0.6 | 1.3 | GO:1903422 | negative regulation of synaptic vesicle recycling(GO:1903422) |
| 0.6 | 1.9 | GO:0043321 | regulation of natural killer cell degranulation(GO:0043321) positive regulation of natural killer cell degranulation(GO:0043323) |
| 0.6 | 5.5 | GO:0006528 | asparagine metabolic process(GO:0006528) |
| 0.6 | 3.7 | GO:0006432 | phenylalanyl-tRNA aminoacylation(GO:0006432) |
| 0.6 | 1.8 | GO:0021526 | medial motor column neuron differentiation(GO:0021526) |
| 0.6 | 2.4 | GO:0031455 | glycine betaine biosynthetic process from choline(GO:0019285) glycine betaine metabolic process(GO:0031455) glycine betaine biosynthetic process(GO:0031456) |
| 0.6 | 7.2 | GO:1902221 | L-phenylalanine metabolic process(GO:0006558) L-phenylalanine catabolic process(GO:0006559) erythrose 4-phosphate/phosphoenolpyruvate family amino acid metabolic process(GO:1902221) erythrose 4-phosphate/phosphoenolpyruvate family amino acid catabolic process(GO:1902222) |
| 0.6 | 1.8 | GO:0044725 | chromatin reprogramming in the zygote(GO:0044725) |
| 0.6 | 16.0 | GO:0043046 | DNA methylation involved in gamete generation(GO:0043046) |
| 0.6 | 2.9 | GO:0061687 | detoxification of inorganic compound(GO:0061687) |
| 0.6 | 0.6 | GO:0034146 | toll-like receptor 5 signaling pathway(GO:0034146) |
| 0.6 | 1.7 | GO:1990697 | protein depalmitoleylation(GO:1990697) |
| 0.6 | 1.7 | GO:0009386 | translational attenuation(GO:0009386) |
| 0.6 | 1.7 | GO:0009644 | response to high light intensity(GO:0009644) |
| 0.6 | 1.7 | GO:0019303 | D-ribose catabolic process(GO:0019303) |
| 0.6 | 2.8 | GO:0009439 | cyanate metabolic process(GO:0009439) cyanate catabolic process(GO:0009440) |
| 0.6 | 1.7 | GO:0030576 | Cajal body organization(GO:0030576) |
| 0.6 | 0.6 | GO:0032020 | ISG15-protein conjugation(GO:0032020) |
| 0.6 | 1.7 | GO:0043012 | regulation of fusion of sperm to egg plasma membrane(GO:0043012) |
| 0.6 | 1.7 | GO:0036353 | histone H2A-K119 monoubiquitination(GO:0036353) |
| 0.6 | 2.2 | GO:0005986 | sucrose biosynthetic process(GO:0005986) |
| 0.6 | 1.7 | GO:0044205 | 'de novo' UMP biosynthetic process(GO:0044205) |
| 0.6 | 1.7 | GO:0071284 | cellular response to lead ion(GO:0071284) |
| 0.6 | 2.2 | GO:0019520 | aldonic acid metabolic process(GO:0019520) D-gluconate metabolic process(GO:0019521) |
| 0.6 | 1.1 | GO:2000705 | dense core granule biogenesis(GO:0061110) regulation of dense core granule biogenesis(GO:2000705) |
| 0.6 | 7.2 | GO:0051388 | positive regulation of neurotrophin TRK receptor signaling pathway(GO:0051388) |
| 0.6 | 3.9 | GO:1904274 | tricellular tight junction assembly(GO:1904274) |
| 0.5 | 2.2 | GO:0042450 | arginine biosynthetic process via ornithine(GO:0042450) |
| 0.5 | 1.6 | GO:0006742 | NADP catabolic process(GO:0006742) pyridine nucleotide catabolic process(GO:0019364) |
| 0.5 | 0.5 | GO:0009822 | alkaloid catabolic process(GO:0009822) |
| 0.5 | 6.9 | GO:0030091 | protein repair(GO:0030091) |
| 0.5 | 1.1 | GO:0051574 | positive regulation of histone H3-K9 methylation(GO:0051574) |
| 0.5 | 2.6 | GO:2000686 | regulation of rubidium ion transmembrane transporter activity(GO:2000686) |
| 0.5 | 0.5 | GO:2000847 | negative regulation of steroid hormone secretion(GO:2000832) negative regulation of corticosteroid hormone secretion(GO:2000847) negative regulation of glucocorticoid secretion(GO:2000850) |
| 0.5 | 0.5 | GO:1902022 | lysine transport(GO:0015819) L-lysine transport(GO:1902022) L-lysine transmembrane transport(GO:1903401) |
| 0.5 | 3.1 | GO:1903352 | L-ornithine transmembrane transport(GO:1903352) |
| 0.5 | 4.6 | GO:0055129 | L-proline biosynthetic process(GO:0055129) |
| 0.5 | 2.6 | GO:0043686 | co-translational protein modification(GO:0043686) |
| 0.5 | 1.5 | GO:0006106 | fumarate metabolic process(GO:0006106) |
| 0.5 | 1.5 | GO:0046108 | uridine metabolic process(GO:0046108) |
| 0.5 | 1.0 | GO:2000182 | regulation of progesterone biosynthetic process(GO:2000182) |
| 0.5 | 1.5 | GO:0002372 | myeloid dendritic cell cytokine production(GO:0002372) |
| 0.5 | 1.5 | GO:0070105 | positive regulation of interleukin-6-mediated signaling pathway(GO:0070105) |
| 0.5 | 3.0 | GO:0032902 | nerve growth factor production(GO:0032902) |
| 0.5 | 2.5 | GO:0051182 | coenzyme transport(GO:0051182) |
| 0.5 | 2.5 | GO:1901159 | glucuronate catabolic process(GO:0006064) glucuronate catabolic process to xylulose 5-phosphate(GO:0019640) xylulose 5-phosphate metabolic process(GO:0051167) xylulose 5-phosphate biosynthetic process(GO:1901159) |
| 0.5 | 3.5 | GO:0035522 | monoubiquitinated histone deubiquitination(GO:0035521) monoubiquitinated histone H2A deubiquitination(GO:0035522) |
| 0.5 | 2.0 | GO:0033693 | neurofilament bundle assembly(GO:0033693) |
| 0.5 | 7.4 | GO:0002681 | somatic diversification of T cell receptor genes(GO:0002568) somatic recombination of T cell receptor gene segments(GO:0002681) T cell receptor V(D)J recombination(GO:0033153) |
| 0.5 | 1.0 | GO:0051792 | medium-chain fatty acid biosynthetic process(GO:0051792) |
| 0.5 | 0.5 | GO:1905247 | regulation of aspartic-type endopeptidase activity involved in amyloid precursor protein catabolic process(GO:1902959) positive regulation of aspartic-type endopeptidase activity involved in amyloid precursor protein catabolic process(GO:1902961) regulation of aspartic-type peptidase activity(GO:1905245) positive regulation of aspartic-type peptidase activity(GO:1905247) |
| 0.5 | 1.5 | GO:0061184 | positive regulation of dermatome development(GO:0061184) |
| 0.5 | 7.7 | GO:0048387 | negative regulation of retinoic acid receptor signaling pathway(GO:0048387) |
| 0.5 | 6.8 | GO:2001199 | negative regulation of dendritic cell differentiation(GO:2001199) |
| 0.5 | 0.5 | GO:0051066 | dihydrobiopterin metabolic process(GO:0051066) |
| 0.5 | 5.3 | GO:0035865 | cellular response to potassium ion(GO:0035865) |
| 0.5 | 0.5 | GO:0010046 | response to mycotoxin(GO:0010046) |
| 0.5 | 1.9 | GO:0050993 | dimethylallyl diphosphate biosynthetic process(GO:0050992) dimethylallyl diphosphate metabolic process(GO:0050993) |
| 0.5 | 2.4 | GO:0030070 | insulin processing(GO:0030070) |
| 0.5 | 2.4 | GO:0097056 | selenocysteinyl-tRNA(Sec) biosynthetic process(GO:0097056) |
| 0.5 | 1.4 | GO:0072361 | regulation of glycolytic process by regulation of transcription from RNA polymerase II promoter(GO:0072361) |
| 0.5 | 2.4 | GO:1904154 | positive regulation of retrograde protein transport, ER to cytosol(GO:1904154) |
| 0.5 | 3.8 | GO:0030423 | targeting of mRNA for destruction involved in RNA interference(GO:0030423) |
| 0.5 | 16.5 | GO:0007130 | synaptonemal complex assembly(GO:0007130) |
| 0.5 | 2.8 | GO:0071955 | recycling endosome to Golgi transport(GO:0071955) |
| 0.5 | 1.4 | GO:0021529 | spinal cord oligodendrocyte cell differentiation(GO:0021529) spinal cord oligodendrocyte cell fate specification(GO:0021530) |
| 0.5 | 1.8 | GO:0071931 | positive regulation of transcription involved in G1/S transition of mitotic cell cycle(GO:0071931) |
| 0.5 | 2.7 | GO:0021993 | initiation of neural tube closure(GO:0021993) |
| 0.5 | 0.9 | GO:1905051 | regulation of base-excision repair(GO:1905051) positive regulation of base-excision repair(GO:1905053) |
| 0.5 | 2.7 | GO:0019264 | glycine biosynthetic process from serine(GO:0019264) |
| 0.5 | 12.2 | GO:0006004 | fucose metabolic process(GO:0006004) |
| 0.5 | 3.2 | GO:0044210 | 'de novo' CTP biosynthetic process(GO:0044210) |
| 0.4 | 10.3 | GO:0033540 | fatty acid beta-oxidation using acyl-CoA oxidase(GO:0033540) |
| 0.4 | 1.3 | GO:1902809 | regulation of skeletal muscle fiber differentiation(GO:1902809) |
| 0.4 | 16.3 | GO:0048240 | sperm capacitation(GO:0048240) |
| 0.4 | 3.1 | GO:0050893 | sensory processing(GO:0050893) |
| 0.4 | 1.3 | GO:0061445 | endocardial cell fate commitment(GO:0060957) endocardial cushion cell fate commitment(GO:0061445) |
| 0.4 | 2.2 | GO:0030573 | bile acid catabolic process(GO:0030573) |
| 0.4 | 1.3 | GO:0090675 | intermicrovillar adhesion(GO:0090675) |
| 0.4 | 1.7 | GO:1902445 | regulation of mitochondrial membrane permeability involved in programmed necrotic cell death(GO:1902445) |
| 0.4 | 5.6 | GO:0007144 | female meiosis I(GO:0007144) |
| 0.4 | 2.1 | GO:0090118 | receptor-mediated endocytosis of low-density lipoprotein particle involved in cholesterol transport(GO:0090118) |
| 0.4 | 1.7 | GO:0035092 | sperm chromatin condensation(GO:0035092) |
| 0.4 | 3.4 | GO:0044375 | regulation of peroxisome size(GO:0044375) |
| 0.4 | 7.7 | GO:0051315 | attachment of mitotic spindle microtubules to kinetochore(GO:0051315) |
| 0.4 | 8.5 | GO:0030046 | parallel actin filament bundle assembly(GO:0030046) |
| 0.4 | 3.4 | GO:0023021 | termination of signal transduction(GO:0023021) |
| 0.4 | 2.5 | GO:0033504 | floor plate development(GO:0033504) |
| 0.4 | 2.1 | GO:0072526 | pyridine-containing compound catabolic process(GO:0072526) |
| 0.4 | 5.0 | GO:0031119 | tRNA pseudouridine synthesis(GO:0031119) |
| 0.4 | 13.0 | GO:0050962 | detection of light stimulus involved in visual perception(GO:0050908) detection of light stimulus involved in sensory perception(GO:0050962) |
| 0.4 | 1.7 | GO:0043335 | protein unfolding(GO:0043335) |
| 0.4 | 2.1 | GO:0035574 | histone H4-K20 demethylation(GO:0035574) |
| 0.4 | 4.6 | GO:0042816 | vitamin B6 metabolic process(GO:0042816) |
| 0.4 | 4.2 | GO:0097039 | protein linear polyubiquitination(GO:0097039) |
| 0.4 | 0.8 | GO:0002018 | renin-angiotensin regulation of aldosterone production(GO:0002018) |
| 0.4 | 3.7 | GO:0009450 | gamma-aminobutyric acid catabolic process(GO:0009450) |
| 0.4 | 1.6 | GO:0035672 | oligopeptide transmembrane transport(GO:0035672) |
| 0.4 | 5.7 | GO:0008635 | activation of cysteine-type endopeptidase activity involved in apoptotic process by cytochrome c(GO:0008635) |
| 0.4 | 4.1 | GO:0000101 | sulfur amino acid transport(GO:0000101) |
| 0.4 | 1.2 | GO:0015938 | coenzyme A catabolic process(GO:0015938) nucleoside bisphosphate catabolic process(GO:0033869) ribonucleoside bisphosphate catabolic process(GO:0034031) purine nucleoside bisphosphate catabolic process(GO:0034034) |
| 0.4 | 1.2 | GO:0006173 | dADP biosynthetic process(GO:0006173) |
| 0.4 | 1.2 | GO:1990481 | mRNA pseudouridine synthesis(GO:1990481) |
| 0.4 | 2.8 | GO:0009191 | ribonucleoside diphosphate catabolic process(GO:0009191) |
| 0.4 | 2.0 | GO:1904059 | regulation of locomotor rhythm(GO:1904059) |
| 0.4 | 0.4 | GO:0046368 | GDP-L-fucose metabolic process(GO:0046368) |
| 0.4 | 1.2 | GO:0097119 | postsynaptic density protein 95 clustering(GO:0097119) |
| 0.4 | 10.8 | GO:0006054 | N-acetylneuraminate metabolic process(GO:0006054) |
| 0.4 | 2.0 | GO:1901090 | regulation of protein tetramerization(GO:1901090) negative regulation of protein tetramerization(GO:1901091) regulation of protein homotetramerization(GO:1901093) negative regulation of protein homotetramerization(GO:1901094) |
| 0.4 | 3.6 | GO:0006499 | N-terminal protein myristoylation(GO:0006499) |
| 0.4 | 2.4 | GO:0072298 | regulation of metanephric glomerulus development(GO:0072298) |
| 0.4 | 2.0 | GO:0007341 | penetration of zona pellucida(GO:0007341) |
| 0.4 | 0.4 | GO:2000819 | regulation of nucleotide-excision repair(GO:2000819) |
| 0.4 | 1.6 | GO:0006478 | peptidyl-tyrosine sulfation(GO:0006478) |
| 0.4 | 2.8 | GO:0032485 | Ral protein signal transduction(GO:0032484) regulation of Ral protein signal transduction(GO:0032485) |
| 0.4 | 1.2 | GO:0009085 | lysine biosynthetic process(GO:0009085) lysine biosynthetic process via aminoadipic acid(GO:0019878) |
| 0.4 | 1.2 | GO:0048213 | Golgi vesicle prefusion complex stabilization(GO:0048213) |
| 0.4 | 0.8 | GO:0032258 | CVT pathway(GO:0032258) |
| 0.4 | 1.6 | GO:0006175 | adenosine salvage(GO:0006169) dATP biosynthetic process(GO:0006175) |
| 0.4 | 0.4 | GO:0006668 | sphinganine-1-phosphate metabolic process(GO:0006668) |
| 0.4 | 0.8 | GO:0071895 | odontoblast differentiation(GO:0071895) |
| 0.4 | 5.5 | GO:0061088 | regulation of sequestering of zinc ion(GO:0061088) |
| 0.4 | 3.5 | GO:0006616 | SRP-dependent cotranslational protein targeting to membrane, translocation(GO:0006616) |
| 0.4 | 1.2 | GO:1904640 | response to methionine(GO:1904640) |
| 0.4 | 3.1 | GO:0036112 | medium-chain fatty-acyl-CoA metabolic process(GO:0036112) |
| 0.4 | 1.5 | GO:0034224 | cellular response to zinc ion starvation(GO:0034224) |
| 0.4 | 0.8 | GO:0032915 | positive regulation of transforming growth factor beta2 production(GO:0032915) |
| 0.4 | 0.8 | GO:0071169 | establishment of protein localization to chromatin(GO:0071169) |
| 0.4 | 5.0 | GO:0000414 | regulation of histone H3-K36 methylation(GO:0000414) |
| 0.4 | 0.8 | GO:0035963 | cellular response to interleukin-13(GO:0035963) |
| 0.4 | 5.4 | GO:0019367 | fatty acid elongation, saturated fatty acid(GO:0019367) fatty acid elongation, unsaturated fatty acid(GO:0019368) fatty acid elongation, monounsaturated fatty acid(GO:0034625) fatty acid elongation, polyunsaturated fatty acid(GO:0034626) |
| 0.4 | 1.1 | GO:0002415 | immunoglobulin transcytosis in epithelial cells mediated by polymeric immunoglobulin receptor(GO:0002415) |
| 0.4 | 1.1 | GO:0035038 | female pronucleus assembly(GO:0035038) |
| 0.4 | 1.1 | GO:0045048 | protein insertion into ER membrane(GO:0045048) |
| 0.4 | 4.5 | GO:0085020 | protein K6-linked ubiquitination(GO:0085020) |
| 0.4 | 3.4 | GO:0048478 | replication fork protection(GO:0048478) |
| 0.4 | 3.8 | GO:0060613 | fat pad development(GO:0060613) |
| 0.4 | 1.5 | GO:0060024 | rhythmic synaptic transmission(GO:0060024) |
| 0.4 | 2.6 | GO:2001033 | negative regulation of double-strand break repair via nonhomologous end joining(GO:2001033) |
| 0.4 | 1.9 | GO:0006167 | AMP biosynthetic process(GO:0006167) |
| 0.4 | 3.0 | GO:0033313 | meiotic cell cycle checkpoint(GO:0033313) |
| 0.4 | 0.4 | GO:1902065 | response to L-glutamate(GO:1902065) |
| 0.4 | 0.7 | GO:0002424 | T cell mediated immune response to tumor cell(GO:0002424) regulation of T cell mediated immune response to tumor cell(GO:0002840) |
| 0.4 | 1.1 | GO:0035445 | borate transmembrane transport(GO:0035445) borate transport(GO:0046713) |
| 0.4 | 2.2 | GO:0098838 | reduced folate transmembrane transport(GO:0098838) |
| 0.4 | 1.1 | GO:1904692 | positive regulation of type B pancreatic cell proliferation(GO:1904692) |
| 0.4 | 1.8 | GO:0006788 | heme oxidation(GO:0006788) |
| 0.4 | 1.1 | GO:0014813 | skeletal muscle satellite cell commitment(GO:0014813) |
| 0.4 | 1.1 | GO:0099526 | presynaptic signal transduction(GO:0098928) presynapse to nucleus signaling pathway(GO:0099526) |
| 0.4 | 1.1 | GO:0006391 | transcription initiation from mitochondrial promoter(GO:0006391) |
| 0.4 | 0.4 | GO:1904884 | telomerase catalytic core complex assembly(GO:1904868) regulation of telomerase catalytic core complex assembly(GO:1904882) positive regulation of telomerase catalytic core complex assembly(GO:1904884) |
| 0.4 | 1.1 | GO:1902771 | regulation of choline O-acetyltransferase activity(GO:1902769) positive regulation of choline O-acetyltransferase activity(GO:1902771) negative regulation of tau-protein kinase activity(GO:1902948) positive regulation of early endosome to recycling endosome transport(GO:1902955) negative regulation of aspartic-type endopeptidase activity involved in amyloid precursor protein catabolic process(GO:1902960) negative regulation of neurofibrillary tangle assembly(GO:1902997) negative regulation of aspartic-type peptidase activity(GO:1905246) |
| 0.4 | 1.5 | GO:0006084 | acetyl-CoA metabolic process(GO:0006084) |
| 0.4 | 1.4 | GO:2000781 | positive regulation of double-strand break repair(GO:2000781) |
| 0.4 | 0.4 | GO:0070318 | positive regulation of G0 to G1 transition(GO:0070318) |
| 0.4 | 1.1 | GO:0018312 | peptidyl-serine ADP-ribosylation(GO:0018312) |
| 0.4 | 1.4 | GO:0010873 | positive regulation of cholesterol esterification(GO:0010873) |
| 0.4 | 1.8 | GO:0035627 | ceramide transport(GO:0035627) |
| 0.4 | 1.8 | GO:0038163 | thrombopoietin-mediated signaling pathway(GO:0038163) |
| 0.4 | 1.4 | GO:0072233 | thick ascending limb development(GO:0072023) metanephric thick ascending limb development(GO:0072233) |
| 0.4 | 1.1 | GO:1901291 | negative regulation of double-strand break repair via single-strand annealing(GO:1901291) |
| 0.4 | 1.1 | GO:0090222 | centrosome-templated microtubule nucleation(GO:0090222) |
| 0.4 | 2.5 | GO:1900060 | negative regulation of sphingolipid biosynthetic process(GO:0090155) negative regulation of ceramide biosynthetic process(GO:1900060) |
| 0.4 | 0.7 | GO:0006447 | regulation of translational initiation by iron(GO:0006447) |
| 0.4 | 7.8 | GO:0036158 | outer dynein arm assembly(GO:0036158) |
| 0.4 | 1.1 | GO:0060151 | peroxisome localization(GO:0060151) microtubule-based peroxisome localization(GO:0060152) |
| 0.4 | 6.7 | GO:0007141 | male meiosis I(GO:0007141) |
| 0.4 | 1.1 | GO:1904386 | response to thyroxine(GO:0097068) response to L-phenylalanine derivative(GO:1904386) |
| 0.3 | 1.4 | GO:0051413 | response to cortisone(GO:0051413) |
| 0.3 | 4.5 | GO:0018095 | protein polyglutamylation(GO:0018095) |
| 0.3 | 1.4 | GO:1904782 | negative regulation of glutamate receptor signaling pathway(GO:1900450) negative regulation of NMDA glutamate receptor activity(GO:1904782) |
| 0.3 | 1.0 | GO:0006407 | rRNA export from nucleus(GO:0006407) |
| 0.3 | 1.0 | GO:0060903 | positive regulation of meiosis I(GO:0060903) |
| 0.3 | 1.0 | GO:0035262 | gonad morphogenesis(GO:0035262) |
| 0.3 | 1.0 | GO:0050955 | thermoception(GO:0050955) |
| 0.3 | 0.7 | GO:0006258 | UDP-glucose catabolic process(GO:0006258) |
| 0.3 | 1.0 | GO:0043951 | negative regulation of cAMP-mediated signaling(GO:0043951) |
| 0.3 | 1.4 | GO:0014040 | positive regulation of Schwann cell differentiation(GO:0014040) |
| 0.3 | 1.0 | GO:1904502 | lipophagy(GO:0061724) regulation of lipophagy(GO:1904502) positive regulation of lipophagy(GO:1904504) |
| 0.3 | 0.7 | GO:0090234 | regulation of kinetochore assembly(GO:0090234) |
| 0.3 | 1.7 | GO:0031990 | mRNA export from nucleus in response to heat stress(GO:0031990) |
| 0.3 | 1.0 | GO:0038162 | erythropoietin-mediated signaling pathway(GO:0038162) |
| 0.3 | 3.0 | GO:0042997 | negative regulation of Golgi to plasma membrane protein transport(GO:0042997) |
| 0.3 | 0.7 | GO:0030718 | germ-line stem cell population maintenance(GO:0030718) |
| 0.3 | 1.0 | GO:0061485 | memory T cell proliferation(GO:0061485) |
| 0.3 | 1.7 | GO:0006526 | arginine biosynthetic process(GO:0006526) |
| 0.3 | 2.6 | GO:0019236 | response to pheromone(GO:0019236) |
| 0.3 | 6.3 | GO:0034498 | early endosome to Golgi transport(GO:0034498) |
| 0.3 | 1.0 | GO:0097477 | lateral motor column neuron migration(GO:0097477) |
| 0.3 | 3.3 | GO:0035095 | behavioral response to nicotine(GO:0035095) |
| 0.3 | 0.3 | GO:0045200 | establishment or maintenance of neuroblast polarity(GO:0045196) establishment of neuroblast polarity(GO:0045200) |
| 0.3 | 2.0 | GO:0044752 | response to human chorionic gonadotropin(GO:0044752) |
| 0.3 | 4.9 | GO:0015810 | aspartate transport(GO:0015810) |
| 0.3 | 1.3 | GO:0006740 | NADPH regeneration(GO:0006740) |
| 0.3 | 0.6 | GO:0005985 | sucrose metabolic process(GO:0005985) |
| 0.3 | 1.6 | GO:0031284 | positive regulation of guanylate cyclase activity(GO:0031284) |
| 0.3 | 1.0 | GO:0003365 | establishment of cell polarity involved in ameboidal cell migration(GO:0003365) |
| 0.3 | 6.4 | GO:0010510 | regulation of acetyl-CoA biosynthetic process from pyruvate(GO:0010510) |
| 0.3 | 0.6 | GO:0034501 | protein localization to kinetochore(GO:0034501) |
| 0.3 | 1.6 | GO:0045607 | regulation of auditory receptor cell differentiation(GO:0045607) regulation of mechanoreceptor differentiation(GO:0045631) regulation of inner ear receptor cell differentiation(GO:2000980) |
| 0.3 | 0.6 | GO:0032900 | negative regulation of neurotrophin production(GO:0032900) |
| 0.3 | 0.6 | GO:0006537 | glutamate biosynthetic process(GO:0006537) |
| 0.3 | 1.0 | GO:0036388 | pre-replicative complex assembly involved in nuclear cell cycle DNA replication(GO:0006267) pre-replicative complex assembly(GO:0036388) pre-replicative complex assembly involved in cell cycle DNA replication(GO:1902299) |
| 0.3 | 2.9 | GO:1902231 | positive regulation of intrinsic apoptotic signaling pathway in response to DNA damage(GO:1902231) |
| 0.3 | 2.5 | GO:0032483 | regulation of Rab protein signal transduction(GO:0032483) |
| 0.3 | 0.3 | GO:0016078 | tRNA catabolic process(GO:0016078) |
| 0.3 | 1.6 | GO:0007538 | primary sex determination(GO:0007538) |
| 0.3 | 1.0 | GO:0002380 | immunoglobulin secretion involved in immune response(GO:0002380) |
| 0.3 | 1.3 | GO:1904980 | positive regulation of endosome organization(GO:1904980) |
| 0.3 | 1.3 | GO:0010430 | fatty acid omega-oxidation(GO:0010430) |
| 0.3 | 4.1 | GO:0060075 | regulation of resting membrane potential(GO:0060075) |
| 0.3 | 2.5 | GO:0006489 | dolichyl diphosphate biosynthetic process(GO:0006489) dolichyl diphosphate metabolic process(GO:0046465) |
| 0.3 | 1.9 | GO:2001270 | regulation of cysteine-type endopeptidase activity involved in execution phase of apoptosis(GO:2001270) |
| 0.3 | 2.8 | GO:0006398 | mRNA 3'-end processing by stem-loop binding and cleavage(GO:0006398) |
| 0.3 | 0.6 | GO:0007352 | zygotic specification of dorsal/ventral axis(GO:0007352) |
| 0.3 | 2.8 | GO:1904779 | regulation of protein localization to centrosome(GO:1904779) |
| 0.3 | 0.9 | GO:0002949 | tRNA threonylcarbamoyladenosine modification(GO:0002949) |
| 0.3 | 5.3 | GO:0000290 | deadenylation-dependent decapping of nuclear-transcribed mRNA(GO:0000290) |
| 0.3 | 1.5 | GO:0032380 | regulation of intracellular lipid transport(GO:0032377) regulation of intracellular sterol transport(GO:0032380) regulation of intracellular cholesterol transport(GO:0032383) |
| 0.3 | 1.9 | GO:0036155 | acylglycerol acyl-chain remodeling(GO:0036155) |
| 0.3 | 0.9 | GO:0006344 | maintenance of chromatin silencing(GO:0006344) |
| 0.3 | 0.9 | GO:0060392 | negative regulation of SMAD protein import into nucleus(GO:0060392) |
| 0.3 | 3.1 | GO:0000447 | endonucleolytic cleavage in ITS1 to separate SSU-rRNA from 5.8S rRNA and LSU-rRNA from tricistronic rRNA transcript (SSU-rRNA, 5.8S rRNA, LSU-rRNA)(GO:0000447) |
| 0.3 | 0.9 | GO:0035565 | regulation of pronephros size(GO:0035565) |
| 0.3 | 7.6 | GO:0036315 | cellular response to sterol(GO:0036315) |
| 0.3 | 1.5 | GO:0070933 | histone H4 deacetylation(GO:0070933) |
| 0.3 | 0.9 | GO:1900135 | positive regulation of renin secretion into blood stream(GO:1900135) |
| 0.3 | 2.4 | GO:1900383 | regulation of synaptic plasticity by receptor localization to synapse(GO:1900383) |
| 0.3 | 0.6 | GO:0044828 | negative regulation by host of viral genome replication(GO:0044828) |
| 0.3 | 5.2 | GO:0021842 | directional guidance of interneurons involved in migration from the subpallium to the cortex(GO:0021840) chemorepulsion involved in interneuron migration from the subpallium to the cortex(GO:0021842) |
| 0.3 | 1.5 | GO:0032747 | positive regulation of interleukin-23 production(GO:0032747) |
| 0.3 | 1.2 | GO:0051230 | mitotic spindle disassembly(GO:0051228) spindle disassembly(GO:0051230) |
| 0.3 | 0.3 | GO:0060268 | negative regulation of respiratory burst(GO:0060268) |
| 0.3 | 3.9 | GO:0000076 | DNA replication checkpoint(GO:0000076) |
| 0.3 | 3.3 | GO:0006552 | leucine catabolic process(GO:0006552) |
| 0.3 | 0.9 | GO:0046005 | positive regulation of circadian sleep/wake cycle, REM sleep(GO:0046005) |
| 0.3 | 0.3 | GO:1903862 | positive regulation of oxidative phosphorylation(GO:1903862) |
| 0.3 | 2.1 | GO:0034316 | negative regulation of Arp2/3 complex-mediated actin nucleation(GO:0034316) |
| 0.3 | 1.5 | GO:0070253 | somatostatin secretion(GO:0070253) |
| 0.3 | 4.5 | GO:0007023 | post-chaperonin tubulin folding pathway(GO:0007023) |
| 0.3 | 1.2 | GO:2000255 | negative regulation of male germ cell proliferation(GO:2000255) |
| 0.3 | 0.6 | GO:0060136 | embryonic process involved in female pregnancy(GO:0060136) |
| 0.3 | 2.1 | GO:0019344 | cysteine biosynthetic process(GO:0019344) |
| 0.3 | 0.9 | GO:0036135 | Schwann cell migration(GO:0036135) regulation of Schwann cell migration(GO:1900147) |
| 0.3 | 0.6 | GO:0000730 | DNA recombinase assembly(GO:0000730) double-strand break repair via synthesis-dependent strand annealing(GO:0045003) |
| 0.3 | 2.9 | GO:0051573 | negative regulation of histone H3-K9 methylation(GO:0051573) |
| 0.3 | 1.2 | GO:0038018 | Wnt receptor catabolic process(GO:0038018) |
| 0.3 | 2.3 | GO:0036123 | histone H3-K9 dimethylation(GO:0036123) |
| 0.3 | 1.4 | GO:0009197 | dUDP biosynthetic process(GO:0006227) dTDP biosynthetic process(GO:0006233) pyrimidine nucleoside diphosphate metabolic process(GO:0009138) pyrimidine nucleoside diphosphate biosynthetic process(GO:0009139) pyrimidine deoxyribonucleoside diphosphate metabolic process(GO:0009196) pyrimidine deoxyribonucleoside diphosphate biosynthetic process(GO:0009197) dTDP metabolic process(GO:0046072) dUDP metabolic process(GO:0046077) |
| 0.3 | 0.3 | GO:0014873 | response to muscle activity involved in regulation of muscle adaptation(GO:0014873) |
| 0.3 | 1.4 | GO:0000050 | urea cycle(GO:0000050) |
| 0.3 | 1.7 | GO:0006772 | thiamine metabolic process(GO:0006772) |
| 0.3 | 1.4 | GO:1902626 | assembly of large subunit precursor of preribosome(GO:1902626) |
| 0.3 | 0.9 | GO:0090176 | microtubule cytoskeleton organization involved in establishment of planar polarity(GO:0090176) |
| 0.3 | 0.6 | GO:1903438 | regulation of cytokinetic process(GO:0032954) regulation of mitotic cytokinetic process(GO:1903436) positive regulation of mitotic cytokinetic process(GO:1903438) positive regulation of mitotic cytokinesis(GO:1903490) |
| 0.3 | 2.0 | GO:0045819 | positive regulation of glycogen catabolic process(GO:0045819) |
| 0.3 | 2.6 | GO:0042747 | circadian sleep/wake cycle, REM sleep(GO:0042747) |
| 0.3 | 4.6 | GO:0070934 | CRD-mediated mRNA stabilization(GO:0070934) |
| 0.3 | 3.4 | GO:0018401 | peptidyl-proline hydroxylation to 4-hydroxy-L-proline(GO:0018401) |
| 0.3 | 2.6 | GO:0006189 | 'de novo' IMP biosynthetic process(GO:0006189) |
| 0.3 | 1.1 | GO:0007089 | traversing start control point of mitotic cell cycle(GO:0007089) |
| 0.3 | 2.3 | GO:2000382 | positive regulation of mesoderm development(GO:2000382) |
| 0.3 | 1.4 | GO:0048388 | endosomal lumen acidification(GO:0048388) |
| 0.3 | 1.4 | GO:0009298 | GDP-mannose biosynthetic process(GO:0009298) |
| 0.3 | 1.1 | GO:1901421 | positive regulation of response to alcohol(GO:1901421) |
| 0.3 | 6.3 | GO:0003351 | epithelial cilium movement(GO:0003351) |
| 0.3 | 1.4 | GO:0014050 | negative regulation of glutamate secretion(GO:0014050) |
| 0.3 | 0.8 | GO:0090403 | oxidative stress-induced premature senescence(GO:0090403) |
| 0.3 | 1.1 | GO:0036269 | swimming behavior(GO:0036269) |
| 0.3 | 1.1 | GO:0035283 | rhombomere 5 development(GO:0021571) central nervous system segmentation(GO:0035283) brain segmentation(GO:0035284) |
| 0.3 | 1.4 | GO:0002357 | defense response to tumor cell(GO:0002357) |
| 0.3 | 3.7 | GO:0000733 | DNA strand renaturation(GO:0000733) |
| 0.3 | 1.1 | GO:0009448 | gamma-aminobutyric acid metabolic process(GO:0009448) |
| 0.3 | 2.3 | GO:1902019 | regulation of cilium movement involved in cell motility(GO:0060295) regulation of cilium beat frequency involved in ciliary motility(GO:0060296) regulation of cilium-dependent cell motility(GO:1902019) |
| 0.3 | 0.3 | GO:0060309 | elastin catabolic process(GO:0060309) |
| 0.3 | 2.8 | GO:0034773 | histone H4-K20 trimethylation(GO:0034773) |
| 0.3 | 0.8 | GO:0015847 | putrescine transport(GO:0015847) |
| 0.3 | 3.0 | GO:0031936 | negative regulation of chromatin silencing(GO:0031936) |
| 0.3 | 1.4 | GO:0070213 | protein auto-ADP-ribosylation(GO:0070213) |
| 0.3 | 0.8 | GO:0048867 | stem cell fate determination(GO:0048867) |
| 0.3 | 0.6 | GO:0070634 | transepithelial ammonium transport(GO:0070634) |
| 0.3 | 1.9 | GO:0033277 | abortive mitotic cell cycle(GO:0033277) |
| 0.3 | 4.6 | GO:0042407 | cristae formation(GO:0042407) |
| 0.3 | 1.4 | GO:0060599 | lateral sprouting involved in mammary gland duct morphogenesis(GO:0060599) |
| 0.3 | 1.6 | GO:0097052 | L-kynurenine metabolic process(GO:0097052) |
| 0.3 | 3.5 | GO:0051988 | regulation of attachment of spindle microtubules to kinetochore(GO:0051988) |
| 0.3 | 5.2 | GO:0015812 | gamma-aminobutyric acid transport(GO:0015812) |
| 0.3 | 0.3 | GO:0072520 | seminiferous tubule development(GO:0072520) |
| 0.3 | 0.3 | GO:0051436 | negative regulation of ubiquitin-protein ligase activity involved in mitotic cell cycle(GO:0051436) regulation of ubiquitin-protein ligase activity involved in mitotic cell cycle(GO:0051439) |
| 0.3 | 0.8 | GO:0071626 | mastication(GO:0071626) learned vocalization behavior(GO:0098583) |
| 0.3 | 0.8 | GO:0006311 | meiotic gene conversion(GO:0006311) |
| 0.3 | 0.8 | GO:0045556 | TRAIL biosynthetic process(GO:0045553) regulation of TRAIL biosynthetic process(GO:0045554) positive regulation of TRAIL biosynthetic process(GO:0045556) |
| 0.3 | 1.4 | GO:0021551 | central nervous system morphogenesis(GO:0021551) cardiac muscle tissue regeneration(GO:0061026) |
| 0.3 | 3.0 | GO:0018344 | protein geranylgeranylation(GO:0018344) |
| 0.3 | 0.8 | GO:0031508 | pericentric heterochromatin assembly(GO:0031508) |
| 0.3 | 0.3 | GO:0006561 | proline biosynthetic process(GO:0006561) |
| 0.3 | 1.6 | GO:0090181 | regulation of cholesterol metabolic process(GO:0090181) |
| 0.3 | 1.1 | GO:1901675 | response to methylglyoxal(GO:0051595) negative regulation of histone H3-K27 acetylation(GO:1901675) |
| 0.3 | 3.0 | GO:1902897 | regulation of postsynaptic density protein 95 clustering(GO:1902897) |
| 0.3 | 1.9 | GO:0031161 | phosphatidylinositol catabolic process(GO:0031161) |
| 0.3 | 0.5 | GO:1990426 | homologous recombination-dependent replication fork processing(GO:1990426) |
| 0.3 | 1.1 | GO:0006272 | leading strand elongation(GO:0006272) |
| 0.3 | 0.3 | GO:2001140 | regulation of phospholipid transport(GO:2001138) positive regulation of phospholipid transport(GO:2001140) |
| 0.3 | 0.8 | GO:0060302 | negative regulation of cytokine activity(GO:0060302) |
| 0.3 | 4.2 | GO:0070286 | axonemal dynein complex assembly(GO:0070286) |
| 0.3 | 1.1 | GO:0036314 | response to sterol(GO:0036314) |
| 0.3 | 3.4 | GO:0006384 | transcription initiation from RNA polymerase III promoter(GO:0006384) |
| 0.3 | 0.3 | GO:0071372 | cellular response to follicle-stimulating hormone stimulus(GO:0071372) |
| 0.3 | 2.6 | GO:0006348 | chromatin silencing at telomere(GO:0006348) |
| 0.3 | 1.6 | GO:0072553 | terminal button organization(GO:0072553) |
| 0.3 | 1.6 | GO:0050747 | positive regulation of lipoprotein metabolic process(GO:0050747) |
| 0.3 | 1.0 | GO:1903281 | positive regulation of calcium:sodium antiporter activity(GO:1903281) |
| 0.3 | 6.0 | GO:0035090 | maintenance of apical/basal cell polarity(GO:0035090) maintenance of epithelial cell apical/basal polarity(GO:0045199) |
| 0.3 | 0.8 | GO:0070314 | G1 to G0 transition(GO:0070314) |
| 0.3 | 1.0 | GO:0002636 | positive regulation of germinal center formation(GO:0002636) |
| 0.3 | 1.3 | GO:0019413 | acetate metabolic process(GO:0006083) acetate biosynthetic process(GO:0019413) acetyl-CoA biosynthetic process from acetate(GO:0019427) propionate biosynthetic process(GO:0019542) |
| 0.3 | 1.6 | GO:0030037 | actin filament reorganization involved in cell cycle(GO:0030037) |
| 0.3 | 1.3 | GO:1904398 | positive regulation of neuromuscular junction development(GO:1904398) |
| 0.3 | 1.0 | GO:0044537 | regulation of circulating fibrinogen levels(GO:0044537) |
| 0.3 | 0.3 | GO:0031054 | pre-miRNA processing(GO:0031054) |
| 0.3 | 1.6 | GO:0015783 | GDP-fucose transport(GO:0015783) purine nucleotide-sugar transport(GO:0036079) |
| 0.3 | 2.1 | GO:0042271 | susceptibility to natural killer cell mediated cytotoxicity(GO:0042271) |
| 0.3 | 2.1 | GO:0030309 | poly-N-acetyllactosamine metabolic process(GO:0030309) |
| 0.3 | 3.6 | GO:0006307 | DNA dealkylation involved in DNA repair(GO:0006307) |
| 0.3 | 4.9 | GO:0021516 | dorsal spinal cord development(GO:0021516) |
| 0.3 | 2.8 | GO:0016926 | protein desumoylation(GO:0016926) |
| 0.3 | 4.1 | GO:0048672 | positive regulation of collateral sprouting(GO:0048672) |
| 0.3 | 4.3 | GO:0070166 | enamel mineralization(GO:0070166) |
| 0.3 | 0.8 | GO:1903259 | exon-exon junction complex disassembly(GO:1903259) |
| 0.3 | 1.0 | GO:0009106 | lipoate metabolic process(GO:0009106) lipoate biosynthetic process(GO:0009107) |
| 0.3 | 1.5 | GO:1905232 | cellular response to L-glutamate(GO:1905232) |
| 0.3 | 0.8 | GO:0000912 | assembly of actomyosin apparatus involved in cytokinesis(GO:0000912) actomyosin contractile ring assembly(GO:0000915) actomyosin contractile ring organization(GO:0044837) |
| 0.3 | 2.3 | GO:0070544 | histone H3-K36 demethylation(GO:0070544) |
| 0.3 | 3.3 | GO:0000972 | transcription-dependent tethering of RNA polymerase II gene DNA at nuclear periphery(GO:0000972) |
| 0.3 | 0.8 | GO:0048319 | axial mesoderm morphogenesis(GO:0048319) |
| 0.3 | 1.3 | GO:0051643 | endoplasmic reticulum localization(GO:0051643) |
| 0.2 | 2.0 | GO:1902847 | regulation of neuronal signal transduction(GO:1902847) positive regulation of neurofibrillary tangle assembly(GO:1902998) |
| 0.2 | 4.2 | GO:0010918 | positive regulation of mitochondrial membrane potential(GO:0010918) |
| 0.2 | 2.0 | GO:0061205 | alveolar primary septum development(GO:0061143) paramesonephric duct development(GO:0061205) |
| 0.2 | 4.0 | GO:0006488 | dolichol-linked oligosaccharide biosynthetic process(GO:0006488) |
| 0.2 | 2.7 | GO:0006265 | DNA topological change(GO:0006265) |
| 0.2 | 1.0 | GO:0039534 | negative regulation of MDA-5 signaling pathway(GO:0039534) |
| 0.2 | 4.2 | GO:0038203 | TORC2 signaling(GO:0038203) |
| 0.2 | 0.5 | GO:0002071 | glandular epithelial cell maturation(GO:0002071) |
| 0.2 | 0.5 | GO:0045355 | negative regulation of interferon-alpha biosynthetic process(GO:0045355) |
| 0.2 | 6.1 | GO:0048172 | regulation of short-term neuronal synaptic plasticity(GO:0048172) |
| 0.2 | 3.2 | GO:0035269 | protein O-linked mannosylation(GO:0035269) |
| 0.2 | 1.0 | GO:0006556 | S-adenosylmethionine biosynthetic process(GO:0006556) |
| 0.2 | 10.2 | GO:0071173 | spindle assembly checkpoint(GO:0071173) |
| 0.2 | 4.8 | GO:0014041 | regulation of neuron maturation(GO:0014041) |
| 0.2 | 0.2 | GO:0035519 | protein K29-linked ubiquitination(GO:0035519) |
| 0.2 | 1.4 | GO:0003431 | growth plate cartilage chondrocyte development(GO:0003431) |
| 0.2 | 0.7 | GO:0018125 | peptidyl-cysteine methylation(GO:0018125) |
| 0.2 | 2.2 | GO:0071257 | cellular response to electrical stimulus(GO:0071257) |
| 0.2 | 0.5 | GO:1903937 | response to acrylamide(GO:1903937) |
| 0.2 | 2.4 | GO:0061052 | negative regulation of cell growth involved in cardiac muscle cell development(GO:0061052) |
| 0.2 | 2.4 | GO:0038028 | insulin receptor signaling pathway via phosphatidylinositol 3-kinase(GO:0038028) |
| 0.2 | 3.3 | GO:0051152 | positive regulation of smooth muscle cell differentiation(GO:0051152) |
| 0.2 | 0.5 | GO:0000961 | negative regulation of mitochondrial RNA catabolic process(GO:0000961) |
| 0.2 | 0.7 | GO:1903691 | positive regulation of wound healing, spreading of epidermal cells(GO:1903691) |
| 0.2 | 1.7 | GO:0000430 | regulation of transcription from RNA polymerase II promoter by glucose(GO:0000430) positive regulation of transcription from RNA polymerase II promoter by glucose(GO:0000432) |
| 0.2 | 17.3 | GO:0018279 | protein N-linked glycosylation via asparagine(GO:0018279) |
| 0.2 | 3.6 | GO:1990144 | intrinsic apoptotic signaling pathway in response to hypoxia(GO:1990144) |
| 0.2 | 0.5 | GO:0034205 | beta-amyloid formation(GO:0034205) |
| 0.2 | 0.7 | GO:1904562 | phosphatidylinositol 5-phosphate metabolic process(GO:1904562) |
| 0.2 | 1.9 | GO:0090649 | response to oxygen-glucose deprivation(GO:0090649) cellular response to oxygen-glucose deprivation(GO:0090650) |
| 0.2 | 1.6 | GO:0097428 | protein maturation by iron-sulfur cluster transfer(GO:0097428) |
| 0.2 | 0.7 | GO:0060139 | positive regulation by symbiont of host apoptotic process(GO:0052151) positive regulation of apoptotic process by virus(GO:0060139) |
| 0.2 | 5.9 | GO:0009083 | branched-chain amino acid catabolic process(GO:0009083) |
| 0.2 | 1.2 | GO:0072709 | cellular response to sorbitol(GO:0072709) |
| 0.2 | 0.5 | GO:0003310 | pancreatic A cell differentiation(GO:0003310) |
| 0.2 | 0.5 | GO:0036309 | protein localization to M-band(GO:0036309) |
| 0.2 | 1.6 | GO:0000727 | double-strand break repair via break-induced replication(GO:0000727) |
| 0.2 | 0.7 | GO:0006269 | DNA replication, synthesis of RNA primer(GO:0006269) |
| 0.2 | 2.8 | GO:0015780 | nucleotide-sugar transport(GO:0015780) |
| 0.2 | 1.6 | GO:0071104 | response to interleukin-9(GO:0071104) |
| 0.2 | 0.2 | GO:0072434 | signal transduction involved in G2 DNA damage checkpoint(GO:0072425) signal transduction involved in mitotic G2 DNA damage checkpoint(GO:0072434) |
| 0.2 | 2.1 | GO:0015760 | hexose phosphate transport(GO:0015712) glucose-6-phosphate transport(GO:0015760) |
| 0.2 | 0.9 | GO:0070417 | cellular response to cold(GO:0070417) |
| 0.2 | 5.8 | GO:0007250 | activation of NF-kappaB-inducing kinase activity(GO:0007250) |
| 0.2 | 2.8 | GO:0038003 | opioid receptor signaling pathway(GO:0038003) |
| 0.2 | 0.7 | GO:0038193 | thromboxane A2 signaling pathway(GO:0038193) |
| 0.2 | 0.2 | GO:1990009 | retinal cell apoptotic process(GO:1990009) |
| 0.2 | 1.1 | GO:0048148 | behavioral response to cocaine(GO:0048148) |
| 0.2 | 0.9 | GO:0071921 | establishment of sister chromatid cohesion(GO:0034085) cohesin loading(GO:0071921) regulation of cohesin loading(GO:0071922) |
| 0.2 | 1.6 | GO:0043461 | proton-transporting ATP synthase complex assembly(GO:0043461) proton-transporting ATP synthase complex biogenesis(GO:0070272) |
| 0.2 | 0.5 | GO:0072429 | response to intra-S DNA damage checkpoint signaling(GO:0072429) |
| 0.2 | 0.7 | GO:0042727 | flavin-containing compound biosynthetic process(GO:0042727) |
| 0.2 | 1.4 | GO:0090212 | negative regulation of establishment of blood-brain barrier(GO:0090212) |
| 0.2 | 1.8 | GO:0051918 | negative regulation of fibrinolysis(GO:0051918) |
| 0.2 | 0.4 | GO:1904017 | cellular response to Thyroglobulin triiodothyronine(GO:1904017) |
| 0.2 | 2.2 | GO:0034723 | DNA replication-dependent nucleosome assembly(GO:0006335) DNA replication-dependent nucleosome organization(GO:0034723) |
| 0.2 | 1.1 | GO:0034201 | response to oleic acid(GO:0034201) |
| 0.2 | 0.7 | GO:0071264 | regulation of eIF2 alpha phosphorylation by amino acid starvation(GO:0060733) regulation of translational initiation in response to starvation(GO:0071262) positive regulation of translational initiation in response to starvation(GO:0071264) |
| 0.2 | 0.2 | GO:0036515 | serotonergic neuron axon guidance(GO:0036515) |
| 0.2 | 0.7 | GO:0055089 | fatty acid homeostasis(GO:0055089) |
| 0.2 | 3.3 | GO:0048312 | intracellular distribution of mitochondria(GO:0048312) |
| 0.2 | 0.4 | GO:0006577 | amino-acid betaine metabolic process(GO:0006577) |
| 0.2 | 1.5 | GO:0051697 | protein delipidation(GO:0051697) |
| 0.2 | 0.7 | GO:0006463 | steroid hormone receptor complex assembly(GO:0006463) |
| 0.2 | 0.4 | GO:0002625 | regulation of T cell antigen processing and presentation(GO:0002625) |
| 0.2 | 0.7 | GO:0098507 | polynucleotide 5' dephosphorylation(GO:0098507) |
| 0.2 | 1.5 | GO:0070914 | UV-damage excision repair(GO:0070914) |
| 0.2 | 1.5 | GO:0070537 | histone H2A K63-linked deubiquitination(GO:0070537) |
| 0.2 | 0.7 | GO:0098971 | anterograde dendritic transport of neurotransmitter receptor complex(GO:0098971) |
| 0.2 | 3.2 | GO:0097116 | gephyrin clustering involved in postsynaptic density assembly(GO:0097116) |
| 0.2 | 0.9 | GO:0040040 | thermosensory behavior(GO:0040040) |
| 0.2 | 0.6 | GO:0045956 | positive regulation of calcium ion-dependent exocytosis(GO:0045956) |
| 0.2 | 0.6 | GO:0071661 | granzyme B production(GO:0071613) regulation of granzyme B production(GO:0071661) positive regulation of granzyme B production(GO:0071663) |
| 0.2 | 1.1 | GO:0038169 | somatostatin receptor signaling pathway(GO:0038169) somatostatin signaling pathway(GO:0038170) |
| 0.2 | 0.6 | GO:0036451 | cap mRNA methylation(GO:0036451) |
| 0.2 | 0.9 | GO:0070681 | glutaminyl-tRNAGln biosynthesis via transamidation(GO:0070681) |
| 0.2 | 2.8 | GO:0007196 | adenylate cyclase-inhibiting G-protein coupled glutamate receptor signaling pathway(GO:0007196) |
| 0.2 | 1.1 | GO:0019626 | short-chain fatty acid catabolic process(GO:0019626) |
| 0.2 | 2.8 | GO:0035881 | amacrine cell differentiation(GO:0035881) |
| 0.2 | 0.2 | GO:0035915 | pore formation in membrane of other organism(GO:0035915) |
| 0.2 | 1.9 | GO:0007506 | gonadal mesoderm development(GO:0007506) |
| 0.2 | 15.2 | GO:0042073 | intraciliary transport(GO:0042073) |
| 0.2 | 1.9 | GO:0061624 | fructose catabolic process(GO:0006001) fructose catabolic process to hydroxyacetone phosphate and glyceraldehyde-3-phosphate(GO:0061624) |
| 0.2 | 0.4 | GO:0039019 | pronephric nephron development(GO:0039019) |
| 0.2 | 1.7 | GO:0061002 | negative regulation of dendritic spine morphogenesis(GO:0061002) |
| 0.2 | 1.2 | GO:1901097 | negative regulation of autophagosome maturation(GO:1901097) |
| 0.2 | 0.6 | GO:0006768 | biotin metabolic process(GO:0006768) |
| 0.2 | 1.0 | GO:0060573 | ventral spinal cord interneuron specification(GO:0021521) cell fate specification involved in pattern specification(GO:0060573) |
| 0.2 | 0.8 | GO:1900738 | positive regulation of phospholipase C-activating G-protein coupled receptor signaling pathway(GO:1900738) |
| 0.2 | 28.9 | GO:0007286 | spermatid development(GO:0007286) |
| 0.2 | 2.1 | GO:0032927 | positive regulation of activin receptor signaling pathway(GO:0032927) |
| 0.2 | 0.8 | GO:0045915 | positive regulation of catecholamine metabolic process(GO:0045915) positive regulation of dopamine metabolic process(GO:0045964) |
| 0.2 | 0.6 | GO:0010730 | negative regulation of hydrogen peroxide biosynthetic process(GO:0010730) |
| 0.2 | 2.3 | GO:0035666 | TRIF-dependent toll-like receptor signaling pathway(GO:0035666) |
| 0.2 | 2.2 | GO:0032782 | bile acid secretion(GO:0032782) |
| 0.2 | 0.8 | GO:0071110 | protein biotinylation(GO:0009305) response to biotin(GO:0070781) histone biotinylation(GO:0071110) |
| 0.2 | 0.8 | GO:0060478 | acrosomal vesicle exocytosis(GO:0060478) |
| 0.2 | 0.2 | GO:0051958 | methotrexate transport(GO:0051958) |
| 0.2 | 9.3 | GO:0006270 | DNA replication initiation(GO:0006270) |
| 0.2 | 1.8 | GO:0000395 | mRNA 5'-splice site recognition(GO:0000395) |
| 0.2 | 0.8 | GO:0044339 | canonical Wnt signaling pathway involved in osteoblast differentiation(GO:0044339) |
| 0.2 | 4.6 | GO:0060736 | prostate gland growth(GO:0060736) |
| 0.2 | 1.6 | GO:1904885 | beta-catenin destruction complex assembly(GO:1904885) |
| 0.2 | 0.6 | GO:0032049 | cardiolipin biosynthetic process(GO:0032049) |
| 0.2 | 3.4 | GO:1900029 | positive regulation of ruffle assembly(GO:1900029) |
| 0.2 | 0.4 | GO:0086018 | SA node cell action potential(GO:0086015) SA node cell to atrial cardiac muscle cell signalling(GO:0086018) |
| 0.2 | 0.4 | GO:1903593 | regulation of histamine secretion by mast cell(GO:1903593) |
| 0.2 | 1.6 | GO:0032185 | septin cytoskeleton organization(GO:0032185) |
| 0.2 | 6.6 | GO:0021522 | spinal cord motor neuron differentiation(GO:0021522) |
| 0.2 | 0.8 | GO:0072367 | regulation of lipid transport by regulation of transcription from RNA polymerase II promoter(GO:0072367) |
| 0.2 | 5.4 | GO:0016578 | histone deubiquitination(GO:0016578) |
| 0.2 | 3.8 | GO:0006555 | methionine metabolic process(GO:0006555) |
| 0.2 | 1.0 | GO:0072719 | cellular response to cisplatin(GO:0072719) |
| 0.2 | 1.2 | GO:0032261 | purine nucleotide salvage(GO:0032261) IMP salvage(GO:0032264) |
| 0.2 | 1.8 | GO:0006591 | ornithine metabolic process(GO:0006591) |
| 0.2 | 0.6 | GO:0048633 | positive regulation of skeletal muscle tissue growth(GO:0048633) |
| 0.2 | 0.4 | GO:0032242 | regulation of nucleoside transport(GO:0032242) |
| 0.2 | 1.2 | GO:0035268 | protein mannosylation(GO:0035268) |
| 0.2 | 0.6 | GO:0033563 | dorsal/ventral axon guidance(GO:0033563) |
| 0.2 | 1.8 | GO:0010533 | regulation of activation of Janus kinase activity(GO:0010533) |
| 0.2 | 0.6 | GO:0060023 | soft palate development(GO:0060023) |
| 0.2 | 3.9 | GO:0006346 | methylation-dependent chromatin silencing(GO:0006346) |
| 0.2 | 5.8 | GO:0071294 | cellular response to zinc ion(GO:0071294) |
| 0.2 | 2.1 | GO:1990034 | calcium ion export from cell(GO:1990034) |
| 0.2 | 0.4 | GO:2000742 | anterior head development(GO:0097065) regulation of anterior head development(GO:2000742) positive regulation of anterior head development(GO:2000744) |
| 0.2 | 0.2 | GO:0051934 | dopamine uptake involved in synaptic transmission(GO:0051583) catecholamine uptake involved in synaptic transmission(GO:0051934) catecholamine uptake(GO:0090493) dopamine uptake(GO:0090494) |
| 0.2 | 3.3 | GO:0006450 | regulation of translational fidelity(GO:0006450) |
| 0.2 | 1.0 | GO:2000312 | regulation of kainate selective glutamate receptor activity(GO:2000312) |
| 0.2 | 0.4 | GO:0046222 | mycotoxin metabolic process(GO:0043385) aflatoxin metabolic process(GO:0046222) organic heteropentacyclic compound metabolic process(GO:1901376) |
| 0.2 | 1.1 | GO:1904217 | regulation of CDP-diacylglycerol-serine O-phosphatidyltransferase activity(GO:1904217) positive regulation of CDP-diacylglycerol-serine O-phosphatidyltransferase activity(GO:1904219) positive regulation of serine C-palmitoyltransferase activity(GO:1904222) |
| 0.2 | 0.2 | GO:0072034 | renal vesicle induction(GO:0072034) |
| 0.2 | 2.5 | GO:0007140 | male meiosis(GO:0007140) |
| 0.2 | 0.4 | GO:1904674 | positive regulation of somatic stem cell population maintenance(GO:1904674) |
| 0.2 | 1.1 | GO:1903377 | negative regulation of oxidative stress-induced neuron intrinsic apoptotic signaling pathway(GO:1903377) |
| 0.2 | 2.7 | GO:0035745 | T-helper 2 cell cytokine production(GO:0035745) |
| 0.2 | 1.9 | GO:0036109 | alpha-linolenic acid metabolic process(GO:0036109) |
| 0.2 | 1.5 | GO:0006116 | NADH oxidation(GO:0006116) |
| 0.2 | 0.6 | GO:0060382 | regulation of DNA strand elongation(GO:0060382) |
| 0.2 | 0.8 | GO:0019720 | Mo-molybdopterin cofactor biosynthetic process(GO:0006777) Mo-molybdopterin cofactor metabolic process(GO:0019720) |
| 0.2 | 0.9 | GO:0035948 | positive regulation of gluconeogenesis by positive regulation of transcription from RNA polymerase II promoter(GO:0035948) |
| 0.2 | 0.2 | GO:0060995 | cell-cell signaling involved in kidney development(GO:0060995) Wnt signaling pathway involved in kidney development(GO:0061289) canonical Wnt signaling pathway involved in metanephric kidney development(GO:0061290) cell-cell signaling involved in metanephros development(GO:0072204) |
| 0.2 | 5.6 | GO:0016180 | snRNA processing(GO:0016180) |
| 0.2 | 0.4 | GO:0097198 | histone H3-K36 trimethylation(GO:0097198) |
| 0.2 | 1.5 | GO:0021797 | forebrain anterior/posterior pattern specification(GO:0021797) |
| 0.2 | 1.5 | GO:0006544 | glycine metabolic process(GO:0006544) |
| 0.2 | 0.9 | GO:0000379 | tRNA-type intron splice site recognition and cleavage(GO:0000379) |
| 0.2 | 0.9 | GO:0034421 | post-translational protein acetylation(GO:0034421) |
| 0.2 | 0.9 | GO:0016240 | autophagosome docking(GO:0016240) |
| 0.2 | 0.6 | GO:0030505 | inorganic diphosphate transport(GO:0030505) |
| 0.2 | 0.2 | GO:0071421 | manganese ion transmembrane transport(GO:0071421) |
| 0.2 | 2.0 | GO:0006103 | 2-oxoglutarate metabolic process(GO:0006103) |
| 0.2 | 0.4 | GO:1902724 | positive regulation of skeletal muscle cell proliferation(GO:0014858) positive regulation of skeletal muscle satellite cell proliferation(GO:1902724) positive regulation of growth factor dependent skeletal muscle satellite cell proliferation(GO:1902728) |
| 0.2 | 0.6 | GO:0034970 | histone H3-R2 methylation(GO:0034970) |
| 0.2 | 0.4 | GO:1903758 | regulation of transcription from RNA polymerase II promoter by histone modification(GO:1903756) negative regulation of transcription from RNA polymerase II promoter by histone modification(GO:1903758) |
| 0.2 | 0.2 | GO:1902594 | viral penetration into host nucleus(GO:0075732) multi-organism nuclear import(GO:1902594) |
| 0.2 | 1.3 | GO:0045204 | MAPK export from nucleus(GO:0045204) |
| 0.2 | 1.5 | GO:0098881 | exocytic insertion of neurotransmitter receptor to plasma membrane(GO:0098881) exocytic insertion of neurotransmitter receptor to postsynaptic membrane(GO:0098967) |
| 0.2 | 0.5 | GO:0038171 | cannabinoid signaling pathway(GO:0038171) |
| 0.2 | 1.5 | GO:0034154 | toll-like receptor 7 signaling pathway(GO:0034154) |
| 0.2 | 1.6 | GO:0033564 | anterior/posterior axon guidance(GO:0033564) |
| 0.2 | 2.5 | GO:0098969 | neurotransmitter receptor transport to postsynaptic membrane(GO:0098969) establishment of protein localization to postsynaptic membrane(GO:1903540) |
| 0.2 | 2.0 | GO:0001561 | fatty acid alpha-oxidation(GO:0001561) |
| 0.2 | 0.7 | GO:0006404 | RNA import into nucleus(GO:0006404) snRNA import into nucleus(GO:0061015) |
| 0.2 | 2.7 | GO:0043248 | proteasome assembly(GO:0043248) |
| 0.2 | 3.4 | GO:0060022 | hard palate development(GO:0060022) |
| 0.2 | 1.3 | GO:0031507 | heterochromatin assembly(GO:0031507) |
| 0.2 | 0.5 | GO:0036289 | peptidyl-serine autophosphorylation(GO:0036289) |
| 0.2 | 4.1 | GO:0044804 | nucleophagy(GO:0044804) |
| 0.2 | 0.4 | GO:0090071 | negative regulation of ribosome biogenesis(GO:0090071) |
| 0.2 | 1.1 | GO:0060179 | male mating behavior(GO:0060179) |
| 0.2 | 4.1 | GO:0031293 | membrane protein intracellular domain proteolysis(GO:0031293) |
| 0.2 | 2.8 | GO:0021692 | cerebellar Purkinje cell layer morphogenesis(GO:0021692) |
| 0.2 | 0.5 | GO:0070858 | negative regulation of bile acid biosynthetic process(GO:0070858) negative regulation of bile acid metabolic process(GO:1904252) |
| 0.2 | 0.5 | GO:0042040 | molybdenum incorporation into molybdenum-molybdopterin complex(GO:0018315) metal incorporation into metallo-molybdopterin complex(GO:0042040) glycine receptor clustering(GO:0072579) |
| 0.2 | 1.9 | GO:0042737 | drug catabolic process(GO:0042737) |
| 0.2 | 0.4 | GO:0033140 | negative regulation of peptidyl-serine phosphorylation of STAT protein(GO:0033140) |
| 0.2 | 0.4 | GO:0009794 | regulation of mitotic cell cycle, embryonic(GO:0009794) mitotic cell cycle, embryonic(GO:0045448) |
| 0.2 | 6.1 | GO:0006517 | protein deglycosylation(GO:0006517) |
| 0.2 | 0.3 | GO:2000323 | negative regulation of glucocorticoid receptor signaling pathway(GO:2000323) |
| 0.2 | 0.2 | GO:0042137 | sequestering of neurotransmitter(GO:0042137) |
| 0.2 | 1.2 | GO:1900262 | regulation of DNA-directed DNA polymerase activity(GO:1900262) positive regulation of DNA-directed DNA polymerase activity(GO:1900264) |
| 0.2 | 0.5 | GO:0035927 | RNA import into mitochondrion(GO:0035927) |
| 0.2 | 2.4 | GO:0060539 | diaphragm development(GO:0060539) |
| 0.2 | 1.0 | GO:0030200 | heparan sulfate proteoglycan catabolic process(GO:0030200) |
| 0.2 | 2.9 | GO:0016540 | protein autoprocessing(GO:0016540) |
| 0.2 | 0.3 | GO:0003358 | noradrenergic neuron development(GO:0003358) |
| 0.2 | 1.2 | GO:0045079 | negative regulation of chemokine biosynthetic process(GO:0045079) |
| 0.2 | 1.0 | GO:0016128 | phytosteroid metabolic process(GO:0016128) phytosteroid biosynthetic process(GO:0016129) |
| 0.2 | 0.3 | GO:1900220 | semaphorin-plexin signaling pathway involved in bone trabecula morphogenesis(GO:1900220) |
| 0.2 | 2.2 | GO:0001682 | tRNA 5'-leader removal(GO:0001682) |
| 0.2 | 0.3 | GO:0031247 | actin rod assembly(GO:0031247) |
| 0.2 | 1.5 | GO:0009128 | purine nucleoside monophosphate catabolic process(GO:0009128) |
| 0.2 | 0.5 | GO:0032289 | central nervous system myelin formation(GO:0032289) |
| 0.2 | 2.7 | GO:0018027 | peptidyl-lysine dimethylation(GO:0018027) |
| 0.2 | 0.5 | GO:2000616 | negative regulation of histone H3-K9 acetylation(GO:2000616) |
| 0.2 | 1.5 | GO:0045002 | DNA double-strand break processing involved in repair via single-strand annealing(GO:0010792) double-strand break repair via single-strand annealing(GO:0045002) |
| 0.2 | 1.5 | GO:0045078 | positive regulation of interferon-gamma biosynthetic process(GO:0045078) |
| 0.2 | 0.5 | GO:0030432 | peristalsis(GO:0030432) |
| 0.2 | 1.0 | GO:1900369 | negative regulation of RNA interference(GO:1900369) |
| 0.2 | 3.2 | GO:1990118 | sodium ion import across plasma membrane(GO:0098719) sodium ion import into cell(GO:1990118) |
| 0.2 | 2.0 | GO:0070294 | renal sodium ion absorption(GO:0070294) |
| 0.2 | 0.3 | GO:0045900 | negative regulation of translational elongation(GO:0045900) |
| 0.2 | 0.3 | GO:0009125 | nucleoside monophosphate catabolic process(GO:0009125) |
| 0.2 | 2.0 | GO:0016226 | iron-sulfur cluster assembly(GO:0016226) metallo-sulfur cluster assembly(GO:0031163) |
| 0.2 | 0.3 | GO:0048199 | vesicle targeting, to, from or within Golgi(GO:0048199) |
| 0.2 | 0.5 | GO:1990164 | histone H2A phosphorylation(GO:1990164) |
| 0.2 | 0.7 | GO:0003084 | positive regulation of systemic arterial blood pressure(GO:0003084) |
| 0.2 | 6.0 | GO:0090383 | phagosome acidification(GO:0090383) |
| 0.2 | 1.5 | GO:0061038 | uterus morphogenesis(GO:0061038) |
| 0.2 | 1.0 | GO:0070378 | positive regulation of ERK5 cascade(GO:0070378) |
| 0.2 | 0.5 | GO:0006085 | acetyl-CoA biosynthetic process(GO:0006085) |
| 0.2 | 3.3 | GO:0048934 | peripheral nervous system neuron differentiation(GO:0048934) peripheral nervous system neuron development(GO:0048935) |
| 0.2 | 0.7 | GO:0033319 | UDP-D-xylose metabolic process(GO:0033319) UDP-D-xylose biosynthetic process(GO:0033320) |
| 0.2 | 0.5 | GO:2000547 | regulation of T cell costimulation(GO:2000523) positive regulation of T cell costimulation(GO:2000525) regulation of dendritic cell dendrite assembly(GO:2000547) |
| 0.2 | 0.8 | GO:0002528 | regulation of vascular permeability involved in acute inflammatory response(GO:0002528) |
| 0.2 | 1.0 | GO:0097319 | fructose import(GO:0032445) carbohydrate import into cell(GO:0097319) carbohydrate import across plasma membrane(GO:0098704) fructose import across plasma membrane(GO:1990539) |
| 0.2 | 5.2 | GO:2000369 | regulation of clathrin-mediated endocytosis(GO:2000369) |
| 0.2 | 1.8 | GO:0045475 | locomotor rhythm(GO:0045475) |
| 0.2 | 1.5 | GO:0007197 | adenylate cyclase-inhibiting G-protein coupled acetylcholine receptor signaling pathway(GO:0007197) |
| 0.2 | 2.1 | GO:0070050 | neuron cellular homeostasis(GO:0070050) |
| 0.2 | 2.4 | GO:2000664 | positive regulation of interleukin-5 secretion(GO:2000664) |
| 0.2 | 0.6 | GO:0006560 | proline metabolic process(GO:0006560) |
| 0.2 | 2.7 | GO:0034983 | peptidyl-lysine deacetylation(GO:0034983) |
| 0.2 | 0.2 | GO:0002408 | myeloid dendritic cell chemotaxis(GO:0002408) |
| 0.2 | 0.3 | GO:1990822 | basic amino acid transmembrane transport(GO:1990822) |
| 0.2 | 4.7 | GO:0010569 | regulation of double-strand break repair via homologous recombination(GO:0010569) |
| 0.2 | 1.6 | GO:0005981 | regulation of glycogen catabolic process(GO:0005981) |
| 0.2 | 0.5 | GO:0098908 | regulation of neuronal action potential(GO:0098908) |
| 0.2 | 1.3 | GO:0046726 | positive regulation by virus of viral protein levels in host cell(GO:0046726) |
| 0.2 | 0.8 | GO:0009397 | folic acid-containing compound catabolic process(GO:0009397) pteridine-containing compound catabolic process(GO:0042560) |
| 0.2 | 2.9 | GO:0035563 | positive regulation of chromatin binding(GO:0035563) |
| 0.2 | 0.2 | GO:0060374 | mast cell differentiation(GO:0060374) |
| 0.2 | 0.5 | GO:2001183 | negative regulation of interleukin-12 secretion(GO:2001183) |
| 0.2 | 3.5 | GO:2000766 | negative regulation of cytoplasmic translation(GO:2000766) |
| 0.2 | 1.1 | GO:0043353 | enucleate erythrocyte differentiation(GO:0043353) |
| 0.2 | 0.5 | GO:0016267 | O-glycan processing, core 1(GO:0016267) |
| 0.2 | 1.1 | GO:0017062 | respiratory chain complex III assembly(GO:0017062) mitochondrial respiratory chain complex III assembly(GO:0034551) |
| 0.2 | 0.6 | GO:0061580 | colon epithelial cell migration(GO:0061580) intestinal epithelial cell migration(GO:0061582) |
| 0.2 | 0.9 | GO:0032328 | alanine transport(GO:0032328) |
| 0.2 | 3.1 | GO:0006750 | glutathione biosynthetic process(GO:0006750) |
| 0.2 | 1.7 | GO:0006553 | lysine metabolic process(GO:0006553) |
| 0.2 | 2.0 | GO:0031642 | negative regulation of myelination(GO:0031642) |
| 0.2 | 1.1 | GO:0046092 | deoxycytidine metabolic process(GO:0046092) |
| 0.2 | 0.8 | GO:1903028 | positive regulation of opsonization(GO:1903028) |
| 0.2 | 2.5 | GO:0051256 | mitotic spindle midzone assembly(GO:0051256) |
| 0.2 | 0.2 | GO:0006301 | postreplication repair(GO:0006301) |
| 0.2 | 5.1 | GO:0042769 | DNA damage response, detection of DNA damage(GO:0042769) |
| 0.2 | 0.8 | GO:0018242 | protein O-linked glycosylation via serine(GO:0018242) |
| 0.2 | 0.3 | GO:0032252 | secretory granule localization(GO:0032252) |
| 0.2 | 0.2 | GO:1904393 | regulation of skeletal muscle acetylcholine-gated channel clustering(GO:1904393) negative regulation of neuromuscular junction development(GO:1904397) |
| 0.2 | 2.5 | GO:0070129 | regulation of mitochondrial translation(GO:0070129) |
| 0.2 | 0.6 | GO:0090521 | glomerular visceral epithelial cell migration(GO:0090521) |
| 0.2 | 0.3 | GO:1990167 | protein K27-linked deubiquitination(GO:1990167) protein K33-linked deubiquitination(GO:1990168) |
| 0.2 | 5.1 | GO:0007340 | acrosome reaction(GO:0007340) |
| 0.2 | 2.7 | GO:0010818 | T cell chemotaxis(GO:0010818) |
| 0.2 | 1.5 | GO:0006621 | protein retention in ER lumen(GO:0006621) |
| 0.2 | 0.6 | GO:0061668 | mitochondrial ribosome assembly(GO:0061668) mitochondrial large ribosomal subunit assembly(GO:1902775) |
| 0.2 | 0.3 | GO:0042940 | D-amino acid transport(GO:0042940) |
| 0.2 | 0.9 | GO:1903232 | melanosome assembly(GO:1903232) |
| 0.2 | 0.9 | GO:0010587 | miRNA catabolic process(GO:0010587) |
| 0.2 | 3.6 | GO:0097264 | self proteolysis(GO:0097264) |
| 0.2 | 0.8 | GO:0010216 | maintenance of DNA methylation(GO:0010216) |
| 0.2 | 2.4 | GO:0070070 | proton-transporting V-type ATPase complex assembly(GO:0070070) vacuolar proton-transporting V-type ATPase complex assembly(GO:0070072) |
| 0.2 | 0.9 | GO:1903251 | multi-ciliated epithelial cell differentiation(GO:1903251) |
| 0.1 | 1.8 | GO:0052696 | flavonoid glucuronidation(GO:0052696) xenobiotic glucuronidation(GO:0052697) |
| 0.1 | 0.7 | GO:0008295 | spermidine biosynthetic process(GO:0008295) |
| 0.1 | 2.1 | GO:0018206 | peptidyl-methionine modification(GO:0018206) |
| 0.1 | 0.4 | GO:0016116 | tetraterpenoid metabolic process(GO:0016108) carotenoid metabolic process(GO:0016116) carotene catabolic process(GO:0016121) xanthophyll metabolic process(GO:0016122) terpene catabolic process(GO:0046247) |
| 0.1 | 1.3 | GO:0035583 | sequestering of TGFbeta in extracellular matrix(GO:0035583) |
| 0.1 | 0.4 | GO:0010897 | negative regulation of triglyceride catabolic process(GO:0010897) |
| 0.1 | 1.0 | GO:0048304 | positive regulation of isotype switching to IgG isotypes(GO:0048304) |
| 0.1 | 1.2 | GO:1903433 | regulation of constitutive secretory pathway(GO:1903433) |
| 0.1 | 1.0 | GO:0070212 | protein poly-ADP-ribosylation(GO:0070212) |
| 0.1 | 0.9 | GO:0048296 | isotype switching to IgA isotypes(GO:0048290) regulation of isotype switching to IgA isotypes(GO:0048296) |
| 0.1 | 0.6 | GO:1904806 | regulation of protein oxidation(GO:1904806) positive regulation of protein oxidation(GO:1904808) |
| 0.1 | 1.3 | GO:0007135 | meiosis II(GO:0007135) |
| 0.1 | 0.4 | GO:0070255 | regulation of mucus secretion(GO:0070255) |
| 0.1 | 0.1 | GO:0097411 | hypoxia-inducible factor-1alpha signaling pathway(GO:0097411) |
| 0.1 | 0.7 | GO:0007468 | regulation of rhodopsin gene expression(GO:0007468) positive regulation of rhodopsin gene expression(GO:0045872) |
| 0.1 | 0.3 | GO:1903595 | positive regulation of histamine secretion by mast cell(GO:1903595) |
| 0.1 | 4.8 | GO:0032515 | negative regulation of phosphoprotein phosphatase activity(GO:0032515) |
| 0.1 | 2.0 | GO:0010499 | proteasomal ubiquitin-independent protein catabolic process(GO:0010499) |
| 0.1 | 0.1 | GO:0032425 | positive regulation of mismatch repair(GO:0032425) |
| 0.1 | 0.9 | GO:0046952 | ketone body catabolic process(GO:0046952) |
| 0.1 | 0.4 | GO:0010982 | regulation of high-density lipoprotein particle clearance(GO:0010982) positive regulation of high-density lipoprotein particle clearance(GO:0010983) |
| 0.1 | 0.4 | GO:0051725 | protein de-ADP-ribosylation(GO:0051725) |
| 0.1 | 1.9 | GO:1902659 | regulation of glucose mediated signaling pathway(GO:1902659) |
| 0.1 | 0.4 | GO:0046958 | nonassociative learning(GO:0046958) |
| 0.1 | 0.6 | GO:0090301 | regulation of neural crest formation(GO:0090299) negative regulation of neural crest formation(GO:0090301) negative regulation of fibroblast growth factor receptor signaling pathway involved in neural plate anterior/posterior pattern formation(GO:2000314) |
| 0.1 | 1.0 | GO:0070444 | oligodendrocyte progenitor proliferation(GO:0070444) regulation of oligodendrocyte progenitor proliferation(GO:0070445) |
| 0.1 | 4.1 | GO:0071420 | cellular response to histamine(GO:0071420) |
| 0.1 | 4.5 | GO:0030488 | tRNA methylation(GO:0030488) |
| 0.1 | 2.0 | GO:0045005 | DNA-dependent DNA replication maintenance of fidelity(GO:0045005) |
| 0.1 | 0.7 | GO:0052056 | modulation by virus of host molecular function(GO:0039506) suppression by virus of host molecular function(GO:0039507) suppression by virus of host catalytic activity(GO:0039513) modulation by virus of host catalytic activity(GO:0039516) suppression by virus of host cysteine-type endopeptidase activity involved in apoptotic process(GO:0039650) negative regulation by symbiont of host catalytic activity(GO:0052053) negative regulation by symbiont of host molecular function(GO:0052056) modulation by symbiont of host catalytic activity(GO:0052148) |
| 0.1 | 0.1 | GO:0036090 | cleavage furrow ingression(GO:0036090) |
| 0.1 | 0.3 | GO:2001303 | lipoxin biosynthetic process(GO:2001301) lipoxin A4 metabolic process(GO:2001302) lipoxin A4 biosynthetic process(GO:2001303) |
| 0.1 | 0.6 | GO:0036446 | myofibroblast differentiation(GO:0036446) regulation of myofibroblast differentiation(GO:1904760) negative regulation of myofibroblast differentiation(GO:1904761) |
| 0.1 | 0.3 | GO:0007056 | spindle assembly involved in female meiosis(GO:0007056) |
| 0.1 | 0.8 | GO:0061669 | spontaneous neurotransmitter secretion(GO:0061669) spontaneous synaptic transmission(GO:0098814) |
| 0.1 | 1.5 | GO:0010459 | negative regulation of heart rate(GO:0010459) |
| 0.1 | 19.2 | GO:0006415 | translational termination(GO:0006415) |
| 0.1 | 0.1 | GO:0070541 | response to platinum ion(GO:0070541) |
| 0.1 | 0.7 | GO:0006564 | L-serine biosynthetic process(GO:0006564) |
| 0.1 | 5.3 | GO:0007091 | metaphase/anaphase transition of mitotic cell cycle(GO:0007091) |
| 0.1 | 2.8 | GO:0007064 | mitotic sister chromatid cohesion(GO:0007064) |
| 0.1 | 0.7 | GO:1990416 | cellular response to brain-derived neurotrophic factor stimulus(GO:1990416) |
| 0.1 | 0.1 | GO:0043376 | regulation of CD8-positive, alpha-beta T cell differentiation(GO:0043376) |
| 0.1 | 0.1 | GO:0097051 | establishment of protein localization to endoplasmic reticulum membrane(GO:0097051) |
| 0.1 | 0.4 | GO:0010360 | negative regulation of anion channel activity(GO:0010360) |
| 0.1 | 1.9 | GO:0031915 | positive regulation of synaptic plasticity(GO:0031915) |
| 0.1 | 1.1 | GO:1905146 | lysosomal protein catabolic process(GO:1905146) |
| 0.1 | 0.9 | GO:0032439 | endosome localization(GO:0032439) |
| 0.1 | 7.3 | GO:0035036 | sperm-egg recognition(GO:0035036) |
| 0.1 | 1.1 | GO:0035973 | aggrephagy(GO:0035973) |
| 0.1 | 0.4 | GO:0006729 | tetrahydrobiopterin biosynthetic process(GO:0006729) tetrahydrobiopterin metabolic process(GO:0046146) |
| 0.1 | 10.6 | GO:0046513 | ceramide biosynthetic process(GO:0046513) |
| 0.1 | 0.1 | GO:0002644 | negative regulation of tolerance induction(GO:0002644) |
| 0.1 | 0.8 | GO:0061107 | seminal vesicle development(GO:0061107) |
| 0.1 | 2.7 | GO:0015879 | amino-acid betaine transport(GO:0015838) carnitine transport(GO:0015879) |
| 0.1 | 0.8 | GO:0060157 | urinary bladder development(GO:0060157) |
| 0.1 | 0.5 | GO:0051586 | positive regulation of dopamine uptake involved in synaptic transmission(GO:0051586) positive regulation of catecholamine uptake involved in synaptic transmission(GO:0051944) |
| 0.1 | 0.7 | GO:0009750 | response to fructose(GO:0009750) |
| 0.1 | 0.3 | GO:0090261 | positive regulation of inclusion body assembly(GO:0090261) |
| 0.1 | 2.2 | GO:0031441 | negative regulation of mRNA 3'-end processing(GO:0031441) |
| 0.1 | 0.3 | GO:1901857 | positive regulation of cellular respiration(GO:1901857) |
| 0.1 | 0.1 | GO:0046619 | optic placode formation involved in camera-type eye formation(GO:0046619) |
| 0.1 | 0.3 | GO:0030581 | intracellular transport of viral protein in host cell(GO:0019060) symbiont intracellular protein transport in host(GO:0030581) intracellular protein transport in other organism involved in symbiotic interaction(GO:0051708) |
| 0.1 | 2.2 | GO:0045898 | regulation of RNA polymerase II transcriptional preinitiation complex assembly(GO:0045898) |
| 0.1 | 0.4 | GO:0000451 | rRNA 2'-O-methylation(GO:0000451) |
| 0.1 | 1.4 | GO:0051531 | NFAT protein import into nucleus(GO:0051531) |
| 0.1 | 0.7 | GO:0014826 | vein smooth muscle contraction(GO:0014826) |
| 0.1 | 0.9 | GO:0007042 | lysosomal lumen acidification(GO:0007042) |
| 0.1 | 0.5 | GO:0001994 | norepinephrine-epinephrine vasoconstriction involved in regulation of systemic arterial blood pressure(GO:0001994) |
| 0.1 | 0.3 | GO:0044108 | cellular alcohol metabolic process(GO:0044107) cellular alcohol biosynthetic process(GO:0044108) |
| 0.1 | 0.5 | GO:0072718 | response to cisplatin(GO:0072718) |
| 0.1 | 4.3 | GO:0061003 | positive regulation of dendritic spine morphogenesis(GO:0061003) |
| 0.1 | 0.9 | GO:0031627 | telomeric loop formation(GO:0031627) |
| 0.1 | 1.6 | GO:0071361 | cellular response to ethanol(GO:0071361) |
| 0.1 | 1.4 | GO:0001731 | formation of translation preinitiation complex(GO:0001731) |
| 0.1 | 0.8 | GO:1900454 | positive regulation of long term synaptic depression(GO:1900454) |
| 0.1 | 1.2 | GO:0070932 | histone H3 deacetylation(GO:0070932) |
| 0.1 | 0.4 | GO:0019086 | late viral transcription(GO:0019086) |
| 0.1 | 0.4 | GO:0097536 | thymus epithelium morphogenesis(GO:0097536) |
| 0.1 | 1.4 | GO:0048096 | chromatin-mediated maintenance of transcription(GO:0048096) |
| 0.1 | 0.5 | GO:0014816 | skeletal muscle satellite cell differentiation(GO:0014816) |
| 0.1 | 1.5 | GO:0080111 | DNA dealkylation(GO:0035510) DNA demethylation(GO:0080111) |
| 0.1 | 0.4 | GO:0061017 | hepatic duct development(GO:0061011) hepatoblast differentiation(GO:0061017) |
| 0.1 | 0.3 | GO:0048570 | notochord morphogenesis(GO:0048570) |
| 0.1 | 3.0 | GO:0003062 | regulation of heart rate by chemical signal(GO:0003062) |
| 0.1 | 3.5 | GO:0043039 | tRNA aminoacylation for protein translation(GO:0006418) tRNA aminoacylation(GO:0043039) |
| 0.1 | 0.4 | GO:0050859 | negative regulation of B cell receptor signaling pathway(GO:0050859) |
| 0.1 | 1.4 | GO:0001522 | pseudouridine synthesis(GO:0001522) |
| 0.1 | 0.7 | GO:1902866 | regulation of retina development in camera-type eye(GO:1902866) |
| 0.1 | 0.5 | GO:1990523 | bone regeneration(GO:1990523) |
| 0.1 | 1.2 | GO:0051601 | exocyst localization(GO:0051601) |
| 0.1 | 0.5 | GO:1902513 | regulation of organelle transport along microtubule(GO:1902513) |
| 0.1 | 0.5 | GO:0070525 | tRNA threonylcarbamoyladenosine metabolic process(GO:0070525) |
| 0.1 | 0.2 | GO:0034378 | chylomicron assembly(GO:0034378) |
| 0.1 | 0.6 | GO:0009304 | tRNA transcription(GO:0009304) 5S class rRNA transcription from RNA polymerase III type 1 promoter(GO:0042791) tRNA transcription from RNA polymerase III promoter(GO:0042797) |
| 0.1 | 0.7 | GO:2000234 | positive regulation of ribosome biogenesis(GO:0090070) positive regulation of rRNA processing(GO:2000234) |
| 0.1 | 0.6 | GO:0016139 | glycoside catabolic process(GO:0016139) |
| 0.1 | 1.3 | GO:0016554 | cytidine to uridine editing(GO:0016554) |
| 0.1 | 1.1 | GO:0002667 | lymphocyte anergy(GO:0002249) regulation of T cell anergy(GO:0002667) T cell anergy(GO:0002870) regulation of lymphocyte anergy(GO:0002911) |
| 0.1 | 2.3 | GO:0000732 | strand displacement(GO:0000732) |
| 0.1 | 0.1 | GO:0018196 | peptidyl-asparagine modification(GO:0018196) |
| 0.1 | 1.4 | GO:2000427 | positive regulation of apoptotic cell clearance(GO:2000427) |
| 0.1 | 5.4 | GO:0051568 | histone H3-K4 methylation(GO:0051568) |
| 0.1 | 0.4 | GO:0018076 | N-terminal peptidyl-lysine acetylation(GO:0018076) |
| 0.1 | 2.0 | GO:0032836 | glomerular basement membrane development(GO:0032836) |
| 0.1 | 0.2 | GO:0016259 | selenocysteine metabolic process(GO:0016259) |
| 0.1 | 0.5 | GO:0001555 | oocyte growth(GO:0001555) |
| 0.1 | 0.5 | GO:0033567 | DNA replication, Okazaki fragment processing(GO:0033567) |
| 0.1 | 3.5 | GO:0045948 | positive regulation of translational initiation(GO:0045948) |
| 0.1 | 9.3 | GO:0030204 | chondroitin sulfate metabolic process(GO:0030204) |
| 0.1 | 0.1 | GO:0009070 | serine family amino acid biosynthetic process(GO:0009070) |
| 0.1 | 0.1 | GO:0021896 | forebrain astrocyte differentiation(GO:0021896) forebrain astrocyte development(GO:0021897) |
| 0.1 | 0.5 | GO:0000066 | mitochondrial ornithine transport(GO:0000066) |
| 0.1 | 1.0 | GO:2000124 | regulation of endocannabinoid signaling pathway(GO:2000124) |
| 0.1 | 0.7 | GO:0015680 | intracellular copper ion transport(GO:0015680) |
| 0.1 | 0.5 | GO:0051351 | positive regulation of ligase activity(GO:0051351) |
| 0.1 | 0.5 | GO:1903412 | response to bile acid(GO:1903412) |
| 0.1 | 0.5 | GO:0000117 | regulation of transcription involved in G2/M transition of mitotic cell cycle(GO:0000117) |
| 0.1 | 0.3 | GO:0019695 | choline metabolic process(GO:0019695) |
| 0.1 | 1.0 | GO:2000193 | positive regulation of fatty acid transport(GO:2000193) |
| 0.1 | 0.2 | GO:0009212 | dTTP biosynthetic process(GO:0006235) pyrimidine deoxyribonucleoside triphosphate biosynthetic process(GO:0009212) |
| 0.1 | 0.5 | GO:0019530 | taurine metabolic process(GO:0019530) |
| 0.1 | 0.7 | GO:0098746 | fast, calcium ion-dependent exocytosis of neurotransmitter(GO:0098746) |
| 0.1 | 1.0 | GO:0021759 | globus pallidus development(GO:0021759) |
| 0.1 | 1.2 | GO:0032688 | negative regulation of interferon-beta production(GO:0032688) |
| 0.1 | 0.3 | GO:0046073 | dTMP biosynthetic process(GO:0006231) dTMP metabolic process(GO:0046073) |
| 0.1 | 0.2 | GO:0031204 | posttranslational protein targeting to membrane, translocation(GO:0031204) |
| 0.1 | 0.3 | GO:0060339 | negative regulation of type I interferon-mediated signaling pathway(GO:0060339) |
| 0.1 | 3.9 | GO:0051031 | tRNA transport(GO:0051031) |
| 0.1 | 0.9 | GO:0043691 | reverse cholesterol transport(GO:0043691) |
| 0.1 | 0.6 | GO:1905224 | clathrin-coated pit assembly(GO:1905224) |
| 0.1 | 1.0 | GO:0090158 | endoplasmic reticulum membrane organization(GO:0090158) |
| 0.1 | 0.4 | GO:0002881 | negative regulation of chronic inflammatory response to non-antigenic stimulus(GO:0002881) |
| 0.1 | 0.3 | GO:0046601 | positive regulation of centriole replication(GO:0046601) |
| 0.1 | 1.3 | GO:0006105 | succinate metabolic process(GO:0006105) |
| 0.1 | 0.1 | GO:0016344 | meiotic chromosome movement towards spindle pole(GO:0016344) |
| 0.1 | 0.3 | GO:2000330 | interleukin-23-mediated signaling pathway(GO:0038155) positive regulation of T-helper 17 cell differentiation(GO:2000321) positive regulation of T-helper 17 cell lineage commitment(GO:2000330) |
| 0.1 | 0.4 | GO:2001247 | positive regulation of phosphatidylcholine biosynthetic process(GO:2001247) |
| 0.1 | 0.7 | GO:0002318 | myeloid progenitor cell differentiation(GO:0002318) |
| 0.1 | 0.8 | GO:0006651 | diacylglycerol biosynthetic process(GO:0006651) |
| 0.1 | 2.7 | GO:0002115 | store-operated calcium entry(GO:0002115) |
| 0.1 | 0.1 | GO:0060061 | Spemann organizer formation(GO:0060061) |
| 0.1 | 1.1 | GO:0035871 | protein K11-linked deubiquitination(GO:0035871) |
| 0.1 | 0.6 | GO:1900126 | negative regulation of hyaluronan biosynthetic process(GO:1900126) |
| 0.1 | 0.6 | GO:0034214 | protein hexamerization(GO:0034214) |
| 0.1 | 0.8 | GO:0060294 | cilium movement involved in cell motility(GO:0060294) |
| 0.1 | 0.9 | GO:0030860 | regulation of polarized epithelial cell differentiation(GO:0030860) |
| 0.1 | 0.7 | GO:0002925 | positive regulation of humoral immune response mediated by circulating immunoglobulin(GO:0002925) |
| 0.1 | 0.1 | GO:0034653 | diterpenoid catabolic process(GO:0016103) retinoic acid catabolic process(GO:0034653) |
| 0.1 | 0.9 | GO:0030422 | production of siRNA involved in RNA interference(GO:0030422) |
| 0.1 | 1.4 | GO:0032196 | transposition(GO:0032196) |
| 0.1 | 3.0 | GO:0035338 | long-chain fatty-acyl-CoA biosynthetic process(GO:0035338) |
| 0.1 | 0.5 | GO:0033058 | directional locomotion(GO:0033058) |
| 0.1 | 1.4 | GO:0019532 | oxalate transport(GO:0019532) |
| 0.1 | 0.8 | GO:0097502 | mannosylation(GO:0097502) |
| 0.1 | 1.4 | GO:0030210 | heparin metabolic process(GO:0030202) heparin biosynthetic process(GO:0030210) |
| 0.1 | 0.5 | GO:0048630 | skeletal muscle tissue growth(GO:0048630) |
| 0.1 | 1.1 | GO:0048007 | antigen processing and presentation of lipid antigen via MHC class Ib(GO:0048003) antigen processing and presentation, exogenous lipid antigen via MHC class Ib(GO:0048007) |
| 0.1 | 0.4 | GO:0046603 | negative regulation of mitotic centrosome separation(GO:0046603) |
| 0.1 | 2.0 | GO:0046339 | diacylglycerol metabolic process(GO:0046339) |
| 0.1 | 4.3 | GO:1903861 | positive regulation of dendrite extension(GO:1903861) |
| 0.1 | 0.5 | GO:0002572 | pro-T cell differentiation(GO:0002572) regulation of pro-T cell differentiation(GO:2000174) positive regulation of pro-T cell differentiation(GO:2000176) |
| 0.1 | 1.2 | GO:0015936 | coenzyme A metabolic process(GO:0015936) |
| 0.1 | 1.2 | GO:0036149 | phosphatidylinositol acyl-chain remodeling(GO:0036149) |
| 0.1 | 0.7 | GO:0071941 | nitrogen cycle metabolic process(GO:0071941) |
| 0.1 | 0.1 | GO:2001023 | regulation of response to drug(GO:2001023) |
| 0.1 | 0.4 | GO:0097211 | response to gonadotropin-releasing hormone(GO:0097210) cellular response to gonadotropin-releasing hormone(GO:0097211) |
| 0.1 | 0.6 | GO:0019075 | virus maturation(GO:0019075) |
| 0.1 | 0.3 | GO:0045716 | positive regulation of low-density lipoprotein particle receptor biosynthetic process(GO:0045716) |
| 0.1 | 0.5 | GO:2000852 | regulation of corticosterone secretion(GO:2000852) |
| 0.1 | 0.1 | GO:0021548 | pons development(GO:0021548) |
| 0.1 | 0.4 | GO:0090669 | telomerase RNA stabilization(GO:0090669) |
| 0.1 | 0.6 | GO:1903566 | positive regulation of protein localization to cilium(GO:1903566) |
| 0.1 | 0.2 | GO:1904058 | positive regulation of sensory perception of pain(GO:1904058) |
| 0.1 | 0.2 | GO:0071930 | negative regulation of transcription involved in G1/S transition of mitotic cell cycle(GO:0071930) |
| 0.1 | 1.0 | GO:0034384 | high-density lipoprotein particle clearance(GO:0034384) |
| 0.1 | 2.9 | GO:0006625 | protein targeting to peroxisome(GO:0006625) peroxisomal transport(GO:0043574) protein localization to peroxisome(GO:0072662) establishment of protein localization to peroxisome(GO:0072663) |
| 0.1 | 0.3 | GO:0008215 | spermine metabolic process(GO:0008215) |
| 0.1 | 1.2 | GO:0003341 | cilium movement(GO:0003341) |
| 0.1 | 1.2 | GO:0034127 | regulation of MyD88-independent toll-like receptor signaling pathway(GO:0034127) |
| 0.1 | 0.3 | GO:0050975 | sensory perception of touch(GO:0050975) detection of mechanical stimulus involved in sensory perception of touch(GO:0050976) cellular response to alkaline pH(GO:0071469) |
| 0.1 | 4.0 | GO:0034508 | centromere complex assembly(GO:0034508) |
| 0.1 | 0.5 | GO:2000327 | regulation of ligand-dependent nuclear receptor transcription coactivator activity(GO:2000325) positive regulation of ligand-dependent nuclear receptor transcription coactivator activity(GO:2000327) |
| 0.1 | 0.5 | GO:0038156 | interleukin-5-mediated signaling pathway(GO:0038043) interleukin-3-mediated signaling pathway(GO:0038156) |
| 0.1 | 0.6 | GO:0060010 | Sertoli cell fate commitment(GO:0060010) |
| 0.1 | 0.3 | GO:0045110 | intermediate filament bundle assembly(GO:0045110) |
| 0.1 | 1.9 | GO:0035330 | regulation of hippo signaling(GO:0035330) |
| 0.1 | 0.3 | GO:0043622 | cortical microtubule organization(GO:0043622) |
| 0.1 | 1.7 | GO:0006388 | tRNA splicing, via endonucleolytic cleavage and ligation(GO:0006388) |
| 0.1 | 0.4 | GO:0010387 | COP9 signalosome assembly(GO:0010387) |
| 0.1 | 0.3 | GO:0051083 | 'de novo' cotranslational protein folding(GO:0051083) |
| 0.1 | 2.6 | GO:0035235 | ionotropic glutamate receptor signaling pathway(GO:0035235) |
| 0.1 | 0.2 | GO:0046121 | deoxyribonucleoside catabolic process(GO:0046121) |
| 0.1 | 0.7 | GO:0006707 | cholesterol catabolic process(GO:0006707) sterol catabolic process(GO:0016127) |
| 0.1 | 3.0 | GO:0019985 | translesion synthesis(GO:0019985) |
| 0.1 | 0.3 | GO:1904425 | negative regulation of GTP binding(GO:1904425) |
| 0.1 | 0.6 | GO:2000628 | regulation of miRNA metabolic process(GO:2000628) |
| 0.1 | 0.4 | GO:1903564 | regulation of protein localization to cilium(GO:1903564) negative regulation of protein localization to cilium(GO:1903565) regulation of protein localization to ciliary membrane(GO:1903567) negative regulation of protein localization to ciliary membrane(GO:1903568) |
| 0.1 | 2.5 | GO:0051443 | positive regulation of ubiquitin-protein transferase activity(GO:0051443) |
| 0.1 | 0.1 | GO:0046666 | retinal cell programmed cell death(GO:0046666) |
| 0.1 | 4.4 | GO:1902475 | L-alpha-amino acid transmembrane transport(GO:1902475) |
| 0.1 | 1.4 | GO:0090110 | cargo loading into COPII-coated vesicle(GO:0090110) |
| 0.1 | 0.1 | GO:1902956 | regulation of mitochondrial electron transport, NADH to ubiquinone(GO:1902956) |
| 0.1 | 2.2 | GO:0030322 | stabilization of membrane potential(GO:0030322) |
| 0.1 | 2.7 | GO:0014047 | glutamate secretion(GO:0014047) |
| 0.1 | 0.3 | GO:0061386 | closure of optic fissure(GO:0061386) |
| 0.1 | 2.4 | GO:0090023 | positive regulation of neutrophil chemotaxis(GO:0090023) |
| 0.1 | 0.1 | GO:0038109 | response to stem cell factor(GO:0036215) cellular response to stem cell factor stimulus(GO:0036216) Kit signaling pathway(GO:0038109) |
| 0.1 | 0.2 | GO:0030886 | negative regulation of myeloid dendritic cell activation(GO:0030886) |
| 0.1 | 0.4 | GO:0060040 | retinal bipolar neuron differentiation(GO:0060040) |
| 0.1 | 1.1 | GO:0018023 | peptidyl-lysine trimethylation(GO:0018023) |
| 0.1 | 0.9 | GO:0032494 | response to peptidoglycan(GO:0032494) |
| 0.1 | 3.3 | GO:0006904 | vesicle docking involved in exocytosis(GO:0006904) |
| 0.1 | 0.5 | GO:0007198 | adenylate cyclase-inhibiting serotonin receptor signaling pathway(GO:0007198) |
| 0.1 | 1.7 | GO:1903963 | arachidonic acid secretion(GO:0050482) arachidonate transport(GO:1903963) |
| 0.1 | 0.5 | GO:0043652 | engulfment of apoptotic cell(GO:0043652) |
| 0.1 | 0.9 | GO:0033182 | regulation of histone ubiquitination(GO:0033182) |
| 0.1 | 0.6 | GO:1904153 | negative regulation of protein exit from endoplasmic reticulum(GO:0070862) negative regulation of retrograde protein transport, ER to cytosol(GO:1904153) |
| 0.1 | 0.3 | GO:0003415 | chondrocyte hypertrophy(GO:0003415) |
| 0.1 | 0.4 | GO:0032286 | central nervous system myelin maintenance(GO:0032286) |
| 0.1 | 0.3 | GO:0071529 | cementum mineralization(GO:0071529) |
| 0.1 | 0.5 | GO:0006498 | N-terminal protein lipidation(GO:0006498) N-terminal protein palmitoylation(GO:0006500) |
| 0.1 | 0.8 | GO:0007616 | long-term memory(GO:0007616) |
| 0.1 | 0.5 | GO:0061073 | ciliary body morphogenesis(GO:0061073) |
| 0.1 | 0.5 | GO:0035234 | ectopic germ cell programmed cell death(GO:0035234) |
| 0.1 | 0.7 | GO:0072383 | plus-end-directed vesicle transport along microtubule(GO:0072383) plus-end-directed organelle transport along microtubule(GO:0072386) |
| 0.1 | 1.7 | GO:0070816 | phosphorylation of RNA polymerase II C-terminal domain(GO:0070816) |
| 0.1 | 1.9 | GO:0006020 | inositol metabolic process(GO:0006020) |
| 0.1 | 0.3 | GO:0034395 | regulation of transcription from RNA polymerase II promoter in response to iron(GO:0034395) |
| 0.1 | 0.4 | GO:1901142 | insulin metabolic process(GO:1901142) |
| 0.1 | 0.3 | GO:0015734 | taurine transport(GO:0015734) |
| 0.1 | 0.3 | GO:0045643 | regulation of eosinophil differentiation(GO:0045643) positive regulation of eosinophil differentiation(GO:0045645) |
| 0.1 | 0.6 | GO:0060481 | lobar bronchus epithelium development(GO:0060481) |
| 0.1 | 3.2 | GO:0032728 | positive regulation of interferon-beta production(GO:0032728) |
| 0.1 | 0.3 | GO:0051126 | negative regulation of actin nucleation(GO:0051126) |
| 0.1 | 2.2 | GO:1901663 | ubiquinone biosynthetic process(GO:0006744) quinone biosynthetic process(GO:1901663) |
| 0.1 | 0.3 | GO:0060167 | regulation of adenosine receptor signaling pathway(GO:0060167) |
| 0.1 | 0.2 | GO:0045896 | regulation of transcription during mitosis(GO:0045896) |
| 0.1 | 0.3 | GO:0021997 | neural plate axis specification(GO:0021997) |
| 0.1 | 0.3 | GO:0045829 | negative regulation of isotype switching(GO:0045829) negative regulation of isotype switching to IgE isotypes(GO:0048294) |
| 0.1 | 14.0 | GO:0035335 | peptidyl-tyrosine dephosphorylation(GO:0035335) |
| 0.1 | 1.3 | GO:0086046 | membrane depolarization during SA node cell action potential(GO:0086046) |
| 0.1 | 0.2 | GO:0009051 | pentose-phosphate shunt, oxidative branch(GO:0009051) |
| 0.1 | 0.6 | GO:0044334 | canonical Wnt signaling pathway involved in positive regulation of epithelial to mesenchymal transition(GO:0044334) |
| 0.1 | 1.4 | GO:0007127 | meiosis I(GO:0007127) |
| 0.1 | 0.7 | GO:0060965 | negative regulation of gene silencing by miRNA(GO:0060965) |
| 0.1 | 0.3 | GO:0021764 | amygdala development(GO:0021764) |
| 0.1 | 0.1 | GO:1903626 | positive regulation of apoptotic DNA fragmentation(GO:1902512) positive regulation of DNA catabolic process(GO:1903626) |
| 0.1 | 0.8 | GO:0098795 | mRNA cleavage involved in gene silencing by miRNA(GO:0035279) mRNA cleavage involved in gene silencing(GO:0098795) |
| 0.1 | 5.9 | GO:0090114 | COPII-coated vesicle budding(GO:0090114) |
| 0.1 | 0.3 | GO:2000813 | negative regulation of barbed-end actin filament capping(GO:2000813) |
| 0.1 | 0.3 | GO:0046543 | development of secondary sexual characteristics(GO:0045136) development of secondary female sexual characteristics(GO:0046543) |
| 0.1 | 0.8 | GO:0045086 | positive regulation of interleukin-2 biosynthetic process(GO:0045086) |
| 0.1 | 0.4 | GO:0000479 | endonucleolytic cleavage of tricistronic rRNA transcript (SSU-rRNA, 5.8S rRNA, LSU-rRNA)(GO:0000479) |
| 0.1 | 0.2 | GO:0032621 | interleukin-18 production(GO:0032621) |
| 0.1 | 1.2 | GO:0032438 | melanosome organization(GO:0032438) |
| 0.1 | 1.7 | GO:0021796 | cerebral cortex regionalization(GO:0021796) |
| 0.1 | 0.4 | GO:2000343 | positive regulation of metalloendopeptidase activity(GO:1904685) positive regulation of chemokine (C-X-C motif) ligand 2 production(GO:2000343) |
| 0.1 | 0.3 | GO:0015801 | aromatic amino acid transport(GO:0015801) |
| 0.1 | 0.2 | GO:1900368 | regulation of RNA interference(GO:1900368) |
| 0.1 | 0.6 | GO:0006578 | amino-acid betaine biosynthetic process(GO:0006578) |
| 0.1 | 1.3 | GO:0000737 | DNA catabolic process, endonucleolytic(GO:0000737) apoptotic DNA fragmentation(GO:0006309) |
| 0.1 | 0.4 | GO:0009133 | nucleoside diphosphate biosynthetic process(GO:0009133) |
| 0.1 | 0.3 | GO:1904970 | brush border assembly(GO:1904970) |
| 0.1 | 1.9 | GO:0006101 | citrate metabolic process(GO:0006101) |
| 0.1 | 2.3 | GO:0022400 | regulation of rhodopsin mediated signaling pathway(GO:0022400) |
| 0.1 | 0.6 | GO:0045717 | negative regulation of fatty acid biosynthetic process(GO:0045717) |
| 0.1 | 0.4 | GO:0060766 | negative regulation of androgen receptor signaling pathway(GO:0060766) |
| 0.1 | 0.2 | GO:0046338 | phosphatidylethanolamine catabolic process(GO:0046338) |
| 0.1 | 0.2 | GO:0033048 | negative regulation of mitotic sister chromatid segregation(GO:0033048) |
| 0.1 | 1.0 | GO:0021680 | cerebellar Purkinje cell layer development(GO:0021680) |
| 0.1 | 0.3 | GO:0042631 | cellular response to water deprivation(GO:0042631) |
| 0.1 | 1.3 | GO:0000083 | regulation of transcription involved in G1/S transition of mitotic cell cycle(GO:0000083) |
| 0.1 | 2.2 | GO:0048026 | positive regulation of mRNA splicing, via spliceosome(GO:0048026) |
| 0.1 | 0.2 | GO:2001286 | regulation of caveolin-mediated endocytosis(GO:2001286) |
| 0.1 | 1.6 | GO:0003416 | endochondral bone growth(GO:0003416) |
| 0.1 | 0.5 | GO:0048293 | isotype switching to IgE isotypes(GO:0048289) regulation of isotype switching to IgE isotypes(GO:0048293) |
| 0.1 | 0.5 | GO:0017144 | drug metabolic process(GO:0017144) |
| 0.1 | 0.8 | GO:0071468 | cellular response to acidic pH(GO:0071468) |
| 0.1 | 0.2 | GO:0072684 | mitochondrial tRNA 3'-trailer cleavage, endonucleolytic(GO:0072684) |
| 0.1 | 0.4 | GO:0042159 | lipoprotein catabolic process(GO:0042159) |
| 0.1 | 0.3 | GO:0060050 | positive regulation of protein glycosylation(GO:0060050) |
| 0.1 | 0.4 | GO:0042976 | activation of Janus kinase activity(GO:0042976) |
| 0.1 | 0.1 | GO:0015917 | aminophospholipid transport(GO:0015917) |
| 0.1 | 1.0 | GO:0061373 | mammillary body development(GO:0021767) mammillary axonal complex development(GO:0061373) melanocyte migration(GO:0097324) positive regulation of lens fiber cell differentiation(GO:1902748) regulation of melanosome organization(GO:1903056) |
| 0.1 | 0.1 | GO:0033668 | negative regulation by symbiont of host apoptotic process(GO:0033668) negative regulation by symbiont of host programmed cell death(GO:0052041) negative regulation by organism of programmed cell death in other organism involved in symbiotic interaction(GO:0052490) |
| 0.1 | 1.0 | GO:0045008 | depyrimidination(GO:0045008) |
| 0.1 | 0.2 | GO:0031117 | positive regulation of microtubule depolymerization(GO:0031117) |
| 0.1 | 0.2 | GO:0003228 | atrial cardiac muscle tissue development(GO:0003228) atrial cardiac muscle tissue morphogenesis(GO:0055009) |
| 0.1 | 0.2 | GO:0048200 | COPI-coated vesicle budding(GO:0035964) Golgi transport vesicle coating(GO:0048200) COPI coating of Golgi vesicle(GO:0048205) |
| 0.1 | 0.1 | GO:0009436 | glyoxylate catabolic process(GO:0009436) |
| 0.1 | 0.4 | GO:2000543 | positive regulation of gastrulation(GO:2000543) |
| 0.1 | 0.3 | GO:0046462 | monoacylglycerol metabolic process(GO:0046462) monoacylglycerol catabolic process(GO:0052651) |
| 0.1 | 0.1 | GO:0032608 | interferon-beta production(GO:0032608) |
| 0.1 | 3.8 | GO:0006399 | tRNA metabolic process(GO:0006399) |
| 0.1 | 2.2 | GO:0042149 | cellular response to glucose starvation(GO:0042149) |
| 0.1 | 0.8 | GO:0006878 | cellular copper ion homeostasis(GO:0006878) |
| 0.1 | 0.1 | GO:1902303 | negative regulation of potassium ion export(GO:1902303) |
| 0.1 | 0.2 | GO:0046040 | IMP metabolic process(GO:0046040) |
| 0.1 | 0.1 | GO:0051189 | molybdopterin cofactor biosynthetic process(GO:0032324) molybdopterin cofactor metabolic process(GO:0043545) prosthetic group metabolic process(GO:0051189) |
| 0.1 | 1.2 | GO:2000821 | regulation of grooming behavior(GO:2000821) |
| 0.1 | 1.1 | GO:0009313 | oligosaccharide catabolic process(GO:0009313) |
| 0.1 | 1.0 | GO:0097091 | synaptic vesicle clustering(GO:0097091) |
| 0.1 | 0.1 | GO:0038158 | granulocyte colony-stimulating factor signaling pathway(GO:0038158) |
| 0.1 | 0.1 | GO:0060738 | epithelial-mesenchymal signaling involved in prostate gland development(GO:0060738) |
| 0.1 | 1.2 | GO:0031639 | plasminogen activation(GO:0031639) |
| 0.1 | 0.8 | GO:0009812 | flavonoid metabolic process(GO:0009812) |
| 0.1 | 1.1 | GO:0006703 | estrogen biosynthetic process(GO:0006703) |
| 0.1 | 0.1 | GO:0006207 | 'de novo' pyrimidine nucleobase biosynthetic process(GO:0006207) pyrimidine nucleobase biosynthetic process(GO:0019856) |
| 0.1 | 0.7 | GO:0070995 | NADPH oxidation(GO:0070995) |
| 0.1 | 0.1 | GO:0043628 | ncRNA 3'-end processing(GO:0043628) |
| 0.1 | 0.2 | GO:0044806 | G-quadruplex DNA unwinding(GO:0044806) |
| 0.1 | 0.1 | GO:1904874 | positive regulation of telomerase RNA localization to Cajal body(GO:1904874) |
| 0.1 | 1.3 | GO:0048149 | behavioral response to ethanol(GO:0048149) |
| 0.1 | 0.4 | GO:1902916 | positive regulation of protein polyubiquitination(GO:1902916) |
| 0.1 | 0.4 | GO:1903715 | regulation of aerobic respiration(GO:1903715) |
| 0.1 | 0.6 | GO:2000291 | regulation of myoblast proliferation(GO:2000291) |
| 0.1 | 5.3 | GO:0051437 | positive regulation of ubiquitin-protein ligase activity involved in regulation of mitotic cell cycle transition(GO:0051437) |
| 0.1 | 0.3 | GO:0046379 | extracellular polysaccharide biosynthetic process(GO:0045226) extracellular polysaccharide metabolic process(GO:0046379) |
| 0.1 | 0.2 | GO:1901874 | negative regulation of post-translational protein modification(GO:1901874) |
| 0.1 | 0.4 | GO:0051534 | negative regulation of NFAT protein import into nucleus(GO:0051534) |
| 0.1 | 0.3 | GO:2000786 | positive regulation of autophagosome assembly(GO:2000786) |
| 0.1 | 0.5 | GO:0043569 | negative regulation of insulin-like growth factor receptor signaling pathway(GO:0043569) |
| 0.1 | 0.5 | GO:0002566 | somatic diversification of immune receptors via somatic mutation(GO:0002566) |
| 0.1 | 0.6 | GO:0046398 | UDP-glucuronate biosynthetic process(GO:0006065) UDP-glucuronate metabolic process(GO:0046398) |
| 0.1 | 1.0 | GO:0051561 | positive regulation of mitochondrial calcium ion concentration(GO:0051561) |
| 0.1 | 0.1 | GO:0001992 | regulation of systemic arterial blood pressure by vasopressin(GO:0001992) |
| 0.1 | 0.3 | GO:0034587 | piRNA metabolic process(GO:0034587) |
| 0.1 | 0.1 | GO:1901994 | meiotic cell cycle phase transition(GO:0044771) regulation of meiotic cell cycle phase transition(GO:1901993) negative regulation of meiotic cell cycle phase transition(GO:1901994) |
| 0.1 | 0.6 | GO:1902857 | positive regulation of nonmotile primary cilium assembly(GO:1902857) |
| 0.1 | 0.5 | GO:0051770 | positive regulation of nitric-oxide synthase biosynthetic process(GO:0051770) |
| 0.1 | 2.3 | GO:0007214 | gamma-aminobutyric acid signaling pathway(GO:0007214) |
| 0.1 | 0.1 | GO:0048194 | Golgi vesicle budding(GO:0048194) |
| 0.1 | 2.1 | GO:0006656 | phosphatidylcholine biosynthetic process(GO:0006656) |
| 0.1 | 0.1 | GO:0071317 | cellular response to morphine(GO:0071315) cellular response to isoquinoline alkaloid(GO:0071317) |
| 0.1 | 0.3 | GO:0038016 | insulin receptor internalization(GO:0038016) |
| 0.1 | 0.7 | GO:1904424 | regulation of GTP binding(GO:1904424) |
| 0.1 | 0.3 | GO:0048104 | establishment of body hair or bristle planar orientation(GO:0048104) establishment of body hair planar orientation(GO:0048105) |
| 0.1 | 0.8 | GO:0035825 | reciprocal meiotic recombination(GO:0007131) reciprocal DNA recombination(GO:0035825) |
| 0.1 | 0.5 | GO:0006751 | glutathione catabolic process(GO:0006751) |
| 0.1 | 0.6 | GO:0035494 | SNARE complex disassembly(GO:0035494) |
| 0.1 | 0.2 | GO:0071550 | death-inducing signaling complex assembly(GO:0071550) |
| 0.1 | 0.9 | GO:0097067 | cellular response to thyroid hormone stimulus(GO:0097067) |
| 0.1 | 0.3 | GO:0015985 | energy coupled proton transport, down electrochemical gradient(GO:0015985) ATP synthesis coupled proton transport(GO:0015986) |
| 0.1 | 0.3 | GO:0046963 | 3'-phosphoadenosine 5'-phosphosulfate transport(GO:0046963) 3'-phospho-5'-adenylyl sulfate transmembrane transport(GO:1902559) |
| 0.1 | 0.1 | GO:0060285 | cilium-dependent cell motility(GO:0060285) |
| 0.1 | 5.0 | GO:0043966 | histone H3 acetylation(GO:0043966) |
| 0.1 | 0.1 | GO:0007210 | serotonin receptor signaling pathway(GO:0007210) positive regulation of phosphatidylinositol biosynthetic process(GO:0010513) |
| 0.1 | 0.2 | GO:1902035 | positive regulation of hematopoietic stem cell proliferation(GO:1902035) |
| 0.1 | 0.5 | GO:0044598 | polyketide metabolic process(GO:0030638) daunorubicin metabolic process(GO:0044597) doxorubicin metabolic process(GO:0044598) |
| 0.1 | 1.8 | GO:0048265 | response to pain(GO:0048265) |
| 0.1 | 0.5 | GO:0051415 | interphase microtubule nucleation by interphase microtubule organizing center(GO:0051415) microtubule nucleation by microtubule organizing center(GO:0051418) |
| 0.1 | 0.1 | GO:0044335 | canonical Wnt signaling pathway involved in neural crest cell differentiation(GO:0044335) |
| 0.1 | 0.6 | GO:0060081 | membrane hyperpolarization(GO:0060081) |
| 0.1 | 0.6 | GO:0031573 | intra-S DNA damage checkpoint(GO:0031573) |
| 0.1 | 0.1 | GO:0033385 | geranylgeranyl diphosphate metabolic process(GO:0033385) geranylgeranyl diphosphate biosynthetic process(GO:0033386) |
| 0.1 | 0.3 | GO:0006393 | termination of mitochondrial transcription(GO:0006393) |
| 0.1 | 0.4 | GO:0071044 | histone mRNA catabolic process(GO:0071044) |
| 0.1 | 3.1 | GO:0048791 | calcium ion-regulated exocytosis of neurotransmitter(GO:0048791) |
| 0.1 | 0.6 | GO:2001206 | positive regulation of osteoclast development(GO:2001206) |
| 0.1 | 0.2 | GO:0001543 | ovarian follicle rupture(GO:0001543) |
| 0.1 | 1.0 | GO:0006776 | vitamin A metabolic process(GO:0006776) |
| 0.1 | 0.7 | GO:0048681 | negative regulation of axon regeneration(GO:0048681) |
| 0.1 | 0.1 | GO:0032696 | negative regulation of interleukin-13 production(GO:0032696) |
| 0.1 | 0.2 | GO:1900425 | negative regulation of defense response to bacterium(GO:1900425) |
| 0.1 | 1.3 | GO:1900087 | positive regulation of G1/S transition of mitotic cell cycle(GO:1900087) |
| 0.1 | 0.4 | GO:0034982 | mitochondrial protein processing(GO:0034982) |
| 0.1 | 0.2 | GO:0030187 | melatonin metabolic process(GO:0030186) melatonin biosynthetic process(GO:0030187) |
| 0.1 | 0.2 | GO:0002384 | hepatic immune response(GO:0002384) |
| 0.1 | 0.2 | GO:0019471 | 4-hydroxyproline metabolic process(GO:0019471) |
| 0.1 | 0.6 | GO:0043383 | negative T cell selection(GO:0043383) |
| 0.1 | 0.3 | GO:0043578 | nuclear matrix organization(GO:0043578) |
| 0.1 | 0.1 | GO:0051901 | positive regulation of mitochondrial depolarization(GO:0051901) |
| 0.1 | 0.2 | GO:0035518 | histone H2A monoubiquitination(GO:0035518) |
| 0.1 | 0.2 | GO:0070672 | response to interleukin-15(GO:0070672) |
| 0.1 | 0.5 | GO:0001887 | selenium compound metabolic process(GO:0001887) |
| 0.1 | 0.4 | GO:0007406 | negative regulation of neuroblast proliferation(GO:0007406) |
| 0.1 | 0.2 | GO:0032228 | regulation of synaptic transmission, GABAergic(GO:0032228) |
| 0.1 | 1.7 | GO:0015721 | bile acid and bile salt transport(GO:0015721) |
| 0.1 | 0.1 | GO:0035845 | photoreceptor cell outer segment organization(GO:0035845) |
| 0.1 | 0.3 | GO:0035750 | protein localization to myelin sheath abaxonal region(GO:0035750) |
| 0.1 | 0.5 | GO:0010992 | ubiquitin homeostasis(GO:0010992) |
| 0.1 | 0.5 | GO:1990834 | response to odorant(GO:1990834) |
| 0.1 | 0.3 | GO:0090487 | toxin catabolic process(GO:0009407) secondary metabolite catabolic process(GO:0090487) |
| 0.1 | 0.1 | GO:0030242 | pexophagy(GO:0030242) |
| 0.1 | 0.8 | GO:0016998 | cell wall macromolecule catabolic process(GO:0016998) |
| 0.1 | 0.3 | GO:0002329 | pre-B cell differentiation(GO:0002329) |
| 0.1 | 0.1 | GO:0048318 | axial mesoderm development(GO:0048318) |
| 0.1 | 5.0 | GO:0010257 | NADH dehydrogenase complex assembly(GO:0010257) mitochondrial respiratory chain complex I assembly(GO:0032981) mitochondrial respiratory chain complex I biogenesis(GO:0097031) |
| 0.1 | 0.3 | GO:0010310 | regulation of hydrogen peroxide metabolic process(GO:0010310) |
| 0.1 | 1.0 | GO:0090361 | platelet-derived growth factor production(GO:0090360) regulation of platelet-derived growth factor production(GO:0090361) |
| 0.1 | 0.3 | GO:1902037 | negative regulation of hematopoietic stem cell differentiation(GO:1902037) |
| 0.1 | 1.7 | GO:0036297 | interstrand cross-link repair(GO:0036297) |
| 0.1 | 4.5 | GO:0016126 | sterol biosynthetic process(GO:0016126) |
| 0.1 | 0.2 | GO:0016973 | poly(A)+ mRNA export from nucleus(GO:0016973) |
| 0.1 | 1.9 | GO:0070534 | protein K63-linked ubiquitination(GO:0070534) |
| 0.1 | 0.2 | GO:0036091 | positive regulation of transcription from RNA polymerase II promoter in response to oxidative stress(GO:0036091) |
| 0.1 | 5.4 | GO:0010923 | negative regulation of phosphatase activity(GO:0010923) |
| 0.1 | 0.2 | GO:0072734 | response to staurosporine(GO:0072733) cellular response to staurosporine(GO:0072734) |
| 0.1 | 0.4 | GO:0048712 | negative regulation of astrocyte differentiation(GO:0048712) |
| 0.1 | 0.5 | GO:0048853 | forebrain morphogenesis(GO:0048853) |
| 0.1 | 2.4 | GO:0007223 | Wnt signaling pathway, calcium modulating pathway(GO:0007223) |
| 0.1 | 0.6 | GO:0071218 | cellular response to misfolded protein(GO:0071218) |
| 0.1 | 1.7 | GO:0032392 | DNA geometric change(GO:0032392) |
| 0.1 | 0.3 | GO:0035544 | negative regulation of SNARE complex assembly(GO:0035544) |
| 0.1 | 0.2 | GO:0071109 | superior temporal gyrus development(GO:0071109) |
| 0.1 | 0.3 | GO:0061343 | cell adhesion involved in heart morphogenesis(GO:0061343) |
| 0.1 | 0.4 | GO:0042219 | cellular modified amino acid catabolic process(GO:0042219) |
| 0.1 | 0.6 | GO:1901299 | negative regulation of hydrogen peroxide-mediated programmed cell death(GO:1901299) |
| 0.1 | 0.1 | GO:0046532 | regulation of photoreceptor cell differentiation(GO:0046532) |
| 0.1 | 0.3 | GO:0010359 | regulation of anion channel activity(GO:0010359) |
| 0.1 | 0.8 | GO:1901223 | negative regulation of NIK/NF-kappaB signaling(GO:1901223) |
| 0.1 | 0.3 | GO:0042074 | cell migration involved in gastrulation(GO:0042074) |
| 0.1 | 1.6 | GO:0099517 | anterograde synaptic vesicle transport(GO:0048490) synaptic vesicle cytoskeletal transport(GO:0099514) synaptic vesicle transport along microtubule(GO:0099517) |
| 0.1 | 0.2 | GO:0002121 | inter-male aggressive behavior(GO:0002121) |
| 0.1 | 0.6 | GO:0045063 | T-helper 1 cell differentiation(GO:0045063) |
| 0.1 | 0.3 | GO:0019441 | tryptophan catabolic process to kynurenine(GO:0019441) |
| 0.0 | 1.4 | GO:0032786 | positive regulation of DNA-templated transcription, elongation(GO:0032786) |
| 0.0 | 0.3 | GO:0048280 | vesicle fusion with Golgi apparatus(GO:0048280) |
| 0.0 | 0.2 | GO:0098904 | regulation of AV node cell action potential(GO:0098904) |
| 0.0 | 0.3 | GO:0001866 | NK T cell proliferation(GO:0001866) |
| 0.0 | 1.4 | GO:0009452 | 7-methylguanosine RNA capping(GO:0009452) RNA capping(GO:0036260) |
| 0.0 | 0.1 | GO:0031645 | negative regulation of neurological system process(GO:0031645) |
| 0.0 | 0.8 | GO:0050995 | negative regulation of lipid catabolic process(GO:0050995) |
| 0.0 | 0.7 | GO:1902932 | positive regulation of alcohol biosynthetic process(GO:1902932) |
| 0.0 | 0.2 | GO:0001777 | T cell homeostatic proliferation(GO:0001777) regulation of T cell homeostatic proliferation(GO:0046013) |
| 0.0 | 0.1 | GO:0003032 | detection of oxygen(GO:0003032) |
| 0.0 | 0.0 | GO:0061484 | hematopoietic stem cell homeostasis(GO:0061484) |
| 0.0 | 0.3 | GO:0030321 | transepithelial chloride transport(GO:0030321) |
| 0.0 | 3.7 | GO:0006890 | retrograde vesicle-mediated transport, Golgi to ER(GO:0006890) |
| 0.0 | 1.3 | GO:0048268 | clathrin coat assembly(GO:0048268) |
| 0.0 | 0.2 | GO:0014010 | Schwann cell proliferation(GO:0014010) |
| 0.0 | 0.3 | GO:0042539 | hypotonic salinity response(GO:0042539) cellular hypotonic salinity response(GO:0071477) |
| 0.0 | 0.7 | GO:0090141 | positive regulation of mitochondrial fission(GO:0090141) |
| 0.0 | 1.5 | GO:1903959 | regulation of anion transmembrane transport(GO:1903959) |
| 0.0 | 0.4 | GO:0046826 | negative regulation of protein export from nucleus(GO:0046826) |
| 0.0 | 0.2 | GO:0035751 | regulation of lysosomal lumen pH(GO:0035751) |
| 0.0 | 0.0 | GO:0061101 | neuroendocrine cell differentiation(GO:0061101) |
| 0.0 | 0.4 | GO:0017182 | peptidyl-diphthamide metabolic process(GO:0017182) peptidyl-diphthamide biosynthetic process from peptidyl-histidine(GO:0017183) |
| 0.0 | 0.6 | GO:0033227 | dsRNA transport(GO:0033227) |
| 0.0 | 0.3 | GO:0048710 | regulation of astrocyte differentiation(GO:0048710) |
| 0.0 | 0.1 | GO:0043653 | mitochondrial fragmentation involved in apoptotic process(GO:0043653) |
| 0.0 | 0.3 | GO:0072033 | renal vesicle formation(GO:0072033) |
| 0.0 | 0.2 | GO:0060335 | positive regulation of response to interferon-gamma(GO:0060332) positive regulation of interferon-gamma-mediated signaling pathway(GO:0060335) |
| 0.0 | 0.0 | GO:0098905 | regulation of bundle of His cell action potential(GO:0098905) |
| 0.0 | 0.9 | GO:0051123 | RNA polymerase II transcriptional preinitiation complex assembly(GO:0051123) |
| 0.0 | 0.7 | GO:0030150 | protein import into mitochondrial matrix(GO:0030150) |
| 0.0 | 0.6 | GO:0015886 | heme transport(GO:0015886) |
| 0.0 | 0.4 | GO:0050957 | equilibrioception(GO:0050957) |
| 0.0 | 0.8 | GO:2000251 | positive regulation of actin cytoskeleton reorganization(GO:2000251) |
| 0.0 | 0.2 | GO:0070940 | dephosphorylation of RNA polymerase II C-terminal domain(GO:0070940) |
| 0.0 | 0.1 | GO:2000583 | regulation of platelet-derived growth factor receptor-alpha signaling pathway(GO:2000583) negative regulation of platelet-derived growth factor receptor-alpha signaling pathway(GO:2000584) |
| 0.0 | 0.2 | GO:0042636 | negative regulation of hair cycle(GO:0042636) |
| 0.0 | 0.2 | GO:0071418 | cellular response to amine stimulus(GO:0071418) |
| 0.0 | 0.4 | GO:0035879 | plasma membrane lactate transport(GO:0035879) |
| 0.0 | 0.4 | GO:0035082 | axoneme assembly(GO:0035082) |
| 0.0 | 0.1 | GO:0042987 | amyloid precursor protein catabolic process(GO:0042987) |
| 0.0 | 0.2 | GO:1904152 | regulation of retrograde protein transport, ER to cytosol(GO:1904152) |
| 0.0 | 3.7 | GO:0006369 | termination of RNA polymerase II transcription(GO:0006369) |
| 0.0 | 1.1 | GO:0045736 | negative regulation of cyclin-dependent protein serine/threonine kinase activity(GO:0045736) |
| 0.0 | 0.4 | GO:0007097 | nuclear migration(GO:0007097) |
| 0.0 | 0.1 | GO:0019563 | glycerol catabolic process(GO:0019563) |
| 0.0 | 0.5 | GO:0030201 | heparan sulfate proteoglycan metabolic process(GO:0030201) |
| 0.0 | 0.3 | GO:1900246 | positive regulation of RIG-I signaling pathway(GO:1900246) |
| 0.0 | 0.3 | GO:0071340 | skeletal muscle acetylcholine-gated channel clustering(GO:0071340) |
| 0.0 | 0.8 | GO:0051194 | positive regulation of cofactor metabolic process(GO:0051194) positive regulation of coenzyme metabolic process(GO:0051197) |
| 0.0 | 1.6 | GO:0006368 | transcription elongation from RNA polymerase II promoter(GO:0006368) |
| 0.0 | 1.0 | GO:0043968 | histone H2A acetylation(GO:0043968) |
| 0.0 | 0.2 | GO:0032914 | positive regulation of transforming growth factor beta1 production(GO:0032914) |
| 0.0 | 0.2 | GO:0071502 | cellular response to temperature stimulus(GO:0071502) |
| 0.0 | 0.3 | GO:0032754 | positive regulation of interleukin-5 production(GO:0032754) |
| 0.0 | 0.4 | GO:1900016 | negative regulation of cytokine production involved in inflammatory response(GO:1900016) |
| 0.0 | 0.2 | GO:0035022 | positive regulation of Rac protein signal transduction(GO:0035022) |
| 0.0 | 4.1 | GO:0031338 | regulation of vesicle fusion(GO:0031338) |
| 0.0 | 0.2 | GO:0060124 | positive regulation of growth hormone secretion(GO:0060124) |
| 0.0 | 0.5 | GO:0001514 | selenocysteine incorporation(GO:0001514) translational readthrough(GO:0006451) |
| 0.0 | 3.0 | GO:0007218 | neuropeptide signaling pathway(GO:0007218) |
| 0.0 | 0.2 | GO:0042748 | circadian sleep/wake cycle, non-REM sleep(GO:0042748) |
| 0.0 | 0.1 | GO:0048386 | positive regulation of retinoic acid receptor signaling pathway(GO:0048386) |
| 0.0 | 1.6 | GO:0010501 | RNA secondary structure unwinding(GO:0010501) |
| 0.0 | 0.6 | GO:0003322 | pancreatic A cell development(GO:0003322) |
| 0.0 | 0.1 | GO:0045040 | protein import into mitochondrial outer membrane(GO:0045040) |
| 0.0 | 0.0 | GO:1990086 | lens fiber cell apoptotic process(GO:1990086) |
| 0.0 | 2.8 | GO:0045454 | cell redox homeostasis(GO:0045454) |
| 0.0 | 0.4 | GO:0000055 | ribosomal large subunit export from nucleus(GO:0000055) |
| 0.0 | 0.1 | GO:2000051 | negative regulation of non-canonical Wnt signaling pathway(GO:2000051) |
| 0.0 | 0.4 | GO:0046415 | urate metabolic process(GO:0046415) |
| 0.0 | 0.1 | GO:0044240 | multicellular organism lipid catabolic process(GO:0044240) |
| 0.0 | 0.3 | GO:0061737 | leukotriene signaling pathway(GO:0061737) |
| 0.0 | 0.1 | GO:0007320 | insemination(GO:0007320) |
| 0.0 | 0.7 | GO:0061470 | T follicular helper cell differentiation(GO:0061470) |
| 0.0 | 1.5 | GO:0051865 | protein autoubiquitination(GO:0051865) |
| 0.0 | 0.1 | GO:0070102 | interleukin-6-mediated signaling pathway(GO:0070102) |
| 0.0 | 0.2 | GO:1904293 | negative regulation of ERAD pathway(GO:1904293) |
| 0.0 | 0.7 | GO:0006895 | Golgi to endosome transport(GO:0006895) |
| 0.0 | 0.5 | GO:0034204 | lipid translocation(GO:0034204) |
| 0.0 | 0.9 | GO:0007099 | centriole replication(GO:0007099) |
| 0.0 | 0.1 | GO:0043504 | mitochondrial DNA repair(GO:0043504) |
| 0.0 | 0.5 | GO:0007158 | neuron cell-cell adhesion(GO:0007158) |
| 0.0 | 0.1 | GO:0019355 | nicotinamide nucleotide biosynthetic process from aspartate(GO:0019355) 'de novo' NAD biosynthetic process from aspartate(GO:0034628) |
| 0.0 | 5.6 | GO:0000209 | protein polyubiquitination(GO:0000209) |
| 0.0 | 0.4 | GO:0051661 | maintenance of centrosome location(GO:0051661) |
| 0.0 | 0.0 | GO:1900221 | regulation of beta-amyloid clearance(GO:1900221) |
| 0.0 | 0.1 | GO:0048560 | establishment of anatomical structure orientation(GO:0048560) establishment of organ orientation(GO:0048561) |
| 0.0 | 0.1 | GO:1902896 | terminal web assembly(GO:1902896) |
| 0.0 | 0.1 | GO:0046900 | tetrahydrofolylpolyglutamate metabolic process(GO:0046900) |
| 0.0 | 0.5 | GO:0033139 | regulation of peptidyl-serine phosphorylation of STAT protein(GO:0033139) positive regulation of peptidyl-serine phosphorylation of STAT protein(GO:0033141) |
| 0.0 | 0.2 | GO:0045724 | positive regulation of cilium assembly(GO:0045724) |
| 0.0 | 0.6 | GO:0016024 | CDP-diacylglycerol biosynthetic process(GO:0016024) |
| 0.0 | 0.0 | GO:1990637 | response to prolactin(GO:1990637) |
| 0.0 | 0.1 | GO:0045348 | positive regulation of MHC class II biosynthetic process(GO:0045348) |
| 0.0 | 0.1 | GO:0036233 | glycine import(GO:0036233) |
| 0.0 | 0.1 | GO:0060011 | Sertoli cell proliferation(GO:0060011) |
| 0.0 | 0.1 | GO:0002666 | positive regulation of T cell tolerance induction(GO:0002666) |
| 0.0 | 0.5 | GO:0006590 | thyroid hormone generation(GO:0006590) |
| 0.0 | 0.2 | GO:0001672 | regulation of chromatin assembly or disassembly(GO:0001672) |
| 0.0 | 0.4 | GO:0010165 | response to X-ray(GO:0010165) |
| 0.0 | 0.2 | GO:0002225 | positive regulation of antimicrobial peptide production(GO:0002225) regulation of antimicrobial peptide production(GO:0002784) regulation of antibacterial peptide production(GO:0002786) positive regulation of antibacterial peptide production(GO:0002803) |
| 0.0 | 1.9 | GO:0051965 | positive regulation of synapse assembly(GO:0051965) |
| 0.0 | 9.0 | GO:0007283 | spermatogenesis(GO:0007283) |
| 0.0 | 0.1 | GO:0070269 | pyroptosis(GO:0070269) |
| 0.0 | 0.1 | GO:0002432 | granuloma formation(GO:0002432) |
| 0.0 | 0.1 | GO:0034433 | steroid esterification(GO:0034433) sterol esterification(GO:0034434) cholesterol esterification(GO:0034435) |
| 0.0 | 0.1 | GO:0006295 | nucleotide-excision repair, DNA incision, 3'-to lesion(GO:0006295) nucleotide-excision repair, DNA incision(GO:0033683) |
| 0.0 | 0.1 | GO:0097503 | sialylation(GO:0097503) |
| 0.0 | 0.2 | GO:0001964 | startle response(GO:0001964) |
| 0.0 | 0.1 | GO:0002904 | positive regulation of B cell apoptotic process(GO:0002904) |
| 0.0 | 1.3 | GO:0000413 | protein peptidyl-prolyl isomerization(GO:0000413) |
| 0.0 | 0.1 | GO:0006015 | 5-phosphoribose 1-diphosphate biosynthetic process(GO:0006015) 5-phosphoribose 1-diphosphate metabolic process(GO:0046391) |
| 0.0 | 0.0 | GO:0060028 | convergent extension involved in axis elongation(GO:0060028) |
| 0.0 | 0.2 | GO:0007530 | sex determination(GO:0007530) |
| 0.0 | 0.1 | GO:0002752 | cell surface pattern recognition receptor signaling pathway(GO:0002752) |
| 0.0 | 0.6 | GO:0035590 | purinergic nucleotide receptor signaling pathway(GO:0035590) |
| 0.0 | 0.0 | GO:0007386 | compartment pattern specification(GO:0007386) |
| 0.0 | 0.7 | GO:0031146 | SCF-dependent proteasomal ubiquitin-dependent protein catabolic process(GO:0031146) |
| 0.0 | 0.1 | GO:1903206 | negative regulation of response to reactive oxygen species(GO:1901032) negative regulation of hydrogen peroxide-induced cell death(GO:1903206) |
| 0.0 | 0.5 | GO:0000724 | double-strand break repair via homologous recombination(GO:0000724) recombinational repair(GO:0000725) |
| 0.0 | 0.3 | GO:0051560 | mitochondrial calcium ion homeostasis(GO:0051560) |
| 0.0 | 0.1 | GO:1990022 | RNA polymerase II complex import to nucleus(GO:0044376) RNA polymerase III complex localization to nucleus(GO:1990022) |
| 0.0 | 0.2 | GO:0021603 | cranial nerve formation(GO:0021603) |
| 0.0 | 0.2 | GO:0015727 | lactate transport(GO:0015727) lactate transmembrane transport(GO:0035873) |
| 0.0 | 0.1 | GO:0000466 | maturation of 5.8S rRNA from tricistronic rRNA transcript (SSU-rRNA, 5.8S rRNA, LSU-rRNA)(GO:0000466) |
| 0.0 | 0.1 | GO:0048539 | bone marrow development(GO:0048539) |
| 0.0 | 0.1 | GO:0008595 | tripartite regional subdivision(GO:0007351) anterior/posterior axis specification, embryo(GO:0008595) |
| 0.0 | 0.0 | GO:0090671 | RNA localization to Cajal body(GO:0090670) telomerase RNA localization to Cajal body(GO:0090671) telomerase RNA localization(GO:0090672) |
| 0.0 | 0.3 | GO:0002430 | complement receptor mediated signaling pathway(GO:0002430) |
| 0.0 | 0.5 | GO:0043555 | regulation of translation in response to stress(GO:0043555) |
| 0.0 | 0.2 | GO:0097242 | beta-amyloid clearance(GO:0097242) |
| 0.0 | 0.2 | GO:0000160 | phosphorelay signal transduction system(GO:0000160) |
| 0.0 | 0.0 | GO:0032959 | inositol trisphosphate biosynthetic process(GO:0032959) |
| 0.0 | 0.1 | GO:0006547 | histidine metabolic process(GO:0006547) |
| 0.0 | 0.5 | GO:0001502 | cartilage condensation(GO:0001502) |
| 0.0 | 0.1 | GO:0036118 | hyaluranon cable assembly(GO:0036118) regulation of hyaluranon cable assembly(GO:1900104) positive regulation of hyaluranon cable assembly(GO:1900106) |
| 0.0 | 0.4 | GO:0016574 | histone ubiquitination(GO:0016574) |
| 0.0 | 0.0 | GO:0060123 | regulation of growth hormone secretion(GO:0060123) |
| 0.0 | 0.1 | GO:0070602 | regulation of centromeric sister chromatid cohesion(GO:0070602) |
| 0.0 | 0.1 | GO:0052501 | induction of programmed cell death(GO:0012502) positive regulation of apoptotic process in other organism(GO:0044533) positive regulation by symbiont of host programmed cell death(GO:0052042) positive regulation by organism of programmed cell death in other organism involved in symbiotic interaction(GO:0052330) positive regulation by organism of apoptotic process in other organism involved in symbiotic interaction(GO:0052501) |
| 0.0 | 0.0 | GO:0042256 | mature ribosome assembly(GO:0042256) |
| 0.0 | 0.0 | GO:0034392 | negative regulation of smooth muscle cell apoptotic process(GO:0034392) |
| 0.0 | 0.1 | GO:0060462 | lung lobe development(GO:0060462) lung lobe morphogenesis(GO:0060463) |
| 0.0 | 0.0 | GO:0051790 | short-chain fatty acid biosynthetic process(GO:0051790) |
| 0.0 | 0.0 | GO:0031133 | regulation of axon diameter(GO:0031133) |
| 0.0 | 0.3 | GO:0045954 | positive regulation of natural killer cell mediated cytotoxicity(GO:0045954) |
| 0.0 | 0.1 | GO:0016246 | RNA interference(GO:0016246) |
| 0.0 | 0.1 | GO:0071285 | cellular response to lithium ion(GO:0071285) |
| 0.0 | 0.1 | GO:0070124 | mitochondrial translational initiation(GO:0070124) |
| 0.0 | 0.1 | GO:0097021 | lymphocyte migration into lymphoid organs(GO:0097021) |
| 0.0 | 0.0 | GO:0071043 | CUT catabolic process(GO:0071034) CUT metabolic process(GO:0071043) |
| 0.0 | 0.1 | GO:0080009 | mRNA methylation(GO:0080009) |
| 0.0 | 0.0 | GO:0055070 | copper ion homeostasis(GO:0055070) |
| 0.0 | 0.2 | GO:0006957 | complement activation, alternative pathway(GO:0006957) |
| 0.0 | 0.1 | GO:0046946 | hydroxylysine metabolic process(GO:0046946) hydroxylysine biosynthetic process(GO:0046947) |
| 0.0 | 0.1 | GO:0006684 | sphingomyelin metabolic process(GO:0006684) |
| 0.0 | 0.0 | GO:0000098 | sulfur amino acid catabolic process(GO:0000098) |
| 0.0 | 0.0 | GO:0008608 | attachment of spindle microtubules to kinetochore(GO:0008608) |
| 0.0 | 0.1 | GO:0046035 | CMP salvage(GO:0006238) CMP biosynthetic process(GO:0009224) CMP metabolic process(GO:0046035) |
| 0.0 | 0.3 | GO:0006283 | transcription-coupled nucleotide-excision repair(GO:0006283) |
| 0.0 | 0.1 | GO:0000012 | single strand break repair(GO:0000012) |
| 0.0 | 0.5 | GO:0050690 | regulation of defense response to virus by virus(GO:0050690) |
| 0.0 | 0.2 | GO:0018094 | protein polyglycylation(GO:0018094) |
| 0.0 | 0.1 | GO:0015684 | ferrous iron transport(GO:0015684) ferrous iron transmembrane transport(GO:1903874) |
| 0.0 | 0.5 | GO:0032007 | negative regulation of TOR signaling(GO:0032007) |
| 0.0 | 0.0 | GO:0002590 | regulation of antigen processing and presentation of peptide antigen via MHC class I(GO:0002589) negative regulation of antigen processing and presentation of peptide antigen via MHC class I(GO:0002590) |
| 0.0 | 0.1 | GO:0072675 | osteoclast fusion(GO:0072675) |
| 0.0 | 0.5 | GO:0050912 | detection of chemical stimulus involved in sensory perception of taste(GO:0050912) |
| 0.0 | 0.1 | GO:0006044 | N-acetylglucosamine metabolic process(GO:0006044) |
| 0.0 | 0.1 | GO:0006896 | Golgi to vacuole transport(GO:0006896) |
| 0.0 | 0.2 | GO:1902259 | regulation of delayed rectifier potassium channel activity(GO:1902259) |
Gene overrepresentation in cellular component category:
| Log-likelihood per target | Total log-likelihood | Term | Description |
|---|---|---|---|
| 2.7 | 10.9 | GO:0034365 | discoidal high-density lipoprotein particle(GO:0034365) |
| 1.7 | 8.6 | GO:0005960 | glycine cleavage complex(GO:0005960) |
| 1.5 | 6.2 | GO:0097229 | sperm end piece(GO:0097229) |
| 1.4 | 8.5 | GO:0034363 | intermediate-density lipoprotein particle(GO:0034363) |
| 1.1 | 4.6 | GO:0043293 | apoptosome(GO:0043293) |
| 1.0 | 10.1 | GO:0030893 | meiotic cohesin complex(GO:0030893) |
| 1.0 | 4.0 | GO:0005745 | m-AAA complex(GO:0005745) |
| 0.9 | 4.7 | GO:0032937 | SREBP-SCAP-Insig complex(GO:0032937) |
| 0.9 | 3.7 | GO:0035517 | PR-DUB complex(GO:0035517) |
| 0.9 | 5.5 | GO:0016035 | zeta DNA polymerase complex(GO:0016035) |
| 0.9 | 2.7 | GO:0075341 | host cell PML body(GO:0075341) |
| 0.9 | 2.6 | GO:1990332 | Ire1 complex(GO:1990332) |
| 0.8 | 3.4 | GO:0002189 | ribose phosphate diphosphokinase complex(GO:0002189) |
| 0.8 | 14.6 | GO:0033391 | chromatoid body(GO:0033391) |
| 0.8 | 9.6 | GO:0030061 | mitochondrial crista(GO:0030061) |
| 0.8 | 6.4 | GO:0070554 | synaptobrevin 2-SNAP-25-syntaxin-3-complexin complex(GO:0070554) |
| 0.8 | 12.0 | GO:1990712 | HFE-transferrin receptor complex(GO:1990712) |
| 0.7 | 1.4 | GO:1990923 | PET complex(GO:1990923) |
| 0.7 | 3.4 | GO:0005726 | perichromatin fibrils(GO:0005726) |
| 0.7 | 2.0 | GO:0097418 | neurofibrillary tangle(GO:0097418) |
| 0.6 | 12.3 | GO:0034663 | endoplasmic reticulum chaperone complex(GO:0034663) |
| 0.6 | 4.5 | GO:0000801 | central element(GO:0000801) |
| 0.6 | 5.8 | GO:1990635 | proximal dendrite(GO:1990635) |
| 0.6 | 2.5 | GO:0097180 | protein C inhibitor-TMPRSS7 complex(GO:0036024) protein C inhibitor-TMPRSS11E complex(GO:0036025) protein C inhibitor-PLAT complex(GO:0036026) protein C inhibitor-PLAU complex(GO:0036027) protein C inhibitor-thrombin complex(GO:0036028) protein C inhibitor-KLK3 complex(GO:0036029) protein C inhibitor-plasma kallikrein complex(GO:0036030) serine protease inhibitor complex(GO:0097180) protein C inhibitor-coagulation factor V complex(GO:0097181) protein C inhibitor-coagulation factor Xa complex(GO:0097182) protein C inhibitor-coagulation factor XI complex(GO:0097183) |
| 0.6 | 5.7 | GO:0012507 | ER to Golgi transport vesicle membrane(GO:0012507) |
| 0.6 | 2.5 | GO:0098855 | HCN channel complex(GO:0098855) |
| 0.6 | 2.4 | GO:0008537 | proteasome activator complex(GO:0008537) |
| 0.6 | 3.7 | GO:0031436 | BRCA1-BARD1 complex(GO:0031436) |
| 0.6 | 2.3 | GO:0097196 | Shu complex(GO:0097196) |
| 0.6 | 3.4 | GO:0005968 | Rab-protein geranylgeranyltransferase complex(GO:0005968) |
| 0.5 | 6.9 | GO:0031298 | replication fork protection complex(GO:0031298) |
| 0.5 | 2.1 | GO:0071547 | piP-body(GO:0071547) |
| 0.5 | 2.1 | GO:0009328 | phenylalanine-tRNA ligase complex(GO:0009328) |
| 0.5 | 1.6 | GO:0044611 | nuclear pore inner ring(GO:0044611) |
| 0.5 | 11.0 | GO:0042627 | chylomicron(GO:0042627) |
| 0.5 | 2.6 | GO:0000126 | transcription factor TFIIIB complex(GO:0000126) |
| 0.5 | 2.1 | GO:0097543 | ciliary inversin compartment(GO:0097543) |
| 0.5 | 12.4 | GO:0032426 | stereocilium tip(GO:0032426) |
| 0.5 | 2.0 | GO:0031084 | BLOC-2 complex(GO:0031084) |
| 0.5 | 1.9 | GO:0097636 | intrinsic component of autophagosome membrane(GO:0097636) integral component of autophagosome membrane(GO:0097637) |
| 0.5 | 6.8 | GO:0044666 | MLL3/4 complex(GO:0044666) |
| 0.4 | 0.9 | GO:0030990 | intraciliary transport particle(GO:0030990) |
| 0.4 | 4.0 | GO:0071797 | LUBAC complex(GO:0071797) |
| 0.4 | 3.5 | GO:0030121 | AP-1 adaptor complex(GO:0030121) |
| 0.4 | 9.1 | GO:0005861 | troponin complex(GO:0005861) |
| 0.4 | 4.3 | GO:0070765 | gamma-secretase complex(GO:0070765) |
| 0.4 | 29.9 | GO:0031907 | peroxisomal matrix(GO:0005782) microbody lumen(GO:0031907) |
| 0.4 | 5.0 | GO:0005664 | origin recognition complex(GO:0000808) nuclear origin of replication recognition complex(GO:0005664) |
| 0.4 | 1.2 | GO:0002947 | tumor necrosis factor receptor superfamily complex(GO:0002947) |
| 0.4 | 1.2 | GO:0071546 | pi-body(GO:0071546) |
| 0.4 | 2.0 | GO:0016533 | cyclin-dependent protein kinase 5 holoenzyme complex(GO:0016533) |
| 0.4 | 1.2 | GO:0060987 | lipid tube(GO:0060987) |
| 0.4 | 2.7 | GO:0005784 | Sec61 translocon complex(GO:0005784) translocon complex(GO:0071256) |
| 0.4 | 1.1 | GO:0033011 | perinuclear theca(GO:0033011) |
| 0.4 | 3.4 | GO:0030868 | smooth endoplasmic reticulum membrane(GO:0030868) smooth endoplasmic reticulum part(GO:0097425) |
| 0.4 | 1.9 | GO:0002945 | cyclin K-CDK13 complex(GO:0002945) |
| 0.4 | 2.6 | GO:0032144 | 4-aminobutyrate transaminase complex(GO:0032144) |
| 0.4 | 5.6 | GO:0001673 | male germ cell nucleus(GO:0001673) |
| 0.4 | 0.7 | GO:0043159 | acrosomal matrix(GO:0043159) |
| 0.4 | 2.2 | GO:0043527 | tRNA methyltransferase complex(GO:0043527) |
| 0.4 | 1.1 | GO:0048788 | cytoskeleton of presynaptic active zone(GO:0048788) presynaptic active zone cytoplasmic component(GO:0098831) presynaptic cytoskeleton(GO:0099569) |
| 0.4 | 5.8 | GO:0031209 | SCAR complex(GO:0031209) |
| 0.4 | 2.1 | GO:0005958 | DNA-dependent protein kinase-DNA ligase 4 complex(GO:0005958) |
| 0.4 | 0.4 | GO:0034992 | microtubule organizing center attachment site(GO:0034992) LINC complex(GO:0034993) |
| 0.4 | 0.7 | GO:0097135 | cyclin E2-CDK2 complex(GO:0097135) |
| 0.4 | 6.4 | GO:0048188 | Set1C/COMPASS complex(GO:0048188) |
| 0.4 | 6.7 | GO:0045239 | tricarboxylic acid cycle enzyme complex(GO:0045239) |
| 0.3 | 4.2 | GO:0031010 | ISWI-type complex(GO:0031010) |
| 0.3 | 1.0 | GO:0005592 | collagen type XI trimer(GO:0005592) |
| 0.3 | 5.9 | GO:0070776 | H3 histone acetyltransferase complex(GO:0070775) MOZ/MORF histone acetyltransferase complex(GO:0070776) |
| 0.3 | 2.1 | GO:0031501 | mannosyltransferase complex(GO:0031501) |
| 0.3 | 5.5 | GO:0046581 | intercellular canaliculus(GO:0046581) |
| 0.3 | 1.4 | GO:0035525 | NF-kappaB p50/p65 complex(GO:0035525) |
| 0.3 | 0.7 | GO:0032807 | DNA ligase IV complex(GO:0032807) |
| 0.3 | 2.0 | GO:0043291 | RAVE complex(GO:0043291) |
| 0.3 | 4.7 | GO:0030314 | junctional membrane complex(GO:0030314) |
| 0.3 | 2.7 | GO:0070695 | FHF complex(GO:0070695) |
| 0.3 | 2.3 | GO:0043541 | UDP-N-acetylglucosamine transferase complex(GO:0043541) |
| 0.3 | 2.0 | GO:1990769 | proximal neuron projection(GO:1990769) |
| 0.3 | 3.3 | GO:0034366 | spherical high-density lipoprotein particle(GO:0034366) |
| 0.3 | 1.0 | GO:0048269 | methionine adenosyltransferase complex(GO:0048269) |
| 0.3 | 2.2 | GO:0008622 | epsilon DNA polymerase complex(GO:0008622) |
| 0.3 | 2.9 | GO:0005579 | membrane attack complex(GO:0005579) |
| 0.3 | 0.3 | GO:0000172 | ribonuclease MRP complex(GO:0000172) |
| 0.3 | 1.3 | GO:0034457 | Mpp10 complex(GO:0034457) |
| 0.3 | 1.9 | GO:0000214 | tRNA-intron endonuclease complex(GO:0000214) |
| 0.3 | 1.6 | GO:0045257 | mitochondrial respiratory chain complex II, succinate dehydrogenase complex (ubiquinone)(GO:0005749) succinate dehydrogenase complex (ubiquinone)(GO:0045257) respiratory chain complex II(GO:0045273) succinate dehydrogenase complex(GO:0045281) fumarate reductase complex(GO:0045283) |
| 0.3 | 3.4 | GO:0005964 | phosphorylase kinase complex(GO:0005964) |
| 0.3 | 3.1 | GO:0005827 | polar microtubule(GO:0005827) |
| 0.3 | 3.7 | GO:0016602 | CCAAT-binding factor complex(GO:0016602) |
| 0.3 | 3.6 | GO:0000015 | phosphopyruvate hydratase complex(GO:0000015) |
| 0.3 | 3.9 | GO:0070552 | BRISC complex(GO:0070552) |
| 0.3 | 7.6 | GO:0031045 | dense core granule(GO:0031045) |
| 0.3 | 0.3 | GO:0044292 | dendrite terminus(GO:0044292) |
| 0.3 | 5.0 | GO:0001520 | outer dense fiber(GO:0001520) |
| 0.3 | 0.9 | GO:0002178 | palmitoyltransferase complex(GO:0002178) |
| 0.3 | 5.5 | GO:0000124 | SAGA complex(GO:0000124) |
| 0.3 | 3.5 | GO:0071204 | histone pre-mRNA 3'end processing complex(GO:0071204) |
| 0.3 | 0.9 | GO:0033186 | CAF-1 complex(GO:0033186) |
| 0.3 | 1.1 | GO:0071817 | MMXD complex(GO:0071817) |
| 0.3 | 1.7 | GO:0017101 | aminoacyl-tRNA synthetase multienzyme complex(GO:0017101) |
| 0.3 | 0.3 | GO:0005945 | 6-phosphofructokinase complex(GO:0005945) |
| 0.3 | 1.9 | GO:0019034 | viral replication complex(GO:0019034) |
| 0.3 | 4.6 | GO:0030126 | COPI vesicle coat(GO:0030126) |
| 0.3 | 2.4 | GO:0030914 | STAGA complex(GO:0030914) |
| 0.3 | 13.4 | GO:0034451 | centriolar satellite(GO:0034451) |
| 0.3 | 4.8 | GO:0000800 | lateral element(GO:0000800) |
| 0.3 | 2.6 | GO:0005655 | nucleolar ribonuclease P complex(GO:0005655) |
| 0.3 | 1.0 | GO:0034455 | t-UTP complex(GO:0034455) |
| 0.3 | 2.4 | GO:0035032 | phosphatidylinositol 3-kinase complex, class III(GO:0035032) |
| 0.3 | 3.4 | GO:0070852 | cell body fiber(GO:0070852) |
| 0.3 | 7.4 | GO:0031231 | integral component of peroxisomal membrane(GO:0005779) intrinsic component of peroxisomal membrane(GO:0031231) |
| 0.2 | 2.7 | GO:0042382 | paraspeckles(GO:0042382) |
| 0.2 | 5.7 | GO:0032591 | dendritic spine membrane(GO:0032591) |
| 0.2 | 4.0 | GO:0071439 | clathrin complex(GO:0071439) |
| 0.2 | 10.3 | GO:0090545 | NuRD complex(GO:0016581) CHD-type complex(GO:0090545) |
| 0.2 | 0.7 | GO:0036284 | tubulobulbar complex(GO:0036284) |
| 0.2 | 1.7 | GO:0031262 | Ndc80 complex(GO:0031262) |
| 0.2 | 5.3 | GO:0097025 | MPP7-DLG1-LIN7 complex(GO:0097025) |
| 0.2 | 6.8 | GO:0031011 | Ino80 complex(GO:0031011) DNA helicase complex(GO:0033202) |
| 0.2 | 2.2 | GO:0030896 | checkpoint clamp complex(GO:0030896) |
| 0.2 | 1.2 | GO:0034753 | nuclear aryl hydrocarbon receptor complex(GO:0034753) |
| 0.2 | 0.7 | GO:0005663 | DNA replication factor C complex(GO:0005663) |
| 0.2 | 4.0 | GO:0030123 | AP-3 adaptor complex(GO:0030123) |
| 0.2 | 1.4 | GO:0000221 | vacuolar proton-transporting V-type ATPase, V1 domain(GO:0000221) |
| 0.2 | 0.9 | GO:0038038 | G-protein coupled receptor homodimeric complex(GO:0038038) |
| 0.2 | 1.6 | GO:0070545 | PeBoW complex(GO:0070545) |
| 0.2 | 1.8 | GO:0002169 | 3-methylcrotonyl-CoA carboxylase complex, mitochondrial(GO:0002169) methylcrotonoyl-CoA carboxylase complex(GO:1905202) |
| 0.2 | 2.3 | GO:0044294 | dendritic growth cone(GO:0044294) |
| 0.2 | 1.6 | GO:0000308 | cytoplasmic cyclin-dependent protein kinase holoenzyme complex(GO:0000308) |
| 0.2 | 2.2 | GO:0035068 | micro-ribonucleoprotein complex(GO:0035068) |
| 0.2 | 4.0 | GO:0043240 | Fanconi anaemia nuclear complex(GO:0043240) |
| 0.2 | 0.4 | GO:0020018 | ciliary pocket(GO:0020016) ciliary pocket membrane(GO:0020018) |
| 0.2 | 1.5 | GO:0033178 | proton-transporting two-sector ATPase complex, catalytic domain(GO:0033178) |
| 0.2 | 4.4 | GO:0032433 | filopodium tip(GO:0032433) |
| 0.2 | 1.1 | GO:0045272 | plasma membrane respiratory chain complex I(GO:0045272) plasma membrane respiratory chain(GO:0070470) |
| 0.2 | 4.2 | GO:0045179 | apical cortex(GO:0045179) |
| 0.2 | 1.7 | GO:0070847 | core mediator complex(GO:0070847) |
| 0.2 | 0.7 | GO:0030678 | mitochondrial ribonuclease P complex(GO:0030678) |
| 0.2 | 3.7 | GO:0035253 | ciliary rootlet(GO:0035253) |
| 0.2 | 2.8 | GO:0033588 | Elongator holoenzyme complex(GO:0033588) |
| 0.2 | 0.9 | GO:0030956 | glutamyl-tRNA(Gln) amidotransferase complex(GO:0030956) |
| 0.2 | 2.1 | GO:0031390 | Ctf18 RFC-like complex(GO:0031390) |
| 0.2 | 2.1 | GO:0000940 | condensed chromosome outer kinetochore(GO:0000940) |
| 0.2 | 4.7 | GO:0001741 | XY body(GO:0001741) |
| 0.2 | 6.2 | GO:0035098 | ESC/E(Z) complex(GO:0035098) |
| 0.2 | 24.2 | GO:0033116 | endoplasmic reticulum-Golgi intermediate compartment membrane(GO:0033116) |
| 0.2 | 3.8 | GO:0017146 | NMDA selective glutamate receptor complex(GO:0017146) |
| 0.2 | 0.6 | GO:0097123 | cyclin A1-CDK2 complex(GO:0097123) |
| 0.2 | 1.9 | GO:0030905 | retromer, tubulation complex(GO:0030905) |
| 0.2 | 14.3 | GO:0097542 | ciliary tip(GO:0097542) |
| 0.2 | 2.7 | GO:0005577 | fibrinogen complex(GO:0005577) |
| 0.2 | 11.0 | GO:0032281 | AMPA glutamate receptor complex(GO:0032281) |
| 0.2 | 3.6 | GO:0032039 | integrator complex(GO:0032039) |
| 0.2 | 1.0 | GO:0033596 | TSC1-TSC2 complex(GO:0033596) |
| 0.2 | 17.8 | GO:0005876 | spindle microtubule(GO:0005876) |
| 0.2 | 6.9 | GO:0031305 | intrinsic component of mitochondrial inner membrane(GO:0031304) integral component of mitochondrial inner membrane(GO:0031305) |
| 0.2 | 0.8 | GO:0032798 | Swi5-Sfr1 complex(GO:0032798) |
| 0.2 | 1.0 | GO:0098839 | postsynaptic density membrane(GO:0098839) |
| 0.2 | 9.0 | GO:1902710 | GABA receptor complex(GO:1902710) |
| 0.2 | 2.3 | GO:0033269 | internode region of axon(GO:0033269) |
| 0.2 | 1.6 | GO:0098845 | postsynaptic endosome(GO:0098845) |
| 0.2 | 1.0 | GO:0000839 | Hrd1p ubiquitin ligase ERAD-L complex(GO:0000839) |
| 0.2 | 1.7 | GO:0035686 | sperm fibrous sheath(GO:0035686) |
| 0.2 | 1.7 | GO:0044326 | dendritic spine neck(GO:0044326) |
| 0.2 | 3.5 | GO:0000780 | condensed nuclear chromosome, centromeric region(GO:0000780) |
| 0.2 | 3.3 | GO:0000786 | nucleosome(GO:0000786) |
| 0.2 | 0.8 | GO:0032391 | photoreceptor connecting cilium(GO:0032391) |
| 0.2 | 0.8 | GO:0035101 | FACT complex(GO:0035101) |
| 0.2 | 2.1 | GO:0005943 | phosphatidylinositol 3-kinase complex, class IA(GO:0005943) |
| 0.2 | 2.3 | GO:0070937 | CRD-mediated mRNA stability complex(GO:0070937) |
| 0.2 | 0.6 | GO:0000799 | nuclear condensin complex(GO:0000799) |
| 0.2 | 0.8 | GO:0045323 | interleukin-1 receptor complex(GO:0045323) |
| 0.2 | 0.9 | GO:0017109 | glutamate-cysteine ligase complex(GO:0017109) |
| 0.2 | 5.2 | GO:0031932 | TORC2 complex(GO:0031932) |
| 0.2 | 2.6 | GO:0031080 | nuclear pore outer ring(GO:0031080) |
| 0.2 | 1.3 | GO:0030289 | protein phosphatase 4 complex(GO:0030289) |
| 0.2 | 1.1 | GO:0043625 | delta DNA polymerase complex(GO:0043625) |
| 0.2 | 3.1 | GO:0030008 | TRAPP complex(GO:0030008) |
| 0.2 | 0.4 | GO:1902636 | kinociliary basal body(GO:1902636) |
| 0.2 | 6.1 | GO:0000314 | organellar small ribosomal subunit(GO:0000314) mitochondrial small ribosomal subunit(GO:0005763) |
| 0.2 | 2.2 | GO:0042105 | alpha-beta T cell receptor complex(GO:0042105) |
| 0.2 | 0.7 | GO:0005753 | mitochondrial proton-transporting ATP synthase complex(GO:0005753) proton-transporting ATP synthase complex(GO:0045259) |
| 0.2 | 2.3 | GO:0036128 | CatSper complex(GO:0036128) |
| 0.2 | 3.6 | GO:1990907 | beta-catenin-TCF complex(GO:1990907) |
| 0.2 | 0.4 | GO:0000229 | cytoplasmic chromosome(GO:0000229) |
| 0.2 | 0.5 | GO:0034515 | proteasome storage granule(GO:0034515) |
| 0.2 | 2.1 | GO:0045254 | pyruvate dehydrogenase complex(GO:0045254) |
| 0.2 | 1.4 | GO:0044614 | nuclear pore cytoplasmic filaments(GO:0044614) |
| 0.2 | 22.1 | GO:0032580 | Golgi cisterna membrane(GO:0032580) |
| 0.2 | 1.9 | GO:0031618 | nuclear pericentric heterochromatin(GO:0031618) |
| 0.2 | 2.8 | GO:0035631 | CD40 receptor complex(GO:0035631) |
| 0.2 | 1.2 | GO:0042272 | nuclear RNA export factor complex(GO:0042272) |
| 0.2 | 1.2 | GO:0019773 | proteasome core complex, alpha-subunit complex(GO:0019773) |
| 0.2 | 0.5 | GO:0036117 | hyaluranon cable(GO:0036117) |
| 0.2 | 1.0 | GO:0044214 | spanning component of plasma membrane(GO:0044214) spanning component of membrane(GO:0089717) |
| 0.2 | 1.2 | GO:0019907 | cyclin-dependent protein kinase activating kinase holoenzyme complex(GO:0019907) |
| 0.2 | 2.6 | GO:0031462 | Cul2-RING ubiquitin ligase complex(GO:0031462) |
| 0.2 | 2.2 | GO:0017119 | Golgi transport complex(GO:0017119) |
| 0.2 | 2.0 | GO:0097524 | sperm plasma membrane(GO:0097524) |
| 0.2 | 1.3 | GO:0033165 | interphotoreceptor matrix(GO:0033165) |
| 0.2 | 0.5 | GO:0009346 | citrate lyase complex(GO:0009346) |
| 0.2 | 0.5 | GO:0030526 | granulocyte macrophage colony-stimulating factor receptor complex(GO:0030526) |
| 0.2 | 0.7 | GO:0097545 | axonemal outer doublet(GO:0097545) |
| 0.2 | 1.0 | GO:0071942 | XPC complex(GO:0071942) |
| 0.2 | 0.5 | GO:0031074 | nucleocytoplasmic shuttling complex(GO:0031074) |
| 0.2 | 0.3 | GO:0000444 | MIS12/MIND type complex(GO:0000444) |
| 0.2 | 2.6 | GO:0036513 | Derlin-1 retrotranslocation complex(GO:0036513) |
| 0.2 | 4.2 | GO:0045009 | melanosome membrane(GO:0033162) chitosome(GO:0045009) |
| 0.2 | 1.6 | GO:0005672 | transcription factor TFIIA complex(GO:0005672) |
| 0.2 | 1.6 | GO:0008278 | cohesin complex(GO:0008278) |
| 0.2 | 1.1 | GO:0072589 | box H/ACA scaRNP complex(GO:0072589) box H/ACA telomerase RNP complex(GO:0090661) |
| 0.2 | 0.9 | GO:0000407 | pre-autophagosomal structure(GO:0000407) |
| 0.2 | 0.3 | GO:0031933 | telomeric heterochromatin(GO:0031933) |
| 0.2 | 11.1 | GO:0001917 | photoreceptor inner segment(GO:0001917) |
| 0.2 | 4.6 | GO:0035327 | transcriptionally active chromatin(GO:0035327) |
| 0.2 | 1.2 | GO:0044233 | ER-mitochondrion membrane contact site(GO:0044233) |
| 0.2 | 1.8 | GO:0008541 | proteasome regulatory particle, lid subcomplex(GO:0008541) |
| 0.2 | 4.9 | GO:0005892 | acetylcholine-gated channel complex(GO:0005892) |
| 0.2 | 0.9 | GO:1990876 | cytoplasmic side of nuclear pore(GO:1990876) |
| 0.2 | 0.6 | GO:0044307 | dendritic branch(GO:0044307) |
| 0.2 | 0.5 | GO:0032002 | interleukin-28 receptor complex(GO:0032002) |
| 0.1 | 11.9 | GO:0000313 | organellar ribosome(GO:0000313) mitochondrial ribosome(GO:0005761) |
| 0.1 | 1.9 | GO:0005721 | pericentric heterochromatin(GO:0005721) |
| 0.1 | 9.3 | GO:0000794 | condensed nuclear chromosome(GO:0000794) |
| 0.1 | 3.3 | GO:0070971 | endoplasmic reticulum exit site(GO:0070971) |
| 0.1 | 0.7 | GO:0097362 | MCM8-MCM9 complex(GO:0097362) |
| 0.1 | 1.4 | GO:0031464 | Cul4A-RING E3 ubiquitin ligase complex(GO:0031464) |
| 0.1 | 1.3 | GO:0036157 | outer dynein arm(GO:0036157) |
| 0.1 | 3.0 | GO:0097440 | apical dendrite(GO:0097440) |
| 0.1 | 2.7 | GO:0008385 | IkappaB kinase complex(GO:0008385) |
| 0.1 | 0.8 | GO:0061689 | tricellular tight junction(GO:0061689) |
| 0.1 | 75.7 | GO:0005759 | mitochondrial matrix(GO:0005759) |
| 0.1 | 0.5 | GO:0008275 | gamma-tubulin small complex(GO:0008275) |
| 0.1 | 1.6 | GO:0043190 | ATP-binding cassette (ABC) transporter complex(GO:0043190) |
| 0.1 | 10.0 | GO:0031903 | peroxisomal membrane(GO:0005778) microbody membrane(GO:0031903) |
| 0.1 | 1.3 | GO:0016442 | RISC complex(GO:0016442) RNAi effector complex(GO:0031332) |
| 0.1 | 1.6 | GO:0001940 | male pronucleus(GO:0001940) |
| 0.1 | 0.7 | GO:0016514 | SWI/SNF complex(GO:0016514) |
| 0.1 | 1.7 | GO:0070461 | SAGA-type complex(GO:0070461) |
| 0.1 | 1.7 | GO:0048500 | signal recognition particle(GO:0048500) |
| 0.1 | 0.9 | GO:0031417 | NatC complex(GO:0031417) |
| 0.1 | 0.8 | GO:0097136 | Bcl-2 family protein complex(GO:0097136) |
| 0.1 | 3.0 | GO:0016342 | catenin complex(GO:0016342) |
| 0.1 | 0.6 | GO:0072687 | meiotic spindle(GO:0072687) |
| 0.1 | 0.6 | GO:0001652 | granular component(GO:0001652) |
| 0.1 | 1.0 | GO:0032279 | asymmetric synapse(GO:0032279) |
| 0.1 | 4.3 | GO:0044298 | neuronal cell body membrane(GO:0032809) cell body membrane(GO:0044298) |
| 0.1 | 2.3 | GO:0033177 | proton-transporting two-sector ATPase complex, proton-transporting domain(GO:0033177) proton-transporting V-type ATPase, V0 domain(GO:0033179) |
| 0.1 | 0.1 | GO:0000805 | X chromosome(GO:0000805) |
| 0.1 | 5.1 | GO:0005801 | cis-Golgi network(GO:0005801) |
| 0.1 | 5.0 | GO:0071565 | nBAF complex(GO:0071565) |
| 0.1 | 0.8 | GO:0042583 | chromaffin granule(GO:0042583) |
| 0.1 | 0.8 | GO:0090568 | nuclear transcriptional repressor complex(GO:0090568) |
| 0.1 | 1.1 | GO:0031616 | spindle pole centrosome(GO:0031616) |
| 0.1 | 0.3 | GO:0042022 | interleukin-12 receptor complex(GO:0042022) |
| 0.1 | 1.0 | GO:1990316 | ATG1/ULK1 kinase complex(GO:1990316) |
| 0.1 | 0.3 | GO:0090651 | apical cytoplasm(GO:0090651) |
| 0.1 | 7.5 | GO:0030673 | axolemma(GO:0030673) |
| 0.1 | 0.2 | GO:0070939 | Dsl1p complex(GO:0070939) |
| 0.1 | 1.2 | GO:0005742 | mitochondrial outer membrane translocase complex(GO:0005742) |
| 0.1 | 0.3 | GO:0031085 | BLOC-3 complex(GO:0031085) |
| 0.1 | 1.4 | GO:0097346 | INO80-type complex(GO:0097346) |
| 0.1 | 0.6 | GO:0035339 | SPOTS complex(GO:0035339) |
| 0.1 | 1.9 | GO:0070822 | Sin3-type complex(GO:0070822) |
| 0.1 | 2.1 | GO:1902562 | NuA4 histone acetyltransferase complex(GO:0035267) H4/H2A histone acetyltransferase complex(GO:0043189) H4 histone acetyltransferase complex(GO:1902562) |
| 0.1 | 2.9 | GO:0005665 | DNA-directed RNA polymerase II, core complex(GO:0005665) |
| 0.1 | 0.8 | GO:0034388 | Pwp2p-containing subcomplex of 90S preribosome(GO:0034388) |
| 0.1 | 0.6 | GO:0044530 | supraspliceosomal complex(GO:0044530) |
| 0.1 | 1.1 | GO:0097539 | ciliary transition fiber(GO:0097539) |
| 0.1 | 0.7 | GO:0031523 | Myb complex(GO:0031523) |
| 0.1 | 3.4 | GO:0080008 | Cul4-RING E3 ubiquitin ligase complex(GO:0080008) |
| 0.1 | 2.0 | GO:0042101 | T cell receptor complex(GO:0042101) |
| 0.1 | 2.2 | GO:0034045 | pre-autophagosomal structure membrane(GO:0034045) |
| 0.1 | 2.3 | GO:0008328 | ionotropic glutamate receptor complex(GO:0008328) neurotransmitter receptor complex(GO:0098878) |
| 0.1 | 0.5 | GO:0032301 | MutSalpha complex(GO:0032301) |
| 0.1 | 0.5 | GO:0030992 | intraciliary transport particle B(GO:0030992) |
| 0.1 | 0.5 | GO:0097550 | transcriptional preinitiation complex(GO:0097550) |
| 0.1 | 3.0 | GO:0032592 | integral component of mitochondrial membrane(GO:0032592) |
| 0.1 | 7.4 | GO:0005871 | kinesin complex(GO:0005871) |
| 0.1 | 0.9 | GO:0034464 | BBSome(GO:0034464) |
| 0.1 | 0.3 | GO:0034657 | GID complex(GO:0034657) |
| 0.1 | 1.9 | GO:0042588 | zymogen granule(GO:0042588) |
| 0.1 | 0.4 | GO:1990246 | uniplex complex(GO:1990246) |
| 0.1 | 0.8 | GO:1990130 | Iml1 complex(GO:1990130) |
| 0.1 | 2.6 | GO:0005849 | mRNA cleavage factor complex(GO:0005849) |
| 0.1 | 0.1 | GO:1990075 | periciliary membrane compartment(GO:1990075) |
| 0.1 | 0.6 | GO:1990393 | 3M complex(GO:1990393) |
| 0.1 | 1.0 | GO:0097433 | dense body(GO:0097433) |
| 0.1 | 0.4 | GO:0030895 | apolipoprotein B mRNA editing enzyme complex(GO:0030895) |
| 0.1 | 2.8 | GO:0005680 | anaphase-promoting complex(GO:0005680) |
| 0.1 | 0.9 | GO:0090576 | RNA polymerase III transcription factor complex(GO:0090576) |
| 0.1 | 3.8 | GO:0030286 | dynein complex(GO:0030286) |
| 0.1 | 0.6 | GO:1990031 | pinceau fiber(GO:1990031) |
| 0.1 | 1.8 | GO:0032045 | guanyl-nucleotide exchange factor complex(GO:0032045) |
| 0.1 | 1.1 | GO:0000177 | cytoplasmic exosome (RNase complex)(GO:0000177) |
| 0.1 | 0.9 | GO:0060091 | kinocilium(GO:0060091) |
| 0.1 | 1.0 | GO:0072357 | PTW/PP1 phosphatase complex(GO:0072357) |
| 0.1 | 6.6 | GO:0005844 | polysome(GO:0005844) |
| 0.1 | 4.3 | GO:0005640 | nuclear outer membrane(GO:0005640) |
| 0.1 | 6.5 | GO:0008287 | protein serine/threonine phosphatase complex(GO:0008287) phosphatase complex(GO:1903293) |
| 0.1 | 0.5 | GO:0005879 | axonemal microtubule(GO:0005879) |
| 0.1 | 0.6 | GO:0000153 | cytoplasmic ubiquitin ligase complex(GO:0000153) |
| 0.1 | 0.8 | GO:0097546 | ciliary base(GO:0097546) |
| 0.1 | 0.4 | GO:0036156 | inner dynein arm(GO:0036156) |
| 0.1 | 1.5 | GO:0008250 | oligosaccharyltransferase complex(GO:0008250) |
| 0.1 | 0.6 | GO:0000408 | EKC/KEOPS complex(GO:0000408) |
| 0.1 | 6.2 | GO:0000777 | condensed chromosome kinetochore(GO:0000777) |
| 0.1 | 0.6 | GO:0008024 | cyclin/CDK positive transcription elongation factor complex(GO:0008024) |
| 0.1 | 0.6 | GO:0002177 | manchette(GO:0002177) |
| 0.1 | 0.5 | GO:0048179 | activin receptor complex(GO:0048179) |
| 0.1 | 0.9 | GO:0034362 | low-density lipoprotein particle(GO:0034362) |
| 0.1 | 0.4 | GO:0071008 | U2-type post-mRNA release spliceosomal complex(GO:0071008) |
| 0.1 | 1.7 | GO:0044453 | integral component of nuclear inner membrane(GO:0005639) intrinsic component of nuclear inner membrane(GO:0031229) nuclear membrane part(GO:0044453) |
| 0.1 | 0.2 | GO:0005956 | protein kinase CK2 complex(GO:0005956) |
| 0.1 | 0.6 | GO:0097504 | Gemini of coiled bodies(GO:0097504) |
| 0.1 | 0.5 | GO:0072487 | MSL complex(GO:0072487) |
| 0.1 | 0.2 | GO:0070044 | synaptobrevin 2-SNAP-25-syntaxin-1a complex(GO:0070044) |
| 0.1 | 1.4 | GO:0000776 | kinetochore(GO:0000776) |
| 0.1 | 7.3 | GO:0030117 | membrane coat(GO:0030117) coated membrane(GO:0048475) |
| 0.1 | 7.0 | GO:0017053 | transcriptional repressor complex(GO:0017053) |
| 0.1 | 0.5 | GO:0036020 | endolysosome membrane(GO:0036020) |
| 0.1 | 1.9 | GO:0000791 | euchromatin(GO:0000791) |
| 0.1 | 1.3 | GO:0005666 | DNA-directed RNA polymerase III complex(GO:0005666) |
| 0.1 | 1.2 | GO:0044613 | nuclear pore central transport channel(GO:0044613) |
| 0.1 | 0.6 | GO:0000176 | nuclear exosome (RNase complex)(GO:0000176) |
| 0.1 | 0.9 | GO:0000137 | Golgi cis cisterna(GO:0000137) |
| 0.1 | 0.1 | GO:0000243 | commitment complex(GO:0000243) |
| 0.1 | 3.4 | GO:0016592 | mediator complex(GO:0016592) |
| 0.1 | 0.1 | GO:1903349 | omegasome membrane(GO:1903349) |
| 0.1 | 0.3 | GO:0097651 | phosphatidylinositol 3-kinase complex, class IB(GO:0005944) phosphatidylinositol 3-kinase complex, class I(GO:0097651) |
| 0.1 | 1.9 | GO:0031082 | BLOC complex(GO:0031082) |
| 0.1 | 0.9 | GO:0090544 | BAF-type complex(GO:0090544) |
| 0.1 | 3.0 | GO:0005777 | peroxisome(GO:0005777) microbody(GO:0042579) |
| 0.1 | 4.3 | GO:0015030 | Cajal body(GO:0015030) |
| 0.1 | 2.2 | GO:0042629 | mast cell granule(GO:0042629) |
| 0.1 | 0.4 | GO:0032389 | MutLalpha complex(GO:0032389) |
| 0.1 | 6.3 | GO:0031463 | Cul3-RING ubiquitin ligase complex(GO:0031463) |
| 0.1 | 1.0 | GO:0002199 | zona pellucida receptor complex(GO:0002199) |
| 0.1 | 0.3 | GO:0044224 | juxtaparanode region of axon(GO:0044224) |
| 0.1 | 4.0 | GO:0030173 | integral component of Golgi membrane(GO:0030173) |
| 0.1 | 0.5 | GO:0046696 | lipopolysaccharide receptor complex(GO:0046696) |
| 0.1 | 1.9 | GO:0005682 | U5 snRNP(GO:0005682) |
| 0.1 | 1.8 | GO:0030687 | preribosome, large subunit precursor(GO:0030687) |
| 0.1 | 0.2 | GO:0098592 | cytoplasmic side of apical plasma membrane(GO:0098592) |
| 0.1 | 0.9 | GO:0000347 | THO complex(GO:0000347) THO complex part of transcription export complex(GO:0000445) |
| 0.1 | 1.4 | GO:0097381 | photoreceptor disc membrane(GO:0097381) |
| 0.1 | 0.4 | GO:0032044 | DSIF complex(GO:0032044) |
| 0.1 | 2.3 | GO:0035861 | site of double-strand break(GO:0035861) |
| 0.1 | 0.8 | GO:0061202 | clathrin-sculpted gamma-aminobutyric acid transport vesicle(GO:0061200) clathrin-sculpted gamma-aminobutyric acid transport vesicle membrane(GO:0061202) |
| 0.1 | 0.6 | GO:0043020 | NADPH oxidase complex(GO:0043020) |
| 0.1 | 0.4 | GO:1990452 | Parkin-FBXW7-Cul1 ubiquitin ligase complex(GO:1990452) |
| 0.1 | 0.6 | GO:0034687 | integrin alphaL-beta2 complex(GO:0034687) |
| 0.1 | 0.8 | GO:0005677 | chromatin silencing complex(GO:0005677) |
| 0.1 | 0.2 | GO:0070081 | clathrin-sculpted monoamine transport vesicle(GO:0070081) clathrin-sculpted monoamine transport vesicle membrane(GO:0070083) |
| 0.1 | 0.3 | GO:0070876 | SOSS complex(GO:0070876) |
| 0.1 | 1.3 | GO:0005839 | proteasome core complex(GO:0005839) |
| 0.1 | 3.8 | GO:0019005 | SCF ubiquitin ligase complex(GO:0019005) |
| 0.1 | 7.8 | GO:0001669 | acrosomal vesicle(GO:0001669) |
| 0.1 | 0.4 | GO:0031313 | extrinsic component of endosome membrane(GO:0031313) |
| 0.1 | 1.1 | GO:0005952 | cAMP-dependent protein kinase complex(GO:0005952) |
| 0.1 | 1.1 | GO:0097449 | astrocyte projection(GO:0097449) |
| 0.1 | 4.1 | GO:0035580 | specific granule lumen(GO:0035580) |
| 0.1 | 9.3 | GO:0030176 | integral component of endoplasmic reticulum membrane(GO:0030176) |
| 0.1 | 0.1 | GO:0000938 | GARP complex(GO:0000938) |
| 0.1 | 2.4 | GO:0032588 | trans-Golgi network membrane(GO:0032588) |
| 0.1 | 0.5 | GO:0030688 | preribosome, small subunit precursor(GO:0030688) |
| 0.1 | 1.1 | GO:0071004 | U2-type prespliceosome(GO:0071004) |
| 0.0 | 0.2 | GO:0038201 | TOR complex(GO:0038201) |
| 0.0 | 19.2 | GO:0005743 | mitochondrial inner membrane(GO:0005743) |
| 0.0 | 1.6 | GO:0033268 | node of Ranvier(GO:0033268) |
| 0.0 | 3.5 | GO:0005891 | voltage-gated calcium channel complex(GO:0005891) |
| 0.0 | 1.7 | GO:0044295 | axonal growth cone(GO:0044295) |
| 0.0 | 0.8 | GO:0031588 | nucleotide-activated protein kinase complex(GO:0031588) |
| 0.0 | 0.3 | GO:0048476 | Holliday junction resolvase complex(GO:0048476) |
| 0.0 | 0.5 | GO:0000506 | glycosylphosphatidylinositol-N-acetylglucosaminyltransferase (GPI-GnT) complex(GO:0000506) |
| 0.0 | 0.0 | GO:0019908 | nuclear cyclin-dependent protein kinase holoenzyme complex(GO:0019908) |
| 0.0 | 0.6 | GO:0070938 | contractile ring(GO:0070938) |
| 0.0 | 1.5 | GO:0005758 | mitochondrial intermembrane space(GO:0005758) |
| 0.0 | 0.3 | GO:0097255 | R2TP complex(GO:0097255) |
| 0.0 | 0.0 | GO:0070381 | endosome to plasma membrane transport vesicle(GO:0070381) |
| 0.0 | 0.3 | GO:0032449 | CBM complex(GO:0032449) |
| 0.0 | 0.1 | GO:0000438 | core TFIIH complex portion of holo TFIIH complex(GO:0000438) |
| 0.0 | 0.8 | GO:0030877 | beta-catenin destruction complex(GO:0030877) |
| 0.0 | 7.2 | GO:0055037 | recycling endosome(GO:0055037) |
| 0.0 | 0.0 | GO:0034681 | integrin alpha11-beta1 complex(GO:0034681) |
| 0.0 | 0.1 | GO:0044308 | axonal spine(GO:0044308) |
| 0.0 | 0.3 | GO:1990745 | EARP complex(GO:1990745) |
| 0.0 | 2.7 | GO:0097014 | axoneme(GO:0005930) ciliary plasm(GO:0097014) |
| 0.0 | 0.2 | GO:0030137 | COPI-coated vesicle(GO:0030137) |
| 0.0 | 0.2 | GO:0000796 | condensin complex(GO:0000796) |
| 0.0 | 0.5 | GO:0000242 | pericentriolar material(GO:0000242) |
| 0.0 | 2.3 | GO:0036064 | ciliary basal body(GO:0036064) |
| 0.0 | 0.1 | GO:0005900 | oncostatin-M receptor complex(GO:0005900) |
| 0.0 | 0.4 | GO:0097038 | perinuclear endoplasmic reticulum(GO:0097038) |
| 0.0 | 0.4 | GO:0005790 | smooth endoplasmic reticulum(GO:0005790) |
| 0.0 | 1.4 | GO:0001750 | photoreceptor outer segment(GO:0001750) |
| 0.0 | 0.4 | GO:0042567 | insulin-like growth factor ternary complex(GO:0042567) |
| 0.0 | 1.0 | GO:0000123 | histone acetyltransferase complex(GO:0000123) |
| 0.0 | 0.2 | GO:0097209 | epidermal lamellar body(GO:0097209) |
| 0.0 | 0.4 | GO:0030686 | 90S preribosome(GO:0030686) |
| 0.0 | 1.6 | GO:0019866 | organelle inner membrane(GO:0019866) |
| 0.0 | 0.3 | GO:0031597 | cytosolic proteasome complex(GO:0031597) |
| 0.0 | 0.2 | GO:0005594 | collagen type IX trimer(GO:0005594) |
| 0.0 | 0.4 | GO:0030904 | retromer complex(GO:0030904) |
| 0.0 | 1.8 | GO:0031514 | motile cilium(GO:0031514) |
| 0.0 | 0.0 | GO:0070761 | pre-snoRNP complex(GO:0070761) |
| 0.0 | 25.6 | GO:0005789 | endoplasmic reticulum membrane(GO:0005789) |
| 0.0 | 5.8 | GO:0045211 | postsynaptic membrane(GO:0045211) |
| 0.0 | 0.1 | GO:0030915 | Smc5-Smc6 complex(GO:0030915) |
| 0.0 | 0.1 | GO:0097169 | AIM2 inflammasome complex(GO:0097169) |
| 0.0 | 2.3 | GO:0000922 | spindle pole(GO:0000922) |
| 0.0 | 0.0 | GO:0070993 | translation preinitiation complex(GO:0070993) |
| 0.0 | 0.1 | GO:0043564 | Ku70:Ku80 complex(GO:0043564) |
| 0.0 | 0.5 | GO:0000775 | chromosome, centromeric region(GO:0000775) |
| 0.0 | 0.1 | GO:0097452 | GAIT complex(GO:0097452) |
| 0.0 | 0.0 | GO:0035370 | UBC13-UEV1A complex(GO:0035370) |
| 0.0 | 0.0 | GO:0032116 | SMC loading complex(GO:0032116) |
| 0.0 | 0.9 | GO:0045095 | keratin filament(GO:0045095) |
| 0.0 | 0.1 | GO:0071986 | Ragulator complex(GO:0071986) |
| 0.0 | 0.2 | GO:0034364 | high-density lipoprotein particle(GO:0034364) |
Gene overrepresentation in molecular function category:
| Log-likelihood per target | Total log-likelihood | Term | Description |
|---|---|---|---|
| 3.8 | 11.5 | GO:0004998 | transferrin receptor activity(GO:0004998) |
| 2.4 | 9.6 | GO:0034584 | piRNA binding(GO:0034584) |
| 2.4 | 7.2 | GO:0015182 | L-histidine transmembrane transporter activity(GO:0005290) L-asparagine transmembrane transporter activity(GO:0015182) |
| 2.2 | 10.8 | GO:0070653 | high-density lipoprotein particle receptor binding(GO:0070653) |
| 2.1 | 8.5 | GO:0052901 | polyamine oxidase activity(GO:0046592) spermine:oxygen oxidoreductase (spermidine-forming) activity(GO:0052901) |
| 2.0 | 16.3 | GO:0004873 | asialoglycoprotein receptor activity(GO:0004873) |
| 2.0 | 9.9 | GO:0016822 | hydrolase activity, acting on acid carbon-carbon bonds(GO:0016822) hydrolase activity, acting on acid carbon-carbon bonds, in ketonic substances(GO:0016823) |
| 1.9 | 13.6 | GO:0004122 | cystathionine beta-synthase activity(GO:0004122) |
| 1.9 | 5.6 | GO:0004416 | hydroxyacylglutathione hydrolase activity(GO:0004416) |
| 1.8 | 7.3 | GO:0004306 | ethanolamine-phosphate cytidylyltransferase activity(GO:0004306) |
| 1.8 | 5.3 | GO:0070280 | glycine dehydrogenase (decarboxylating) activity(GO:0004375) oxidoreductase activity, acting on the CH-NH2 group of donors, disulfide as acceptor(GO:0016642) vitamin B6 binding(GO:0070279) pyridoxal binding(GO:0070280) |
| 1.6 | 11.5 | GO:0042806 | fucose binding(GO:0042806) |
| 1.6 | 14.8 | GO:0004305 | ethanolamine kinase activity(GO:0004305) |
| 1.6 | 7.8 | GO:0004370 | glycerol kinase activity(GO:0004370) |
| 1.4 | 9.9 | GO:0008523 | sodium-dependent multivitamin transmembrane transporter activity(GO:0008523) |
| 1.4 | 8.2 | GO:0015018 | galactosylgalactosylxylosylprotein 3-beta-glucuronosyltransferase activity(GO:0015018) |
| 1.3 | 6.6 | GO:0008332 | low voltage-gated calcium channel activity(GO:0008332) |
| 1.3 | 10.6 | GO:0060228 | phosphatidylcholine-sterol O-acyltransferase activator activity(GO:0060228) |
| 1.3 | 4.0 | GO:0000224 | peptide-N4-(N-acetyl-beta-glucosaminyl)asparagine amidase activity(GO:0000224) |
| 1.3 | 11.6 | GO:0003847 | 1-alkyl-2-acetylglycerophosphocholine esterase activity(GO:0003847) |
| 1.2 | 3.6 | GO:0097259 | tocopherol omega-hydroxylase activity(GO:0052870) alpha-tocopherol omega-hydroxylase activity(GO:0052871) 20-hydroxy-leukotriene B4 omega oxidase activity(GO:0097258) 20-aldehyde-leukotriene B4 20-monooxygenase activity(GO:0097259) |
| 1.2 | 7.1 | GO:0004505 | phenylalanine 4-monooxygenase activity(GO:0004505) |
| 1.1 | 3.3 | GO:0004047 | aminomethyltransferase activity(GO:0004047) |
| 1.1 | 6.5 | GO:0015307 | drug:proton antiporter activity(GO:0015307) |
| 1.1 | 3.2 | GO:0008480 | sarcosine dehydrogenase activity(GO:0008480) |
| 1.0 | 3.0 | GO:0004450 | isocitrate dehydrogenase (NADP+) activity(GO:0004450) |
| 1.0 | 7.0 | GO:0016841 | ammonia-lyase activity(GO:0016841) |
| 1.0 | 3.0 | GO:0047635 | L-alanine:2-oxoglutarate aminotransferase activity(GO:0004021) alanine-oxo-acid transaminase activity(GO:0047635) |
| 1.0 | 3.0 | GO:0015137 | citrate transmembrane transporter activity(GO:0015137) tricarboxylic acid transmembrane transporter activity(GO:0015142) |
| 1.0 | 2.9 | GO:0004165 | dodecenoyl-CoA delta-isomerase activity(GO:0004165) |
| 1.0 | 3.8 | GO:0008431 | vitamin E binding(GO:0008431) |
| 0.9 | 2.8 | GO:0016401 | palmitoyl-CoA oxidase activity(GO:0016401) |
| 0.9 | 2.8 | GO:0004613 | phosphoenolpyruvate carboxykinase activity(GO:0004611) phosphoenolpyruvate carboxykinase (GTP) activity(GO:0004613) |
| 0.9 | 2.7 | GO:0033842 | N-acetyl-beta-glucosaminyl-glycoprotein 4-beta-N-acetylgalactosaminyltransferase activity(GO:0033842) |
| 0.9 | 1.8 | GO:0003958 | NADPH-hemoprotein reductase activity(GO:0003958) |
| 0.9 | 2.7 | GO:0047012 | C-3 sterol dehydrogenase (C-4 sterol decarboxylase) activity(GO:0000252) sterol-4-alpha-carboxylate 3-dehydrogenase (decarboxylating) activity(GO:0047012) |
| 0.9 | 3.5 | GO:0031687 | A2A adenosine receptor binding(GO:0031687) |
| 0.9 | 3.4 | GO:0015141 | succinate transmembrane transporter activity(GO:0015141) |
| 0.8 | 2.5 | GO:0000247 | C-8 sterol isomerase activity(GO:0000247) |
| 0.8 | 4.1 | GO:0015183 | L-aspartate transmembrane transporter activity(GO:0015183) |
| 0.8 | 8.2 | GO:0003835 | beta-galactoside alpha-2,6-sialyltransferase activity(GO:0003835) |
| 0.8 | 2.4 | GO:0004638 | phosphoribosylaminoimidazole carboxylase activity(GO:0004638) phosphoribosylaminoimidazolesuccinocarboxamide synthase activity(GO:0004639) |
| 0.8 | 3.2 | GO:0004967 | glucagon receptor activity(GO:0004967) |
| 0.8 | 4.0 | GO:0008515 | sucrose:proton symporter activity(GO:0008506) sucrose transmembrane transporter activity(GO:0008515) disaccharide transmembrane transporter activity(GO:0015154) oligosaccharide transmembrane transporter activity(GO:0015157) |
| 0.8 | 2.4 | GO:0070506 | high-density lipoprotein particle receptor activity(GO:0070506) |
| 0.8 | 5.5 | GO:0044729 | hemi-methylated DNA-binding(GO:0044729) |
| 0.8 | 4.6 | GO:0004741 | [pyruvate dehydrogenase (lipoamide)] phosphatase activity(GO:0004741) |
| 0.8 | 2.3 | GO:0030272 | 5-formyltetrahydrofolate cyclo-ligase activity(GO:0030272) |
| 0.8 | 3.8 | GO:0001512 | dihydronicotinamide riboside quinone reductase activity(GO:0001512) melatonin binding(GO:1904408) |
| 0.8 | 2.3 | GO:0003845 | 11-beta-hydroxysteroid dehydrogenase [NAD(P)] activity(GO:0003845) |
| 0.7 | 4.5 | GO:0004706 | JUN kinase kinase kinase activity(GO:0004706) |
| 0.7 | 0.7 | GO:0047750 | cholestenol delta-isomerase activity(GO:0047750) |
| 0.7 | 2.2 | GO:0004056 | argininosuccinate lyase activity(GO:0004056) |
| 0.7 | 10.1 | GO:0031014 | troponin T binding(GO:0031014) |
| 0.7 | 10.8 | GO:0050291 | sphingosine N-acyltransferase activity(GO:0050291) |
| 0.7 | 2.8 | GO:0031208 | POZ domain binding(GO:0031208) |
| 0.7 | 0.7 | GO:0086059 | voltage-gated calcium channel activity involved SA node cell action potential(GO:0086059) |
| 0.7 | 4.2 | GO:0034431 | endopolyphosphatase activity(GO:0000298) diphosphoinositol-polyphosphate diphosphatase activity(GO:0008486) bis(5'-adenosyl)-hexaphosphatase activity(GO:0034431) bis(5'-adenosyl)-pentaphosphatase activity(GO:0034432) inositol diphosphate tetrakisphosphate diphosphatase activity(GO:0052840) inositol bisdiphosphate tetrakisphosphate diphosphatase activity(GO:0052841) inositol diphosphate pentakisphosphate diphosphatase activity(GO:0052842) inositol-1-diphosphate-2,3,4,5,6-pentakisphosphate diphosphatase activity(GO:0052843) inositol-3-diphosphate-1,2,4,5,6-pentakisphosphate diphosphatase activity(GO:0052844) inositol-5-diphosphate-1,2,3,4,6-pentakisphosphate diphosphatase activity(GO:0052845) inositol-1,5-bisdiphosphate-2,3,4,6-tetrakisphosphate 1-diphosphatase activity(GO:0052846) inositol-1,5-bisdiphosphate-2,3,4,6-tetrakisphosphate 5-diphosphatase activity(GO:0052847) inositol-3,5-bisdiphosphate-2,3,4,6-tetrakisphosphate 5-diphosphatase activity(GO:0052848) |
| 0.7 | 6.3 | GO:0033743 | peptide-methionine (R)-S-oxide reductase activity(GO:0033743) |
| 0.7 | 5.5 | GO:0008172 | S-methyltransferase activity(GO:0008172) |
| 0.7 | 2.0 | GO:0036054 | protein-malonyllysine demalonylase activity(GO:0036054) protein-succinyllysine desuccinylase activity(GO:0036055) protein-glutaryllysine deglutarylase activity(GO:0061697) |
| 0.7 | 5.4 | GO:0004359 | glutaminase activity(GO:0004359) |
| 0.7 | 0.7 | GO:0005128 | erythropoietin receptor binding(GO:0005128) |
| 0.7 | 2.7 | GO:0033897 | ribonuclease T2 activity(GO:0033897) |
| 0.7 | 2.7 | GO:0035033 | histone deacetylase regulator activity(GO:0035033) |
| 0.7 | 2.6 | GO:0047946 | glutamine N-acyltransferase activity(GO:0047946) |
| 0.7 | 2.0 | GO:0016534 | cyclin-dependent protein kinase 5 activator activity(GO:0016534) |
| 0.6 | 0.6 | GO:0046997 | oxidoreductase activity, acting on the CH-NH group of donors, flavin as acceptor(GO:0046997) |
| 0.6 | 3.2 | GO:0004886 | 9-cis retinoic acid receptor activity(GO:0004886) |
| 0.6 | 2.6 | GO:0004341 | gluconolactonase activity(GO:0004341) |
| 0.6 | 6.4 | GO:0003910 | DNA ligase (ATP) activity(GO:0003910) |
| 0.6 | 3.2 | GO:1990450 | linear polyubiquitin binding(GO:1990450) |
| 0.6 | 2.5 | GO:0051185 | coenzyme transporter activity(GO:0051185) |
| 0.6 | 4.3 | GO:0005324 | long-chain fatty acid transporter activity(GO:0005324) |
| 0.6 | 1.8 | GO:0019166 | 2,4-dienoyl-CoA reductase (NADPH) activity(GO:0008670) trans-2-enoyl-CoA reductase (NADPH) activity(GO:0019166) |
| 0.6 | 3.7 | GO:0004826 | phenylalanine-tRNA ligase activity(GO:0004826) |
| 0.6 | 3.7 | GO:0004749 | ribose phosphate diphosphokinase activity(GO:0004749) |
| 0.6 | 2.4 | GO:0003978 | UDP-N-acetylglucosamine 4-epimerase activity(GO:0003974) UDP-glucose 4-epimerase activity(GO:0003978) |
| 0.6 | 3.0 | GO:0016635 | oxidoreductase activity, acting on the CH-CH group of donors, quinone or related compound as acceptor(GO:0016635) |
| 0.6 | 2.4 | GO:0015173 | aromatic amino acid transmembrane transporter activity(GO:0015173) |
| 0.6 | 0.6 | GO:0030292 | protein tyrosine kinase inhibitor activity(GO:0030292) |
| 0.6 | 1.2 | GO:0016855 | racemase and epimerase activity, acting on amino acids and derivatives(GO:0016855) racemase activity, acting on amino acids and derivatives(GO:0036361) amino-acid racemase activity(GO:0047661) |
| 0.6 | 2.9 | GO:0002054 | nucleobase binding(GO:0002054) |
| 0.6 | 5.3 | GO:0004793 | glycine hydroxymethyltransferase activity(GO:0004372) threonine aldolase activity(GO:0004793) L-allo-threonine aldolase activity(GO:0008732) |
| 0.6 | 6.9 | GO:0015245 | fatty acid transporter activity(GO:0015245) |
| 0.6 | 1.7 | GO:0071207 | histone pre-mRNA stem-loop binding(GO:0071207) |
| 0.6 | 1.7 | GO:1990699 | palmitoleyl hydrolase activity(GO:1990699) |
| 0.6 | 1.7 | GO:0004584 | dolichyl-phosphate-mannose-glycolipid alpha-mannosyltransferase activity(GO:0004584) |
| 0.6 | 4.6 | GO:0032810 | sterol response element binding(GO:0032810) |
| 0.6 | 1.7 | GO:0030350 | iron-responsive element binding(GO:0030350) |
| 0.6 | 1.7 | GO:0036505 | prosaposin receptor activity(GO:0036505) |
| 0.6 | 2.2 | GO:0042132 | fructose 1,6-bisphosphate 1-phosphatase activity(GO:0042132) |
| 0.6 | 1.7 | GO:0050051 | leukotriene-B4 20-monooxygenase activity(GO:0050051) |
| 0.5 | 2.7 | GO:0004803 | transposase activity(GO:0004803) |
| 0.5 | 1.6 | GO:0008294 | calcium- and calmodulin-responsive adenylate cyclase activity(GO:0008294) |
| 0.5 | 4.3 | GO:0004735 | pyrroline-5-carboxylate reductase activity(GO:0004735) |
| 0.5 | 2.1 | GO:0016428 | tRNA (cytosine-5-)-methyltransferase activity(GO:0016428) |
| 0.5 | 1.6 | GO:0016652 | NAD(P)+ transhydrogenase activity(GO:0008746) oxidoreductase activity, acting on NAD(P)H, NAD(P) as acceptor(GO:0016652) |
| 0.5 | 2.7 | GO:0004991 | parathyroid hormone receptor activity(GO:0004991) |
| 0.5 | 1.6 | GO:0004421 | hydroxymethylglutaryl-CoA synthase activity(GO:0004421) |
| 0.5 | 3.2 | GO:0010861 | thyroid hormone receptor activator activity(GO:0010861) thyroid hormone receptor coactivator activity(GO:0030375) |
| 0.5 | 4.2 | GO:0004046 | aminoacylase activity(GO:0004046) |
| 0.5 | 2.1 | GO:0004146 | dihydrofolate reductase activity(GO:0004146) |
| 0.5 | 2.6 | GO:0001026 | TFIIIB-type transcription factor activity(GO:0001026) |
| 0.5 | 2.1 | GO:0046573 | lactonohydrolase activity(GO:0046573) acyl-L-homoserine-lactone lactonohydrolase activity(GO:0102007) |
| 0.5 | 3.6 | GO:0004591 | oxoglutarate dehydrogenase (succinyl-transferring) activity(GO:0004591) |
| 0.5 | 4.1 | GO:0008481 | sphinganine kinase activity(GO:0008481) D-erythro-sphingosine kinase activity(GO:0017050) |
| 0.5 | 2.1 | GO:0030343 | vitamin D3 25-hydroxylase activity(GO:0030343) vitamin D 25-hydroxylase activity(GO:0070643) |
| 0.5 | 1.5 | GO:0004850 | uridine phosphorylase activity(GO:0004850) |
| 0.5 | 3.5 | GO:0030171 | voltage-gated proton channel activity(GO:0030171) |
| 0.5 | 2.0 | GO:0001626 | nociceptin receptor activity(GO:0001626) |
| 0.5 | 1.5 | GO:0016005 | phospholipase A2 activator activity(GO:0016005) |
| 0.5 | 10.4 | GO:0030306 | ADP-ribosylation factor binding(GO:0030306) |
| 0.5 | 3.9 | GO:0042903 | tubulin deacetylase activity(GO:0042903) |
| 0.5 | 2.0 | GO:0047751 | 3-oxo-5-alpha-steroid 4-dehydrogenase activity(GO:0003865) steroid dehydrogenase activity, acting on the CH-CH group of donors(GO:0033765) cholestenone 5-alpha-reductase activity(GO:0047751) |
| 0.5 | 1.0 | GO:0004315 | 3-oxoacyl-[acyl-carrier-protein] synthase activity(GO:0004315) |
| 0.5 | 2.4 | GO:0017095 | heparan sulfate 6-O-sulfotransferase activity(GO:0017095) |
| 0.5 | 3.9 | GO:0015252 | hydrogen ion channel activity(GO:0015252) |
| 0.5 | 2.4 | GO:0003986 | acetyl-CoA hydrolase activity(GO:0003986) |
| 0.5 | 1.4 | GO:0003826 | alpha-ketoacid dehydrogenase activity(GO:0003826) 3-methyl-2-oxobutanoate dehydrogenase (2-methylpropanoyl-transferring) activity(GO:0003863) |
| 0.5 | 1.9 | GO:0004452 | isopentenyl-diphosphate delta-isomerase activity(GO:0004452) |
| 0.5 | 4.3 | GO:0034648 | histone demethylase activity (H3-dimethyl-K4 specific)(GO:0034648) |
| 0.5 | 1.4 | GO:0072545 | tyrosine binding(GO:0072545) |
| 0.5 | 1.4 | GO:0034186 | apolipoprotein A-I binding(GO:0034186) |
| 0.5 | 2.8 | GO:0004792 | thiosulfate sulfurtransferase activity(GO:0004792) |
| 0.5 | 1.4 | GO:0000773 | phosphatidyl-N-methylethanolamine N-methyltransferase activity(GO:0000773) phosphatidylethanolamine N-methyltransferase activity(GO:0004608) phosphatidyl-N-dimethylethanolamine N-methyltransferase activity(GO:0080101) |
| 0.5 | 3.3 | GO:0005280 | hydrogen:amino acid symporter activity(GO:0005280) |
| 0.5 | 2.3 | GO:0050510 | N-acetylgalactosaminyl-proteoglycan 3-beta-glucuronosyltransferase activity(GO:0050510) |
| 0.5 | 2.8 | GO:0102008 | cytosolic dipeptidase activity(GO:0102008) |
| 0.5 | 3.7 | GO:0000064 | L-ornithine transmembrane transporter activity(GO:0000064) |
| 0.5 | 1.8 | GO:0035184 | histone threonine kinase activity(GO:0035184) |
| 0.5 | 3.2 | GO:0003883 | CTP synthase activity(GO:0003883) |
| 0.5 | 4.1 | GO:0036042 | long-chain fatty acyl-CoA binding(GO:0036042) |
| 0.5 | 4.1 | GO:0010997 | anaphase-promoting complex binding(GO:0010997) |
| 0.5 | 6.8 | GO:0005007 | fibroblast growth factor-activated receptor activity(GO:0005007) |
| 0.4 | 1.3 | GO:0015633 | zinc transporting ATPase activity(GO:0015633) |
| 0.4 | 2.2 | GO:0016774 | phosphotransferase activity, carboxyl group as acceptor(GO:0016774) |
| 0.4 | 0.9 | GO:0008269 | JAK pathway signal transduction adaptor activity(GO:0008269) |
| 0.4 | 4.0 | GO:0004571 | mannosyl-oligosaccharide 1,2-alpha-mannosidase activity(GO:0004571) |
| 0.4 | 4.4 | GO:0005332 | gamma-aminobutyric acid:sodium symporter activity(GO:0005332) |
| 0.4 | 1.3 | GO:0052815 | medium-chain acyl-CoA hydrolase activity(GO:0052815) long-chain acyl-CoA hydrolase activity(GO:0052816) |
| 0.4 | 1.3 | GO:0033862 | UMP kinase activity(GO:0033862) |
| 0.4 | 3.0 | GO:0008467 | [heparan sulfate]-glucosamine 3-sulfotransferase 1 activity(GO:0008467) |
| 0.4 | 0.4 | GO:0045142 | triplex DNA binding(GO:0045142) |
| 0.4 | 1.7 | GO:0004113 | 2',3'-cyclic-nucleotide 3'-phosphodiesterase activity(GO:0004113) |
| 0.4 | 6.3 | GO:0015501 | glutamate:sodium symporter activity(GO:0015501) |
| 0.4 | 0.8 | GO:0048408 | epidermal growth factor binding(GO:0048408) |
| 0.4 | 2.5 | GO:0061513 | hexose phosphate transmembrane transporter activity(GO:0015119) organophosphate:inorganic phosphate antiporter activity(GO:0015315) hexose-phosphate:inorganic phosphate antiporter activity(GO:0015526) glucose 6-phosphate:inorganic phosphate antiporter activity(GO:0061513) |
| 0.4 | 2.1 | GO:0035575 | histone demethylase activity (H4-K20 specific)(GO:0035575) |
| 0.4 | 1.7 | GO:0008478 | pyridoxal kinase activity(GO:0008478) |
| 0.4 | 4.1 | GO:0034056 | estrogen response element binding(GO:0034056) |
| 0.4 | 0.4 | GO:0047025 | 3-oxoacyl-[acyl-carrier-protein] reductase (NADH) activity(GO:0047025) |
| 0.4 | 2.4 | GO:0071074 | eukaryotic initiation factor eIF2 binding(GO:0071074) |
| 0.4 | 1.2 | GO:0047315 | kynurenine-glyoxylate transaminase activity(GO:0047315) |
| 0.4 | 2.4 | GO:0042954 | lipoprotein transporter activity(GO:0042954) |
| 0.4 | 1.6 | GO:0008476 | protein-tyrosine sulfotransferase activity(GO:0008476) |
| 0.4 | 1.6 | GO:0004698 | calcium-dependent protein kinase C activity(GO:0004698) |
| 0.4 | 1.6 | GO:0004001 | adenosine kinase activity(GO:0004001) |
| 0.4 | 2.0 | GO:0051733 | ATP-dependent polydeoxyribonucleotide 5'-hydroxyl-kinase activity(GO:0046404) polydeoxyribonucleotide kinase activity(GO:0051733) ATP-dependent polynucleotide kinase activity(GO:0051734) |
| 0.4 | 1.6 | GO:0050698 | proteoglycan sulfotransferase activity(GO:0050698) |
| 0.4 | 7.8 | GO:0009982 | pseudouridine synthase activity(GO:0009982) |
| 0.4 | 3.9 | GO:0050833 | pyruvate transmembrane transporter activity(GO:0050833) |
| 0.4 | 5.0 | GO:0005005 | transmembrane-ephrin receptor activity(GO:0005005) |
| 0.4 | 3.5 | GO:0061133 | endopeptidase activator activity(GO:0061133) |
| 0.4 | 1.2 | GO:0019781 | NEDD8 activating enzyme activity(GO:0019781) |
| 0.4 | 2.7 | GO:0004300 | enoyl-CoA hydratase activity(GO:0004300) |
| 0.4 | 5.4 | GO:0102336 | fatty acid elongase activity(GO:0009922) 3-oxo-arachidoyl-CoA synthase activity(GO:0102336) 3-oxo-cerotoyl-CoA synthase activity(GO:0102337) 3-oxo-lignoceronyl-CoA synthase activity(GO:0102338) |
| 0.4 | 5.4 | GO:0051525 | NFAT protein binding(GO:0051525) |
| 0.4 | 1.9 | GO:0070991 | medium-chain-acyl-CoA dehydrogenase activity(GO:0070991) |
| 0.4 | 8.3 | GO:0015037 | peptide disulfide oxidoreductase activity(GO:0015037) |
| 0.4 | 3.4 | GO:0030284 | estrogen receptor activity(GO:0030284) |
| 0.4 | 14.3 | GO:0017081 | chloride channel regulator activity(GO:0017081) |
| 0.4 | 2.6 | GO:0032145 | 4-aminobutyrate transaminase activity(GO:0003867) succinate-semialdehyde dehydrogenase binding(GO:0032145) (S)-3-amino-2-methylpropionate transaminase activity(GO:0047298) |
| 0.4 | 3.4 | GO:0061665 | SUMO ligase activity(GO:0061665) |
| 0.4 | 3.7 | GO:0003899 | DNA-directed RNA polymerase activity(GO:0003899) |
| 0.4 | 3.7 | GO:0019784 | NEDD8-specific protease activity(GO:0019784) |
| 0.4 | 3.3 | GO:0003886 | DNA (cytosine-5-)-methyltransferase activity(GO:0003886) |
| 0.4 | 5.2 | GO:0008525 | phosphatidylcholine transporter activity(GO:0008525) |
| 0.4 | 2.2 | GO:0008518 | reduced folate carrier activity(GO:0008518) |
| 0.4 | 1.8 | GO:0004392 | heme oxygenase (decyclizing) activity(GO:0004392) |
| 0.4 | 5.9 | GO:0042974 | retinoic acid receptor binding(GO:0042974) |
| 0.4 | 7.3 | GO:0005432 | calcium:sodium antiporter activity(GO:0005432) |
| 0.4 | 1.1 | GO:1904854 | proteasome core complex binding(GO:1904854) |
| 0.4 | 1.1 | GO:0044594 | 3alpha,7alpha,12alpha-trihydroxy-5beta-cholest-24-enoyl-CoA hydratase activity(GO:0033989) 17-beta-hydroxysteroid dehydrogenase (NAD+) activity(GO:0044594) |
| 0.4 | 1.8 | GO:0052798 | beta-galactoside alpha-2,3-sialyltransferase activity(GO:0052798) |
| 0.4 | 1.4 | GO:1904713 | beta-catenin destruction complex binding(GO:1904713) |
| 0.4 | 1.1 | GO:0008761 | UDP-N-acetylglucosamine 2-epimerase activity(GO:0008761) N-acylmannosamine kinase activity(GO:0009384) |
| 0.4 | 1.1 | GO:0034039 | 8-oxo-7,8-dihydroguanine DNA N-glycosylase activity(GO:0034039) |
| 0.4 | 2.5 | GO:0097108 | smoothened binding(GO:0005119) hedgehog family protein binding(GO:0097108) |
| 0.4 | 10.3 | GO:0042800 | histone methyltransferase activity (H3-K4 specific)(GO:0042800) |
| 0.4 | 5.3 | GO:0001135 | transcription factor activity, RNA polymerase II transcription factor recruiting(GO:0001135) |
| 0.4 | 1.8 | GO:0070579 | methylcytosine dioxygenase activity(GO:0070579) |
| 0.4 | 1.4 | GO:0017057 | 6-phosphogluconolactonase activity(GO:0017057) |
| 0.4 | 0.4 | GO:0016886 | ligase activity, forming phosphoric ester bonds(GO:0016886) |
| 0.4 | 2.8 | GO:0004430 | 1-phosphatidylinositol 4-kinase activity(GO:0004430) |
| 0.3 | 5.2 | GO:0032051 | clathrin light chain binding(GO:0032051) |
| 0.3 | 1.0 | GO:0098640 | integrin binding involved in cell-matrix adhesion(GO:0098640) |
| 0.3 | 0.7 | GO:0045504 | dynein heavy chain binding(GO:0045504) |
| 0.3 | 1.4 | GO:0004335 | galactokinase activity(GO:0004335) |
| 0.3 | 6.4 | GO:0097016 | L27 domain binding(GO:0097016) |
| 0.3 | 2.7 | GO:0003917 | DNA topoisomerase type I activity(GO:0003917) |
| 0.3 | 1.0 | GO:0071535 | RING-like zinc finger domain binding(GO:0071535) |
| 0.3 | 0.3 | GO:0035650 | AP-1 adaptor complex binding(GO:0035650) |
| 0.3 | 2.7 | GO:0032190 | acrosin binding(GO:0032190) |
| 0.3 | 1.3 | GO:0019107 | glycylpeptide N-tetradecanoyltransferase activity(GO:0004379) myristoyltransferase activity(GO:0019107) |
| 0.3 | 1.7 | GO:0043891 | glyceraldehyde-3-phosphate dehydrogenase (NAD+) (phosphorylating) activity(GO:0004365) glyceraldehyde-3-phosphate dehydrogenase (NAD(P)+) (phosphorylating) activity(GO:0043891) |
| 0.3 | 1.7 | GO:0016213 | linoleoyl-CoA desaturase activity(GO:0016213) |
| 0.3 | 2.0 | GO:0015180 | L-alanine transmembrane transporter activity(GO:0015180) alanine transmembrane transporter activity(GO:0022858) |
| 0.3 | 1.6 | GO:0035671 | enone reductase activity(GO:0035671) |
| 0.3 | 4.5 | GO:0036310 | annealing helicase activity(GO:0036310) |
| 0.3 | 1.0 | GO:0000253 | 3-keto sterol reductase activity(GO:0000253) |
| 0.3 | 1.6 | GO:1990460 | leptin receptor binding(GO:1990460) |
| 0.3 | 3.2 | GO:0016406 | carnitine O-acyltransferase activity(GO:0016406) |
| 0.3 | 1.6 | GO:0050656 | 3'-phosphoadenosine 5'-phosphosulfate binding(GO:0050656) |
| 0.3 | 0.6 | GO:0016416 | O-palmitoyltransferase activity(GO:0016416) |
| 0.3 | 1.3 | GO:0060230 | lipoprotein lipase activator activity(GO:0060230) |
| 0.3 | 1.9 | GO:0043546 | molybdopterin cofactor binding(GO:0043546) |
| 0.3 | 1.3 | GO:0003985 | acetyl-CoA C-acetyltransferase activity(GO:0003985) |
| 0.3 | 0.3 | GO:0015229 | L-ascorbate:sodium symporter activity(GO:0008520) L-ascorbic acid transporter activity(GO:0015229) sodium-dependent L-ascorbate transmembrane transporter activity(GO:0070890) |
| 0.3 | 0.6 | GO:0061628 | H3K27me3 modified histone binding(GO:0061628) |
| 0.3 | 4.4 | GO:0046976 | histone methyltransferase activity (H3-K27 specific)(GO:0046976) |
| 0.3 | 1.6 | GO:0003988 | acetyl-CoA C-acyltransferase activity(GO:0003988) |
| 0.3 | 0.3 | GO:0090555 | phosphatidylethanolamine-translocating ATPase activity(GO:0090555) |
| 0.3 | 1.6 | GO:0004802 | transketolase activity(GO:0004802) |
| 0.3 | 0.9 | GO:0019777 | Atg12 transferase activity(GO:0019777) |
| 0.3 | 2.5 | GO:0005222 | intracellular cAMP activated cation channel activity(GO:0005222) |
| 0.3 | 0.9 | GO:0052739 | phosphatidylserine 1-acylhydrolase activity(GO:0052739) |
| 0.3 | 3.4 | GO:0004689 | phosphorylase kinase activity(GO:0004689) |
| 0.3 | 0.9 | GO:0089720 | caspase binding(GO:0089720) |
| 0.3 | 3.7 | GO:0008553 | hydrogen-exporting ATPase activity, phosphorylative mechanism(GO:0008553) |
| 0.3 | 0.6 | GO:0031403 | lithium ion binding(GO:0031403) |
| 0.3 | 3.7 | GO:0050072 | m7G(5')pppN diphosphatase activity(GO:0050072) |
| 0.3 | 0.9 | GO:0004615 | phosphomannomutase activity(GO:0004615) |
| 0.3 | 1.2 | GO:0001641 | group II metabotropic glutamate receptor activity(GO:0001641) |
| 0.3 | 3.6 | GO:0004634 | phosphopyruvate hydratase activity(GO:0004634) |
| 0.3 | 11.5 | GO:0003951 | NAD+ kinase activity(GO:0003951) |
| 0.3 | 3.0 | GO:0070740 | tubulin-glutamic acid ligase activity(GO:0070740) |
| 0.3 | 0.6 | GO:0001888 | glucuronyl-galactosyl-proteoglycan 4-alpha-N-acetylglucosaminyltransferase activity(GO:0001888) |
| 0.3 | 0.3 | GO:0015111 | iodide transmembrane transporter activity(GO:0015111) |
| 0.3 | 3.3 | GO:0005384 | manganese ion transmembrane transporter activity(GO:0005384) |
| 0.3 | 5.0 | GO:0035612 | AP-2 adaptor complex binding(GO:0035612) |
| 0.3 | 6.8 | GO:0052629 | phosphatidylinositol-3,5-bisphosphate 3-phosphatase activity(GO:0052629) |
| 0.3 | 1.2 | GO:0051500 | D-aminoacyl-tRNA deacylase activity(GO:0051499) D-tyrosyl-tRNA(Tyr) deacylase activity(GO:0051500) |
| 0.3 | 0.3 | GO:0004040 | amidase activity(GO:0004040) |
| 0.3 | 2.0 | GO:0004301 | epoxide hydrolase activity(GO:0004301) |
| 0.3 | 1.1 | GO:0035241 | protein-arginine omega-N monomethyltransferase activity(GO:0035241) |
| 0.3 | 2.3 | GO:0004514 | nicotinate-nucleotide diphosphorylase (carboxylating) activity(GO:0004514) |
| 0.3 | 2.8 | GO:0004677 | DNA-dependent protein kinase activity(GO:0004677) |
| 0.3 | 1.4 | GO:0003943 | N-acetylgalactosamine-4-sulfatase activity(GO:0003943) |
| 0.3 | 0.8 | GO:0004577 | N-acetylglucosaminyldiphosphodolichol N-acetylglucosaminyltransferase activity(GO:0004577) |
| 0.3 | 0.8 | GO:0046974 | histone methyltransferase activity (H3-K9 specific)(GO:0046974) |
| 0.3 | 0.8 | GO:0015203 | polyamine transmembrane transporter activity(GO:0015203) putrescine transmembrane transporter activity(GO:0015489) |
| 0.3 | 1.9 | GO:0047288 | monosialoganglioside sialyltransferase activity(GO:0047288) |
| 0.3 | 0.8 | GO:0010348 | lithium:proton antiporter activity(GO:0010348) |
| 0.3 | 4.6 | GO:0003688 | DNA replication origin binding(GO:0003688) |
| 0.3 | 4.6 | GO:0015385 | monovalent cation:proton antiporter activity(GO:0005451) sodium:proton antiporter activity(GO:0015385) |
| 0.3 | 2.7 | GO:0019237 | centromeric DNA binding(GO:0019237) |
| 0.3 | 1.4 | GO:0004882 | androgen receptor activity(GO:0004882) |
| 0.3 | 0.5 | GO:0001223 | transcription coactivator binding(GO:0001223) |
| 0.3 | 1.3 | GO:0032767 | copper-dependent protein binding(GO:0032767) |
| 0.3 | 3.5 | GO:0008142 | oxysterol binding(GO:0008142) |
| 0.3 | 0.8 | GO:0003860 | 3-hydroxyisobutyryl-CoA hydrolase activity(GO:0003860) |
| 0.3 | 3.2 | GO:0032454 | histone demethylase activity (H3-K9 specific)(GO:0032454) |
| 0.3 | 2.4 | GO:0016713 | oxidoreductase activity, acting on paired donors, with incorporation or reduction of molecular oxygen, reduced iron-sulfur protein as one donor, and incorporation of one atom of oxygen(GO:0016713) |
| 0.3 | 3.5 | GO:0004985 | opioid receptor activity(GO:0004985) |
| 0.3 | 0.3 | GO:0033612 | receptor serine/threonine kinase binding(GO:0033612) |
| 0.3 | 0.8 | GO:0005166 | neurotrophin p75 receptor binding(GO:0005166) |
| 0.3 | 0.5 | GO:0008422 | beta-glucosidase activity(GO:0008422) |
| 0.3 | 1.6 | GO:0016907 | G-protein coupled acetylcholine receptor activity(GO:0016907) |
| 0.3 | 1.6 | GO:0005457 | GDP-fucose transmembrane transporter activity(GO:0005457) purine nucleotide-sugar transmembrane transporter activity(GO:0036080) |
| 0.3 | 1.3 | GO:0003963 | RNA-3'-phosphate cyclase activity(GO:0003963) |
| 0.3 | 6.1 | GO:0004012 | phospholipid-translocating ATPase activity(GO:0004012) |
| 0.3 | 1.3 | GO:0052836 | inositol 5-diphosphate pentakisphosphate 5-kinase activity(GO:0052836) inositol diphosphate tetrakisphosphate kinase activity(GO:0052839) |
| 0.3 | 6.3 | GO:0045295 | gamma-catenin binding(GO:0045295) |
| 0.3 | 4.5 | GO:0000062 | fatty-acyl-CoA binding(GO:0000062) |
| 0.3 | 3.0 | GO:0004526 | ribonuclease P activity(GO:0004526) |
| 0.2 | 1.2 | GO:0004616 | phosphogluconate dehydrogenase (decarboxylating) activity(GO:0004616) |
| 0.2 | 2.5 | GO:0034046 | poly(G) binding(GO:0034046) |
| 0.2 | 0.7 | GO:0005150 | interleukin-1, Type I receptor binding(GO:0005150) |
| 0.2 | 4.9 | GO:0051864 | histone demethylase activity (H3-K36 specific)(GO:0051864) |
| 0.2 | 1.7 | GO:0035312 | 5'-3' exodeoxyribonuclease activity(GO:0035312) |
| 0.2 | 0.7 | GO:0030337 | DNA polymerase processivity factor activity(GO:0030337) |
| 0.2 | 1.0 | GO:0008967 | phosphoglycolate phosphatase activity(GO:0008967) |
| 0.2 | 0.7 | GO:0055077 | gap junction hemi-channel activity(GO:0055077) |
| 0.2 | 0.9 | GO:0070095 | fructose-6-phosphate binding(GO:0070095) |
| 0.2 | 0.2 | GO:0016838 | carbon-oxygen lyase activity, acting on phosphates(GO:0016838) |
| 0.2 | 2.8 | GO:0004767 | sphingomyelin phosphodiesterase activity(GO:0004767) |
| 0.2 | 0.9 | GO:0070326 | very-low-density lipoprotein particle receptor binding(GO:0070326) |
| 0.2 | 0.7 | GO:0004960 | thromboxane receptor activity(GO:0004960) thromboxane A2 receptor activity(GO:0004961) |
| 0.2 | 1.8 | GO:0004485 | methylcrotonoyl-CoA carboxylase activity(GO:0004485) |
| 0.2 | 1.4 | GO:0004647 | phosphoserine phosphatase activity(GO:0004647) |
| 0.2 | 0.7 | GO:0004459 | lactate dehydrogenase activity(GO:0004457) L-lactate dehydrogenase activity(GO:0004459) |
| 0.2 | 0.7 | GO:0004583 | dolichyl-phosphate-glucose-glycolipid alpha-glucosyltransferase activity(GO:0004583) |
| 0.2 | 2.0 | GO:0000213 | tRNA-intron endonuclease activity(GO:0000213) |
| 0.2 | 1.6 | GO:0004366 | glycerol-3-phosphate O-acyltransferase activity(GO:0004366) |
| 0.2 | 2.5 | GO:0035252 | UDP-xylosyltransferase activity(GO:0035252) xylosyltransferase activity(GO:0042285) |
| 0.2 | 4.2 | GO:0008061 | chitin binding(GO:0008061) |
| 0.2 | 1.1 | GO:0008192 | RNA guanylyltransferase activity(GO:0008192) |
| 0.2 | 0.7 | GO:0019785 | ISG15-specific protease activity(GO:0019785) |
| 0.2 | 2.0 | GO:0004559 | alpha-mannosidase activity(GO:0004559) |
| 0.2 | 6.9 | GO:0004467 | long-chain fatty acid-CoA ligase activity(GO:0004467) |
| 0.2 | 2.0 | GO:0005052 | peroxisome matrix targeting signal-1 binding(GO:0005052) |
| 0.2 | 1.3 | GO:1902444 | riboflavin binding(GO:1902444) |
| 0.2 | 1.5 | GO:0004594 | pantothenate kinase activity(GO:0004594) |
| 0.2 | 2.4 | GO:0019826 | oxygen sensor activity(GO:0019826) |
| 0.2 | 0.9 | GO:0098770 | FBXO family protein binding(GO:0098770) |
| 0.2 | 2.4 | GO:0043139 | 5'-3' DNA helicase activity(GO:0043139) |
| 0.2 | 1.7 | GO:0031492 | nucleosomal DNA binding(GO:0031492) |
| 0.2 | 10.6 | GO:0004890 | GABA-A receptor activity(GO:0004890) |
| 0.2 | 0.6 | GO:0004574 | oligo-1,6-glucosidase activity(GO:0004574) |
| 0.2 | 1.1 | GO:0004994 | somatostatin receptor activity(GO:0004994) |
| 0.2 | 0.6 | GO:0004766 | spermidine synthase activity(GO:0004766) |
| 0.2 | 0.6 | GO:0004483 | mRNA (nucleoside-2'-O-)-methyltransferase activity(GO:0004483) |
| 0.2 | 0.4 | GO:0034483 | heparan sulfate sulfotransferase activity(GO:0034483) |
| 0.2 | 0.9 | GO:0050567 | glutaminyl-tRNA synthase (glutamine-hydrolyzing) activity(GO:0050567) |
| 0.2 | 2.1 | GO:0015277 | kainate selective glutamate receptor activity(GO:0015277) |
| 0.2 | 1.7 | GO:0002161 | aminoacyl-tRNA editing activity(GO:0002161) |
| 0.2 | 0.2 | GO:0051990 | (R)-2-hydroxyglutarate dehydrogenase activity(GO:0051990) |
| 0.2 | 0.8 | GO:0045127 | N-acetylglucosamine kinase activity(GO:0045127) |
| 0.2 | 2.3 | GO:0016885 | ligase activity, forming carbon-carbon bonds(GO:0016885) |
| 0.2 | 2.1 | GO:0039706 | co-receptor binding(GO:0039706) |
| 0.2 | 6.0 | GO:0008242 | omega peptidase activity(GO:0008242) |
| 0.2 | 0.6 | GO:0047708 | biotinidase activity(GO:0047708) |
| 0.2 | 1.0 | GO:0005087 | Ran guanyl-nucleotide exchange factor activity(GO:0005087) |
| 0.2 | 0.6 | GO:0046790 | virion binding(GO:0046790) |
| 0.2 | 0.6 | GO:0050571 | 1,5-anhydro-D-fructose reductase activity(GO:0050571) |
| 0.2 | 0.6 | GO:0042809 | vitamin D receptor binding(GO:0042809) |
| 0.2 | 0.8 | GO:0004079 | biotin-[acetyl-CoA-carboxylase] ligase activity(GO:0004077) biotin-[methylcrotonoyl-CoA-carboxylase] ligase activity(GO:0004078) biotin-[methylmalonyl-CoA-carboxytransferase] ligase activity(GO:0004079) biotin-[propionyl-CoA-carboxylase (ATP-hydrolyzing)] ligase activity(GO:0004080) biotin-protein ligase activity(GO:0018271) |
| 0.2 | 0.2 | GO:0015350 | methotrexate transporter activity(GO:0015350) |
| 0.2 | 1.8 | GO:0090599 | alpha-glucosidase activity(GO:0090599) |
| 0.2 | 1.6 | GO:1904288 | BAT3 complex binding(GO:1904288) |
| 0.2 | 1.8 | GO:0001225 | RNA polymerase II transcription coactivator binding(GO:0001225) |
| 0.2 | 1.4 | GO:0016936 | galactoside binding(GO:0016936) |
| 0.2 | 2.4 | GO:0042799 | histone methyltransferase activity (H4-K20 specific)(GO:0042799) |
| 0.2 | 1.0 | GO:0035473 | lipase binding(GO:0035473) |
| 0.2 | 0.6 | GO:0015227 | acyl carnitine transmembrane transporter activity(GO:0015227) |
| 0.2 | 2.0 | GO:0004126 | cytidine deaminase activity(GO:0004126) |
| 0.2 | 2.5 | GO:0008420 | CTD phosphatase activity(GO:0008420) |
| 0.2 | 1.9 | GO:0008310 | single-stranded DNA 3'-5' exodeoxyribonuclease activity(GO:0008310) |
| 0.2 | 0.8 | GO:0004102 | choline O-acetyltransferase activity(GO:0004102) |
| 0.2 | 0.2 | GO:0034739 | histone deacetylase activity (H4-K16 specific)(GO:0034739) |
| 0.2 | 1.9 | GO:0030348 | syntaxin-3 binding(GO:0030348) |
| 0.2 | 2.9 | GO:0004321 | fatty-acyl-CoA synthase activity(GO:0004321) |
| 0.2 | 7.7 | GO:0042165 | neurotransmitter binding(GO:0042165) |
| 0.2 | 0.2 | GO:0016778 | diphosphotransferase activity(GO:0016778) |
| 0.2 | 0.4 | GO:0035925 | mRNA 3'-UTR AU-rich region binding(GO:0035925) |
| 0.2 | 0.6 | GO:0001716 | L-amino-acid oxidase activity(GO:0001716) |
| 0.2 | 3.4 | GO:0048406 | nerve growth factor binding(GO:0048406) |
| 0.2 | 0.9 | GO:0003839 | gamma-glutamylcyclotransferase activity(GO:0003839) |
| 0.2 | 7.7 | GO:0003950 | NAD+ ADP-ribosyltransferase activity(GO:0003950) |
| 0.2 | 0.9 | GO:0030346 | protein phosphatase 2B binding(GO:0030346) |
| 0.2 | 0.9 | GO:0004357 | glutamate-cysteine ligase activity(GO:0004357) |
| 0.2 | 2.2 | GO:0033691 | sialic acid binding(GO:0033691) |
| 0.2 | 1.3 | GO:0050119 | N-acetylglucosamine deacetylase activity(GO:0050119) |
| 0.2 | 1.1 | GO:0035673 | oligopeptide transmembrane transporter activity(GO:0035673) |
| 0.2 | 0.7 | GO:0008113 | peptide-methionine (S)-S-oxide reductase activity(GO:0008113) |
| 0.2 | 0.6 | GO:0016309 | 1-phosphatidylinositol-5-phosphate 4-kinase activity(GO:0016309) |
| 0.2 | 0.9 | GO:0032052 | bile acid binding(GO:0032052) |
| 0.2 | 0.7 | GO:0004733 | pyridoxamine-phosphate oxidase activity(GO:0004733) |
| 0.2 | 0.7 | GO:0000033 | alpha-1,3-mannosyltransferase activity(GO:0000033) |
| 0.2 | 0.7 | GO:0005459 | UDP-galactose transmembrane transporter activity(GO:0005459) |
| 0.2 | 0.7 | GO:0030550 | acetylcholine receptor inhibitor activity(GO:0030550) |
| 0.2 | 5.5 | GO:0050321 | tau-protein kinase activity(GO:0050321) |
| 0.2 | 0.7 | GO:0015056 | corticotrophin-releasing factor receptor activity(GO:0015056) |
| 0.2 | 4.4 | GO:0070628 | proteasome binding(GO:0070628) |
| 0.2 | 0.5 | GO:0015299 | solute:proton antiporter activity(GO:0015299) |
| 0.2 | 2.2 | GO:0004931 | extracellular ATP-gated cation channel activity(GO:0004931) ATP-gated ion channel activity(GO:0035381) |
| 0.2 | 1.1 | GO:0005338 | nucleotide-sugar transmembrane transporter activity(GO:0005338) pyrimidine nucleotide-sugar transmembrane transporter activity(GO:0015165) |
| 0.2 | 2.0 | GO:0004311 | farnesyltranstransferase activity(GO:0004311) |
| 0.2 | 0.4 | GO:0000403 | Y-form DNA binding(GO:0000403) |
| 0.2 | 1.8 | GO:0043138 | 3'-5' DNA helicase activity(GO:0043138) |
| 0.2 | 0.7 | GO:0016639 | oxidoreductase activity, acting on the CH-NH2 group of donors, NAD or NADP as acceptor(GO:0016639) |
| 0.2 | 1.1 | GO:0004489 | methylenetetrahydrofolate reductase (NAD(P)H) activity(GO:0004489) |
| 0.2 | 3.9 | GO:0005176 | ErbB-2 class receptor binding(GO:0005176) |
| 0.2 | 2.1 | GO:0001013 | RNA polymerase I regulatory region DNA binding(GO:0001013) RNA polymerase I regulatory region sequence-specific DNA binding(GO:0001163) RNA polymerase I CORE element sequence-specific DNA binding(GO:0001164) |
| 0.2 | 1.0 | GO:0004809 | tRNA (guanine-N2-)-methyltransferase activity(GO:0004809) |
| 0.2 | 3.3 | GO:0016864 | protein disulfide isomerase activity(GO:0003756) intramolecular oxidoreductase activity, transposing S-S bonds(GO:0016864) |
| 0.2 | 1.7 | GO:0030250 | cyclase activator activity(GO:0010853) guanylate cyclase activator activity(GO:0030250) |
| 0.2 | 0.5 | GO:0030943 | mitochondrion targeting sequence binding(GO:0030943) |
| 0.2 | 2.1 | GO:0043142 | single-stranded DNA-dependent ATPase activity(GO:0043142) |
| 0.2 | 3.1 | GO:0003995 | acyl-CoA dehydrogenase activity(GO:0003995) |
| 0.2 | 0.7 | GO:0008336 | gamma-butyrobetaine dioxygenase activity(GO:0008336) |
| 0.2 | 0.3 | GO:0004582 | dolichyl-phosphate beta-D-mannosyltransferase activity(GO:0004582) |
| 0.2 | 0.2 | GO:0044547 | DNA topoisomerase binding(GO:0044547) |
| 0.2 | 1.9 | GO:0052833 | inositol monophosphate 1-phosphatase activity(GO:0008934) inositol monophosphate 3-phosphatase activity(GO:0052832) inositol monophosphate 4-phosphatase activity(GO:0052833) inositol monophosphate phosphatase activity(GO:0052834) |
| 0.2 | 0.5 | GO:0061629 | RNA polymerase II sequence-specific DNA binding transcription factor binding(GO:0061629) |
| 0.2 | 1.2 | GO:0015184 | L-cystine transmembrane transporter activity(GO:0015184) |
| 0.2 | 1.0 | GO:0008453 | alanine-glyoxylate transaminase activity(GO:0008453) |
| 0.2 | 1.5 | GO:0034603 | pyruvate dehydrogenase activity(GO:0004738) pyruvate dehydrogenase [NAD(P)+] activity(GO:0034603) pyruvate dehydrogenase (NAD+) activity(GO:0034604) |
| 0.2 | 3.0 | GO:0004659 | prenyltransferase activity(GO:0004659) |
| 0.2 | 1.2 | GO:0070742 | C2H2 zinc finger domain binding(GO:0070742) |
| 0.2 | 1.4 | GO:0005124 | scavenger receptor binding(GO:0005124) |
| 0.2 | 1.2 | GO:0043515 | kinetochore binding(GO:0043515) |
| 0.2 | 1.2 | GO:0003987 | acetate-CoA ligase activity(GO:0003987) |
| 0.2 | 1.7 | GO:0030160 | GKAP/Homer scaffold activity(GO:0030160) |
| 0.2 | 2.0 | GO:0043023 | ribosomal large subunit binding(GO:0043023) |
| 0.2 | 0.8 | GO:0035173 | histone kinase activity(GO:0035173) |
| 0.2 | 0.7 | GO:0005011 | macrophage colony-stimulating factor receptor activity(GO:0005011) |
| 0.2 | 0.5 | GO:0003878 | ATP citrate synthase activity(GO:0003878) |
| 0.2 | 3.1 | GO:0047372 | acylglycerol lipase activity(GO:0047372) |
| 0.2 | 0.7 | GO:0048040 | UDP-glucuronate decarboxylase activity(GO:0048040) |
| 0.2 | 2.8 | GO:0019531 | oxalate transmembrane transporter activity(GO:0019531) |
| 0.2 | 2.1 | GO:0004972 | NMDA glutamate receptor activity(GO:0004972) |
| 0.2 | 1.0 | GO:0005353 | fructose transmembrane transporter activity(GO:0005353) |
| 0.2 | 1.1 | GO:0004035 | alkaline phosphatase activity(GO:0004035) |
| 0.2 | 1.3 | GO:0097027 | ubiquitin-protein transferase activator activity(GO:0097027) |
| 0.2 | 0.5 | GO:0032143 | single thymine insertion binding(GO:0032143) |
| 0.2 | 5.7 | GO:0045505 | dynein intermediate chain binding(GO:0045505) |
| 0.2 | 0.6 | GO:0016300 | tRNA (uracil) methyltransferase activity(GO:0016300) |
| 0.2 | 0.5 | GO:0004090 | carbonyl reductase (NADPH) activity(GO:0004090) |
| 0.2 | 0.5 | GO:1990841 | promoter-specific chromatin binding(GO:1990841) |
| 0.2 | 5.1 | GO:0097109 | neuroligin family protein binding(GO:0097109) |
| 0.2 | 4.0 | GO:0015467 | G-protein activated inward rectifier potassium channel activity(GO:0015467) |
| 0.2 | 0.8 | GO:0016429 | tRNA (adenine-N1-)-methyltransferase activity(GO:0016429) |
| 0.2 | 0.5 | GO:0005026 | transforming growth factor beta receptor activity, type II(GO:0005026) |
| 0.2 | 0.2 | GO:0015616 | DNA translocase activity(GO:0015616) |
| 0.2 | 1.3 | GO:0047756 | chondroitin 4-sulfotransferase activity(GO:0047756) |
| 0.2 | 1.6 | GO:0003876 | AMP deaminase activity(GO:0003876) adenosine-phosphate deaminase activity(GO:0047623) |
| 0.2 | 0.5 | GO:0016263 | glycoprotein-N-acetylgalactosamine 3-beta-galactosyltransferase activity(GO:0016263) |
| 0.2 | 0.8 | GO:0061575 | cyclin-dependent protein serine/threonine kinase activator activity(GO:0061575) |
| 0.2 | 4.3 | GO:0051537 | 2 iron, 2 sulfur cluster binding(GO:0051537) |
| 0.2 | 0.5 | GO:0005219 | ryanodine-sensitive calcium-release channel activity(GO:0005219) |
| 0.2 | 0.5 | GO:0015464 | acetylcholine receptor activity(GO:0015464) |
| 0.2 | 6.0 | GO:0050660 | flavin adenine dinucleotide binding(GO:0050660) |
| 0.2 | 0.6 | GO:0070411 | I-SMAD binding(GO:0070411) |
| 0.2 | 6.8 | GO:0070064 | proline-rich region binding(GO:0070064) |
| 0.2 | 0.8 | GO:0004351 | glutamate decarboxylase activity(GO:0004351) |
| 0.2 | 5.5 | GO:0050661 | NADP binding(GO:0050661) |
| 0.2 | 0.5 | GO:0004032 | alditol:NADP+ 1-oxidoreductase activity(GO:0004032) |
| 0.2 | 1.2 | GO:0052795 | exo-alpha-(2->3)-sialidase activity(GO:0052794) exo-alpha-(2->6)-sialidase activity(GO:0052795) exo-alpha-(2->8)-sialidase activity(GO:0052796) |
| 0.2 | 0.8 | GO:0043035 | chromatin insulator sequence binding(GO:0043035) |
| 0.2 | 0.3 | GO:0070905 | serine binding(GO:0070905) |
| 0.2 | 0.5 | GO:0004060 | arylamine N-acetyltransferase activity(GO:0004060) |
| 0.2 | 0.5 | GO:0035529 | NADH pyrophosphatase activity(GO:0035529) |
| 0.2 | 2.9 | GO:0031996 | thioesterase binding(GO:0031996) |
| 0.1 | 1.2 | GO:0004137 | deoxycytidine kinase activity(GO:0004137) |
| 0.1 | 0.4 | GO:0036134 | thromboxane-A synthase activity(GO:0004796) 12-hydroxyheptadecatrienoic acid synthase activity(GO:0036134) |
| 0.1 | 0.6 | GO:0036137 | kynurenine-oxoglutarate transaminase activity(GO:0016212) kynurenine aminotransferase activity(GO:0036137) |
| 0.1 | 2.1 | GO:0008568 | microtubule-severing ATPase activity(GO:0008568) |
| 0.1 | 0.7 | GO:0070137 | ubiquitin-like protein-specific endopeptidase activity(GO:0070137) SUMO-specific endopeptidase activity(GO:0070139) |
| 0.1 | 0.6 | GO:0032440 | 2-alkenal reductase [NAD(P)] activity(GO:0032440) |
| 0.1 | 0.4 | GO:0001537 | N-acetylgalactosamine 4-O-sulfotransferase activity(GO:0001537) |
| 0.1 | 1.2 | GO:0004652 | polynucleotide adenylyltransferase activity(GO:0004652) |
| 0.1 | 1.3 | GO:0003846 | 2-acylglycerol O-acyltransferase activity(GO:0003846) |
| 0.1 | 0.9 | GO:0055106 | ubiquitin-protein transferase regulator activity(GO:0055106) |
| 0.1 | 2.2 | GO:0019841 | retinol binding(GO:0019841) |
| 0.1 | 3.1 | GO:0071949 | FAD binding(GO:0071949) |
| 0.1 | 2.9 | GO:0005247 | voltage-gated chloride channel activity(GO:0005247) |
| 0.1 | 0.4 | GO:0099530 | G-protein coupled receptor activity involved in regulation of postsynaptic membrane potential(GO:0099530) |
| 0.1 | 0.7 | GO:0003896 | DNA primase activity(GO:0003896) |
| 0.1 | 1.6 | GO:0060002 | plus-end directed microfilament motor activity(GO:0060002) |
| 0.1 | 11.6 | GO:0008138 | protein tyrosine/serine/threonine phosphatase activity(GO:0008138) |
| 0.1 | 1.6 | GO:0097322 | 7SK snRNA binding(GO:0097322) |
| 0.1 | 0.4 | GO:0008970 | phosphatidylcholine 1-acylhydrolase activity(GO:0008970) |
| 0.1 | 1.3 | GO:1990829 | C-rich single-stranded DNA binding(GO:1990829) |
| 0.1 | 5.3 | GO:0016709 | oxidoreductase activity, acting on paired donors, with incorporation or reduction of molecular oxygen, NAD(P)H as one donor, and incorporation of one atom of oxygen(GO:0016709) |
| 0.1 | 0.7 | GO:0005275 | amine transmembrane transporter activity(GO:0005275) |
| 0.1 | 1.0 | GO:0030298 | receptor signaling protein tyrosine kinase activator activity(GO:0030298) |
| 0.1 | 0.8 | GO:0015450 | P-P-bond-hydrolysis-driven protein transmembrane transporter activity(GO:0015450) |
| 0.1 | 0.1 | GO:0045322 | unmethylated CpG binding(GO:0045322) |
| 0.1 | 0.4 | GO:0030366 | molybdopterin synthase activity(GO:0030366) |
| 0.1 | 1.1 | GO:0051033 | nucleic acid transmembrane transporter activity(GO:0051032) RNA transmembrane transporter activity(GO:0051033) |
| 0.1 | 0.6 | GO:0005375 | copper ion transmembrane transporter activity(GO:0005375) |
| 0.1 | 1.0 | GO:0030144 | alpha-1,6-mannosylglycoprotein 6-beta-N-acetylglucosaminyltransferase activity(GO:0030144) |
| 0.1 | 1.1 | GO:0045134 | uridine-diphosphatase activity(GO:0045134) |
| 0.1 | 0.8 | GO:0070704 | C-5 sterol desaturase activity(GO:0000248) sterol desaturase activity(GO:0070704) |
| 0.1 | 2.3 | GO:0051959 | dynein light intermediate chain binding(GO:0051959) |
| 0.1 | 1.0 | GO:0042500 | aspartic endopeptidase activity, intramembrane cleaving(GO:0042500) |
| 0.1 | 1.5 | GO:0044323 | retinoic acid-responsive element binding(GO:0044323) |
| 0.1 | 1.0 | GO:0016671 | oxidoreductase activity, acting on a sulfur group of donors, disulfide as acceptor(GO:0016671) |
| 0.1 | 0.5 | GO:1903136 | cuprous ion binding(GO:1903136) |
| 0.1 | 5.0 | GO:0030332 | cyclin binding(GO:0030332) |
| 0.1 | 8.5 | GO:0030145 | manganese ion binding(GO:0030145) |
| 0.1 | 1.6 | GO:0016423 | tRNA (guanine) methyltransferase activity(GO:0016423) |
| 0.1 | 0.5 | GO:0004937 | alpha1-adrenergic receptor activity(GO:0004937) |
| 0.1 | 2.9 | GO:0008353 | RNA polymerase II carboxy-terminal domain kinase activity(GO:0008353) |
| 0.1 | 1.6 | GO:0005542 | folic acid binding(GO:0005542) |
| 0.1 | 5.6 | GO:0043560 | insulin receptor substrate binding(GO:0043560) |
| 0.1 | 0.3 | GO:0000990 | transcription factor activity, core RNA polymerase binding(GO:0000990) |
| 0.1 | 0.5 | GO:0004525 | ribonuclease III activity(GO:0004525) double-stranded RNA-specific ribonuclease activity(GO:0032296) |
| 0.1 | 0.7 | GO:0008263 | pyrimidine-specific mismatch base pair DNA N-glycosylase activity(GO:0008263) |
| 0.1 | 0.5 | GO:0004534 | 5'-3' exoribonuclease activity(GO:0004534) |
| 0.1 | 1.6 | GO:0017110 | nucleoside-diphosphatase activity(GO:0017110) |
| 0.1 | 0.1 | GO:0048257 | 3'-flap endonuclease activity(GO:0048257) |
| 0.1 | 0.1 | GO:0043559 | insulin binding(GO:0043559) |
| 0.1 | 4.9 | GO:0043539 | protein serine/threonine kinase activator activity(GO:0043539) |
| 0.1 | 33.7 | GO:0042393 | histone binding(GO:0042393) |
| 0.1 | 4.0 | GO:0001972 | retinoic acid binding(GO:0001972) |
| 0.1 | 2.5 | GO:0004812 | aminoacyl-tRNA ligase activity(GO:0004812) ligase activity, forming carbon-oxygen bonds(GO:0016875) ligase activity, forming aminoacyl-tRNA and related compounds(GO:0016876) |
| 0.1 | 0.9 | GO:0004169 | dolichyl-phosphate-mannose-protein mannosyltransferase activity(GO:0004169) |
| 0.1 | 2.1 | GO:0034452 | dynactin binding(GO:0034452) |
| 0.1 | 4.6 | GO:0005388 | calcium-transporting ATPase activity(GO:0005388) |
| 0.1 | 0.5 | GO:0036132 | 13-prostaglandin reductase activity(GO:0036132) 15-oxoprostaglandin 13-oxidase activity(GO:0047522) |
| 0.1 | 10.8 | GO:0004407 | histone deacetylase activity(GO:0004407) |
| 0.1 | 0.4 | GO:0031531 | thyrotropin-releasing hormone receptor binding(GO:0031531) |
| 0.1 | 2.5 | GO:0019213 | deacetylase activity(GO:0019213) |
| 0.1 | 0.5 | GO:0008260 | 3-oxoacid CoA-transferase activity(GO:0008260) |
| 0.1 | 1.4 | GO:0016286 | small conductance calcium-activated potassium channel activity(GO:0016286) |
| 0.1 | 1.0 | GO:0035368 | selenocysteine insertion sequence binding(GO:0035368) |
| 0.1 | 10.0 | GO:0019894 | kinesin binding(GO:0019894) |
| 0.1 | 3.8 | GO:0000900 | translation repressor activity, nucleic acid binding(GO:0000900) |
| 0.1 | 4.0 | GO:0017056 | structural constituent of nuclear pore(GO:0017056) |
| 0.1 | 0.1 | GO:0008410 | CoA-transferase activity(GO:0008410) |
| 0.1 | 0.4 | GO:0005499 | vitamin D binding(GO:0005499) |
| 0.1 | 16.0 | GO:0008080 | N-acetyltransferase activity(GO:0008080) |
| 0.1 | 3.6 | GO:0003887 | DNA-directed DNA polymerase activity(GO:0003887) |
| 0.1 | 0.2 | GO:0008391 | arachidonic acid monooxygenase activity(GO:0008391) arachidonic acid epoxygenase activity(GO:0008392) |
| 0.1 | 0.5 | GO:0035663 | Toll-like receptor 2 binding(GO:0035663) |
| 0.1 | 1.1 | GO:0001075 | transcription factor activity, RNA polymerase II core promoter sequence-specific binding involved in preinitiation complex assembly(GO:0001075) |
| 0.1 | 2.6 | GO:0031702 | type 1 angiotensin receptor binding(GO:0031702) |
| 0.1 | 4.0 | GO:0005326 | neurotransmitter transporter activity(GO:0005326) |
| 0.1 | 1.7 | GO:0008020 | G-protein coupled photoreceptor activity(GO:0008020) |
| 0.1 | 0.7 | GO:0051373 | FATZ binding(GO:0051373) |
| 0.1 | 1.8 | GO:0016846 | carbon-sulfur lyase activity(GO:0016846) |
| 0.1 | 1.5 | GO:0070883 | pre-miRNA binding(GO:0070883) |
| 0.1 | 0.7 | GO:0047894 | flavonol 3-sulfotransferase activity(GO:0047894) |
| 0.1 | 0.6 | GO:0004127 | cytidylate kinase activity(GO:0004127) |
| 0.1 | 2.0 | GO:0016763 | transferase activity, transferring pentosyl groups(GO:0016763) |
| 0.1 | 3.8 | GO:0015269 | calcium-activated potassium channel activity(GO:0015269) |
| 0.1 | 0.5 | GO:0009881 | photoreceptor activity(GO:0009881) |
| 0.1 | 0.5 | GO:0004905 | type I interferon receptor activity(GO:0004905) |
| 0.1 | 0.5 | GO:0004782 | sulfinoalanine decarboxylase activity(GO:0004782) |
| 0.1 | 1.9 | GO:0015020 | glucuronosyltransferase activity(GO:0015020) |
| 0.1 | 0.3 | GO:0016794 | guanosine-3',5'-bis(diphosphate) 3'-diphosphatase activity(GO:0008893) diphosphoric monoester hydrolase activity(GO:0016794) |
| 0.1 | 0.3 | GO:0004132 | dCMP deaminase activity(GO:0004132) |
| 0.1 | 0.6 | GO:0000404 | heteroduplex DNA loop binding(GO:0000404) |
| 0.1 | 5.4 | GO:0008094 | DNA-dependent ATPase activity(GO:0008094) |
| 0.1 | 0.2 | GO:0070039 | rRNA (guanosine-2'-O-)-methyltransferase activity(GO:0070039) |
| 0.1 | 2.8 | GO:0071837 | HMG box domain binding(GO:0071837) |
| 0.1 | 0.4 | GO:0005483 | soluble NSF attachment protein activity(GO:0005483) |
| 0.1 | 0.9 | GO:0099602 | acetylcholine receptor regulator activity(GO:0030548) neurotransmitter receptor regulator activity(GO:0099602) |
| 0.1 | 0.4 | GO:0016495 | C-X3-C chemokine receptor activity(GO:0016495) |
| 0.1 | 0.3 | GO:0016517 | interleukin-12 receptor activity(GO:0016517) |
| 0.1 | 0.7 | GO:0031708 | endothelin B receptor binding(GO:0031708) |
| 0.1 | 0.5 | GO:0008504 | monoamine transmembrane transporter activity(GO:0008504) |
| 0.1 | 1.0 | GO:0008379 | thioredoxin peroxidase activity(GO:0008379) |
| 0.1 | 1.7 | GO:0030544 | Hsp70 protein binding(GO:0030544) |
| 0.1 | 6.2 | GO:0031369 | translation initiation factor binding(GO:0031369) |
| 0.1 | 0.3 | GO:0031862 | prostanoid receptor binding(GO:0031862) |
| 0.1 | 0.7 | GO:0035198 | miRNA binding(GO:0035198) |
| 0.1 | 0.5 | GO:0050501 | hyaluronan synthase activity(GO:0050501) |
| 0.1 | 0.3 | GO:0004142 | diacylglycerol cholinephosphotransferase activity(GO:0004142) |
| 0.1 | 0.3 | GO:0018479 | benzaldehyde dehydrogenase (NAD+) activity(GO:0018479) |
| 0.1 | 0.1 | GO:0072320 | volume-sensitive chloride channel activity(GO:0072320) |
| 0.1 | 8.7 | GO:0004177 | aminopeptidase activity(GO:0004177) |
| 0.1 | 2.6 | GO:0008349 | MAP kinase kinase kinase kinase activity(GO:0008349) |
| 0.1 | 0.7 | GO:0004045 | aminoacyl-tRNA hydrolase activity(GO:0004045) |
| 0.1 | 5.2 | GO:0030676 | Rac guanyl-nucleotide exchange factor activity(GO:0030676) |
| 0.1 | 1.4 | GO:0051787 | misfolded protein binding(GO:0051787) |
| 0.1 | 0.3 | GO:0008502 | melatonin receptor activity(GO:0008502) |
| 0.1 | 1.3 | GO:0052650 | NADP-retinol dehydrogenase activity(GO:0052650) |
| 0.1 | 0.1 | GO:0019808 | polyamine binding(GO:0019808) |
| 0.1 | 1.8 | GO:0000030 | mannosyltransferase activity(GO:0000030) |
| 0.1 | 1.5 | GO:1904264 | ubiquitin protein ligase activity involved in ERAD pathway(GO:1904264) |
| 0.1 | 0.6 | GO:0008532 | N-acetyllactosaminide beta-1,3-N-acetylglucosaminyltransferase activity(GO:0008532) |
| 0.1 | 0.3 | GO:0097604 | temperature-gated cation channel activity(GO:0097604) |
| 0.1 | 2.6 | GO:0004000 | adenosine deaminase activity(GO:0004000) |
| 0.1 | 0.5 | GO:0004912 | interleukin-3 receptor activity(GO:0004912) interleukin-5 receptor activity(GO:0004914) |
| 0.1 | 0.4 | GO:0032137 | guanine/thymine mispair binding(GO:0032137) |
| 0.1 | 0.1 | GO:0004566 | beta-glucuronidase activity(GO:0004566) |
| 0.1 | 0.2 | GO:0097363 | protein O-GlcNAc transferase activity(GO:0097363) |
| 0.1 | 1.5 | GO:0004579 | dolichyl-diphosphooligosaccharide-protein glycotransferase activity(GO:0004579) |
| 0.1 | 0.3 | GO:0033981 | D-dopachrome decarboxylase activity(GO:0033981) |
| 0.1 | 0.4 | GO:0050508 | glucuronosyl-N-acetylglucosaminyl-proteoglycan 4-alpha-N-acetylglucosaminyltransferase activity(GO:0050508) |
| 0.1 | 2.5 | GO:0008395 | steroid hydroxylase activity(GO:0008395) |
| 0.1 | 0.4 | GO:0004853 | uroporphyrinogen decarboxylase activity(GO:0004853) |
| 0.1 | 0.8 | GO:1901567 | icosanoid binding(GO:0050542) fatty acid derivative binding(GO:1901567) |
| 0.1 | 0.8 | GO:0043024 | ribosomal small subunit binding(GO:0043024) |
| 0.1 | 1.1 | GO:0008409 | 5'-3' exonuclease activity(GO:0008409) |
| 0.1 | 0.4 | GO:0032090 | Pyrin domain binding(GO:0032090) |
| 0.1 | 9.3 | GO:0003777 | microtubule motor activity(GO:0003777) |
| 0.1 | 0.6 | GO:0015093 | ferrous iron transmembrane transporter activity(GO:0015093) |
| 0.1 | 3.4 | GO:0042288 | MHC class I protein binding(GO:0042288) |
| 0.1 | 0.4 | GO:0016979 | lipoate-protein ligase activity(GO:0016979) |
| 0.1 | 0.6 | GO:0015266 | protein channel activity(GO:0015266) |
| 0.1 | 0.4 | GO:0005163 | nerve growth factor receptor binding(GO:0005163) |
| 0.1 | 0.6 | GO:0031435 | mitogen-activated protein kinase kinase kinase binding(GO:0031435) |
| 0.1 | 0.3 | GO:0008384 | IkappaB kinase activity(GO:0008384) |
| 0.1 | 3.2 | GO:0016831 | carboxy-lyase activity(GO:0016831) |
| 0.1 | 0.4 | GO:0005115 | receptor tyrosine kinase-like orphan receptor binding(GO:0005115) chemoattractant activity involved in axon guidance(GO:1902379) |
| 0.1 | 0.8 | GO:0004704 | NF-kappaB-inducing kinase activity(GO:0004704) |
| 0.1 | 0.3 | GO:0001025 | RNA polymerase III transcription factor binding(GO:0001025) TFIIIC-class transcription factor binding(GO:0001156) |
| 0.1 | 0.5 | GO:0046933 | proton-transporting ATP synthase activity, rotational mechanism(GO:0046933) |
| 0.1 | 9.5 | GO:0000979 | RNA polymerase II core promoter sequence-specific DNA binding(GO:0000979) |
| 0.1 | 10.8 | GO:0030276 | clathrin binding(GO:0030276) |
| 0.1 | 21.0 | GO:0017137 | Rab GTPase binding(GO:0017137) |
| 0.1 | 0.3 | GO:0070975 | FHA domain binding(GO:0070975) |
| 0.1 | 2.5 | GO:0019992 | diacylglycerol binding(GO:0019992) |
| 0.1 | 1.5 | GO:0001730 | 2'-5'-oligoadenylate synthetase activity(GO:0001730) |
| 0.1 | 0.4 | GO:0008169 | C-methyltransferase activity(GO:0008169) |
| 0.1 | 4.4 | GO:0031624 | ubiquitin conjugating enzyme binding(GO:0031624) |
| 0.1 | 0.4 | GO:0003858 | 3-hydroxybutyrate dehydrogenase activity(GO:0003858) |
| 0.1 | 2.3 | GO:0034237 | protein kinase A regulatory subunit binding(GO:0034237) |
| 0.1 | 0.4 | GO:0051765 | inositol tetrakisphosphate kinase activity(GO:0051765) |
| 0.1 | 0.1 | GO:0001077 | transcriptional activator activity, RNA polymerase II core promoter proximal region sequence-specific binding(GO:0001077) |
| 0.1 | 1.8 | GO:0001206 | transcriptional repressor activity, RNA polymerase II distal enhancer sequence-specific binding(GO:0001206) |
| 0.1 | 0.1 | GO:0008534 | oxidized purine nucleobase lesion DNA N-glycosylase activity(GO:0008534) |
| 0.1 | 0.3 | GO:1904455 | ubiquitin-specific protease activity involved in negative regulation of ERAD pathway(GO:1904455) |
| 0.1 | 0.6 | GO:0097199 | cysteine-type endopeptidase activity involved in apoptotic signaling pathway(GO:0097199) |
| 0.1 | 0.3 | GO:0050253 | retinyl-palmitate esterase activity(GO:0050253) |
| 0.1 | 1.9 | GO:0005123 | death receptor binding(GO:0005123) |
| 0.1 | 0.2 | GO:0016453 | C-acetyltransferase activity(GO:0016453) |
| 0.1 | 3.4 | GO:0005385 | zinc ion transmembrane transporter activity(GO:0005385) |
| 0.1 | 0.1 | GO:0047718 | geranylgeranyl reductase activity(GO:0045550) indanol dehydrogenase activity(GO:0047718) |
| 0.1 | 0.6 | GO:0004920 | interleukin-10 receptor activity(GO:0004920) |
| 0.1 | 0.2 | GO:0090409 | malonyl-CoA synthetase activity(GO:0090409) |
| 0.1 | 1.2 | GO:0043225 | anion transmembrane-transporting ATPase activity(GO:0043225) |
| 0.1 | 0.2 | GO:0016427 | tRNA (cytosine) methyltransferase activity(GO:0016427) |
| 0.1 | 0.5 | GO:0005220 | inositol 1,4,5-trisphosphate-sensitive calcium-release channel activity(GO:0005220) |
| 0.1 | 0.3 | GO:0052744 | phosphatidylinositol-3-phosphatase activity(GO:0004438) phosphatidylinositol monophosphate phosphatase activity(GO:0052744) |
| 0.1 | 0.2 | GO:0051717 | inositol-1,3,4,5-tetrakisphosphate 3-phosphatase activity(GO:0051717) |
| 0.1 | 0.6 | GO:1990405 | protein antigen binding(GO:1990405) |
| 0.1 | 0.7 | GO:0034711 | inhibin binding(GO:0034711) |
| 0.1 | 0.6 | GO:0060698 | endoribonuclease inhibitor activity(GO:0060698) |
| 0.1 | 7.9 | GO:0070491 | repressing transcription factor binding(GO:0070491) |
| 0.1 | 2.3 | GO:0008066 | glutamate receptor activity(GO:0008066) |
| 0.1 | 0.2 | GO:0000995 | transcription factor activity, core RNA polymerase III binding(GO:0000995) |
| 0.1 | 0.2 | GO:0004549 | tRNA-specific ribonuclease activity(GO:0004549) |
| 0.1 | 0.9 | GO:0019239 | deaminase activity(GO:0019239) |
| 0.1 | 0.2 | GO:0052857 | NADHX epimerase activity(GO:0052856) NADPHX epimerase activity(GO:0052857) |
| 0.1 | 1.5 | GO:0001055 | RNA polymerase II activity(GO:0001055) |
| 0.1 | 0.7 | GO:0016208 | AMP binding(GO:0016208) |
| 0.1 | 0.8 | GO:0015129 | lactate transmembrane transporter activity(GO:0015129) |
| 0.1 | 0.3 | GO:0001632 | leukotriene B4 receptor activity(GO:0001632) |
| 0.1 | 3.7 | GO:0008028 | monocarboxylic acid transmembrane transporter activity(GO:0008028) |
| 0.1 | 1.0 | GO:0015036 | disulfide oxidoreductase activity(GO:0015036) |
| 0.1 | 0.3 | GO:0016895 | exodeoxyribonuclease activity(GO:0004529) exodeoxyribonuclease activity, producing 5'-phosphomonoesters(GO:0016895) |
| 0.1 | 0.2 | GO:0000035 | acyl binding(GO:0000035) |
| 0.1 | 0.2 | GO:0015275 | stretch-activated, cation-selective, calcium channel activity(GO:0015275) |
| 0.1 | 0.5 | GO:0035259 | glucocorticoid receptor binding(GO:0035259) |
| 0.1 | 0.2 | GO:0050146 | nucleoside phosphotransferase activity(GO:0050146) |
| 0.1 | 0.1 | GO:0004798 | thymidylate kinase activity(GO:0004798) |
| 0.1 | 0.6 | GO:0050733 | RS domain binding(GO:0050733) |
| 0.1 | 1.0 | GO:0042975 | peroxisome proliferator activated receptor binding(GO:0042975) |
| 0.1 | 0.5 | GO:0000179 | rRNA (adenine-N6,N6-)-dimethyltransferase activity(GO:0000179) |
| 0.1 | 1.3 | GO:0005003 | ephrin receptor activity(GO:0005003) |
| 0.1 | 2.4 | GO:0046966 | thyroid hormone receptor binding(GO:0046966) |
| 0.1 | 0.4 | GO:0004427 | inorganic diphosphatase activity(GO:0004427) |
| 0.1 | 0.2 | GO:0050333 | thiamin-triphosphatase activity(GO:0050333) |
| 0.1 | 1.2 | GO:0005537 | mannose binding(GO:0005537) |
| 0.1 | 0.1 | GO:0016744 | transferase activity, transferring aldehyde or ketonic groups(GO:0016744) |
| 0.1 | 0.1 | GO:0071987 | WD40-repeat domain binding(GO:0071987) |
| 0.1 | 10.2 | GO:0004386 | helicase activity(GO:0004386) |
| 0.1 | 0.6 | GO:0070891 | lipoteichoic acid binding(GO:0070891) |
| 0.1 | 1.3 | GO:0036442 | hydrogen-exporting ATPase activity(GO:0036442) |
| 0.1 | 0.3 | GO:0052829 | inositol-1,4-bisphosphate 1-phosphatase activity(GO:0004441) inositol-1,3,4-trisphosphate 1-phosphatase activity(GO:0052829) |
| 0.1 | 0.5 | GO:0003857 | 3-hydroxyacyl-CoA dehydrogenase activity(GO:0003857) |
| 0.1 | 1.2 | GO:0004033 | aldo-keto reductase (NADP) activity(GO:0004033) |
| 0.1 | 0.1 | GO:0030156 | benzodiazepine receptor binding(GO:0030156) |
| 0.1 | 2.1 | GO:0015301 | anion:anion antiporter activity(GO:0015301) |
| 0.1 | 0.8 | GO:0005225 | volume-sensitive anion channel activity(GO:0005225) |
| 0.1 | 0.5 | GO:0036312 | phosphatidylinositol 3-kinase regulatory subunit binding(GO:0036312) |
| 0.1 | 0.3 | GO:0019981 | interleukin-6 receptor activity(GO:0004915) interleukin-6 binding(GO:0019981) |
| 0.1 | 0.4 | GO:0050436 | microfibril binding(GO:0050436) |
| 0.1 | 0.8 | GO:0051378 | amine binding(GO:0043176) serotonin binding(GO:0051378) |
| 0.1 | 0.9 | GO:0005149 | interleukin-1 receptor binding(GO:0005149) |
| 0.1 | 0.3 | GO:0046964 | 3'-phosphoadenosine 5'-phosphosulfate transmembrane transporter activity(GO:0046964) |
| 0.1 | 0.3 | GO:0005042 | netrin receptor activity(GO:0005042) |
| 0.1 | 0.2 | GO:0016436 | rRNA (uridine-2'-O-)-methyltransferase activity(GO:0008650) rRNA (uridine) methyltransferase activity(GO:0016436) |
| 0.1 | 0.1 | GO:0030109 | HLA-B specific inhibitory MHC class I receptor activity(GO:0030109) inhibitory MHC class I receptor activity(GO:0032396) |
| 0.1 | 0.6 | GO:0000827 | inositol-1,3,4,5,6-pentakisphosphate kinase activity(GO:0000827) inositol hexakisphosphate kinase activity(GO:0000828) inositol heptakisphosphate kinase activity(GO:0000829) inositol hexakisphosphate 5-kinase activity(GO:0000832) inositol hexakisphosphate 1-kinase activity(GO:0052723) inositol hexakisphosphate 3-kinase activity(GO:0052724) |
| 0.1 | 2.3 | GO:0005229 | intracellular calcium activated chloride channel activity(GO:0005229) |
| 0.1 | 0.6 | GO:0061578 | Lys63-specific deubiquitinase activity(GO:0061578) |
| 0.1 | 2.2 | GO:0015175 | neutral amino acid transmembrane transporter activity(GO:0015175) |
| 0.1 | 0.2 | GO:0004531 | deoxyribonuclease II activity(GO:0004531) |
| 0.1 | 40.2 | GO:0004842 | ubiquitin-protein transferase activity(GO:0004842) |
| 0.1 | 1.4 | GO:0016881 | acid-amino acid ligase activity(GO:0016881) |
| 0.1 | 0.8 | GO:0004993 | G-protein coupled serotonin receptor activity(GO:0004993) |
| 0.1 | 0.9 | GO:0016891 | endoribonuclease activity, producing 5'-phosphomonoesters(GO:0016891) |
| 0.1 | 0.6 | GO:0030369 | ICAM-3 receptor activity(GO:0030369) |
| 0.1 | 0.4 | GO:0030060 | L-malate dehydrogenase activity(GO:0030060) |
| 0.1 | 0.8 | GO:0016884 | carbon-nitrogen ligase activity, with glutamine as amido-N-donor(GO:0016884) |
| 0.1 | 1.6 | GO:0005528 | macrolide binding(GO:0005527) FK506 binding(GO:0005528) |
| 0.1 | 0.2 | GO:0042015 | interleukin-20 binding(GO:0042015) |
| 0.1 | 0.3 | GO:0046935 | 1-phosphatidylinositol-3-kinase regulator activity(GO:0046935) |
| 0.1 | 0.2 | GO:0002046 | opsin binding(GO:0002046) |
| 0.1 | 1.6 | GO:0097200 | cysteine-type endopeptidase activity involved in execution phase of apoptosis(GO:0097200) |
| 0.1 | 0.5 | GO:0030368 | interleukin-17 receptor activity(GO:0030368) |
| 0.1 | 0.2 | GO:0046975 | histone methyltransferase activity (H3-K36 specific)(GO:0046975) |
| 0.1 | 1.4 | GO:0030515 | snoRNA binding(GO:0030515) |
| 0.1 | 0.2 | GO:0010858 | calcium-dependent protein kinase inhibitor activity(GO:0008427) calcium-dependent protein kinase regulator activity(GO:0010858) |
| 0.1 | 1.8 | GO:0097493 | structural molecule activity conferring elasticity(GO:0097493) |
| 0.1 | 0.6 | GO:0071253 | connexin binding(GO:0071253) |
| 0.1 | 0.5 | GO:0016742 | hydroxymethyl-, formyl- and related transferase activity(GO:0016742) |
| 0.1 | 0.4 | GO:0016783 | sulfurtransferase activity(GO:0016783) |
| 0.1 | 0.5 | GO:0070087 | chromo shadow domain binding(GO:0070087) |
| 0.1 | 0.1 | GO:0010698 | acetyltransferase activator activity(GO:0010698) |
| 0.1 | 0.5 | GO:0017176 | phosphatidylinositol N-acetylglucosaminyltransferase activity(GO:0017176) |
| 0.1 | 1.1 | GO:0070513 | death domain binding(GO:0070513) |
| 0.1 | 9.4 | GO:0008168 | methyltransferase activity(GO:0008168) |
| 0.1 | 4.1 | GO:1990782 | protein tyrosine kinase binding(GO:1990782) |
| 0.1 | 0.4 | GO:0030883 | lipid antigen binding(GO:0030882) endogenous lipid antigen binding(GO:0030883) exogenous lipid antigen binding(GO:0030884) |
| 0.1 | 1.1 | GO:0016493 | C-C chemokine receptor activity(GO:0016493) |
| 0.1 | 0.3 | GO:0047696 | beta-adrenergic receptor kinase activity(GO:0047696) |
| 0.1 | 0.5 | GO:0015279 | store-operated calcium channel activity(GO:0015279) |
| 0.1 | 0.2 | GO:0019150 | D-ribulokinase activity(GO:0019150) |
| 0.1 | 0.6 | GO:0047499 | calcium-independent phospholipase A2 activity(GO:0047499) |
| 0.1 | 0.9 | GO:0001205 | transcriptional activator activity, RNA polymerase II distal enhancer sequence-specific binding(GO:0001205) |
| 0.1 | 0.6 | GO:0038049 | transcription factor activity, ligand-activated RNA polymerase II transcription factor binding(GO:0038049) |
| 0.0 | 0.3 | GO:0004844 | uracil DNA N-glycosylase activity(GO:0004844) deaminated base DNA N-glycosylase activity(GO:0097506) |
| 0.0 | 0.5 | GO:0015925 | galactosidase activity(GO:0015925) |
| 0.0 | 0.2 | GO:0016520 | growth hormone-releasing hormone receptor activity(GO:0016520) |
| 0.0 | 0.1 | GO:0005046 | KDEL sequence binding(GO:0005046) |
| 0.0 | 0.4 | GO:0070016 | armadillo repeat domain binding(GO:0070016) |
| 0.0 | 0.2 | GO:0050815 | phosphoserine binding(GO:0050815) |
| 0.0 | 1.4 | GO:0000993 | RNA polymerase II core binding(GO:0000993) |
| 0.0 | 0.8 | GO:0003796 | lysozyme activity(GO:0003796) |
| 0.0 | 1.3 | GO:0022842 | leak channel activity(GO:0022840) narrow pore channel activity(GO:0022842) |
| 0.0 | 0.4 | GO:0030942 | endoplasmic reticulum signal peptide binding(GO:0030942) |
| 0.0 | 0.5 | GO:0004875 | complement receptor activity(GO:0004875) |
| 0.0 | 0.2 | GO:0030983 | mismatched DNA binding(GO:0030983) |
| 0.0 | 0.1 | GO:0004768 | stearoyl-CoA 9-desaturase activity(GO:0004768) acyl-CoA desaturase activity(GO:0016215) |
| 0.0 | 0.6 | GO:0046920 | alpha-(1->3)-fucosyltransferase activity(GO:0046920) |
| 0.0 | 0.0 | GO:0000104 | succinate dehydrogenase activity(GO:0000104) |
| 0.0 | 0.4 | GO:0008454 | alpha-1,3-mannosylglycoprotein 4-beta-N-acetylglucosaminyltransferase activity(GO:0008454) |
| 0.0 | 3.9 | GO:0004843 | thiol-dependent ubiquitin-specific protease activity(GO:0004843) |
| 0.0 | 0.4 | GO:0003691 | double-stranded telomeric DNA binding(GO:0003691) |
| 0.0 | 0.3 | GO:0017018 | myosin phosphatase activity(GO:0017018) |
| 0.0 | 1.7 | GO:0001784 | phosphotyrosine binding(GO:0001784) |
| 0.0 | 0.6 | GO:0008198 | ferrous iron binding(GO:0008198) |
| 0.0 | 0.7 | GO:0004065 | arylsulfatase activity(GO:0004065) |
| 0.0 | 0.2 | GO:0004852 | uroporphyrinogen-III synthase activity(GO:0004852) |
| 0.0 | 0.4 | GO:0045545 | syndecan binding(GO:0045545) |
| 0.0 | 1.8 | GO:0016859 | cis-trans isomerase activity(GO:0016859) |
| 0.0 | 0.3 | GO:0030492 | hemoglobin binding(GO:0030492) |
| 0.0 | 0.4 | GO:0001849 | complement component C1q binding(GO:0001849) |
| 0.0 | 0.4 | GO:0097371 | MDM2/MDM4 family protein binding(GO:0097371) |
| 0.0 | 0.6 | GO:0015232 | heme transporter activity(GO:0015232) |
| 0.0 | 0.6 | GO:0098505 | G-rich strand telomeric DNA binding(GO:0098505) |
| 0.0 | 0.3 | GO:0004694 | eukaryotic translation initiation factor 2alpha kinase activity(GO:0004694) |
| 0.0 | 0.1 | GO:0004807 | triose-phosphate isomerase activity(GO:0004807) |
| 0.0 | 0.3 | GO:0008889 | glycerophosphodiester phosphodiesterase activity(GO:0008889) |
| 0.0 | 0.5 | GO:0001591 | dopamine neurotransmitter receptor activity, coupled via Gi/Go(GO:0001591) |
| 0.0 | 0.2 | GO:0005497 | androgen binding(GO:0005497) |
| 0.0 | 0.6 | GO:0003993 | acid phosphatase activity(GO:0003993) |
| 0.0 | 3.2 | GO:0003682 | chromatin binding(GO:0003682) |
| 0.0 | 0.9 | GO:0035258 | steroid hormone receptor binding(GO:0035258) |
| 0.0 | 0.3 | GO:0008109 | N-acetyllactosaminide beta-1,6-N-acetylglucosaminyltransferase activity(GO:0008109) |
| 0.0 | 1.1 | GO:0005251 | delayed rectifier potassium channel activity(GO:0005251) |
| 0.0 | 1.1 | GO:0051287 | NAD binding(GO:0051287) |
| 0.0 | 0.9 | GO:0000339 | RNA cap binding(GO:0000339) |
| 0.0 | 1.8 | GO:0019783 | ubiquitin-like protein-specific protease activity(GO:0019783) |
| 0.0 | 0.3 | GO:0045029 | UDP-activated nucleotide receptor activity(GO:0045029) |
| 0.0 | 1.1 | GO:0030159 | receptor signaling complex scaffold activity(GO:0030159) |
| 0.0 | 0.6 | GO:0017025 | TBP-class protein binding(GO:0017025) |
| 0.0 | 0.4 | GO:0043533 | inositol 1,3,4,5 tetrakisphosphate binding(GO:0043533) |
| 0.0 | 1.0 | GO:0005104 | fibroblast growth factor receptor binding(GO:0005104) |
| 0.0 | 0.2 | GO:0001875 | lipopolysaccharide receptor activity(GO:0001875) |
| 0.0 | 0.4 | GO:0003836 | beta-galactoside (CMP) alpha-2,3-sialyltransferase activity(GO:0003836) |
| 0.0 | 0.2 | GO:0031735 | CCR10 chemokine receptor binding(GO:0031735) |
| 0.0 | 0.6 | GO:0022820 | potassium:chloride symporter activity(GO:0015379) potassium ion symporter activity(GO:0022820) |
| 0.0 | 0.3 | GO:0001517 | N-acetylglucosamine 6-O-sulfotransferase activity(GO:0001517) |
| 0.0 | 0.1 | GO:0004348 | glucosylceramidase activity(GO:0004348) |
| 0.0 | 0.1 | GO:0016174 | NAD(P)H oxidase activity(GO:0016174) |
| 0.0 | 0.7 | GO:0043027 | cysteine-type endopeptidase inhibitor activity involved in apoptotic process(GO:0043027) |
| 0.0 | 0.4 | GO:0008603 | cAMP-dependent protein kinase regulator activity(GO:0008603) |
| 0.0 | 0.1 | GO:0008297 | single-stranded DNA exodeoxyribonuclease activity(GO:0008297) |
| 0.0 | 0.1 | GO:0004515 | nicotinate-nucleotide adenylyltransferase activity(GO:0004515) |
| 0.0 | 0.3 | GO:0005412 | glucose:sodium symporter activity(GO:0005412) |
| 0.0 | 0.5 | GO:0016494 | C-X-C chemokine receptor activity(GO:0016494) |
| 0.0 | 0.2 | GO:0000155 | phosphorelay sensor kinase activity(GO:0000155) |
| 0.0 | 0.5 | GO:0005351 | sugar:proton symporter activity(GO:0005351) cation:sugar symporter activity(GO:0005402) |
| 0.0 | 0.1 | GO:0046870 | cadmium ion binding(GO:0046870) |
| 0.0 | 0.3 | GO:1990247 | N6-methyladenosine-containing RNA binding(GO:1990247) |
| 0.0 | 1.3 | GO:0004198 | calcium-dependent cysteine-type endopeptidase activity(GO:0004198) |
| 0.0 | 0.4 | GO:0031681 | G-protein beta-subunit binding(GO:0031681) |
| 0.0 | 0.1 | GO:0033906 | hyaluronoglucuronidase activity(GO:0033906) |
| 0.0 | 0.5 | GO:0031491 | nucleosome binding(GO:0031491) |
| 0.0 | 0.7 | GO:0051430 | corticotropin-releasing hormone receptor 1 binding(GO:0051430) |
| 0.0 | 2.7 | GO:0051087 | chaperone binding(GO:0051087) |
| 0.0 | 0.8 | GO:0005487 | nucleocytoplasmic transporter activity(GO:0005487) |
| 0.0 | 1.9 | GO:0043021 | ribonucleoprotein complex binding(GO:0043021) |
| 0.0 | 0.5 | GO:0008432 | JUN kinase binding(GO:0008432) |
| 0.0 | 1.2 | GO:0019706 | protein-cysteine S-palmitoyltransferase activity(GO:0019706) protein-cysteine S-acyltransferase activity(GO:0019707) |
| 0.0 | 0.1 | GO:0070363 | mitochondrial light strand promoter sense binding(GO:0070363) |
| 0.0 | 1.4 | GO:0005160 | transforming growth factor beta receptor binding(GO:0005160) |
| 0.0 | 0.4 | GO:0050700 | CARD domain binding(GO:0050700) |
| 0.0 | 0.6 | GO:0005159 | insulin-like growth factor receptor binding(GO:0005159) |
| 0.0 | 2.2 | GO:0000980 | RNA polymerase II distal enhancer sequence-specific DNA binding(GO:0000980) |
| 0.0 | 0.8 | GO:0070003 | threonine-type endopeptidase activity(GO:0004298) threonine-type peptidase activity(GO:0070003) |
| 0.0 | 0.5 | GO:0017069 | snRNA binding(GO:0017069) |
| 0.0 | 0.5 | GO:0042043 | neurexin family protein binding(GO:0042043) |
| 0.0 | 0.3 | GO:0098599 | palmitoyl-(protein) hydrolase activity(GO:0008474) palmitoyl hydrolase activity(GO:0098599) |
| 0.0 | 0.1 | GO:0004668 | protein-arginine deiminase activity(GO:0004668) |
| 0.0 | 0.1 | GO:0004740 | pyruvate dehydrogenase (acetyl-transferring) kinase activity(GO:0004740) |
| 0.0 | 0.1 | GO:0047006 | 17-alpha,20-alpha-dihydroxypregn-4-en-3-one dehydrogenase activity(GO:0047006) |
| 0.0 | 0.5 | GO:0031420 | alkali metal ion binding(GO:0031420) |
| 0.0 | 0.1 | GO:0022865 | transmembrane electron transfer carrier(GO:0022865) |
| 0.0 | 0.1 | GO:0043813 | phosphatidylinositol-3,5-bisphosphate 5-phosphatase activity(GO:0043813) |
| 0.0 | 0.1 | GO:0001601 | peptide YY receptor activity(GO:0001601) |
| 0.0 | 0.4 | GO:0004623 | phospholipase A2 activity(GO:0004623) |
| 0.0 | 66.3 | GO:0003677 | DNA binding(GO:0003677) |
| 0.0 | 0.1 | GO:0051377 | mannose-ethanolamine phosphotransferase activity(GO:0051377) |
| 0.0 | 0.1 | GO:0004703 | G-protein coupled receptor kinase activity(GO:0004703) |
| 0.0 | 0.1 | GO:0003828 | alpha-N-acetylneuraminate alpha-2,8-sialyltransferase activity(GO:0003828) |
| 0.0 | 0.4 | GO:0019829 | cation-transporting ATPase activity(GO:0019829) |
| 0.0 | 0.3 | GO:0005132 | type I interferon receptor binding(GO:0005132) |
| 0.0 | 0.1 | GO:0070530 | K63-linked polyubiquitin binding(GO:0070530) |
| 0.0 | 0.7 | GO:0008331 | high voltage-gated calcium channel activity(GO:0008331) |
| 0.0 | 0.1 | GO:0004948 | calcitonin receptor activity(GO:0004948) |
| 0.0 | 0.0 | GO:0016503 | pheromone receptor activity(GO:0016503) |
| 0.0 | 0.2 | GO:0016289 | CoA hydrolase activity(GO:0016289) |
| 0.0 | 0.1 | GO:0055104 | ligase inhibitor activity(GO:0055104) ubiquitin ligase inhibitor activity(GO:1990948) |
| 0.0 | 1.8 | GO:0003713 | transcription coactivator activity(GO:0003713) |
| 0.0 | 0.2 | GO:0071933 | Arp2/3 complex binding(GO:0071933) |
| 0.0 | 0.1 | GO:0004910 | interleukin-1, Type II, blocking receptor activity(GO:0004910) |
| 0.0 | 0.2 | GO:0001530 | lipopolysaccharide binding(GO:0001530) |
| 0.0 | 0.4 | GO:0008527 | taste receptor activity(GO:0008527) |
| 0.0 | 0.1 | GO:0033823 | procollagen-lysine 5-dioxygenase activity(GO:0008475) procollagen glucosyltransferase activity(GO:0033823) |
| 0.0 | 0.0 | GO:0031433 | telethonin binding(GO:0031433) |
| 0.0 | 0.2 | GO:0015174 | basic amino acid transmembrane transporter activity(GO:0015174) |
| 0.0 | 0.1 | GO:0004645 | phosphorylase activity(GO:0004645) |
| 0.0 | 0.0 | GO:0001224 | RNA polymerase II transcription cofactor binding(GO:0001224) |
| 0.0 | 0.2 | GO:0004062 | aryl sulfotransferase activity(GO:0004062) |
| 0.0 | 0.0 | GO:0004980 | melanocyte-stimulating hormone receptor activity(GO:0004980) |
Gene overrepresentation in curated gene sets: canonical pathways category:
| Log-likelihood per target | Total log-likelihood | Term | Description |
|---|---|---|---|
| 0.6 | 1.8 | PID EPHA2 FWD PATHWAY | EPHA2 forward signaling |
| 0.5 | 1.0 | PID INTEGRIN5 PATHWAY | Beta5 beta6 beta7 and beta8 integrin cell surface interactions |
| 0.4 | 1.8 | PID AR NONGENOMIC PATHWAY | Nongenotropic Androgen signaling |
| 0.3 | 2.0 | PID AVB3 INTEGRIN PATHWAY | Integrins in angiogenesis |
| 0.3 | 12.0 | SA CASPASE CASCADE | Apoptosis is mediated by caspases, cysteine proteases arranged in a proteolytic cascade. |
| 0.3 | 0.8 | ST WNT CA2 CYCLIC GMP PATHWAY | Wnt/Ca2+/cyclic GMP signaling. |
| 0.2 | 3.1 | SA B CELL RECEPTOR COMPLEXES | Antigen binding to B cell receptors activates protein tyrosine kinases, such as the Src family, which ultimate activate MAP kinases. |
| 0.2 | 4.6 | PID TCR JNK PATHWAY | JNK signaling in the CD4+ TCR pathway |
| 0.2 | 7.8 | PID NFKAPPAB CANONICAL PATHWAY | Canonical NF-kappaB pathway |
| 0.2 | 1.8 | PID TNF PATHWAY | TNF receptor signaling pathway |
| 0.1 | 7.4 | PID BARD1 PATHWAY | BARD1 signaling events |
| 0.1 | 11.0 | PID ATR PATHWAY | ATR signaling pathway |
| 0.1 | 12.9 | PID HNF3B PATHWAY | FOXA2 and FOXA3 transcription factor networks |
| 0.1 | 0.5 | SIG BCR SIGNALING PATHWAY | Members of the BCR signaling pathway |
| 0.1 | 11.9 | ST T CELL SIGNAL TRANSDUCTION | T Cell Signal Transduction |
| 0.1 | 0.2 | PID IFNG PATHWAY | IFN-gamma pathway |
| 0.1 | 2.1 | PID RANBP2 PATHWAY | Sumoylation by RanBP2 regulates transcriptional repression |
| 0.1 | 5.8 | PID ERBB NETWORK PATHWAY | ErbB receptor signaling network |
| 0.1 | 4.2 | PID FOXM1 PATHWAY | FOXM1 transcription factor network |
| 0.1 | 4.9 | PID HEDGEHOG 2PATHWAY | Signaling events mediated by the Hedgehog family |
| 0.1 | 4.4 | PID SMAD2 3PATHWAY | Regulation of cytoplasmic and nuclear SMAD2/3 signaling |
| 0.1 | 1.3 | PID TCR RAS PATHWAY | Ras signaling in the CD4+ TCR pathway |
| 0.1 | 0.7 | PID S1P S1P4 PATHWAY | S1P4 pathway |
| 0.1 | 1.1 | PID NFKAPPAB ATYPICAL PATHWAY | Atypical NF-kappaB pathway |
| 0.1 | 10.7 | PID HDAC CLASSI PATHWAY | Signaling events mediated by HDAC Class I |
| 0.1 | 1.2 | PID INTEGRIN2 PATHWAY | Beta2 integrin cell surface interactions |
| 0.1 | 1.4 | PID FANCONI PATHWAY | Fanconi anemia pathway |
| 0.1 | 6.1 | PID PLK1 PATHWAY | PLK1 signaling events |
| 0.1 | 0.6 | SA REG CASCADE OF CYCLIN EXPR | Expression of cyclins regulates progression through the cell cycle by activating cyclin-dependent kinases. |
| 0.1 | 2.4 | PID RETINOIC ACID PATHWAY | Retinoic acid receptors-mediated signaling |
| 0.1 | 6.7 | PID CERAMIDE PATHWAY | Ceramide signaling pathway |
| 0.1 | 1.0 | ST IL 13 PATHWAY | Interleukin 13 (IL-13) Pathway |
| 0.1 | 2.1 | PID ERB GENOMIC PATHWAY | Validated nuclear estrogen receptor beta network |
| 0.1 | 0.8 | ST GRANULE CELL SURVIVAL PATHWAY | Granule Cell Survival Pathway is a specific case of more general PAC1 Receptor Pathway. |
| 0.1 | 3.1 | PID RHODOPSIN PATHWAY | Visual signal transduction: Rods |
| 0.1 | 7.9 | PID E2F PATHWAY | E2F transcription factor network |
| 0.1 | 3.5 | PID LIS1 PATHWAY | Lissencephaly gene (LIS1) in neuronal migration and development |
| 0.1 | 0.2 | PID REELIN PATHWAY | Reelin signaling pathway |
| 0.1 | 0.1 | ST TUMOR NECROSIS FACTOR PATHWAY | Tumor Necrosis Factor Pathway. |
| 0.1 | 2.6 | PID PRL SIGNALING EVENTS PATHWAY | Signaling events mediated by PRL |
| 0.1 | 1.4 | PID NETRIN PATHWAY | Netrin-mediated signaling events |
| 0.1 | 3.9 | PID PS1 PATHWAY | Presenilin action in Notch and Wnt signaling |
| 0.1 | 2.4 | PID AURORA A PATHWAY | Aurora A signaling |
| 0.0 | 7.8 | PID BETA CATENIN NUC PATHWAY | Regulation of nuclear beta catenin signaling and target gene transcription |
| 0.0 | 0.5 | SA PROGRAMMED CELL DEATH | Programmed cell death, or apoptosis, eliminates damaged or unneeded cells. |
| 0.0 | 3.2 | PID HNF3A PATHWAY | FOXA1 transcription factor network |
| 0.0 | 2.5 | PID HEDGEHOG GLI PATHWAY | Hedgehog signaling events mediated by Gli proteins |
| 0.0 | 0.8 | PID DNA PK PATHWAY | DNA-PK pathway in nonhomologous end joining |
| 0.0 | 0.8 | PID ATM PATHWAY | ATM pathway |
| 0.0 | 0.3 | PID PDGFRA PATHWAY | PDGFR-alpha signaling pathway |
| 0.0 | 1.2 | PID IL27 PATHWAY | IL27-mediated signaling events |
| 0.0 | 0.7 | PID IL5 PATHWAY | IL5-mediated signaling events |
| 0.0 | 2.0 | PID TELOMERASE PATHWAY | Regulation of Telomerase |
| 0.0 | 1.0 | PID TOLL ENDOGENOUS PATHWAY | Endogenous TLR signaling |
| 0.0 | 0.1 | ST JAK STAT PATHWAY | Jak-STAT Pathway |
| 0.0 | 0.8 | PID CXCR3 PATHWAY | CXCR3-mediated signaling events |
| 0.0 | 0.1 | ST PAC1 RECEPTOR PATHWAY | PAC1 Receptor Pathway |
| 0.0 | 0.1 | ST TYPE I INTERFERON PATHWAY | Type I Interferon (alpha/beta IFN) Pathway |
| 0.0 | 1.0 | PID EPHA FWDPATHWAY | EPHA forward signaling |
| 0.0 | 0.8 | PID ALPHA SYNUCLEIN PATHWAY | Alpha-synuclein signaling |
| 0.0 | 1.7 | PID LKB1 PATHWAY | LKB1 signaling events |
| 0.0 | 0.9 | SIG CD40PATHWAYMAP | Genes related to CD40 signaling |
| 0.0 | 0.4 | PID LYSOPHOSPHOLIPID PATHWAY | LPA receptor mediated events |
| 0.0 | 0.4 | PID ECADHERIN KERATINOCYTE PATHWAY | E-cadherin signaling in keratinocytes |
| 0.0 | 0.0 | PID ER NONGENOMIC PATHWAY | Plasma membrane estrogen receptor signaling |
| 0.0 | 0.8 | PID CD8 TCR PATHWAY | TCR signaling in naïve CD8+ T cells |
| 0.0 | 0.6 | PID ERBB4 PATHWAY | ErbB4 signaling events |
| 0.0 | 0.5 | PID P38 MKK3 6PATHWAY | p38 MAPK signaling pathway |
| 0.0 | 1.5 | PID CDC42 PATHWAY | CDC42 signaling events |
| 0.0 | 0.4 | PID ARF 3PATHWAY | Arf1 pathway |
Gene overrepresentation in curated gene sets: REACTOME pathways category:
| Log-likelihood per target | Total log-likelihood | Term | Description |
|---|---|---|---|
| 1.0 | 24.7 | REACTOME SYNTHESIS OF PE | Genes involved in Synthesis of PE |
| 0.7 | 9.8 | REACTOME SYNTHESIS OF BILE ACIDS AND BILE SALTS VIA 24 HYDROXYCHOLESTEROL | Genes involved in Synthesis of bile acids and bile salts via 24-hydroxycholesterol |
| 0.6 | 15.4 | REACTOME CHYLOMICRON MEDIATED LIPID TRANSPORT | Genes involved in Chylomicron-mediated lipid transport |
| 0.5 | 17.8 | REACTOME SULFUR AMINO ACID METABOLISM | Genes involved in Sulfur amino acid metabolism |
| 0.5 | 13.9 | REACTOME ALPHA LINOLENIC ACID ALA METABOLISM | Genes involved in alpha-linolenic acid (ALA) metabolism |
| 0.5 | 20.7 | REACTOME CHOLESTEROL BIOSYNTHESIS | Genes involved in Cholesterol biosynthesis |
| 0.5 | 10.0 | REACTOME METABOLISM OF POLYAMINES | Genes involved in Metabolism of polyamines |
| 0.5 | 2.3 | REACTOME NEURONAL SYSTEM | Genes involved in Neuronal System |
| 0.5 | 9.6 | REACTOME VITAMIN B5 PANTOTHENATE METABOLISM | Genes involved in Vitamin B5 (pantothenate) metabolism |
| 0.5 | 23.0 | REACTOME RORA ACTIVATES CIRCADIAN EXPRESSION | Genes involved in RORA Activates Circadian Expression |
| 0.4 | 7.6 | REACTOME SYNTHESIS OF SUBSTRATES IN N GLYCAN BIOSYTHESIS | Genes involved in Synthesis of substrates in N-glycan biosythesis |
| 0.4 | 1.7 | REACTOME FGFR4 LIGAND BINDING AND ACTIVATION | Genes involved in FGFR4 ligand binding and activation |
| 0.4 | 12.1 | REACTOME AMINO ACID SYNTHESIS AND INTERCONVERSION TRANSAMINATION | Genes involved in Amino acid synthesis and interconversion (transamination) |
| 0.4 | 7.0 | REACTOME PYRIMIDINE CATABOLISM | Genes involved in Pyrimidine catabolism |
| 0.4 | 13.1 | REACTOME PLATELET CALCIUM HOMEOSTASIS | Genes involved in Platelet calcium homeostasis |
| 0.3 | 4.0 | REACTOME E2F ENABLED INHIBITION OF PRE REPLICATION COMPLEX FORMATION | Genes involved in E2F-enabled inhibition of pre-replication complex formation |
| 0.3 | 1.3 | REACTOME SYNTHESIS OF BILE ACIDS AND BILE SALTS VIA 7ALPHA HYDROXYCHOLESTEROL | Genes involved in Synthesis of bile acids and bile salts via 7alpha-hydroxycholesterol |
| 0.3 | 8.1 | REACTOME PROCESSIVE SYNTHESIS ON THE LAGGING STRAND | Genes involved in Processive synthesis on the lagging strand |
| 0.3 | 1.3 | REACTOME DNA STRAND ELONGATION | Genes involved in DNA strand elongation |
| 0.3 | 6.1 | REACTOME ROLE OF DCC IN REGULATING APOPTOSIS | Genes involved in Role of DCC in regulating apoptosis |
| 0.3 | 12.4 | REACTOME G0 AND EARLY G1 | Genes involved in G0 and Early G1 |
| 0.3 | 6.3 | REACTOME REGULATION OF PYRUVATE DEHYDROGENASE PDH COMPLEX | Genes involved in Regulation of pyruvate dehydrogenase (PDH) complex |
| 0.3 | 1.6 | REACTOME NEGATIVE REGULATION OF THE PI3K AKT NETWORK | Genes involved in Negative regulation of the PI3K/AKT network |
| 0.3 | 5.1 | REACTOME REGULATED PROTEOLYSIS OF P75NTR | Genes involved in Regulated proteolysis of p75NTR |
| 0.3 | 5.6 | REACTOME PURINE RIBONUCLEOSIDE MONOPHOSPHATE BIOSYNTHESIS | Genes involved in Purine ribonucleoside monophosphate biosynthesis |
| 0.3 | 5.6 | REACTOME G1 S SPECIFIC TRANSCRIPTION | Genes involved in G1/S-Specific Transcription |
| 0.3 | 6.2 | REACTOME GAMMA CARBOXYLATION TRANSPORT AND AMINO TERMINAL CLEAVAGE OF PROTEINS | Genes involved in Gamma-carboxylation, transport, and amino-terminal cleavage of proteins |
| 0.3 | 8.4 | REACTOME BRANCHED CHAIN AMINO ACID CATABOLISM | Genes involved in Branched-chain amino acid catabolism |
| 0.3 | 0.6 | REACTOME SHC MEDIATED SIGNALLING | Genes involved in SHC-mediated signalling |
| 0.3 | 8.2 | REACTOME N GLYCAN ANTENNAE ELONGATION | Genes involved in N-Glycan antennae elongation |
| 0.3 | 4.9 | REACTOME SYNTHESIS OF PIPS AT THE LATE ENDOSOME MEMBRANE | Genes involved in Synthesis of PIPs at the late endosome membrane |
| 0.3 | 0.3 | REACTOME RETROGRADE NEUROTROPHIN SIGNALLING | Genes involved in Retrograde neurotrophin signalling |
| 0.3 | 2.1 | REACTOME REPAIR SYNTHESIS FOR GAP FILLING BY DNA POL IN TC NER | Genes involved in Repair synthesis for gap-filling by DNA polymerase in TC-NER |
| 0.3 | 2.1 | REACTOME TRAF6 MEDIATED IRF7 ACTIVATION IN TLR7 8 OR 9 SIGNALING | Genes involved in TRAF6 mediated IRF7 activation in TLR7/8 or 9 signaling |
| 0.3 | 5.7 | REACTOME PEROXISOMAL LIPID METABOLISM | Genes involved in Peroxisomal lipid metabolism |
| 0.3 | 7.3 | REACTOME ACTIVATION OF BH3 ONLY PROTEINS | Genes involved in Activation of BH3-only proteins |
| 0.3 | 0.5 | REACTOME INTERACTIONS OF VPR WITH HOST CELLULAR PROTEINS | Genes involved in Interactions of Vpr with host cellular proteins |
| 0.2 | 1.2 | REACTOME ACYL CHAIN REMODELLING OF PG | Genes involved in Acyl chain remodelling of PG |
| 0.2 | 2.2 | REACTOME CYTOSOLIC TRNA AMINOACYLATION | Genes involved in Cytosolic tRNA aminoacylation |
| 0.2 | 11.3 | REACTOME KINESINS | Genes involved in Kinesins |
| 0.2 | 2.6 | REACTOME EXTENSION OF TELOMERES | Genes involved in Extension of Telomeres |
| 0.2 | 4.5 | REACTOME MITOCHONDRIAL FATTY ACID BETA OXIDATION | Genes involved in Mitochondrial Fatty Acid Beta-Oxidation |
| 0.2 | 4.2 | REACTOME BIOSYNTHESIS OF THE N GLYCAN PRECURSOR DOLICHOL LIPID LINKED OLIGOSACCHARIDE LLO AND TRANSFER TO A NASCENT PROTEIN | Genes involved in Biosynthesis of the N-glycan precursor (dolichol lipid-linked oligosaccharide, LLO) and transfer to a nascent protein |
| 0.2 | 4.1 | REACTOME XENOBIOTICS | Genes involved in Xenobiotics |
| 0.2 | 6.4 | REACTOME ACTIVATION OF ATR IN RESPONSE TO REPLICATION STRESS | Genes involved in Activation of ATR in response to replication stress |
| 0.2 | 0.7 | REACTOME VIF MEDIATED DEGRADATION OF APOBEC3G | Genes involved in Vif-mediated degradation of APOBEC3G |
| 0.2 | 8.0 | REACTOME INSULIN RECEPTOR RECYCLING | Genes involved in Insulin receptor recycling |
| 0.2 | 5.4 | REACTOME MITOCHONDRIAL TRNA AMINOACYLATION | Genes involved in Mitochondrial tRNA aminoacylation |
| 0.2 | 10.5 | REACTOME SPHINGOLIPID DE NOVO BIOSYNTHESIS | Genes involved in Sphingolipid de novo biosynthesis |
| 0.2 | 15.9 | REACTOME GLUCONEOGENESIS | Genes involved in Gluconeogenesis |
| 0.2 | 10.1 | REACTOME REGULATION OF GLUCOKINASE BY GLUCOKINASE REGULATORY PROTEIN | Genes involved in Regulation of Glucokinase by Glucokinase Regulatory Protein |
| 0.2 | 3.1 | REACTOME IRAK1 RECRUITS IKK COMPLEX | Genes involved in IRAK1 recruits IKK complex |
| 0.2 | 8.2 | REACTOME SIGNALING BY NODAL | Genes involved in Signaling by NODAL |
| 0.2 | 23.5 | REACTOME AMINO ACID AND OLIGOPEPTIDE SLC TRANSPORTERS | Genes involved in Amino acid and oligopeptide SLC transporters |
| 0.2 | 7.5 | REACTOME POST CHAPERONIN TUBULIN FOLDING PATHWAY | Genes involved in Post-chaperonin tubulin folding pathway |
| 0.2 | 4.5 | REACTOME BILE SALT AND ORGANIC ANION SLC TRANSPORTERS | Genes involved in Bile salt and organic anion SLC transporters |
| 0.2 | 0.6 | REACTOME CDC6 ASSOCIATION WITH THE ORC ORIGIN COMPLEX | Genes involved in CDC6 association with the ORC:origin complex |
| 0.2 | 8.6 | REACTOME GABA A RECEPTOR ACTIVATION | Genes involved in GABA A receptor activation |
| 0.2 | 3.4 | REACTOME NEF MEDIATED DOWNREGULATION OF MHC CLASS I COMPLEX CELL SURFACE EXPRESSION | Genes involved in Nef mediated downregulation of MHC class I complex cell surface expression |
| 0.2 | 37.5 | REACTOME METABOLISM OF AMINO ACIDS AND DERIVATIVES | Genes involved in Metabolism of amino acids and derivatives |
| 0.2 | 2.0 | REACTOME ANDROGEN BIOSYNTHESIS | Genes involved in Androgen biosynthesis |
| 0.2 | 7.3 | REACTOME REGULATORY RNA PATHWAYS | Genes involved in Regulatory RNA pathways |
| 0.2 | 1.4 | REACTOME ER PHAGOSOME PATHWAY | Genes involved in ER-Phagosome pathway |
| 0.2 | 4.7 | REACTOME ORGANIC CATION ANION ZWITTERION TRANSPORT | Genes involved in Organic cation/anion/zwitterion transport |
| 0.2 | 4.1 | REACTOME CHONDROITIN SULFATE BIOSYNTHESIS | Genes involved in Chondroitin sulfate biosynthesis |
| 0.2 | 2.9 | REACTOME PYRIMIDINE METABOLISM | Genes involved in Pyrimidine metabolism |
| 0.2 | 13.9 | REACTOME HEPARAN SULFATE HEPARIN HS GAG METABOLISM | Genes involved in Heparan sulfate/heparin (HS-GAG) metabolism |
| 0.2 | 4.5 | REACTOME PROCESSING OF INTRONLESS PRE MRNAS | Genes involved in Processing of Intronless Pre-mRNAs |
| 0.2 | 1.7 | REACTOME COMMON PATHWAY | Genes involved in Common Pathway |
| 0.2 | 5.0 | REACTOME MEIOTIC RECOMBINATION | Genes involved in Meiotic Recombination |
| 0.2 | 11.0 | REACTOME TRIGLYCERIDE BIOSYNTHESIS | Genes involved in Triglyceride Biosynthesis |
| 0.2 | 2.6 | REACTOME ACTIVATION OF NF KAPPAB IN B CELLS | Genes involved in Activation of NF-kappaB in B Cells |
| 0.1 | 1.3 | REACTOME SCF BETA TRCP MEDIATED DEGRADATION OF EMI1 | Genes involved in SCF-beta-TrCP mediated degradation of Emi1 |
| 0.1 | 0.7 | REACTOME INFLUENZA VIRAL RNA TRANSCRIPTION AND REPLICATION | Genes involved in Influenza Viral RNA Transcription and Replication |
| 0.1 | 1.7 | REACTOME COPI MEDIATED TRANSPORT | Genes involved in COPI Mediated Transport |
| 0.1 | 3.7 | REACTOME CLASS C 3 METABOTROPIC GLUTAMATE PHEROMONE RECEPTORS | Genes involved in Class C/3 (Metabotropic glutamate/pheromone receptors) |
| 0.1 | 2.6 | REACTOME TRAF3 DEPENDENT IRF ACTIVATION PATHWAY | Genes involved in TRAF3-dependent IRF activation pathway |
| 0.1 | 6.7 | REACTOME SIGNALING BY FGFR1 FUSION MUTANTS | Genes involved in Signaling by FGFR1 fusion mutants |
| 0.1 | 10.4 | REACTOME VOLTAGE GATED POTASSIUM CHANNELS | Genes involved in Voltage gated Potassium channels |
| 0.1 | 0.8 | REACTOME PKA MEDIATED PHOSPHORYLATION OF CREB | Genes involved in PKA-mediated phosphorylation of CREB |
| 0.1 | 1.7 | REACTOME SLBP DEPENDENT PROCESSING OF REPLICATION DEPENDENT HISTONE PRE MRNAS | Genes involved in SLBP Dependent Processing of Replication-Dependent Histone Pre-mRNAs |
| 0.1 | 4.8 | REACTOME TRANSPORT TO THE GOLGI AND SUBSEQUENT MODIFICATION | Genes involved in Transport to the Golgi and subsequent modification |
| 0.1 | 1.3 | REACTOME NFKB ACTIVATION THROUGH FADD RIP1 PATHWAY MEDIATED BY CASPASE 8 AND10 | Genes involved in NF-kB activation through FADD/RIP-1 pathway mediated by caspase-8 and -10 |
| 0.1 | 3.3 | REACTOME PURINE SALVAGE | Genes involved in Purine salvage |
| 0.1 | 1.9 | REACTOME TIE2 SIGNALING | Genes involved in Tie2 Signaling |
| 0.1 | 1.9 | REACTOME RNA POL I TRANSCRIPTION | Genes involved in RNA Polymerase I Transcription |
| 0.1 | 0.1 | REACTOME APC CDC20 MEDIATED DEGRADATION OF NEK2A | Genes involved in APC-Cdc20 mediated degradation of Nek2A |
| 0.1 | 3.8 | REACTOME FANCONI ANEMIA PATHWAY | Genes involved in Fanconi Anemia pathway |
| 0.1 | 2.8 | REACTOME MRNA DECAY BY 5 TO 3 EXORIBONUCLEASE | Genes involved in mRNA Decay by 5' to 3' Exoribonuclease |
| 0.1 | 3.4 | REACTOME REGULATION OF IFNA SIGNALING | Genes involved in Regulation of IFNA signaling |
| 0.1 | 3.2 | REACTOME TGF BETA RECEPTOR SIGNALING IN EMT EPITHELIAL TO MESENCHYMAL TRANSITION | Genes involved in TGF-beta receptor signaling in EMT (epithelial to mesenchymal transition) |
| 0.1 | 1.6 | REACTOME MRNA DECAY BY 3 TO 5 EXORIBONUCLEASE | Genes involved in mRNA Decay by 3' to 5' Exoribonuclease |
| 0.1 | 2.4 | REACTOME RESOLUTION OF AP SITES VIA THE MULTIPLE NUCLEOTIDE PATCH REPLACEMENT PATHWAY | Genes involved in Resolution of AP sites via the multiple-nucleotide patch replacement pathway |
| 0.1 | 1.7 | REACTOME SEROTONIN RECEPTORS | Genes involved in Serotonin receptors |
| 0.1 | 3.2 | REACTOME GLUCURONIDATION | Genes involved in Glucuronidation |
| 0.1 | 2.9 | REACTOME DEPOSITION OF NEW CENPA CONTAINING NUCLEOSOMES AT THE CENTROMERE | Genes involved in Deposition of New CENPA-containing Nucleosomes at the Centromere |
| 0.1 | 2.5 | REACTOME CITRIC ACID CYCLE TCA CYCLE | Genes involved in Citric acid cycle (TCA cycle) |
| 0.1 | 1.5 | REACTOME OPSINS | Genes involved in Opsins |
| 0.1 | 3.8 | REACTOME ZINC TRANSPORTERS | Genes involved in Zinc transporters |
| 0.1 | 5.3 | REACTOME EFFECTS OF PIP2 HYDROLYSIS | Genes involved in Effects of PIP2 hydrolysis |
| 0.1 | 3.1 | REACTOME ACETYLCHOLINE BINDING AND DOWNSTREAM EVENTS | Genes involved in Acetylcholine Binding And Downstream Events |
| 0.1 | 2.4 | REACTOME SYNTHESIS OF PIPS AT THE GOLGI MEMBRANE | Genes involved in Synthesis of PIPs at the Golgi membrane |
| 0.1 | 5.5 | REACTOME ION TRANSPORT BY P TYPE ATPASES | Genes involved in Ion transport by P-type ATPases |
| 0.1 | 0.6 | REACTOME FGFR2C LIGAND BINDING AND ACTIVATION | Genes involved in FGFR2c ligand binding and activation |
| 0.1 | 0.6 | REACTOME RNA POL I PROMOTER OPENING | Genes involved in RNA Polymerase I Promoter Opening |
| 0.1 | 0.7 | REACTOME REGULATION OF KIT SIGNALING | Genes involved in Regulation of KIT signaling |
| 0.1 | 0.3 | REACTOME ASSEMBLY OF THE PRE REPLICATIVE COMPLEX | Genes involved in Assembly of the pre-replicative complex |
| 0.1 | 7.2 | REACTOME CHROMOSOME MAINTENANCE | Genes involved in Chromosome Maintenance |
| 0.1 | 3.5 | REACTOME METABOLISM OF STEROID HORMONES AND VITAMINS A AND D | Genes involved in Metabolism of steroid hormones and vitamins A and D |
| 0.1 | 0.3 | REACTOME ABORTIVE ELONGATION OF HIV1 TRANSCRIPT IN THE ABSENCE OF TAT | Genes involved in Abortive elongation of HIV-1 transcript in the absence of Tat |
| 0.1 | 6.1 | REACTOME TCR SIGNALING | Genes involved in TCR signaling |
| 0.1 | 2.3 | REACTOME INSULIN SYNTHESIS AND PROCESSING | Genes involved in Insulin Synthesis and Processing |
| 0.1 | 0.9 | REACTOME G BETA GAMMA SIGNALLING THROUGH PLC BETA | Genes involved in G beta:gamma signalling through PLC beta |
| 0.1 | 0.2 | REACTOME ACETYLCHOLINE NEUROTRANSMITTER RELEASE CYCLE | Genes involved in Acetylcholine Neurotransmitter Release Cycle |
| 0.1 | 3.9 | REACTOME GRB2 EVENTS IN ERBB2 SIGNALING | Genes involved in GRB2 events in ERBB2 signaling |
| 0.1 | 0.8 | REACTOME DAG AND IP3 SIGNALING | Genes involved in DAG and IP3 signaling |
| 0.1 | 1.4 | REACTOME MRNA SPLICING MINOR PATHWAY | Genes involved in mRNA Splicing - Minor Pathway |
| 0.1 | 5.6 | REACTOME METABOLISM OF VITAMINS AND COFACTORS | Genes involved in Metabolism of vitamins and cofactors |
| 0.1 | 0.3 | REACTOME G PROTEIN ACTIVATION | Genes involved in G-protein activation |
| 0.1 | 1.2 | REACTOME NEPHRIN INTERACTIONS | Genes involved in Nephrin interactions |
| 0.1 | 0.7 | REACTOME REGULATION OF BETA CELL DEVELOPMENT | Genes involved in Regulation of beta-cell development |
| 0.1 | 3.5 | REACTOME INHIBITION OF VOLTAGE GATED CA2 CHANNELS VIA GBETA GAMMA SUBUNITS | Genes involved in Inhibition of voltage gated Ca2+ channels via Gbeta/gamma subunits |
| 0.1 | 1.5 | REACTOME METABOLISM OF NON CODING RNA | Genes involved in Metabolism of non-coding RNA |
| 0.1 | 0.7 | REACTOME COSTIMULATION BY THE CD28 FAMILY | Genes involved in Costimulation by the CD28 family |
| 0.1 | 1.0 | REACTOME PLATELET SENSITIZATION BY LDL | Genes involved in Platelet sensitization by LDL |
| 0.1 | 0.1 | REACTOME P75NTR SIGNALS VIA NFKB | Genes involved in p75NTR signals via NF-kB |
| 0.1 | 0.3 | REACTOME G BETA GAMMA SIGNALLING THROUGH PI3KGAMMA | Genes involved in G beta:gamma signalling through PI3Kgamma |
| 0.1 | 0.3 | REACTOME DOPAMINE NEUROTRANSMITTER RELEASE CYCLE | Genes involved in Dopamine Neurotransmitter Release Cycle |
| 0.1 | 1.3 | REACTOME MRNA CAPPING | Genes involved in mRNA Capping |
| 0.1 | 1.4 | REACTOME TANDEM PORE DOMAIN POTASSIUM CHANNELS | Genes involved in Tandem pore domain potassium channels |
| 0.1 | 0.6 | REACTOME E2F MEDIATED REGULATION OF DNA REPLICATION | Genes involved in E2F mediated regulation of DNA replication |
| 0.1 | 0.6 | REACTOME LIGAND GATED ION CHANNEL TRANSPORT | Genes involved in Ligand-gated ion channel transport |
| 0.1 | 0.3 | REACTOME TRANSFERRIN ENDOCYTOSIS AND RECYCLING | Genes involved in Transferrin endocytosis and recycling |
| 0.1 | 0.5 | REACTOME ENOS ACTIVATION AND REGULATION | Genes involved in eNOS activation and regulation |
| 0.1 | 0.3 | REACTOME P53 DEPENDENT G1 DNA DAMAGE RESPONSE | Genes involved in p53-Dependent G1 DNA Damage Response |
| 0.1 | 0.4 | REACTOME CS DS DEGRADATION | Genes involved in CS/DS degradation |
| 0.1 | 3.3 | REACTOME DNA REPAIR | Genes involved in DNA Repair |
| 0.1 | 0.5 | REACTOME INTEGRATION OF PROVIRUS | Genes involved in Integration of provirus |
| 0.0 | 0.4 | REACTOME IL 6 SIGNALING | Genes involved in Interleukin-6 signaling |
| 0.0 | 1.0 | REACTOME N GLYCAN TRIMMING IN THE ER AND CALNEXIN CALRETICULIN CYCLE | Genes involved in N-glycan trimming in the ER and Calnexin/Calreticulin cycle |
| 0.0 | 2.7 | REACTOME MITOCHONDRIAL PROTEIN IMPORT | Genes involved in Mitochondrial Protein Import |
| 0.0 | 0.9 | REACTOME SYNTHESIS SECRETION AND INACTIVATION OF GIP | Genes involved in Synthesis, Secretion, and Inactivation of Glucose-dependent Insulinotropic Polypeptide (GIP) |
| 0.0 | 1.8 | REACTOME IONOTROPIC ACTIVITY OF KAINATE RECEPTORS | Genes involved in Ionotropic activity of Kainate Receptors |
| 0.0 | 0.3 | REACTOME DOWNREGULATION OF ERBB2 ERBB3 SIGNALING | Genes involved in Downregulation of ERBB2:ERBB3 signaling |
| 0.0 | 2.4 | REACTOME REGULATION OF GENE EXPRESSION IN BETA CELLS | Genes involved in Regulation of gene expression in beta cells |
| 0.0 | 0.5 | REACTOME PI3K EVENTS IN ERBB4 SIGNALING | Genes involved in PI3K events in ERBB4 signaling |
| 0.0 | 0.7 | REACTOME FORMATION OF TUBULIN FOLDING INTERMEDIATES BY CCT TRIC | Genes involved in Formation of tubulin folding intermediates by CCT/TriC |
| 0.0 | 2.0 | REACTOME REGULATION OF MITOTIC CELL CYCLE | Genes involved in Regulation of mitotic cell cycle |
| 0.0 | 0.4 | REACTOME MEMBRANE BINDING AND TARGETTING OF GAG PROTEINS | Genes involved in Membrane binding and targetting of GAG proteins |
| 0.0 | 1.1 | REACTOME SYNTHESIS OF GLYCOSYLPHOSPHATIDYLINOSITOL GPI | Genes involved in Synthesis of glycosylphosphatidylinositol (GPI) |
| 0.0 | 0.5 | REACTOME TRAF6 MEDIATED INDUCTION OF TAK1 COMPLEX | Genes involved in TRAF6 mediated induction of TAK1 complex |
| 0.0 | 0.3 | REACTOME NEP NS2 INTERACTS WITH THE CELLULAR EXPORT MACHINERY | Genes involved in NEP/NS2 Interacts with the Cellular Export Machinery |
| 0.0 | 1.1 | REACTOME RNA POL III TRANSCRIPTION INITIATION FROM TYPE 2 PROMOTER | Genes involved in RNA Polymerase III Transcription Initiation From Type 2 Promoter |
| 0.0 | 1.3 | REACTOME REGULATION OF AMPK ACTIVITY VIA LKB1 | Genes involved in Regulation of AMPK activity via LKB1 |
| 0.0 | 1.1 | REACTOME RNA POL II TRANSCRIPTION PRE INITIATION AND PROMOTER OPENING | Genes involved in RNA Polymerase II Transcription Pre-Initiation And Promoter Opening |
| 0.0 | 0.9 | REACTOME DOWNREGULATION OF SMAD2 3 SMAD4 TRANSCRIPTIONAL ACTIVITY | Genes involved in Downregulation of SMAD2/3:SMAD4 transcriptional activity |
| 0.0 | 0.1 | REACTOME REGULATION OF INSULIN SECRETION BY GLUCAGON LIKE PEPTIDE1 | Genes involved in Regulation of Insulin Secretion by Glucagon-like Peptide-1 |
| 0.0 | 1.2 | REACTOME KERATAN SULFATE BIOSYNTHESIS | Genes involved in Keratan sulfate biosynthesis |
| 0.0 | 1.6 | REACTOME GLUCAGON SIGNALING IN METABOLIC REGULATION | Genes involved in Glucagon signaling in metabolic regulation |
| 0.0 | 1.4 | REACTOME POTASSIUM CHANNELS | Genes involved in Potassium Channels |
| 0.0 | 0.6 | REACTOME NA CL DEPENDENT NEUROTRANSMITTER TRANSPORTERS | Genes involved in Na+/Cl- dependent neurotransmitter transporters |
| 0.0 | 0.8 | REACTOME TRANSPORT OF GLUCOSE AND OTHER SUGARS BILE SALTS AND ORGANIC ACIDS METAL IONS AND AMINE COMPOUNDS | Genes involved in Transport of glucose and other sugars, bile salts and organic acids, metal ions and amine compounds |
| 0.0 | 0.4 | REACTOME TETRAHYDROBIOPTERIN BH4 SYNTHESIS RECYCLING SALVAGE AND REGULATION | Genes involved in Tetrahydrobiopterin (BH4) synthesis, recycling, salvage and regulation |
| 0.0 | 0.4 | REACTOME RECYCLING OF BILE ACIDS AND SALTS | Genes involved in Recycling of bile acids and salts |
| 0.0 | 2.7 | REACTOME TRANSPORT OF INORGANIC CATIONS ANIONS AND AMINO ACIDS OLIGOPEPTIDES | Genes involved in Transport of inorganic cations/anions and amino acids/oligopeptides |
| 0.0 | 1.1 | REACTOME IL 2 SIGNALING | Genes involved in Interleukin-2 signaling |
| 0.0 | 0.7 | REACTOME SIGNALING BY WNT | Genes involved in Signaling by Wnt |
| 0.0 | 1.1 | REACTOME BETA DEFENSINS | Genes involved in Beta defensins |
| 0.0 | 1.9 | REACTOME SPHINGOLIPID METABOLISM | Genes involved in Sphingolipid metabolism |
| 0.0 | 1.9 | REACTOME ANTIVIRAL MECHANISM BY IFN STIMULATED GENES | Genes involved in Antiviral mechanism by IFN-stimulated genes |
| 0.0 | 1.9 | REACTOME ACTIVATION OF CHAPERONE GENES BY XBP1S | Genes involved in Activation of Chaperone Genes by XBP1(S) |
| 0.0 | 0.2 | REACTOME AKT PHOSPHORYLATES TARGETS IN THE CYTOSOL | Genes involved in AKT phosphorylates targets in the cytosol |
| 0.0 | 0.5 | REACTOME INTRINSIC PATHWAY FOR APOPTOSIS | Genes involved in Intrinsic Pathway for Apoptosis |
| 0.0 | 0.4 | REACTOME NEF MEDIATES DOWN MODULATION OF CELL SURFACE RECEPTORS BY RECRUITING THEM TO CLATHRIN ADAPTERS | Genes involved in Nef-mediates down modulation of cell surface receptors by recruiting them to clathrin adapters |
| 0.0 | 4.6 | REACTOME ANTIGEN PROCESSING UBIQUITINATION PROTEASOME DEGRADATION | Genes involved in Antigen processing: Ubiquitination & Proteasome degradation |
| 0.0 | 0.2 | REACTOME DEFENSINS | Genes involved in Defensins |
| 0.0 | 0.5 | REACTOME CYTOCHROME P450 ARRANGED BY SUBSTRATE TYPE | Genes involved in Cytochrome P450 - arranged by substrate type |
| 0.0 | 0.0 | REACTOME GABA RECEPTOR ACTIVATION | Genes involved in GABA receptor activation |
| 0.0 | 0.1 | REACTOME DSCAM INTERACTIONS | Genes involved in DSCAM interactions |
| 0.0 | 1.2 | REACTOME MITOTIC PROMETAPHASE | Genes involved in Mitotic Prometaphase |
| 0.0 | 0.4 | REACTOME SYNTHESIS OF PC | Genes involved in Synthesis of PC |
| 0.0 | 0.3 | REACTOME SIGNALING BY FGFR3 MUTANTS | Genes involved in Signaling by FGFR3 mutants |
| 0.0 | 0.1 | REACTOME G ALPHA Z SIGNALLING EVENTS | Genes involved in G alpha (z) signalling events |
| 0.0 | 0.4 | REACTOME CREB PHOSPHORYLATION THROUGH THE ACTIVATION OF CAMKII | Genes involved in CREB phosphorylation through the activation of CaMKII |