Project
Illumina Body Map 2 (GSE30611)
Navigation
Downloads
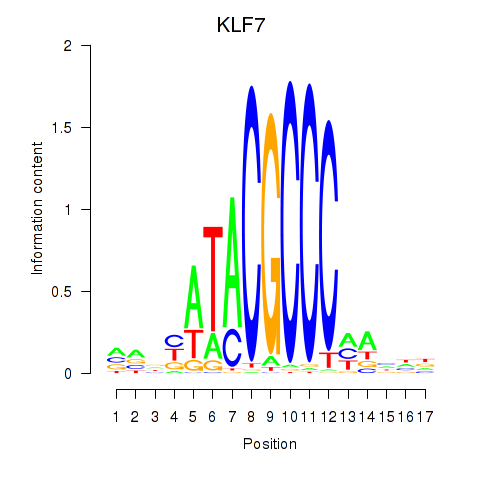
Results for KLF7
Z-value: 0.42
Motif logo
Transcription factors associated with KLF7
| Gene Symbol | Gene ID | Gene Info |
|---|---|---|
|
KLF7
|
ENSG00000118263.15 | Kruppel like factor 7 |
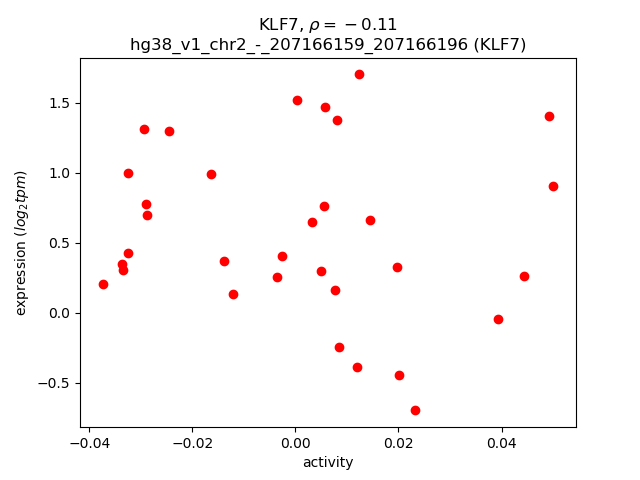
Activity-expression correlation:
| Gene | Promoter | Pearson corr. coef. | P-value | Plot |
|---|---|---|---|---|
| KLF7 | hg38_v1_chr2_-_207166159_207166196 | -0.11 | 5.4e-01 | Click! |
Activity profile of KLF7 motif
Sorted Z-values of KLF7 motif
| Promoter | Log-likelihood | Transcript | Gene | Gene Info |
|---|---|---|---|---|
| chr1_-_18902520 | 1.20 |
ENST00000538839.5
ENST00000290597.9 ENST00000375341.8 |
ALDH4A1
|
aldehyde dehydrogenase 4 family member A1 |
| chr17_-_82098223 | 1.04 |
ENST00000306749.4
ENST00000635197.1 |
FASN
|
fatty acid synthase |
| chr1_-_18902724 | 1.00 |
ENST00000432718.1
|
ALDH4A1
|
aldehyde dehydrogenase 4 family member A1 |
| chr17_-_82098187 | 0.99 |
ENST00000634990.1
|
FASN
|
fatty acid synthase |
| chrX_+_103376887 | 0.57 |
ENST00000372634.1
|
BEX3
|
brain expressed X-linked 3 |
| chrX_+_103376389 | 0.52 |
ENST00000372645.3
ENST00000372635.1 |
BEX3
|
brain expressed X-linked 3 |
| chrX_+_103376488 | 0.50 |
ENST00000361298.9
|
BEX3
|
brain expressed X-linked 3 |
| chr12_-_49189053 | 0.49 |
ENST00000550767.6
ENST00000546918.1 ENST00000679733.1 ENST00000552924.2 ENST00000301071.12 |
TUBA1A
|
tubulin alpha 1a |
| chrX_-_93673558 | 0.47 |
ENST00000475430.2
ENST00000373079.4 |
NAP1L3
|
nucleosome assembly protein 1 like 3 |
| chr21_+_31873010 | 0.46 |
ENST00000270112.7
|
HUNK
|
hormonally up-regulated Neu-associated kinase |
| chr7_+_49773632 | 0.46 |
ENST00000340652.5
|
VWC2
|
von Willebrand factor C domain containing 2 |
| chr6_-_104859828 | 0.45 |
ENST00000519645.5
ENST00000262903.9 ENST00000369125.6 |
HACE1
|
HECT domain and ankyrin repeat containing E3 ubiquitin protein ligase 1 |
| chr7_+_100483919 | 0.45 |
ENST00000300179.7
|
NYAP1
|
neuronal tyrosine phosphorylated phosphoinositide-3-kinase adaptor 1 |
| chr5_+_141968886 | 0.39 |
ENST00000347642.7
|
RNF14
|
ring finger protein 14 |
| chr7_+_128790749 | 0.36 |
ENST00000485998.6
|
CCDC136
|
coiled-coil domain containing 136 |
| chr12_-_49188811 | 0.33 |
ENST00000295766.9
|
TUBA1A
|
tubulin alpha 1a |
| chr4_+_155758990 | 0.33 |
ENST00000505154.5
ENST00000652626.1 ENST00000502959.5 ENST00000264424.13 ENST00000505764.5 ENST00000507146.5 ENST00000503520.5 |
GUCY1B1
|
guanylate cyclase 1 soluble subunit beta 1 |
| chr8_+_11284789 | 0.32 |
ENST00000221086.8
|
MTMR9
|
myotubularin related protein 9 |
| chr4_+_155759365 | 0.29 |
ENST00000513437.1
|
GUCY1B1
|
guanylate cyclase 1 soluble subunit beta 1 |
| chr18_+_74499329 | 0.29 |
ENST00000583216.5
ENST00000581912.1 ENST00000582589.5 |
CNDP2
|
carnosine dipeptidase 2 |
| chr19_-_38899710 | 0.26 |
ENST00000447739.1
ENST00000407552.5 |
SIRT2
|
sirtuin 2 |
| chr19_-_38899800 | 0.26 |
ENST00000414941.5
ENST00000358931.9 ENST00000392081.6 |
SIRT2
|
sirtuin 2 |
| chr15_+_74130243 | 0.24 |
ENST00000561740.5
ENST00000435464.5 |
ISLR2
|
immunoglobulin superfamily containing leucine rich repeat 2 |
| chr1_-_157138474 | 0.23 |
ENST00000326786.4
|
ETV3
|
ETS variant transcription factor 3 |
| chr19_-_38899529 | 0.23 |
ENST00000249396.12
ENST00000437828.5 |
SIRT2
|
sirtuin 2 |
| chr19_+_7629771 | 0.23 |
ENST00000594797.6
ENST00000456958.7 ENST00000601406.5 |
PET100
|
PET100 cytochrome c oxidase chaperone |
| chr3_+_179148099 | 0.22 |
ENST00000477735.1
|
PIK3CA
|
phosphatidylinositol-4,5-bisphosphate 3-kinase catalytic subunit alpha |
| chr2_-_97589711 | 0.22 |
ENST00000359901.8
|
ANKRD36B
|
ankyrin repeat domain 36B |
| chr2_-_95991793 | 0.20 |
ENST00000456556.5
ENST00000619511.1 |
ANKRD36C
|
ankyrin repeat domain 36C |
| chr6_-_109382460 | 0.20 |
ENST00000310786.10
|
CD164
|
CD164 molecule |
| chr12_-_6753134 | 0.19 |
ENST00000203630.10
|
MLF2
|
myeloid leukemia factor 2 |
| chr14_-_100568070 | 0.19 |
ENST00000557378.6
ENST00000443071.6 ENST00000637646.1 |
BEGAIN
|
brain enriched guanylate kinase associated |
| chr5_+_141969190 | 0.18 |
ENST00000506004.5
ENST00000507291.1 |
RNF14
|
ring finger protein 14 |
| chrX_-_25015924 | 0.18 |
ENST00000379044.5
|
ARX
|
aristaless related homeobox |
| chrX_+_93674194 | 0.18 |
ENST00000332647.5
ENST00000683942.1 |
FAM133A
|
family with sequence similarity 133 member A |
| chr17_+_40219325 | 0.17 |
ENST00000585043.5
ENST00000394103.7 |
WIPF2
|
WAS/WASL interacting protein family member 2 |
| chr6_-_109382397 | 0.17 |
ENST00000512821.5
|
CD164
|
CD164 molecule |
| chr15_+_97960692 | 0.16 |
ENST00000268042.7
|
ARRDC4
|
arrestin domain containing 4 |
| chr6_-_109382431 | 0.16 |
ENST00000324953.9
ENST00000275080.11 ENST00000413644.6 |
CD164
|
CD164 molecule |
| chr2_+_97113600 | 0.15 |
ENST00000620383.1
|
ANKRD36
|
ankyrin repeat domain 36 |
| chr3_-_33097132 | 0.15 |
ENST00000307363.10
ENST00000307377.12 ENST00000440656.1 ENST00000436768.1 ENST00000342462.5 |
GLB1
TMPPE
|
galactosidase beta 1 transmembrane protein with metallophosphoesterase domain |
| chr17_+_43398984 | 0.15 |
ENST00000320033.5
|
ARL4D
|
ADP ribosylation factor like GTPase 4D |
| chr3_-_33097100 | 0.14 |
ENST00000415454.1
|
GLB1
|
galactosidase beta 1 |
| chr2_+_97113496 | 0.14 |
ENST00000639293.1
ENST00000461153.7 |
ANKRD36
|
ankyrin repeat domain 36 |
| chr8_+_89757789 | 0.14 |
ENST00000220751.5
|
RIPK2
|
receptor interacting serine/threonine kinase 2 |
| chr7_+_27740095 | 0.13 |
ENST00000265393.10
ENST00000433216.6 ENST00000409980.5 ENST00000396319.7 |
TAX1BP1
|
Tax1 binding protein 1 |
| chr3_+_173396107 | 0.13 |
ENST00000423427.1
|
NLGN1
|
neuroligin 1 |
| chr2_-_97589862 | 0.13 |
ENST00000258459.11
ENST00000438709.6 |
ANKRD36B
|
ankyrin repeat domain 36B |
| chr19_+_18173148 | 0.12 |
ENST00000597802.2
|
IFI30
|
IFI30 lysosomal thiol reductase |
| chr6_-_33271835 | 0.11 |
ENST00000482399.5
ENST00000445902.3 |
VPS52
|
VPS52 subunit of GARP complex |
| chr17_-_50200166 | 0.10 |
ENST00000507689.1
|
COL1A1
|
collagen type I alpha 1 chain |
| chr7_-_47453184 | 0.09 |
ENST00000413551.1
|
TNS3
|
tensin 3 |
| chr17_-_48817217 | 0.09 |
ENST00000393382.8
|
TTLL6
|
tubulin tyrosine ligase like 6 |
| chr3_+_184100179 | 0.08 |
ENST00000335304.6
ENST00000431041.5 ENST00000436361.6 ENST00000440596.2 |
HTR3E
|
5-hydroxytryptamine receptor 3E |
| chr1_+_27830761 | 0.07 |
ENST00000311772.10
ENST00000236412.11 ENST00000373931.8 |
PPP1R8
|
protein phosphatase 1 regulatory subunit 8 |
| chr1_-_157138388 | 0.05 |
ENST00000368192.9
|
ETV3
|
ETS variant transcription factor 3 |
| chr5_+_173888335 | 0.05 |
ENST00000265085.10
|
CPEB4
|
cytoplasmic polyadenylation element binding protein 4 |
| chr9_-_125241327 | 0.04 |
ENST00000324460.7
ENST00000680272.1 ENST00000680032.1 |
HSPA5
|
heat shock protein family A (Hsp70) member 5 |
| chr15_+_92393841 | 0.04 |
ENST00000268164.8
ENST00000539113.5 ENST00000555434.1 |
ST8SIA2
|
ST8 alpha-N-acetyl-neuraminide alpha-2,8-sialyltransferase 2 |
| chr17_+_81239310 | 0.04 |
ENST00000431388.3
|
NDUFAF8
|
NADH:ubiquinone oxidoreductase complex assembly factor 8 |
| chr2_+_69741974 | 0.03 |
ENST00000409920.5
|
ANXA4
|
annexin A4 |
| chr17_+_40219276 | 0.02 |
ENST00000583268.1
ENST00000323571.9 |
WIPF2
|
WAS/WASL interacting protein family member 2 |
| chr8_-_17246846 | 0.01 |
ENST00000628418.1
ENST00000361272.9 ENST00000523917.5 |
CNOT7
|
CCR4-NOT transcription complex subunit 7 |
| chr17_-_42824248 | 0.01 |
ENST00000593205.5
ENST00000361523.8 ENST00000590099.6 ENST00000438274.7 |
BECN1
|
beclin 1 |
| chr15_+_75282835 | 0.01 |
ENST00000434739.3
|
GOLGA6D
|
golgin A6 family member D |
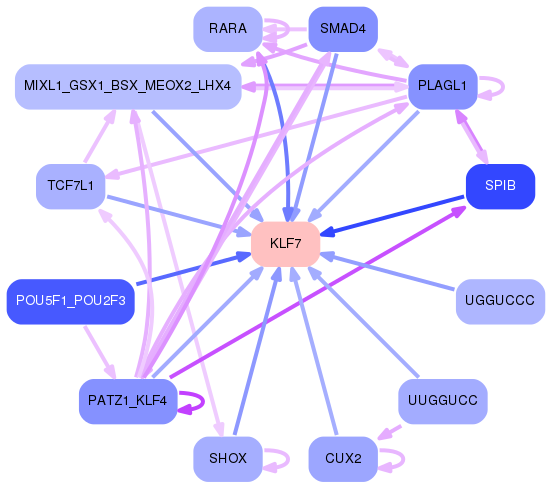
Network of associatons between targets according to the STRING database.

First level regulatory network of KLF7
Gene Ontology Analysis
Gene overrepresentation in biological process category:
| Log-likelihood per target | Total log-likelihood | Term | Description |
|---|---|---|---|
| 0.6 | 2.2 | GO:0010133 | proline catabolic process to glutamate(GO:0010133) |
| 0.3 | 0.8 | GO:0061433 | cellular response to caloric restriction(GO:0061433) negative regulation of oligodendrocyte progenitor proliferation(GO:0070446) |
| 0.1 | 2.0 | GO:0015939 | pantothenate metabolic process(GO:0015939) |
| 0.1 | 0.3 | GO:0051413 | response to cortisone(GO:0051413) |
| 0.0 | 0.1 | GO:0097115 | cytoskeletal matrix organization at active zone(GO:0048789) neurexin clustering involved in presynaptic membrane assembly(GO:0097115) retrograde trans-synaptic signaling by trans-synaptic protein complex(GO:0098942) |
| 0.0 | 0.2 | GO:2000653 | regulation of genetic imprinting(GO:2000653) |
| 0.0 | 0.1 | GO:0033091 | positive regulation of immature T cell proliferation(GO:0033091) |
| 0.0 | 0.1 | GO:0044691 | tooth eruption(GO:0044691) |
| 0.0 | 0.3 | GO:0097011 | cellular response to granulocyte macrophage colony-stimulating factor stimulus(GO:0097011) response to granulocyte macrophage colony-stimulating factor(GO:0097012) |
| 0.0 | 0.2 | GO:0021831 | globus pallidus development(GO:0021759) embryonic olfactory bulb interneuron precursor migration(GO:0021831) |
| 0.0 | 0.2 | GO:0033617 | mitochondrial respiratory chain complex IV assembly(GO:0033617) |
Gene overrepresentation in cellular component category:
| Log-likelihood per target | Total log-likelihood | Term | Description |
|---|---|---|---|
| 0.1 | 2.0 | GO:0042587 | glycogen granule(GO:0042587) |
| 0.1 | 0.8 | GO:0072687 | meiotic spindle(GO:0072687) |
| 0.0 | 0.3 | GO:0090571 | RNA polymerase II transcription repressor complex(GO:0090571) |
| 0.0 | 0.1 | GO:0005584 | collagen type I trimer(GO:0005584) |
| 0.0 | 0.2 | GO:0005943 | phosphatidylinositol 3-kinase complex, class IA(GO:0005943) |
| 0.0 | 0.1 | GO:1990745 | EARP complex(GO:1990745) |
| 0.0 | 0.5 | GO:0005614 | interstitial matrix(GO:0005614) |
Gene overrepresentation in molecular function category:
| Log-likelihood per target | Total log-likelihood | Term | Description |
|---|---|---|---|
| 0.7 | 2.0 | GO:0016420 | [acyl-carrier-protein] S-malonyltransferase activity(GO:0004314) S-malonyltransferase activity(GO:0016419) malonyltransferase activity(GO:0016420) |
| 0.4 | 1.6 | GO:0005163 | nerve growth factor receptor binding(GO:0005163) |
| 0.3 | 0.8 | GO:0046970 | NAD-dependent histone deacetylase activity (H4-K16 specific)(GO:0046970) |
| 0.1 | 2.2 | GO:0004029 | aldehyde dehydrogenase (NAD) activity(GO:0004029) |
| 0.0 | 0.3 | GO:0102008 | cytosolic dipeptidase activity(GO:0102008) |
| 0.0 | 0.3 | GO:0016936 | galactoside binding(GO:0016936) |
| 0.0 | 0.3 | GO:0052629 | phosphatidylinositol-3,5-bisphosphate 3-phosphatase activity(GO:0052629) |
| 0.0 | 0.2 | GO:0035005 | 1-phosphatidylinositol-4-phosphate 3-kinase activity(GO:0035005) |
| 0.0 | 0.1 | GO:0089720 | caspase binding(GO:0089720) |
| 0.0 | 0.3 | GO:0017151 | DEAD/H-box RNA helicase binding(GO:0017151) |
Gene overrepresentation in curated gene sets: canonical pathways category:
| Log-likelihood per target | Total log-likelihood | Term | Description |
|---|---|---|---|
| 0.0 | 2.0 | PID DELTA NP63 PATHWAY | Validated transcriptional targets of deltaNp63 isoforms |
| 0.0 | 0.8 | PID HDAC CLASSIII PATHWAY | Signaling events mediated by HDAC Class III |
Gene overrepresentation in curated gene sets: REACTOME pathways category:
| Log-likelihood per target | Total log-likelihood | Term | Description |
|---|---|---|---|
| 0.1 | 2.0 | REACTOME VITAMIN B5 PANTOTHENATE METABOLISM | Genes involved in Vitamin B5 (pantothenate) metabolism |
| 0.0 | 0.8 | REACTOME FORMATION OF TUBULIN FOLDING INTERMEDIATES BY CCT TRIC | Genes involved in Formation of tubulin folding intermediates by CCT/TriC |
| 0.0 | 0.3 | REACTOME KERATAN SULFATE DEGRADATION | Genes involved in Keratan sulfate degradation |