Project
Illumina Body Map 2 (GSE30611)
Navigation
Downloads
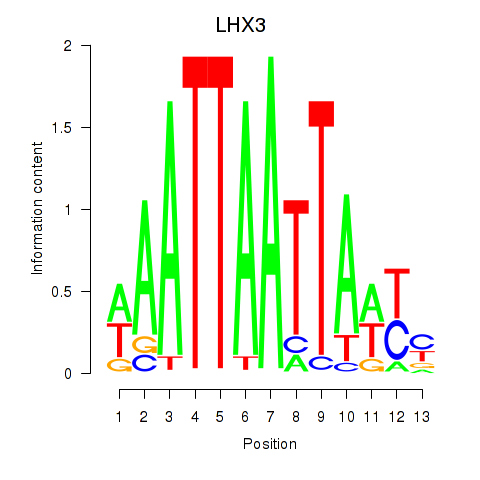
Results for LHX3
Z-value: 0.87
Motif logo
Transcription factors associated with LHX3
| Gene Symbol | Gene ID | Gene Info |
|---|---|---|
|
LHX3
|
ENSG00000107187.17 | LIM homeobox 3 |
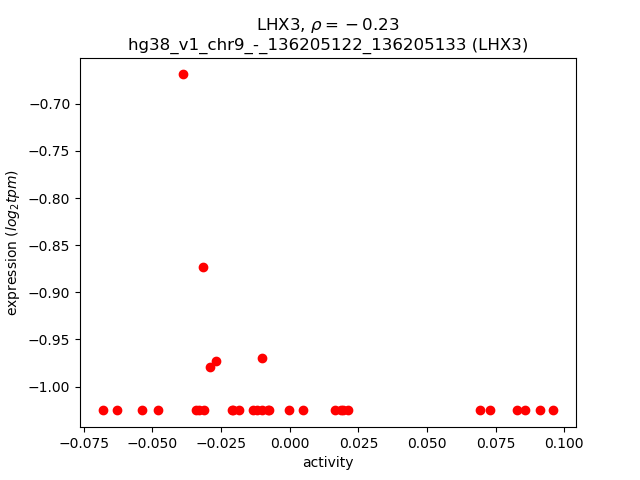
Activity-expression correlation:
| Gene | Promoter | Pearson corr. coef. | P-value | Plot |
|---|---|---|---|---|
| LHX3 | hg38_v1_chr9_-_136205122_136205133 | -0.23 | 2.2e-01 | Click! |
Activity profile of LHX3 motif
Sorted Z-values of LHX3 motif
| Promoter | Log-likelihood | Transcript | Gene | Gene Info |
|---|---|---|---|---|
| chr15_+_48191648 | 3.45 |
ENST00000646012.1
ENST00000561127.5 ENST00000647546.1 ENST00000559641.5 ENST00000417307.3 |
SLC12A1
CTXN2
|
solute carrier family 12 member 1 cortexin 2 |
| chr4_+_154563003 | 2.65 |
ENST00000302068.9
ENST00000509493.1 |
FGB
|
fibrinogen beta chain |
| chr12_-_10130143 | 2.46 |
ENST00000298523.9
ENST00000396484.6 ENST00000310002.4 ENST00000304084.13 |
CLEC7A
|
C-type lectin domain containing 7A |
| chr3_+_151873634 | 2.17 |
ENST00000362032.6
|
SUCNR1
|
succinate receptor 1 |
| chr12_-_10130241 | 2.00 |
ENST00000353231.9
ENST00000525605.1 |
CLEC7A
|
C-type lectin domain containing 7A |
| chr5_-_39274515 | 1.92 |
ENST00000510188.1
|
FYB1
|
FYN binding protein 1 |
| chr19_-_51417791 | 1.84 |
ENST00000353836.9
|
SIGLEC10
|
sialic acid binding Ig like lectin 10 |
| chr19_-_51417700 | 1.82 |
ENST00000529627.1
ENST00000439889.6 |
SIGLEC10
|
sialic acid binding Ig like lectin 10 |
| chr18_+_74534493 | 1.82 |
ENST00000358821.8
|
CNDP1
|
carnosine dipeptidase 1 |
| chr7_-_87713287 | 1.79 |
ENST00000416177.1
ENST00000265724.8 ENST00000543898.5 |
ABCB1
|
ATP binding cassette subfamily B member 1 |
| chr2_+_134838610 | 1.72 |
ENST00000356140.10
ENST00000392928.5 |
ACMSD
|
aminocarboxymuconate semialdehyde decarboxylase |
| chr12_+_40310431 | 1.71 |
ENST00000681696.1
|
LRRK2
|
leucine rich repeat kinase 2 |
| chr18_+_74534594 | 1.69 |
ENST00000582365.1
|
CNDP1
|
carnosine dipeptidase 1 |
| chr5_-_88824266 | 1.52 |
ENST00000509373.1
ENST00000636541.1 |
MEF2C
|
myocyte enhancer factor 2C |
| chr12_-_10130082 | 1.51 |
ENST00000533022.5
|
CLEC7A
|
C-type lectin domain containing 7A |
| chr2_+_218129277 | 1.49 |
ENST00000428565.1
|
CXCR2
|
C-X-C motif chemokine receptor 2 |
| chr4_+_157221598 | 1.45 |
ENST00000505888.1
|
GRIA2
|
glutamate ionotropic receptor AMPA type subunit 2 |
| chr7_-_36724457 | 1.44 |
ENST00000617537.5
ENST00000435386.1 |
AOAH
|
acyloxyacyl hydrolase |
| chr3_+_68006224 | 1.43 |
ENST00000496687.1
|
TAFA1
|
TAFA chemokine like family member 1 |
| chr6_+_122996227 | 1.38 |
ENST00000275162.10
|
CLVS2
|
clavesin 2 |
| chr8_-_109974688 | 1.32 |
ENST00000297404.1
|
KCNV1
|
potassium voltage-gated channel modifier subfamily V member 1 |
| chr7_-_36724543 | 1.30 |
ENST00000612871.4
|
AOAH
|
acyloxyacyl hydrolase |
| chr1_-_150971935 | 1.16 |
ENST00000368949.8
|
CERS2
|
ceramide synthase 2 |
| chr17_+_70075317 | 1.12 |
ENST00000589377.1
|
KCNJ16
|
potassium inwardly rectifying channel subfamily J member 16 |
| chr9_-_6605338 | 1.07 |
ENST00000638654.1
|
GLDC
|
glycine decarboxylase |
| chr1_-_150235972 | 1.06 |
ENST00000534220.1
|
ANP32E
|
acidic nuclear phosphoprotein 32 family member E |
| chr18_-_3845321 | 1.04 |
ENST00000539435.5
ENST00000400147.6 |
DLGAP1
|
DLG associated protein 1 |
| chr1_-_150236064 | 1.04 |
ENST00000532744.2
ENST00000369114.9 ENST00000369115.3 ENST00000583931.6 |
ANP32E
|
acidic nuclear phosphoprotein 32 family member E |
| chr3_+_186974957 | 1.00 |
ENST00000438590.5
|
ST6GAL1
|
ST6 beta-galactoside alpha-2,6-sialyltransferase 1 |
| chr1_-_160579439 | 1.00 |
ENST00000368054.8
ENST00000368048.7 ENST00000311224.8 ENST00000368051.3 ENST00000534968.5 |
CD84
|
CD84 molecule |
| chr4_+_157220691 | 0.99 |
ENST00000509417.5
ENST00000645636.1 ENST00000296526.12 ENST00000264426.14 |
GRIA2
|
glutamate ionotropic receptor AMPA type subunit 2 |
| chr16_-_28623560 | 0.99 |
ENST00000350842.8
|
SULT1A1
|
sulfotransferase family 1A member 1 |
| chr2_+_184598520 | 0.97 |
ENST00000302277.7
|
ZNF804A
|
zinc finger protein 804A |
| chr1_-_150235995 | 0.96 |
ENST00000436748.6
|
ANP32E
|
acidic nuclear phosphoprotein 32 family member E |
| chr1_+_66354375 | 0.92 |
ENST00000480109.2
|
PDE4B
|
phosphodiesterase 4B |
| chr2_-_2324323 | 0.90 |
ENST00000648339.1
ENST00000647694.1 |
MYT1L
|
myelin transcription factor 1 like |
| chr13_-_83882456 | 0.89 |
ENST00000674365.1
|
SLITRK1
|
SLIT and NTRK like family member 1 |
| chr5_+_127649018 | 0.86 |
ENST00000379445.7
|
CTXN3
|
cortexin 3 |
| chr1_+_240245260 | 0.85 |
ENST00000441342.1
|
FMN2
|
formin 2 |
| chr19_+_14583076 | 0.82 |
ENST00000547437.5
ENST00000417570.6 |
CLEC17A
|
C-type lectin domain containing 17A |
| chr4_-_23890070 | 0.80 |
ENST00000617484.4
ENST00000612355.1 |
PPARGC1A
|
PPARG coactivator 1 alpha |
| chr12_+_118981531 | 0.80 |
ENST00000267260.5
|
SRRM4
|
serine/arginine repetitive matrix 4 |
| chr6_-_159045104 | 0.79 |
ENST00000326965.7
|
TAGAP
|
T cell activation RhoGTPase activating protein |
| chr11_-_790062 | 0.79 |
ENST00000330106.5
|
CEND1
|
cell cycle exit and neuronal differentiation 1 |
| chr12_-_7503841 | 0.78 |
ENST00000359156.8
|
CD163
|
CD163 molecule |
| chr7_+_30145789 | 0.78 |
ENST00000324489.5
|
MTURN
|
maturin, neural progenitor differentiation regulator homolog |
| chr18_+_57352541 | 0.77 |
ENST00000324000.4
|
ST8SIA3
|
ST8 alpha-N-acetyl-neuraminide alpha-2,8-sialyltransferase 3 |
| chr12_-_7503744 | 0.76 |
ENST00000396620.7
ENST00000432237.3 |
CD163
|
CD163 molecule |
| chr13_-_83882390 | 0.75 |
ENST00000377084.3
|
SLITRK1
|
SLIT and NTRK like family member 1 |
| chr7_-_123199960 | 0.75 |
ENST00000194130.7
|
SLC13A1
|
solute carrier family 13 member 1 |
| chr5_-_88824334 | 0.75 |
ENST00000506716.5
|
MEF2C
|
myocyte enhancer factor 2C |
| chr10_-_72523936 | 0.75 |
ENST00000398763.8
ENST00000418483.6 ENST00000489666.2 |
MICU1
|
mitochondrial calcium uptake 1 |
| chr1_-_150235943 | 0.74 |
ENST00000533654.5
|
ANP32E
|
acidic nuclear phosphoprotein 32 family member E |
| chr2_-_144521042 | 0.73 |
ENST00000637267.2
|
ZEB2
|
zinc finger E-box binding homeobox 2 |
| chr18_-_3845292 | 0.73 |
ENST00000400145.6
|
DLGAP1
|
DLG associated protein 1 |
| chr14_+_34993240 | 0.72 |
ENST00000677647.1
|
SRP54
|
signal recognition particle 54 |
| chrM_-_14669 | 0.72 |
ENST00000361681.2
|
MT-ND6
|
mitochondrially encoded NADH:ubiquinone oxidoreductase core subunit 6 |
| chr19_-_3557563 | 0.72 |
ENST00000389395.7
ENST00000355415.7 |
MFSD12
|
major facilitator superfamily domain containing 12 |
| chr3_+_122183664 | 0.71 |
ENST00000639785.2
|
CASR
|
calcium sensing receptor |
| chr4_-_36243939 | 0.70 |
ENST00000506189.1
|
ARAP2
|
ArfGAP with RhoGAP domain, ankyrin repeat and PH domain 2 |
| chr2_-_2324642 | 0.70 |
ENST00000650485.1
ENST00000649207.1 |
MYT1L
|
myelin transcription factor 1 like |
| chr10_-_114144599 | 0.68 |
ENST00000428953.1
|
CCDC186
|
coiled-coil domain containing 186 |
| chr2_-_98663464 | 0.68 |
ENST00000414521.6
|
MGAT4A
|
alpha-1,3-mannosyl-glycoprotein 4-beta-N-acetylglucosaminyltransferase A |
| chr9_+_79573162 | 0.67 |
ENST00000425506.5
|
TLE4
|
TLE family member 4, transcriptional corepressor |
| chr12_-_118190510 | 0.67 |
ENST00000540561.5
ENST00000537952.1 ENST00000537822.1 |
TAOK3
|
TAO kinase 3 |
| chr1_+_244051275 | 0.66 |
ENST00000358704.4
|
ZBTB18
|
zinc finger and BTB domain containing 18 |
| chr1_+_177170916 | 0.64 |
ENST00000361539.5
|
BRINP2
|
BMP/retinoic acid inducible neural specific 2 |
| chr8_-_131040890 | 0.64 |
ENST00000286355.10
|
ADCY8
|
adenylate cyclase 8 |
| chr4_-_23890035 | 0.64 |
ENST00000507380.1
ENST00000264867.7 |
PPARGC1A
|
PPARG coactivator 1 alpha |
| chr1_+_197268204 | 0.64 |
ENST00000535699.5
ENST00000538660.5 |
CRB1
|
crumbs cell polarity complex component 1 |
| chr6_+_106360668 | 0.62 |
ENST00000633556.3
|
CRYBG1
|
crystallin beta-gamma domain containing 1 |
| chr19_-_48646155 | 0.60 |
ENST00000084798.9
|
CA11
|
carbonic anhydrase 11 |
| chr7_-_14974773 | 0.60 |
ENST00000437998.1
|
DGKB
|
diacylglycerol kinase beta |
| chr7_-_116159886 | 0.59 |
ENST00000484212.5
|
TFEC
|
transcription factor EC |
| chr7_+_138460238 | 0.58 |
ENST00000343526.9
|
TRIM24
|
tripartite motif containing 24 |
| chr6_+_72216442 | 0.58 |
ENST00000425662.6
ENST00000453976.6 |
RIMS1
|
regulating synaptic membrane exocytosis 1 |
| chr4_+_41935114 | 0.57 |
ENST00000508448.5
ENST00000513702.5 ENST00000325094.9 |
TMEM33
|
transmembrane protein 33 |
| chr10_-_27240505 | 0.56 |
ENST00000375888.5
ENST00000676732.1 |
ACBD5
|
acyl-CoA binding domain containing 5 |
| chr3_+_63967738 | 0.56 |
ENST00000484332.1
|
ATXN7
|
ataxin 7 |
| chr1_-_23799533 | 0.56 |
ENST00000429356.5
|
GALE
|
UDP-galactose-4-epimerase |
| chr10_-_88851809 | 0.55 |
ENST00000371930.5
|
ANKRD22
|
ankyrin repeat domain 22 |
| chr11_-_75089754 | 0.53 |
ENST00000305159.3
|
OR2AT4
|
olfactory receptor family 2 subfamily AT member 4 |
| chr10_+_87357720 | 0.52 |
ENST00000412718.3
ENST00000381697.7 |
NUTM2D
|
NUT family member 2D |
| chr7_-_105691637 | 0.52 |
ENST00000472195.1
|
ATXN7L1
|
ataxin 7 like 1 |
| chr1_-_23799561 | 0.52 |
ENST00000445705.1
|
GALE
|
UDP-galactose-4-epimerase |
| chr2_-_2324968 | 0.51 |
ENST00000649641.1
|
MYT1L
|
myelin transcription factor 1 like |
| chr15_+_65550819 | 0.49 |
ENST00000569894.5
|
HACD3
|
3-hydroxyacyl-CoA dehydratase 3 |
| chr11_-_129024157 | 0.49 |
ENST00000392657.7
|
ARHGAP32
|
Rho GTPase activating protein 32 |
| chr17_-_66229380 | 0.49 |
ENST00000205948.11
|
APOH
|
apolipoprotein H |
| chrX_-_13817027 | 0.48 |
ENST00000493677.5
ENST00000355135.6 ENST00000316715.9 |
GPM6B
|
glycoprotein M6B |
| chr1_+_197268222 | 0.47 |
ENST00000367400.8
ENST00000638467.1 ENST00000367399.6 |
CRB1
|
crumbs cell polarity complex component 1 |
| chr4_+_157220795 | 0.47 |
ENST00000506284.5
|
GRIA2
|
glutamate ionotropic receptor AMPA type subunit 2 |
| chr7_+_38977904 | 0.47 |
ENST00000518318.7
ENST00000403058.6 |
POU6F2
|
POU class 6 homeobox 2 |
| chr6_-_138512493 | 0.47 |
ENST00000533765.1
|
NHSL1
|
NHS like 1 |
| chr8_-_56211257 | 0.45 |
ENST00000316981.8
ENST00000423799.6 ENST00000429357.2 |
PLAG1
|
PLAG1 zinc finger |
| chr11_+_60056587 | 0.44 |
ENST00000395032.6
ENST00000358152.6 |
MS4A3
|
membrane spanning 4-domains A3 |
| chr10_-_126670686 | 0.44 |
ENST00000488181.3
|
C10orf90
|
chromosome 10 open reading frame 90 |
| chr14_+_61697622 | 0.44 |
ENST00000539097.2
|
HIF1A
|
hypoxia inducible factor 1 subunit alpha |
| chr2_-_2324935 | 0.42 |
ENST00000649709.1
|
MYT1L
|
myelin transcription factor 1 like |
| chr1_-_111488795 | 0.41 |
ENST00000472933.2
|
TMIGD3
|
transmembrane and immunoglobulin domain containing 3 |
| chr1_+_196888014 | 0.41 |
ENST00000367416.6
ENST00000608469.6 ENST00000251424.8 ENST00000367418.2 |
CFHR4
|
complement factor H related 4 |
| chr5_-_88823763 | 0.41 |
ENST00000635898.1
ENST00000626391.2 ENST00000628656.2 |
MEF2C
|
myocyte enhancer factor 2C |
| chr18_-_5197241 | 0.41 |
ENST00000434239.4
|
AKAIN1
|
A-kinase anchor inhibitor 1 |
| chr11_-_117316230 | 0.40 |
ENST00000313005.11
ENST00000528053.5 |
BACE1
|
beta-secretase 1 |
| chr14_+_21997531 | 0.39 |
ENST00000390445.2
|
TRAV17
|
T cell receptor alpha variable 17 |
| chr4_+_94207596 | 0.37 |
ENST00000359052.8
|
SMARCAD1
|
SWI/SNF-related, matrix-associated actin-dependent regulator of chromatin, subfamily a, containing DEAD/H box 1 |
| chr5_+_68290637 | 0.37 |
ENST00000336483.9
|
PIK3R1
|
phosphoinositide-3-kinase regulatory subunit 1 |
| chr18_+_616672 | 0.35 |
ENST00000338387.11
|
CLUL1
|
clusterin like 1 |
| chr18_+_616711 | 0.35 |
ENST00000579494.1
|
CLUL1
|
clusterin like 1 |
| chr12_+_49346911 | 0.35 |
ENST00000395069.3
|
DNAJC22
|
DnaJ heat shock protein family (Hsp40) member C22 |
| chr3_+_46877705 | 0.34 |
ENST00000449590.6
|
PTH1R
|
parathyroid hormone 1 receptor |
| chr1_-_74512611 | 0.34 |
ENST00000294635.5
|
LRRC53
|
leucine rich repeat containing 53 |
| chr8_-_30812867 | 0.32 |
ENST00000518243.5
|
PPP2CB
|
protein phosphatase 2 catalytic subunit beta |
| chr19_+_11346499 | 0.31 |
ENST00000458408.6
ENST00000586451.5 ENST00000588592.5 |
CCDC159
|
coiled-coil domain containing 159 |
| chr3_-_191282383 | 0.30 |
ENST00000427544.6
|
UTS2B
|
urotensin 2B |
| chr3_+_101724633 | 0.30 |
ENST00000494050.5
|
CEP97
|
centrosomal protein 97 |
| chr17_-_30334050 | 0.30 |
ENST00000328886.5
ENST00000538566.6 |
TMIGD1
|
transmembrane and immunoglobulin domain containing 1 |
| chr11_+_60056653 | 0.29 |
ENST00000278865.8
|
MS4A3
|
membrane spanning 4-domains A3 |
| chr3_+_46612525 | 0.27 |
ENST00000640551.3
|
FAM240A
|
family with sequence similarity 240 member A |
| chr2_-_96505345 | 0.27 |
ENST00000310865.7
ENST00000451794.6 |
NEURL3
|
neuralized E3 ubiquitin protein ligase 3 |
| chr19_-_11346486 | 0.27 |
ENST00000590482.5
|
TMEM205
|
transmembrane protein 205 |
| chr3_-_64019334 | 0.27 |
ENST00000480205.5
|
PSMD6
|
proteasome 26S subunit, non-ATPase 6 |
| chr5_+_148312416 | 0.27 |
ENST00000274565.5
|
SPINK7
|
serine peptidase inhibitor Kazal type 7 |
| chr6_+_26103922 | 0.26 |
ENST00000377803.4
|
H4C3
|
H4 clustered histone 3 |
| chr4_-_86357722 | 0.26 |
ENST00000641341.1
ENST00000642038.1 ENST00000641116.1 ENST00000641767.1 ENST00000639242.1 ENST00000638313.1 |
MAPK10
|
mitogen-activated protein kinase 10 |
| chrX_+_85003863 | 0.26 |
ENST00000373173.7
|
APOOL
|
apolipoprotein O like |
| chr9_-_113303271 | 0.26 |
ENST00000297894.5
ENST00000489339.2 |
RNF183
|
ring finger protein 183 |
| chr7_+_92057602 | 0.26 |
ENST00000491695.2
|
AKAP9
|
A-kinase anchoring protein 9 |
| chr3_+_138621225 | 0.25 |
ENST00000479848.1
|
FAIM
|
Fas apoptotic inhibitory molecule |
| chr19_+_9185594 | 0.25 |
ENST00000344248.4
|
OR7D2
|
olfactory receptor family 7 subfamily D member 2 |
| chr3_-_47475811 | 0.25 |
ENST00000265565.10
ENST00000428413.5 |
SCAP
|
SREBF chaperone |
| chr15_+_64387828 | 0.24 |
ENST00000261884.8
|
TRIP4
|
thyroid hormone receptor interactor 4 |
| chr1_-_92486916 | 0.24 |
ENST00000294702.6
|
GFI1
|
growth factor independent 1 transcriptional repressor |
| chr15_-_55408245 | 0.24 |
ENST00000563171.5
ENST00000425574.7 ENST00000442196.8 ENST00000564092.1 |
CCPG1
|
cell cycle progression 1 |
| chrX_+_109535775 | 0.23 |
ENST00000218004.5
|
NXT2
|
nuclear transport factor 2 like export factor 2 |
| chr8_-_109680812 | 0.23 |
ENST00000528716.5
ENST00000527600.5 ENST00000531230.5 ENST00000532189.5 ENST00000534184.5 ENST00000408889.7 ENST00000533171.5 |
SYBU
|
syntabulin |
| chr16_-_28623330 | 0.23 |
ENST00000677940.1
|
ENSG00000288656.1
|
novel protein |
| chr3_+_101724602 | 0.23 |
ENST00000341893.8
|
CEP97
|
centrosomal protein 97 |
| chr1_-_19923617 | 0.23 |
ENST00000375116.3
|
PLA2G2E
|
phospholipase A2 group IIE |
| chr14_+_55027576 | 0.22 |
ENST00000339298.2
|
SOCS4
|
suppressor of cytokine signaling 4 |
| chrX_+_123963164 | 0.22 |
ENST00000394478.1
|
STAG2
|
stromal antigen 2 |
| chr17_+_37491464 | 0.21 |
ENST00000613659.1
|
DUSP14
|
dual specificity phosphatase 14 |
| chr3_-_142029108 | 0.20 |
ENST00000497579.5
|
TFDP2
|
transcription factor Dp-2 |
| chr22_+_23145366 | 0.19 |
ENST00000341989.9
ENST00000263116.8 |
RAB36
|
RAB36, member RAS oncogene family |
| chr1_-_182671853 | 0.18 |
ENST00000367556.5
|
RGS8
|
regulator of G protein signaling 8 |
| chr19_+_11346556 | 0.17 |
ENST00000587531.5
|
CCDC159
|
coiled-coil domain containing 159 |
| chr5_-_79514127 | 0.17 |
ENST00000334082.11
|
HOMER1
|
homer scaffold protein 1 |
| chr8_-_30812773 | 0.16 |
ENST00000221138.9
|
PPP2CB
|
protein phosphatase 2 catalytic subunit beta |
| chr15_-_75455802 | 0.16 |
ENST00000568431.5
ENST00000568309.5 ENST00000568190.1 ENST00000570115.5 ENST00000564778.5 |
SIN3A
|
SIN3 transcription regulator family member A |
| chr15_-_75455767 | 0.15 |
ENST00000360439.8
|
SIN3A
|
SIN3 transcription regulator family member A |
| chr1_-_182671902 | 0.15 |
ENST00000483095.6
|
RGS8
|
regulator of G protein signaling 8 |
| chr11_-_63608542 | 0.13 |
ENST00000540943.1
|
PLAAT3
|
phospholipase A and acyltransferase 3 |
| chr16_+_67570741 | 0.11 |
ENST00000644753.1
ENST00000642819.1 ENST00000645306.1 |
CTCF
|
CCCTC-binding factor |
| chr12_-_52367478 | 0.11 |
ENST00000257901.7
|
KRT85
|
keratin 85 |
| chr12_+_55444069 | 0.11 |
ENST00000641516.1
ENST00000641202.1 |
OR6C2
|
olfactory receptor family 6 subfamily C member 2 |
| chr16_-_1488764 | 0.11 |
ENST00000447419.7
ENST00000440447.2 |
PTX4
|
pentraxin 4 |
| chr7_+_120273129 | 0.11 |
ENST00000331113.9
|
KCND2
|
potassium voltage-gated channel subfamily D member 2 |
| chr3_+_158110052 | 0.11 |
ENST00000295930.7
ENST00000471994.5 ENST00000482822.3 ENST00000476899.6 ENST00000683899.1 ENST00000684604.1 ENST00000682164.1 ENST00000464171.5 ENST00000611884.5 ENST00000312179.10 ENST00000475278.6 |
RSRC1
|
arginine and serine rich coiled-coil 1 |
| chr2_-_50656384 | 0.10 |
ENST00000625891.2
|
NRXN1
|
neurexin 1 |
| chr8_+_106726115 | 0.10 |
ENST00000521592.5
|
OXR1
|
oxidation resistance 1 |
| chr18_-_5197502 | 0.09 |
ENST00000580650.1
|
AKAIN1
|
A-kinase anchor inhibitor 1 |
| chr12_+_55330043 | 0.09 |
ENST00000641364.1
|
OR6C3
|
olfactory receptor family 6 subfamily C member 3 |
| chr6_-_31120437 | 0.09 |
ENST00000376288.3
|
CDSN
|
corneodesmosin |
| chr3_+_41194741 | 0.08 |
ENST00000643541.1
ENST00000426215.5 ENST00000645210.1 ENST00000646381.1 ENST00000405570.6 ENST00000642248.1 ENST00000433400.6 |
CTNNB1
|
catenin beta 1 |
| chr3_-_20012250 | 0.08 |
ENST00000389050.5
|
PP2D1
|
protein phosphatase 2C like domain containing 1 |
| chr9_+_69145463 | 0.07 |
ENST00000636438.1
|
TJP2
|
tight junction protein 2 |
| chr1_-_158426237 | 0.07 |
ENST00000641042.1
|
OR10K2
|
olfactory receptor family 10 subfamily K member 2 |
| chr1_+_115029823 | 0.06 |
ENST00000256592.3
|
TSHB
|
thyroid stimulating hormone subunit beta |
| chrX_+_108045050 | 0.06 |
ENST00000458383.1
ENST00000217957.10 |
VSIG1
|
V-set and immunoglobulin domain containing 1 |
| chr11_-_5778667 | 0.06 |
ENST00000317093.2
|
OR52N5
|
olfactory receptor family 52 subfamily N member 5 |
| chr1_-_158570580 | 0.06 |
ENST00000641540.1
|
OR6P1
|
olfactory receptor family 6 subfamily P member 1 |
| chr5_+_55853314 | 0.04 |
ENST00000354961.8
ENST00000297015.7 |
IL31RA
|
interleukin 31 receptor A |
| chr14_+_55027200 | 0.04 |
ENST00000395472.2
ENST00000555846.2 |
SOCS4
|
suppressor of cytokine signaling 4 |
| chr1_-_45522870 | 0.02 |
ENST00000424390.2
|
PRDX1
|
peroxiredoxin 1 |
| chr10_-_45307838 | 0.01 |
ENST00000536058.1
|
OR13A1
|
olfactory receptor family 13 subfamily A member 1 |
| chr3_+_138621207 | 0.00 |
ENST00000464668.5
|
FAIM
|
Fas apoptotic inhibitory molecule |
| chr1_+_207325629 | 0.00 |
ENST00000618707.2
|
CD55
|
CD55 molecule (Cromer blood group) |
| chr5_+_167284799 | 0.00 |
ENST00000518659.5
|
TENM2
|
teneurin transmembrane protein 2 |
| chr13_-_70108441 | 0.00 |
ENST00000377844.9
ENST00000545028.2 |
KLHL1
|
kelch like family member 1 |
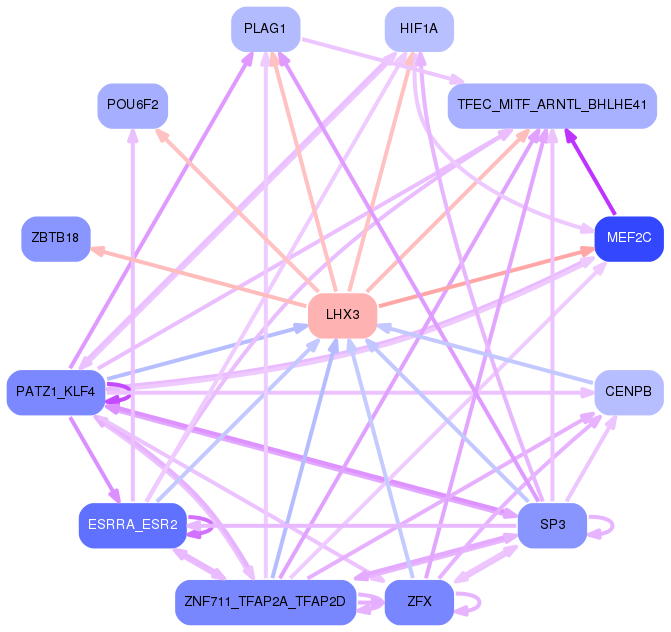
Network of associatons between targets according to the STRING database.

First level regulatory network of LHX3
Gene Ontology Analysis
Gene overrepresentation in biological process category:
| Log-likelihood per target | Total log-likelihood | Term | Description |
|---|---|---|---|
| 0.6 | 1.7 | GO:1902688 | regulation of NAD metabolic process(GO:1902688) |
| 0.6 | 1.7 | GO:1903123 | regulation of thioredoxin peroxidase activity(GO:1903123) negative regulation of thioredoxin peroxidase activity(GO:1903124) negative regulation of thioredoxin peroxidase activity by peptidyl-threonine phosphorylation(GO:1903125) Wnt signalosome assembly(GO:1904887) negative regulation of peroxidase activity(GO:2000469) |
| 0.5 | 1.4 | GO:0071250 | cellular response to nitrite(GO:0071250) response to nitrite(GO:0080033) glomerular visceral epithelial cell apoptotic process(GO:1903210) regulation of glomerular visceral epithelial cell apoptotic process(GO:1904633) positive regulation of glomerular visceral epithelial cell apoptotic process(GO:1904635) response to resveratrol(GO:1904638) cellular response to resveratrol(GO:1904639) positive regulation of progesterone biosynthetic process(GO:2000184) |
| 0.4 | 1.1 | GO:1903442 | response to methylamine(GO:0036255) response to lipoic acid(GO:1903442) |
| 0.3 | 1.0 | GO:0032701 | negative regulation of interleukin-18 production(GO:0032701) |
| 0.3 | 1.2 | GO:1900148 | Schwann cell proliferation involved in axon regeneration(GO:0014011) negative regulation of Schwann cell migration(GO:1900148) regulation of Schwann cell proliferation involved in axon regeneration(GO:1905044) negative regulation of Schwann cell proliferation involved in axon regeneration(GO:1905045) |
| 0.2 | 1.5 | GO:0038112 | interleukin-8-mediated signaling pathway(GO:0038112) |
| 0.2 | 2.7 | GO:0003138 | primary heart field specification(GO:0003138) sinoatrial valve development(GO:0003172) sinoatrial valve morphogenesis(GO:0003185) |
| 0.2 | 6.0 | GO:0009756 | carbohydrate mediated signaling(GO:0009756) |
| 0.2 | 2.6 | GO:0043152 | induction of bacterial agglutination(GO:0043152) |
| 0.2 | 0.7 | GO:0006617 | SRP-dependent cotranslational protein targeting to membrane, signal sequence recognition(GO:0006617) |
| 0.2 | 0.9 | GO:0051758 | homologous chromosome movement towards spindle pole involved in homologous chromosome segregation(GO:0051758) |
| 0.2 | 1.8 | GO:1901529 | positive regulation of anion channel activity(GO:1901529) |
| 0.2 | 0.5 | GO:0007402 | ganglion mother cell fate determination(GO:0007402) |
| 0.1 | 0.6 | GO:1903371 | regulation of endoplasmic reticulum tubular network organization(GO:1903371) |
| 0.1 | 0.8 | GO:0021699 | cerebellum maturation(GO:0021590) cerebellar cortex maturation(GO:0021699) |
| 0.1 | 0.2 | GO:0070105 | positive regulation of interleukin-6-mediated signaling pathway(GO:0070105) |
| 0.1 | 0.3 | GO:1901675 | negative regulation of histone H3-K27 acetylation(GO:1901675) |
| 0.1 | 0.4 | GO:0061030 | epithelial cell differentiation involved in mammary gland alveolus development(GO:0061030) positive regulation of chemokine-mediated signaling pathway(GO:0070101) |
| 0.1 | 0.6 | GO:0030242 | pexophagy(GO:0030242) |
| 0.1 | 1.1 | GO:0019388 | galactose catabolic process(GO:0019388) |
| 0.1 | 0.7 | GO:0036444 | calcium ion transmembrane import into mitochondrion(GO:0036444) |
| 0.1 | 0.7 | GO:0021767 | mammillary body development(GO:0021767) mammillary axonal complex development(GO:0061373) positive regulation of lens fiber cell differentiation(GO:1902748) |
| 0.1 | 0.5 | GO:0046726 | positive regulation by virus of viral protein levels in host cell(GO:0046726) |
| 0.1 | 3.8 | GO:0043486 | histone exchange(GO:0043486) |
| 0.1 | 0.9 | GO:1901898 | negative regulation of relaxation of cardiac muscle(GO:1901898) |
| 0.0 | 1.0 | GO:0009812 | flavonoid metabolic process(GO:0009812) |
| 0.0 | 0.6 | GO:0043569 | negative regulation of insulin-like growth factor receptor signaling pathway(GO:0043569) |
| 0.0 | 2.5 | GO:0048665 | neuron fate specification(GO:0048665) |
| 0.0 | 0.5 | GO:0034392 | negative regulation of smooth muscle cell apoptotic process(GO:0034392) |
| 0.0 | 2.9 | GO:0035235 | ionotropic glutamate receptor signaling pathway(GO:0035235) |
| 0.0 | 1.5 | GO:0006491 | N-glycan processing(GO:0006491) |
| 0.0 | 0.7 | GO:1902358 | sulfate transmembrane transport(GO:1902358) |
| 0.0 | 1.0 | GO:0006054 | N-acetylneuraminate metabolic process(GO:0006054) |
| 0.0 | 0.5 | GO:0051612 | negative regulation of neurotransmitter uptake(GO:0051581) regulation of serotonin uptake(GO:0051611) negative regulation of serotonin uptake(GO:0051612) |
| 0.0 | 0.2 | GO:0090206 | negative regulation of cholesterol biosynthetic process(GO:0045541) negative regulation of cholesterol metabolic process(GO:0090206) |
| 0.0 | 0.2 | GO:0007206 | phospholipase C-activating G-protein coupled glutamate receptor signaling pathway(GO:0007206) |
| 0.0 | 0.5 | GO:0097475 | motor neuron migration(GO:0097475) |
| 0.0 | 0.2 | GO:0070562 | regulation of vitamin D receptor signaling pathway(GO:0070562) |
| 0.0 | 0.7 | GO:0005513 | detection of calcium ion(GO:0005513) |
| 0.0 | 0.5 | GO:1902018 | negative regulation of cilium assembly(GO:1902018) |
| 0.0 | 0.4 | GO:0060252 | positive regulation of glial cell proliferation(GO:0060252) |
| 0.0 | 0.2 | GO:2001106 | regulation of Rho guanyl-nucleotide exchange factor activity(GO:2001106) |
| 0.0 | 3.4 | GO:1902476 | chloride transmembrane transport(GO:1902476) |
| 0.0 | 0.3 | GO:1900004 | negative regulation of serine-type endopeptidase activity(GO:1900004) negative regulation of serine-type peptidase activity(GO:1902572) |
| 0.0 | 1.1 | GO:0042462 | eye photoreceptor cell development(GO:0042462) |
| 0.0 | 0.7 | GO:0007095 | mitotic G2 DNA damage checkpoint(GO:0007095) |
| 0.0 | 0.3 | GO:0007258 | JUN phosphorylation(GO:0007258) |
| 0.0 | 1.5 | GO:0006953 | acute-phase response(GO:0006953) |
| 0.0 | 0.3 | GO:0051661 | maintenance of centrosome location(GO:0051661) |
| 0.0 | 0.1 | GO:0016584 | nucleosome positioning(GO:0016584) regulation of molecular function, epigenetic(GO:0040030) |
| 0.0 | 0.3 | GO:0042407 | cristae formation(GO:0042407) |
| 0.0 | 0.3 | GO:0060732 | positive regulation of inositol phosphate biosynthetic process(GO:0060732) |
| 0.0 | 1.1 | GO:0007190 | activation of adenylate cyclase activity(GO:0007190) |
| 0.0 | 0.3 | GO:0060159 | regulation of dopamine receptor signaling pathway(GO:0060159) |
| 0.0 | 0.2 | GO:0032876 | negative regulation of DNA endoreduplication(GO:0032876) |
| 0.0 | 1.4 | GO:0080171 | lysosome organization(GO:0007040) lytic vacuole organization(GO:0080171) |
| 0.0 | 1.1 | GO:0010107 | potassium ion import(GO:0010107) |
| 0.0 | 0.4 | GO:0051531 | NFAT protein import into nucleus(GO:0051531) |
| 0.0 | 0.4 | GO:0070933 | histone H4 deacetylation(GO:0070933) |
| 0.0 | 0.1 | GO:0007403 | glial cell fate determination(GO:0007403) fungiform papilla formation(GO:0061198) canonical Wnt signaling pathway involved in positive regulation of cardiac outflow tract cell proliferation(GO:0061324) regulation of chromatin-mediated maintenance of transcription(GO:1904499) positive regulation of chromatin-mediated maintenance of transcription(GO:1904501) regulation of euchromatin binding(GO:1904793) |
| 0.0 | 1.6 | GO:0050772 | positive regulation of axonogenesis(GO:0050772) |
| 0.0 | 0.5 | GO:0010738 | regulation of protein kinase A signaling(GO:0010738) |
| 0.0 | 0.3 | GO:0007175 | negative regulation of epidermal growth factor-activated receptor activity(GO:0007175) |
| 0.0 | 0.6 | GO:0007205 | protein kinase C-activating G-protein coupled receptor signaling pathway(GO:0007205) |
Gene overrepresentation in cellular component category:
| Log-likelihood per target | Total log-likelihood | Term | Description |
|---|---|---|---|
| 0.6 | 1.7 | GO:0032473 | cytoplasmic side of mitochondrial outer membrane(GO:0032473) caveola neck(GO:0099400) |
| 0.5 | 1.4 | GO:1990843 | subsarcolemmal mitochondrion(GO:1990843) interfibrillar mitochondrion(GO:1990844) |
| 0.4 | 2.9 | GO:0098843 | postsynaptic endocytic zone(GO:0098843) |
| 0.2 | 1.1 | GO:0005960 | glycine cleavage complex(GO:0005960) |
| 0.2 | 2.6 | GO:0005577 | fibrinogen complex(GO:0005577) |
| 0.2 | 3.8 | GO:0000812 | Swr1 complex(GO:0000812) |
| 0.1 | 0.4 | GO:0070931 | Golgi-associated vesicle lumen(GO:0070931) |
| 0.1 | 0.6 | GO:0005726 | perichromatin fibrils(GO:0005726) |
| 0.1 | 0.7 | GO:1990246 | uniplex complex(GO:1990246) |
| 0.1 | 0.7 | GO:0005786 | signal recognition particle, endoplasmic reticulum targeting(GO:0005786) |
| 0.1 | 0.3 | GO:0044307 | dendritic branch(GO:0044307) |
| 0.0 | 0.4 | GO:1990578 | perinuclear endoplasmic reticulum membrane(GO:1990578) |
| 0.0 | 0.3 | GO:0061617 | MICOS complex(GO:0061617) |
| 0.0 | 1.5 | GO:0042629 | mast cell granule(GO:0042629) |
| 0.0 | 0.6 | GO:0008074 | guanylate cyclase complex, soluble(GO:0008074) |
| 0.0 | 0.9 | GO:0000930 | gamma-tubulin complex(GO:0000930) |
| 0.0 | 0.5 | GO:0031089 | platelet dense granule lumen(GO:0031089) |
| 0.0 | 1.4 | GO:0030669 | clathrin-coated endocytic vesicle membrane(GO:0030669) |
| 0.0 | 0.2 | GO:0097433 | dense body(GO:0097433) |
| 0.0 | 2.5 | GO:0008076 | voltage-gated potassium channel complex(GO:0008076) |
| 0.0 | 0.3 | GO:0016580 | Sin3 complex(GO:0016580) |
| 0.0 | 0.1 | GO:0034750 | Scrib-APC-beta-catenin complex(GO:0034750) |
Gene overrepresentation in molecular function category:
| Log-likelihood per target | Total log-likelihood | Term | Description |
|---|---|---|---|
| 1.1 | 3.4 | GO:0008511 | sodium:potassium:chloride symporter activity(GO:0008511) |
| 0.9 | 2.7 | GO:0050528 | acyloxyacyl hydrolase activity(GO:0050528) |
| 0.6 | 1.8 | GO:0090555 | phosphatidylethanolamine-translocating ATPase activity(GO:0090555) |
| 0.6 | 1.7 | GO:0036479 | GTP-dependent protein kinase activity(GO:0034211) peroxidase inhibitor activity(GO:0036479) |
| 0.4 | 1.1 | GO:0070279 | glycine dehydrogenase (decarboxylating) activity(GO:0004375) oxidoreductase activity, acting on the CH-NH2 group of donors, disulfide as acceptor(GO:0016642) vitamin B6 binding(GO:0070279) pyridoxal binding(GO:0070280) |
| 0.3 | 1.1 | GO:0003974 | UDP-N-acetylglucosamine 4-epimerase activity(GO:0003974) UDP-glucose 4-epimerase activity(GO:0003978) |
| 0.2 | 1.5 | GO:0004918 | interleukin-8 receptor activity(GO:0004918) |
| 0.2 | 0.6 | GO:0008294 | calcium- and calmodulin-responsive adenylate cyclase activity(GO:0008294) |
| 0.2 | 2.9 | GO:0004971 | AMPA glutamate receptor activity(GO:0004971) |
| 0.2 | 1.0 | GO:0047894 | flavonol 3-sulfotransferase activity(GO:0047894) |
| 0.1 | 6.0 | GO:0008329 | signaling pattern recognition receptor activity(GO:0008329) pattern recognition receptor activity(GO:0038187) |
| 0.1 | 0.8 | GO:0042806 | fucose binding(GO:0042806) |
| 0.1 | 2.7 | GO:0003680 | AT DNA binding(GO:0003680) |
| 0.1 | 1.0 | GO:0003835 | beta-galactoside alpha-2,6-sialyltransferase activity(GO:0003835) |
| 0.1 | 0.4 | GO:0008798 | beta-aspartyl-peptidase activity(GO:0008798) |
| 0.1 | 3.5 | GO:0016805 | dipeptidase activity(GO:0016805) |
| 0.1 | 0.7 | GO:0030942 | endoplasmic reticulum signal peptide binding(GO:0030942) |
| 0.1 | 0.8 | GO:0003828 | alpha-N-acetylneuraminate alpha-2,8-sialyltransferase activity(GO:0003828) |
| 0.1 | 0.5 | GO:0060230 | lipoprotein lipase activator activity(GO:0060230) |
| 0.1 | 1.2 | GO:0050291 | sphingosine N-acyltransferase activity(GO:0050291) |
| 0.1 | 1.4 | GO:0042975 | peroxisome proliferator activated receptor binding(GO:0042975) |
| 0.1 | 0.5 | GO:0102344 | 3-hydroxy-behenoyl-CoA dehydratase activity(GO:0102344) 3-hydroxy-lignoceroyl-CoA dehydratase activity(GO:0102345) |
| 0.1 | 0.3 | GO:0004991 | parathyroid hormone receptor activity(GO:0004991) |
| 0.1 | 0.6 | GO:0034056 | estrogen response element binding(GO:0034056) |
| 0.0 | 1.1 | GO:0015467 | G-protein activated inward rectifier potassium channel activity(GO:0015467) |
| 0.0 | 3.8 | GO:0019212 | phosphatase inhibitor activity(GO:0019212) |
| 0.0 | 0.7 | GO:0008271 | secondary active sulfate transmembrane transporter activity(GO:0008271) |
| 0.0 | 0.6 | GO:0004089 | carbonate dehydratase activity(GO:0004089) |
| 0.0 | 1.1 | GO:0080025 | phosphatidylinositol-3,5-bisphosphate binding(GO:0080025) |
| 0.0 | 0.4 | GO:0046935 | 1-phosphatidylinositol-3-kinase regulator activity(GO:0046935) |
| 0.0 | 0.1 | GO:0043035 | chromatin insulator sequence binding(GO:0043035) |
| 0.0 | 1.7 | GO:0016831 | carboxy-lyase activity(GO:0016831) |
| 0.0 | 0.6 | GO:0004143 | diacylglycerol kinase activity(GO:0004143) |
| 0.0 | 0.3 | GO:0016909 | JUN kinase activity(GO:0004705) SAP kinase activity(GO:0016909) |
| 0.0 | 0.8 | GO:0034237 | protein kinase A regulatory subunit binding(GO:0034237) |
| 0.0 | 0.6 | GO:0000062 | fatty-acyl-CoA binding(GO:0000062) |
| 0.0 | 1.5 | GO:0005044 | scavenger receptor activity(GO:0005044) |
| 0.0 | 0.9 | GO:0043015 | gamma-tubulin binding(GO:0043015) |
| 0.0 | 2.6 | GO:0051087 | chaperone binding(GO:0051087) |
| 0.0 | 0.6 | GO:0017056 | structural constituent of nuclear pore(GO:0017056) |
| 0.0 | 0.7 | GO:0004435 | phosphatidylinositol phospholipase C activity(GO:0004435) |
| 0.0 | 0.7 | GO:0004709 | MAP kinase kinase kinase activity(GO:0004709) |
| 0.0 | 0.1 | GO:0005250 | A-type (transient outward) potassium channel activity(GO:0005250) |
| 0.0 | 1.0 | GO:0008200 | ion channel inhibitor activity(GO:0008200) |
| 0.0 | 0.2 | GO:0017017 | MAP kinase tyrosine/serine/threonine phosphatase activity(GO:0017017) |
| 0.0 | 0.7 | GO:0001205 | transcriptional activator activity, RNA polymerase II distal enhancer sequence-specific binding(GO:0001205) |
Gene overrepresentation in curated gene sets: canonical pathways category:
| Log-likelihood per target | Total log-likelihood | Term | Description |
|---|---|---|---|
| 0.0 | 3.0 | PID EPHRINB REV PATHWAY | Ephrin B reverse signaling |
| 0.0 | 3.0 | PID NCADHERIN PATHWAY | N-cadherin signaling events |
| 0.0 | 3.9 | PID P38 ALPHA BETA DOWNSTREAM PATHWAY | Signaling mediated by p38-alpha and p38-beta |
| 0.0 | 1.6 | ST GRANULE CELL SURVIVAL PATHWAY | Granule Cell Survival Pathway is a specific case of more general PAC1 Receptor Pathway. |
| 0.0 | 0.7 | PID ECADHERIN KERATINOCYTE PATHWAY | E-cadherin signaling in keratinocytes |
| 0.0 | 0.6 | PID LPA4 PATHWAY | LPA4-mediated signaling events |
| 0.0 | 5.1 | NABA ECM AFFILIATED | Genes encoding proteins affiliated structurally or functionally to extracellular matrix proteins |
| 0.0 | 2.2 | PID HIF1 TFPATHWAY | HIF-1-alpha transcription factor network |
| 0.0 | 0.7 | PID P38 MKK3 6PATHWAY | p38 MAPK signaling pathway |
Gene overrepresentation in curated gene sets: REACTOME pathways category:
| Log-likelihood per target | Total log-likelihood | Term | Description |
|---|---|---|---|
| 0.1 | 2.6 | REACTOME COMMON PATHWAY | Genes involved in Common Pathway |
| 0.1 | 1.7 | REACTOME TRYPTOPHAN CATABOLISM | Genes involved in Tryptophan catabolism |
| 0.1 | 1.8 | REACTOME ABACAVIR TRANSPORT AND METABOLISM | Genes involved in Abacavir transport and metabolism |
| 0.1 | 2.9 | REACTOME TRAFFICKING OF GLUR2 CONTAINING AMPA RECEPTORS | Genes involved in Trafficking of GluR2-containing AMPA receptors |
| 0.1 | 1.8 | REACTOME N GLYCAN ANTENNAE ELONGATION | Genes involved in N-Glycan antennae elongation |
| 0.1 | 3.2 | REACTOME ERK MAPK TARGETS | Genes involved in ERK/MAPK targets |
| 0.0 | 1.0 | REACTOME CYTOSOLIC SULFONATION OF SMALL MOLECULES | Genes involved in Cytosolic sulfonation of small molecules |
| 0.0 | 0.8 | REACTOME BILE SALT AND ORGANIC ANION SLC TRANSPORTERS | Genes involved in Bile salt and organic anion SLC transporters |
| 0.0 | 0.6 | REACTOME ADENYLATE CYCLASE ACTIVATING PATHWAY | Genes involved in Adenylate cyclase activating pathway |
| 0.0 | 1.4 | REACTOME CIRCADIAN REPRESSION OF EXPRESSION BY REV ERBA | Genes involved in Circadian Repression of Expression by REV-ERBA |
| 0.0 | 0.7 | REACTOME CLASS C 3 METABOTROPIC GLUTAMATE PHEROMONE RECEPTORS | Genes involved in Class C/3 (Metabotropic glutamate/pheromone receptors) |
| 0.0 | 1.2 | REACTOME SPHINGOLIPID DE NOVO BIOSYNTHESIS | Genes involved in Sphingolipid de novo biosynthesis |
| 0.0 | 1.1 | REACTOME INHIBITION OF VOLTAGE GATED CA2 CHANNELS VIA GBETA GAMMA SUBUNITS | Genes involved in Inhibition of voltage gated Ca2+ channels via Gbeta/gamma subunits |
| 0.0 | 0.6 | REACTOME NOREPINEPHRINE NEUROTRANSMITTER RELEASE CYCLE | Genes involved in Norepinephrine Neurotransmitter Release Cycle |
| 0.0 | 1.5 | REACTOME CHEMOKINE RECEPTORS BIND CHEMOKINES | Genes involved in Chemokine receptors bind chemokines |
| 0.0 | 0.9 | REACTOME SIGNALING BY FGFR1 FUSION MUTANTS | Genes involved in Signaling by FGFR1 fusion mutants |
| 0.0 | 1.4 | REACTOME VOLTAGE GATED POTASSIUM CHANNELS | Genes involved in Voltage gated Potassium channels |
| 0.0 | 3.4 | REACTOME TRANSPORT OF INORGANIC CATIONS ANIONS AND AMINO ACIDS OLIGOPEPTIDES | Genes involved in Transport of inorganic cations/anions and amino acids/oligopeptides |
| 0.0 | 0.3 | REACTOME ACTIVATION OF THE AP1 FAMILY OF TRANSCRIPTION FACTORS | Genes involved in Activation of the AP-1 family of transcription factors |
| 0.0 | 0.9 | REACTOME DARPP 32 EVENTS | Genes involved in DARPP-32 events |
| 0.0 | 0.2 | REACTOME ACYL CHAIN REMODELLING OF PS | Genes involved in Acyl chain remodelling of PS |
| 0.0 | 0.4 | REACTOME OXYGEN DEPENDENT PROLINE HYDROXYLATION OF HYPOXIA INDUCIBLE FACTOR ALPHA | Genes involved in Oxygen-dependent Proline Hydroxylation of Hypoxia-inducible Factor Alpha |
| 0.0 | 0.6 | REACTOME EFFECTS OF PIP2 HYDROLYSIS | Genes involved in Effects of PIP2 hydrolysis |