Project
Illumina Body Map 2 (GSE30611)
Navigation
Downloads
Results for MAX_TFEB
Z-value: 1.35
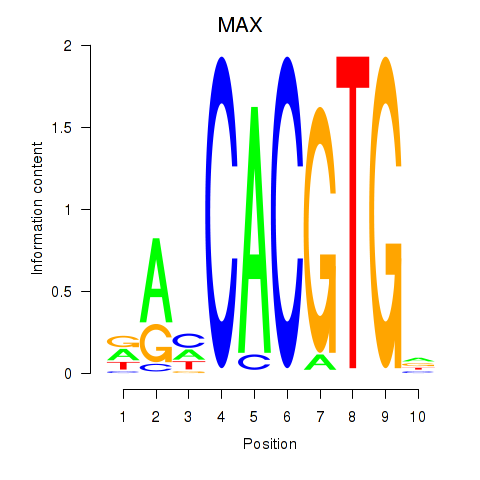
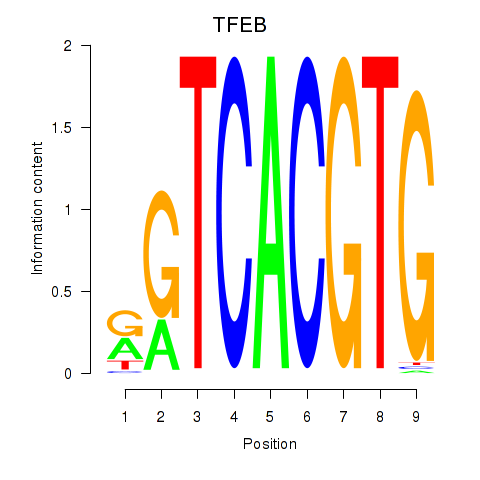
Motif logo
Transcription factors associated with MAX_TFEB
| Gene Symbol | Gene ID | Gene Info |
|---|---|---|
|
MAX
|
ENSG00000125952.20 | MYC associated factor X |
|
TFEB
|
ENSG00000112561.19 | transcription factor EB |
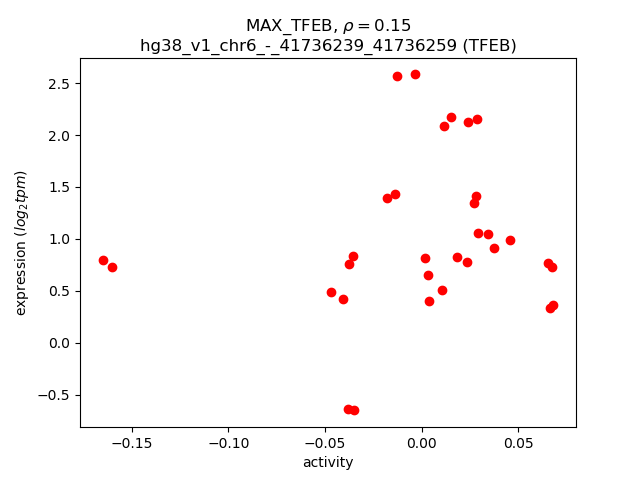
Activity-expression correlation:
| Gene | Promoter | Pearson corr. coef. | P-value | Plot |
|---|---|---|---|---|
| MAX | hg38_v1_chr14_-_65102339_65102370 | 0.50 | 3.4e-03 | Click! |
| TFEB | hg38_v1_chr6_-_41736239_41736259 | 0.15 | 4.2e-01 | Click! |
Activity profile of MAX_TFEB motif
Sorted Z-values of MAX_TFEB motif
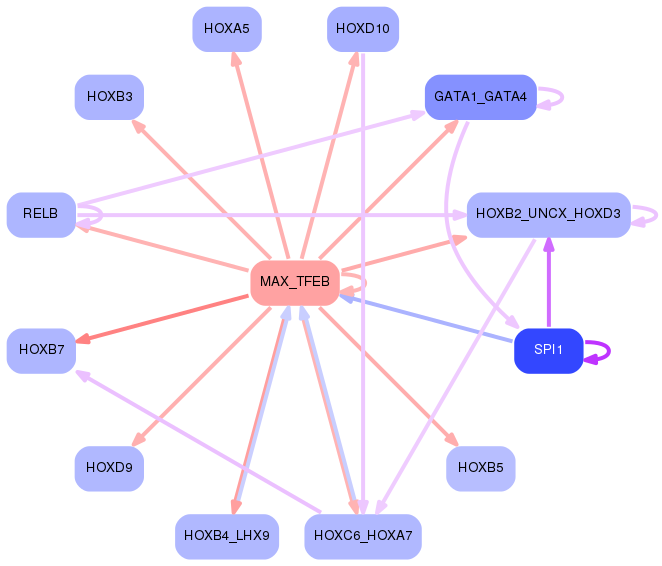
Network of associatons between targets according to the STRING database.
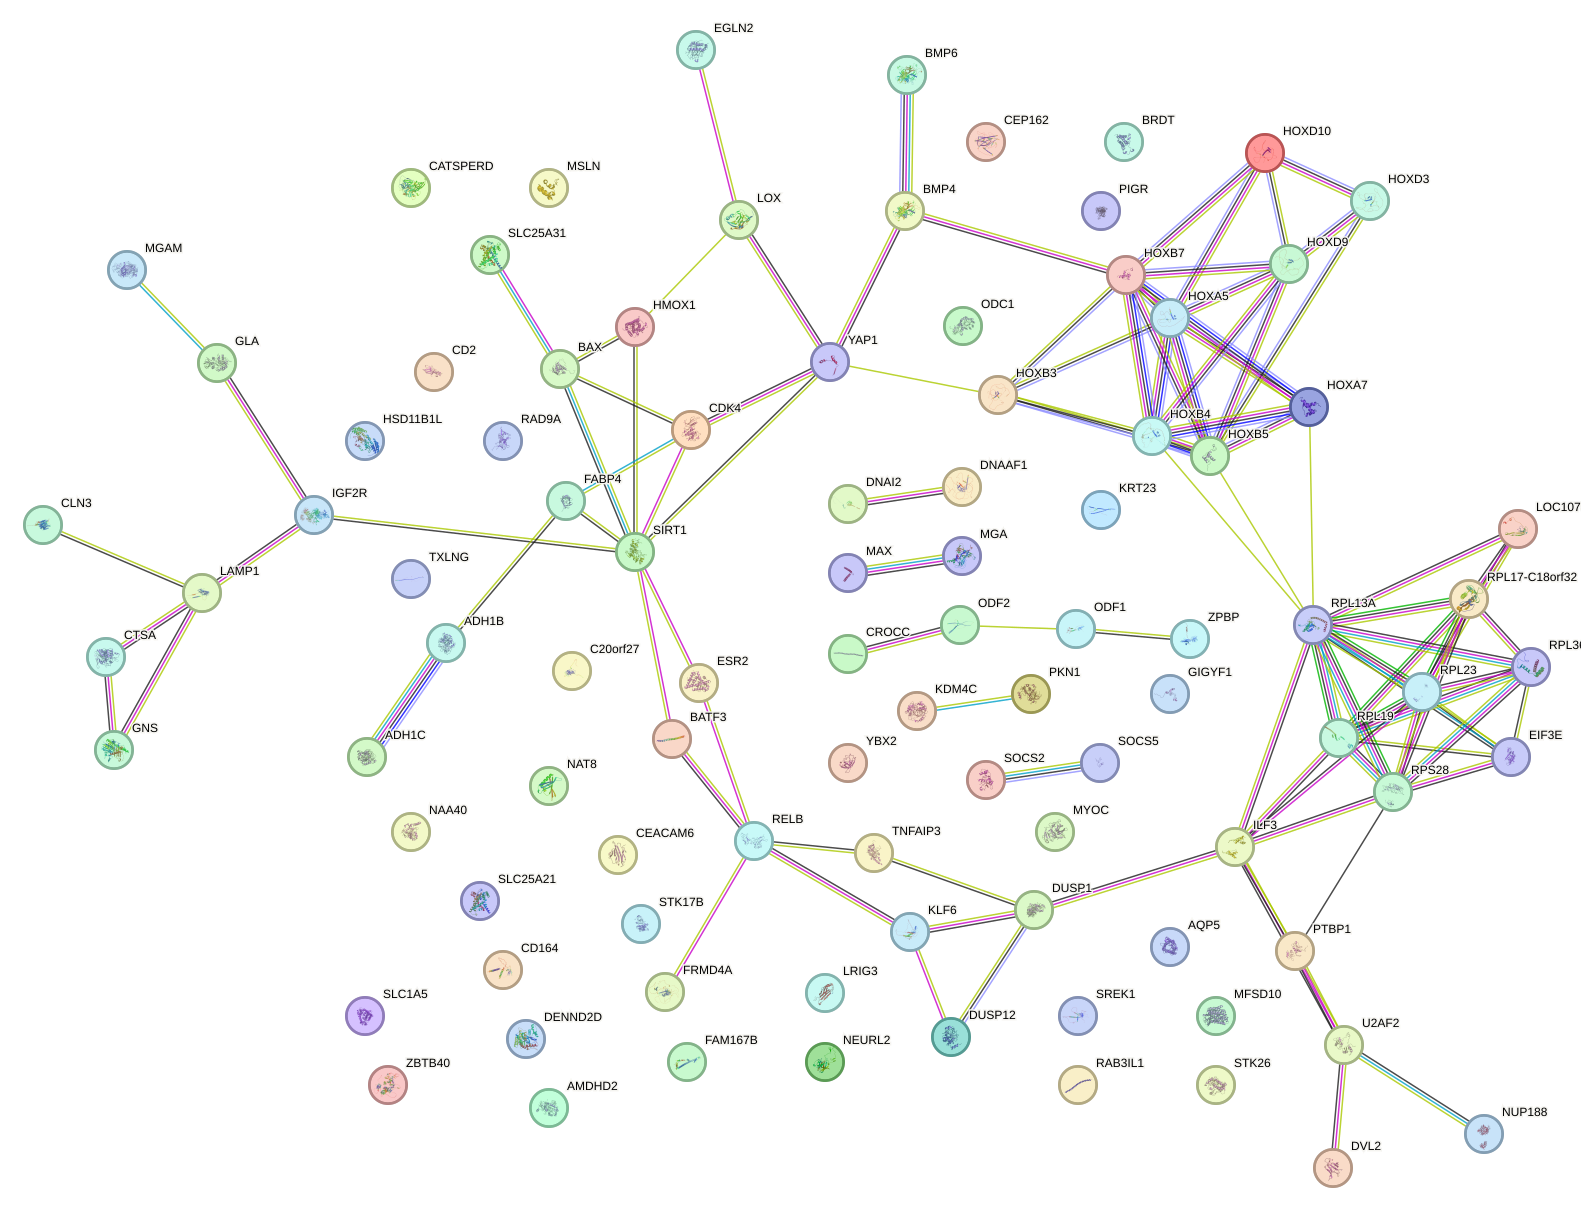
First level regulatory network of MAX_TFEB
Gene Ontology Analysis
Gene overrepresentation in biological process category:
| Log-likelihood per target | Total log-likelihood | Term | Description |
|---|---|---|---|
| 3.1 | 12.5 | GO:0022007 | neural plate elongation(GO:0014022) convergent extension involved in neural plate elongation(GO:0022007) |
| 2.7 | 8.0 | GO:1902512 | B cell selection(GO:0002339) positive regulation of apoptotic DNA fragmentation(GO:1902512) |
| 2.2 | 8.9 | GO:0034148 | regulation of toll-like receptor 5 signaling pathway(GO:0034147) negative regulation of toll-like receptor 5 signaling pathway(GO:0034148) negative regulation of nucleotide-binding oligomerization domain containing 1 signaling pathway(GO:0070429) |
| 1.9 | 19.1 | GO:1904636 | response to ionomycin(GO:1904636) cellular response to ionomycin(GO:1904637) |
| 1.8 | 1.8 | GO:0060876 | semicircular canal formation(GO:0060876) |
| 1.6 | 4.7 | GO:0043323 | regulation of natural killer cell degranulation(GO:0043321) positive regulation of natural killer cell degranulation(GO:0043323) |
| 1.5 | 4.5 | GO:0035752 | lysosomal lumen pH elevation(GO:0035752) |
| 1.3 | 3.8 | GO:0001207 | histone displacement(GO:0001207) positive regulation of transcription involved in meiotic cell cycle(GO:0051039) |
| 1.2 | 2.3 | GO:0032764 | negative regulation of mast cell cytokine production(GO:0032764) |
| 1.1 | 2.2 | GO:0002368 | B cell cytokine production(GO:0002368) |
| 1.1 | 3.2 | GO:0032053 | ciliary basal body organization(GO:0032053) |
| 1.0 | 8.9 | GO:0019262 | N-acetylneuraminate catabolic process(GO:0019262) |
| 1.0 | 12.7 | GO:1904715 | negative regulation of chaperone-mediated autophagy(GO:1904715) |
| 0.9 | 2.8 | GO:1902905 | positive regulation of fibril organization(GO:1902905) |
| 0.9 | 2.8 | GO:0002416 | IgG immunoglobulin transcytosis in epithelial cells mediated by FcRn immunoglobulin receptor(GO:0002416) |
| 0.9 | 2.7 | GO:0071962 | mitotic sister chromatid cohesion, centromeric(GO:0071962) |
| 0.9 | 7.3 | GO:0021615 | glossopharyngeal nerve morphogenesis(GO:0021615) |
| 0.9 | 2.7 | GO:0090031 | positive regulation of steroid hormone biosynthetic process(GO:0090031) |
| 0.8 | 10.0 | GO:1900113 | negative regulation of histone H3-K9 trimethylation(GO:1900113) |
| 0.8 | 2.4 | GO:0009386 | translational attenuation(GO:0009386) |
| 0.7 | 2.7 | GO:0003290 | atrial septum secundum morphogenesis(GO:0003290) embryonic heart tube anterior/posterior pattern specification(GO:0035054) |
| 0.7 | 2.7 | GO:0000738 | DNA catabolic process, exonucleolytic(GO:0000738) |
| 0.7 | 4.0 | GO:0033387 | putrescine biosynthetic process from ornithine(GO:0033387) |
| 0.7 | 2.6 | GO:0060435 | bronchiole development(GO:0060435) |
| 0.7 | 1.3 | GO:1903691 | positive regulation of wound healing, spreading of epidermal cells(GO:1903691) |
| 0.6 | 12.5 | GO:0006069 | ethanol oxidation(GO:0006069) |
| 0.6 | 3.7 | GO:0035407 | histone H3-T11 phosphorylation(GO:0035407) |
| 0.6 | 2.5 | GO:0072429 | response to intra-S DNA damage checkpoint signaling(GO:0072429) |
| 0.6 | 2.3 | GO:1903936 | cellular response to sodium arsenite(GO:1903936) |
| 0.6 | 5.2 | GO:0061484 | hematopoietic stem cell homeostasis(GO:0061484) |
| 0.6 | 4.0 | GO:0045629 | negative regulation of T-helper 2 cell differentiation(GO:0045629) |
| 0.6 | 5.0 | GO:1902231 | positive regulation of intrinsic apoptotic signaling pathway in response to DNA damage(GO:1902231) |
| 0.5 | 2.2 | GO:0014734 | skeletal muscle hypertrophy(GO:0014734) |
| 0.5 | 2.1 | GO:0032474 | otolith morphogenesis(GO:0032474) |
| 0.5 | 1.6 | GO:0002415 | immunoglobulin transcytosis in epithelial cells mediated by polymeric immunoglobulin receptor(GO:0002415) |
| 0.5 | 2.0 | GO:0006344 | maintenance of chromatin silencing(GO:0006344) |
| 0.5 | 1.5 | GO:0002940 | tRNA N2-guanine methylation(GO:0002940) |
| 0.5 | 1.9 | GO:1903803 | glutamine secretion(GO:0010585) L-glutamine import(GO:0036229) L-glutamine import into cell(GO:1903803) |
| 0.5 | 1.4 | GO:1901492 | positive regulation of lymphangiogenesis(GO:1901492) |
| 0.5 | 2.3 | GO:0007538 | primary sex determination(GO:0007538) |
| 0.5 | 4.1 | GO:0032929 | negative regulation of superoxide anion generation(GO:0032929) |
| 0.4 | 5.2 | GO:0018401 | peptidyl-proline hydroxylation to 4-hydroxy-L-proline(GO:0018401) |
| 0.4 | 1.7 | GO:0003430 | growth plate cartilage chondrocyte growth(GO:0003430) |
| 0.4 | 2.1 | GO:0061216 | BMP signaling pathway involved in heart induction(GO:0003130) endodermal-mesodermal cell signaling(GO:0003133) endodermal-mesodermal cell signaling involved in heart induction(GO:0003134) apoptotic process involved in endocardial cushion morphogenesis(GO:0003277) intermediate mesoderm morphogenesis(GO:0048390) intermediate mesoderm formation(GO:0048391) intermediate mesodermal cell differentiation(GO:0048392) regulation of cardiac muscle fiber development(GO:0055018) positive regulation of cardiac muscle fiber development(GO:0055020) bud dilation involved in lung branching(GO:0060503) BMP signaling pathway involved in ureter morphogenesis(GO:0061149) renal system segmentation(GO:0061150) BMP signaling pathway involved in renal system segmentation(GO:0061151) pulmonary artery endothelial tube morphogenesis(GO:0061155) regulation of transcription from RNA polymerase II promoter involved in mesonephros development(GO:0061216) BMP signaling pathway involved in nephric duct formation(GO:0071893) negative regulation of branch elongation involved in ureteric bud branching(GO:0072096) negative regulation of branch elongation involved in ureteric bud branching by BMP signaling pathway(GO:0072097) anterior/posterior pattern specification involved in ureteric bud development(GO:0072099) specification of ureteric bud anterior/posterior symmetry(GO:0072100) specification of ureteric bud anterior/posterior symmetry by BMP signaling pathway(GO:0072101) ureter epithelial cell differentiation(GO:0072192) negative regulation of mesenchymal cell proliferation involved in ureter development(GO:0072200) positive regulation of cell proliferation involved in outflow tract morphogenesis(GO:1901964) cardiac jelly development(GO:1905072) regulation of metanephric S-shaped body morphogenesis(GO:2000004) negative regulation of metanephric S-shaped body morphogenesis(GO:2000005) regulation of metanephric comma-shaped body morphogenesis(GO:2000006) negative regulation of metanephric comma-shaped body morphogenesis(GO:2000007) |
| 0.4 | 3.5 | GO:0001731 | formation of translation preinitiation complex(GO:0001731) |
| 0.4 | 3.1 | GO:0021769 | orbitofrontal cortex development(GO:0021769) |
| 0.4 | 1.9 | GO:0015670 | carbon dioxide transport(GO:0015670) |
| 0.4 | 1.1 | GO:0070077 | peptidyl-lysine hydroxylation to 5-hydroxy-L-lysine(GO:0018395) histone arginine demethylation(GO:0070077) histone H3-R2 demethylation(GO:0070078) histone H4-R3 demethylation(GO:0070079) |
| 0.4 | 0.7 | GO:0070318 | positive regulation of G0 to G1 transition(GO:0070318) |
| 0.4 | 0.7 | GO:1901526 | positive regulation of macromitophagy(GO:1901526) positive regulation of mitophagy in response to mitochondrial depolarization(GO:1904925) |
| 0.4 | 1.8 | GO:0008588 | release of cytoplasmic sequestered NF-kappaB(GO:0008588) |
| 0.3 | 4.2 | GO:0048539 | bone marrow development(GO:0048539) |
| 0.3 | 1.4 | GO:0043335 | protein unfolding(GO:0043335) |
| 0.3 | 2.1 | GO:0033274 | response to vitamin B2(GO:0033274) heterochromatin maintenance(GO:0070829) |
| 0.3 | 1.4 | GO:2000255 | negative regulation of male germ cell proliferation(GO:2000255) |
| 0.3 | 1.0 | GO:2000157 | regulation of protein K48-linked deubiquitination(GO:1903093) negative regulation of protein K48-linked deubiquitination(GO:1903094) negative regulation of ubiquitin-specific protease activity(GO:2000157) |
| 0.3 | 7.5 | GO:0036158 | outer dynein arm assembly(GO:0036158) |
| 0.3 | 1.7 | GO:1905000 | regulation of membrane repolarization during atrial cardiac muscle cell action potential(GO:1905000) |
| 0.3 | 1.0 | GO:0070625 | zymogen granule exocytosis(GO:0070625) |
| 0.3 | 1.3 | GO:1901895 | negative regulation of calcium-transporting ATPase activity(GO:1901895) |
| 0.3 | 1.6 | GO:0072717 | cellular response to actinomycin D(GO:0072717) |
| 0.3 | 1.0 | GO:0001827 | inner cell mass cell fate commitment(GO:0001827) inner cell mass cellular morphogenesis(GO:0001828) |
| 0.3 | 4.3 | GO:0060449 | bud elongation involved in lung branching(GO:0060449) |
| 0.3 | 2.9 | GO:0000255 | allantoin metabolic process(GO:0000255) |
| 0.3 | 1.6 | GO:2000813 | negative regulation of barbed-end actin filament capping(GO:2000813) |
| 0.3 | 1.3 | GO:0052255 | induction by symbiont of host defense response(GO:0044416) induction of host immune response by virus(GO:0046730) active induction of host immune response by virus(GO:0046732) modulation by symbiont of host defense response(GO:0052031) induction by organism of defense response of other organism involved in symbiotic interaction(GO:0052251) modulation by organism of defense response of other organism involved in symbiotic interaction(GO:0052255) positive regulation by symbiont of host defense response(GO:0052509) positive regulation by organism of defense response of other organism involved in symbiotic interaction(GO:0052510) modulation by organism of immune response of other organism involved in symbiotic interaction(GO:0052552) modulation by symbiont of host immune response(GO:0052553) modulation by virus of host immune response(GO:0075528) |
| 0.3 | 0.9 | GO:0060266 | negative regulation of respiratory burst involved in inflammatory response(GO:0060266) |
| 0.3 | 1.2 | GO:1904761 | negative regulation of myofibroblast differentiation(GO:1904761) |
| 0.3 | 0.9 | GO:0070309 | lens fiber cell morphogenesis(GO:0070309) |
| 0.3 | 1.2 | GO:0018106 | peptidyl-histidine phosphorylation(GO:0018106) |
| 0.3 | 0.6 | GO:0032227 | negative regulation of synaptic transmission, dopaminergic(GO:0032227) |
| 0.3 | 0.9 | GO:0060730 | regulation of intestinal epithelial structure maintenance(GO:0060730) |
| 0.3 | 1.2 | GO:0030576 | Cajal body organization(GO:0030576) |
| 0.3 | 1.4 | GO:0051142 | regulation of NK T cell proliferation(GO:0051140) positive regulation of NK T cell proliferation(GO:0051142) |
| 0.3 | 1.7 | GO:0060010 | Sertoli cell fate commitment(GO:0060010) |
| 0.3 | 2.5 | GO:1905247 | positive regulation of aspartic-type endopeptidase activity involved in amyloid precursor protein catabolic process(GO:1902961) positive regulation of aspartic-type peptidase activity(GO:1905247) |
| 0.3 | 1.1 | GO:0006014 | D-ribose metabolic process(GO:0006014) |
| 0.3 | 1.4 | GO:0000415 | negative regulation of histone H3-K36 methylation(GO:0000415) |
| 0.3 | 0.8 | GO:0036388 | pre-replicative complex assembly involved in nuclear cell cycle DNA replication(GO:0006267) pre-replicative complex assembly(GO:0036388) pre-replicative complex assembly involved in cell cycle DNA replication(GO:1902299) |
| 0.3 | 6.0 | GO:0075522 | IRES-dependent viral translational initiation(GO:0075522) |
| 0.3 | 1.1 | GO:0000711 | meiotic DNA repair synthesis(GO:0000711) |
| 0.3 | 4.3 | GO:2000628 | regulation of miRNA metabolic process(GO:2000628) |
| 0.3 | 1.9 | GO:0060335 | positive regulation of response to interferon-gamma(GO:0060332) positive regulation of interferon-gamma-mediated signaling pathway(GO:0060335) |
| 0.3 | 2.3 | GO:0045617 | negative regulation of keratinocyte differentiation(GO:0045617) |
| 0.3 | 0.5 | GO:0002032 | desensitization of G-protein coupled receptor protein signaling pathway by arrestin(GO:0002032) |
| 0.3 | 1.0 | GO:0002086 | diaphragm contraction(GO:0002086) |
| 0.3 | 0.5 | GO:0044026 | DNA hypermethylation(GO:0044026) |
| 0.3 | 0.8 | GO:1903674 | regulation of cap-dependent translational initiation(GO:1903674) positive regulation of cap-dependent translational initiation(GO:1903676) |
| 0.3 | 1.5 | GO:0060800 | regulation of cell differentiation involved in embryonic placenta development(GO:0060800) |
| 0.3 | 1.8 | GO:0061113 | pancreas morphogenesis(GO:0061113) |
| 0.2 | 0.7 | GO:0002949 | tRNA threonylcarbamoyladenosine modification(GO:0002949) |
| 0.2 | 0.7 | GO:0060279 | positive regulation of ovulation(GO:0060279) |
| 0.2 | 3.7 | GO:0035826 | rubidium ion transport(GO:0035826) regulation of rubidium ion transport(GO:2000680) |
| 0.2 | 1.2 | GO:0050902 | leukocyte adhesive activation(GO:0050902) |
| 0.2 | 6.9 | GO:0090190 | positive regulation of branching involved in ureteric bud morphogenesis(GO:0090190) |
| 0.2 | 0.7 | GO:0034471 | endonucleolytic cleavage to generate mature 5'-end of SSU-rRNA from (SSU-rRNA, 5.8S rRNA, LSU-rRNA)(GO:0000472) rRNA 5'-end processing(GO:0000967) ncRNA 5'-end processing(GO:0034471) |
| 0.2 | 1.4 | GO:0071400 | cellular response to oleic acid(GO:0071400) |
| 0.2 | 0.5 | GO:0061055 | myotome development(GO:0061055) |
| 0.2 | 2.8 | GO:0010739 | positive regulation of protein kinase A signaling(GO:0010739) |
| 0.2 | 0.7 | GO:1904247 | positive regulation of polynucleotide adenylyltransferase activity(GO:1904247) |
| 0.2 | 0.5 | GO:0009405 | pathogenesis(GO:0009405) |
| 0.2 | 1.8 | GO:2000048 | negative regulation of cell-cell adhesion mediated by cadherin(GO:2000048) |
| 0.2 | 0.7 | GO:0045553 | TRAIL biosynthetic process(GO:0045553) regulation of TRAIL biosynthetic process(GO:0045554) positive regulation of TRAIL biosynthetic process(GO:0045556) |
| 0.2 | 2.4 | GO:1904327 | protein localization to cytosolic proteasome complex(GO:1904327) protein localization to cytosolic proteasome complex involved in ERAD pathway(GO:1904379) |
| 0.2 | 1.1 | GO:0014886 | transition between slow and fast fiber(GO:0014886) |
| 0.2 | 0.7 | GO:0046108 | uridine metabolic process(GO:0046108) |
| 0.2 | 5.9 | GO:0048934 | peripheral nervous system neuron differentiation(GO:0048934) peripheral nervous system neuron development(GO:0048935) |
| 0.2 | 0.9 | GO:0010587 | miRNA catabolic process(GO:0010587) |
| 0.2 | 2.2 | GO:0030885 | regulation of myeloid dendritic cell activation(GO:0030885) |
| 0.2 | 1.9 | GO:0045039 | protein import into mitochondrial inner membrane(GO:0045039) |
| 0.2 | 1.3 | GO:0010609 | mRNA localization resulting in posttranscriptional regulation of gene expression(GO:0010609) |
| 0.2 | 0.6 | GO:0060086 | circadian temperature homeostasis(GO:0060086) |
| 0.2 | 33.3 | GO:0006614 | SRP-dependent cotranslational protein targeting to membrane(GO:0006614) |
| 0.2 | 2.1 | GO:0016139 | glycoside catabolic process(GO:0016139) |
| 0.2 | 5.1 | GO:0040015 | negative regulation of multicellular organism growth(GO:0040015) |
| 0.2 | 0.6 | GO:2000656 | regulation of apolipoprotein binding(GO:2000656) negative regulation of apolipoprotein binding(GO:2000657) |
| 0.2 | 0.6 | GO:1903774 | positive regulation of viral budding via host ESCRT complex(GO:1903774) |
| 0.2 | 1.4 | GO:0016321 | female meiosis chromosome segregation(GO:0016321) |
| 0.2 | 1.4 | GO:0042986 | positive regulation of amyloid precursor protein biosynthetic process(GO:0042986) |
| 0.2 | 2.6 | GO:0006268 | DNA unwinding involved in DNA replication(GO:0006268) |
| 0.2 | 1.7 | GO:0046465 | dolichyl diphosphate biosynthetic process(GO:0006489) dolichyl diphosphate metabolic process(GO:0046465) |
| 0.2 | 2.7 | GO:2000271 | positive regulation of fibroblast apoptotic process(GO:2000271) |
| 0.2 | 1.3 | GO:0060023 | soft palate development(GO:0060023) |
| 0.2 | 1.8 | GO:0071557 | histone H3-K27 demethylation(GO:0071557) |
| 0.2 | 3.1 | GO:2000781 | positive regulation of double-strand break repair(GO:2000781) |
| 0.2 | 0.7 | GO:0002501 | peptide antigen assembly with MHC protein complex(GO:0002501) |
| 0.2 | 0.4 | GO:0006620 | posttranslational protein targeting to membrane(GO:0006620) |
| 0.2 | 1.0 | GO:0015680 | intracellular copper ion transport(GO:0015680) |
| 0.2 | 0.9 | GO:0046963 | 3'-phosphoadenosine 5'-phosphosulfate transport(GO:0046963) 3'-phospho-5'-adenylyl sulfate transmembrane transport(GO:1902559) |
| 0.2 | 1.2 | GO:2000769 | regulation of unidimensional cell growth(GO:0051510) negative regulation of unidimensional cell growth(GO:0051511) establishment of cell polarity regulating cell shape(GO:0071964) regulation of establishment or maintenance of cell polarity regulating cell shape(GO:2000769) positive regulation of establishment or maintenance of cell polarity regulating cell shape(GO:2000771) regulation of establishment of cell polarity regulating cell shape(GO:2000782) positive regulation of establishment of cell polarity regulating cell shape(GO:2000784) positive regulation of barbed-end actin filament capping(GO:2000814) |
| 0.2 | 1.0 | GO:2000857 | positive regulation of mineralocorticoid secretion(GO:2000857) positive regulation of aldosterone secretion(GO:2000860) |
| 0.2 | 1.2 | GO:0042796 | snRNA transcription from RNA polymerase III promoter(GO:0042796) |
| 0.2 | 0.7 | GO:0032599 | B cell receptor transport within lipid bilayer(GO:0032595) B cell receptor transport into membrane raft(GO:0032597) protein transport out of membrane raft(GO:0032599) chemokine receptor transport out of membrane raft(GO:0032600) negative regulation of transforming growth factor beta3 production(GO:0032913) chemokine receptor transport within lipid bilayer(GO:0033606) |
| 0.2 | 1.5 | GO:0070164 | negative regulation of adiponectin secretion(GO:0070164) |
| 0.2 | 1.5 | GO:0090116 | C-5 methylation of cytosine(GO:0090116) |
| 0.2 | 1.0 | GO:1904383 | response to sodium phosphate(GO:1904383) |
| 0.2 | 3.9 | GO:1903504 | regulation of mitotic cell cycle spindle assembly checkpoint(GO:0090266) regulation of mitotic spindle checkpoint(GO:1903504) |
| 0.2 | 10.5 | GO:0048009 | insulin-like growth factor receptor signaling pathway(GO:0048009) |
| 0.2 | 1.6 | GO:1902416 | positive regulation of mRNA binding(GO:1902416) |
| 0.2 | 4.0 | GO:0003376 | sphingosine-1-phosphate signaling pathway(GO:0003376) |
| 0.2 | 2.6 | GO:0043117 | positive regulation of vascular permeability(GO:0043117) |
| 0.2 | 2.1 | GO:1904714 | regulation of chaperone-mediated autophagy(GO:1904714) |
| 0.2 | 2.4 | GO:0006564 | L-serine biosynthetic process(GO:0006564) |
| 0.2 | 0.6 | GO:0033634 | positive regulation of cell-cell adhesion mediated by integrin(GO:0033634) |
| 0.2 | 0.6 | GO:0071169 | establishment of protein localization to chromatin(GO:0071169) |
| 0.1 | 0.6 | GO:0035470 | positive regulation of vascular wound healing(GO:0035470) |
| 0.1 | 1.9 | GO:1903608 | protein localization to cytoplasmic stress granule(GO:1903608) |
| 0.1 | 1.6 | GO:0006335 | DNA replication-dependent nucleosome assembly(GO:0006335) DNA replication-dependent nucleosome organization(GO:0034723) |
| 0.1 | 3.3 | GO:0006474 | N-terminal protein amino acid acetylation(GO:0006474) |
| 0.1 | 2.7 | GO:0071285 | cellular response to lithium ion(GO:0071285) |
| 0.1 | 0.9 | GO:0030200 | heparan sulfate proteoglycan catabolic process(GO:0030200) |
| 0.1 | 0.4 | GO:1901857 | positive regulation of cellular respiration(GO:1901857) |
| 0.1 | 0.7 | GO:0050428 | purine ribonucleoside bisphosphate biosynthetic process(GO:0034036) 3'-phosphoadenosine 5'-phosphosulfate biosynthetic process(GO:0050428) |
| 0.1 | 1.8 | GO:0043587 | tongue morphogenesis(GO:0043587) |
| 0.1 | 0.4 | GO:0097698 | telomere maintenance via base-excision repair(GO:0097698) |
| 0.1 | 2.9 | GO:0042340 | keratan sulfate catabolic process(GO:0042340) |
| 0.1 | 1.0 | GO:0051533 | positive regulation of NFAT protein import into nucleus(GO:0051533) |
| 0.1 | 1.8 | GO:0043985 | histone H4-R3 methylation(GO:0043985) |
| 0.1 | 3.5 | GO:1902894 | negative regulation of pri-miRNA transcription from RNA polymerase II promoter(GO:1902894) |
| 0.1 | 0.4 | GO:0060766 | negative regulation of androgen receptor signaling pathway(GO:0060766) |
| 0.1 | 0.5 | GO:0046833 | positive regulation of RNA export from nucleus(GO:0046833) |
| 0.1 | 0.7 | GO:0042360 | vitamin E metabolic process(GO:0042360) |
| 0.1 | 0.7 | GO:0015691 | cadmium ion transport(GO:0015691) cadmium ion transmembrane transport(GO:0070574) |
| 0.1 | 0.3 | GO:0071816 | tail-anchored membrane protein insertion into ER membrane(GO:0071816) |
| 0.1 | 0.7 | GO:2000174 | regulation of pro-T cell differentiation(GO:2000174) positive regulation of pro-T cell differentiation(GO:2000176) |
| 0.1 | 1.3 | GO:0045716 | positive regulation of low-density lipoprotein particle receptor biosynthetic process(GO:0045716) |
| 0.1 | 14.5 | GO:0045071 | negative regulation of viral genome replication(GO:0045071) |
| 0.1 | 0.9 | GO:0006613 | cotranslational protein targeting to membrane(GO:0006613) |
| 0.1 | 2.1 | GO:0035721 | intraciliary retrograde transport(GO:0035721) |
| 0.1 | 4.8 | GO:0000185 | activation of MAPKKK activity(GO:0000185) |
| 0.1 | 0.8 | GO:0071899 | regulation of estrogen receptor binding(GO:0071898) negative regulation of estrogen receptor binding(GO:0071899) |
| 0.1 | 1.0 | GO:0018206 | peptidyl-methionine modification(GO:0018206) |
| 0.1 | 1.9 | GO:0031584 | activation of phospholipase D activity(GO:0031584) |
| 0.1 | 1.2 | GO:0051151 | negative regulation of smooth muscle cell differentiation(GO:0051151) |
| 0.1 | 0.6 | GO:0006420 | arginyl-tRNA aminoacylation(GO:0006420) |
| 0.1 | 1.1 | GO:0015760 | hexose phosphate transport(GO:0015712) glucose-6-phosphate transport(GO:0015760) |
| 0.1 | 0.6 | GO:0050893 | sensory processing(GO:0050893) |
| 0.1 | 0.7 | GO:0051987 | positive regulation of attachment of spindle microtubules to kinetochore(GO:0051987) |
| 0.1 | 4.4 | GO:0043011 | myeloid dendritic cell differentiation(GO:0043011) |
| 0.1 | 1.1 | GO:0097338 | response to clozapine(GO:0097338) |
| 0.1 | 0.3 | GO:0001188 | RNA polymerase I transcriptional preinitiation complex assembly(GO:0001188) RNA polymerase I transcriptional preinitiation complex assembly at the promoter for the nuclear large rRNA transcript(GO:0001189) |
| 0.1 | 1.1 | GO:0043129 | surfactant homeostasis(GO:0043129) |
| 0.1 | 0.9 | GO:0061767 | evasion or tolerance of host defenses by virus(GO:0019049) avoidance of host defenses(GO:0044413) evasion or tolerance of host defenses(GO:0044415) avoidance of defenses of other organism involved in symbiotic interaction(GO:0051832) evasion or tolerance of defenses of other organism involved in symbiotic interaction(GO:0051834) negative regulation of lung blood pressure(GO:0061767) |
| 0.1 | 7.8 | GO:0010501 | RNA secondary structure unwinding(GO:0010501) |
| 0.1 | 0.3 | GO:0002101 | tRNA wobble cytosine modification(GO:0002101) |
| 0.1 | 1.3 | GO:0050847 | progesterone receptor signaling pathway(GO:0050847) |
| 0.1 | 0.3 | GO:1902544 | regulation of DNA N-glycosylase activity(GO:1902544) |
| 0.1 | 0.7 | GO:0045836 | positive regulation of meiotic nuclear division(GO:0045836) |
| 0.1 | 2.6 | GO:0000027 | ribosomal large subunit assembly(GO:0000027) |
| 0.1 | 1.3 | GO:0098582 | innate vocalization behavior(GO:0098582) |
| 0.1 | 1.1 | GO:0031022 | nuclear migration along microfilament(GO:0031022) |
| 0.1 | 0.5 | GO:1902499 | positive regulation of protein autoubiquitination(GO:1902499) |
| 0.1 | 0.6 | GO:1900224 | positive regulation of nodal signaling pathway involved in determination of lateral mesoderm left/right asymmetry(GO:1900224) |
| 0.1 | 0.7 | GO:0044565 | dendritic cell proliferation(GO:0044565) |
| 0.1 | 1.8 | GO:0002726 | positive regulation of T cell cytokine production(GO:0002726) |
| 0.1 | 0.3 | GO:0098905 | regulation of bundle of His cell action potential(GO:0098905) |
| 0.1 | 1.3 | GO:0006824 | cobalt ion transport(GO:0006824) |
| 0.1 | 1.3 | GO:0048251 | elastic fiber assembly(GO:0048251) |
| 0.1 | 1.1 | GO:0007288 | sperm axoneme assembly(GO:0007288) |
| 0.1 | 0.3 | GO:1903033 | regulation of microtubule plus-end binding(GO:1903031) positive regulation of microtubule plus-end binding(GO:1903033) |
| 0.1 | 0.5 | GO:2000110 | negative regulation of macrophage apoptotic process(GO:2000110) |
| 0.1 | 0.3 | GO:0042256 | mature ribosome assembly(GO:0042256) |
| 0.1 | 1.7 | GO:0046548 | retinal rod cell development(GO:0046548) |
| 0.1 | 0.3 | GO:0001831 | trophectodermal cellular morphogenesis(GO:0001831) |
| 0.1 | 1.1 | GO:0021637 | trigeminal nerve morphogenesis(GO:0021636) trigeminal nerve structural organization(GO:0021637) semaphorin-plexin signaling pathway involved in axon guidance(GO:1902287) |
| 0.1 | 1.8 | GO:0043508 | negative regulation of JUN kinase activity(GO:0043508) |
| 0.1 | 2.3 | GO:1900115 | extracellular regulation of signal transduction(GO:1900115) extracellular negative regulation of signal transduction(GO:1900116) |
| 0.1 | 0.9 | GO:0040016 | embryonic cleavage(GO:0040016) |
| 0.1 | 0.3 | GO:0016340 | calcium-dependent cell-matrix adhesion(GO:0016340) |
| 0.1 | 0.4 | GO:0060528 | secretory columnal luminar epithelial cell differentiation involved in prostate glandular acinus development(GO:0060528) |
| 0.1 | 2.4 | GO:0070734 | histone H3-K27 methylation(GO:0070734) |
| 0.1 | 0.3 | GO:1901388 | regulation of transforming growth factor beta activation(GO:1901388) negative regulation of transforming growth factor beta activation(GO:1901389) |
| 0.1 | 0.6 | GO:0007221 | positive regulation of transcription of Notch receptor target(GO:0007221) |
| 0.1 | 1.2 | GO:2000253 | positive regulation of feeding behavior(GO:2000253) |
| 0.1 | 0.3 | GO:0046379 | extracellular polysaccharide biosynthetic process(GO:0045226) extracellular polysaccharide metabolic process(GO:0046379) |
| 0.1 | 3.6 | GO:0009303 | rRNA transcription(GO:0009303) |
| 0.1 | 1.8 | GO:2000574 | regulation of microtubule motor activity(GO:2000574) |
| 0.1 | 1.8 | GO:0060441 | epithelial tube branching involved in lung morphogenesis(GO:0060441) |
| 0.1 | 0.2 | GO:0072711 | cellular response to hydroxyurea(GO:0072711) |
| 0.1 | 0.1 | GO:0072387 | flavin adenine dinucleotide metabolic process(GO:0072387) |
| 0.1 | 0.3 | GO:1905150 | regulation of voltage-gated sodium channel activity(GO:1905150) |
| 0.1 | 0.5 | GO:0044339 | canonical Wnt signaling pathway involved in osteoblast differentiation(GO:0044339) |
| 0.1 | 2.7 | GO:0006491 | N-glycan processing(GO:0006491) |
| 0.1 | 2.8 | GO:0048025 | negative regulation of mRNA splicing, via spliceosome(GO:0048025) |
| 0.1 | 0.6 | GO:2000348 | regulation of CD40 signaling pathway(GO:2000348) |
| 0.1 | 0.5 | GO:0003214 | cardiac left ventricle morphogenesis(GO:0003214) |
| 0.1 | 2.9 | GO:0046329 | negative regulation of JNK cascade(GO:0046329) |
| 0.1 | 0.2 | GO:0045875 | negative regulation of sister chromatid cohesion(GO:0045875) |
| 0.1 | 0.5 | GO:2000909 | regulation of cholesterol import(GO:0060620) regulation of sterol import(GO:2000909) |
| 0.1 | 0.9 | GO:2000047 | regulation of cell-cell adhesion mediated by cadherin(GO:2000047) |
| 0.1 | 1.2 | GO:0006488 | dolichol-linked oligosaccharide biosynthetic process(GO:0006488) |
| 0.1 | 0.2 | GO:0007309 | oocyte construction(GO:0007308) oocyte axis specification(GO:0007309) oocyte anterior/posterior axis specification(GO:0007314) pole plasm assembly(GO:0007315) maternal determination of anterior/posterior axis, embryo(GO:0008358) P granule organization(GO:0030719) |
| 0.1 | 1.6 | GO:0006068 | ethanol catabolic process(GO:0006068) |
| 0.1 | 2.2 | GO:0042118 | endothelial cell activation(GO:0042118) |
| 0.1 | 0.4 | GO:0030037 | actin filament reorganization involved in cell cycle(GO:0030037) |
| 0.1 | 4.2 | GO:0000381 | regulation of alternative mRNA splicing, via spliceosome(GO:0000381) |
| 0.1 | 0.4 | GO:1904491 | protein localization to ciliary transition zone(GO:1904491) |
| 0.1 | 0.4 | GO:0038112 | interleukin-8-mediated signaling pathway(GO:0038112) |
| 0.1 | 3.1 | GO:0045987 | positive regulation of smooth muscle contraction(GO:0045987) |
| 0.1 | 1.7 | GO:0070233 | negative regulation of T cell apoptotic process(GO:0070233) |
| 0.1 | 0.2 | GO:0060526 | prostate glandular acinus morphogenesis(GO:0060526) prostate epithelial cord arborization involved in prostate glandular acinus morphogenesis(GO:0060527) |
| 0.1 | 3.9 | GO:0071431 | tRNA export from nucleus(GO:0006409) tRNA-containing ribonucleoprotein complex export from nucleus(GO:0071431) |
| 0.1 | 0.4 | GO:0022027 | interkinetic nuclear migration(GO:0022027) |
| 0.1 | 2.0 | GO:0003334 | keratinocyte development(GO:0003334) |
| 0.1 | 0.3 | GO:0090611 | assembly of actomyosin apparatus involved in cytokinesis(GO:0000912) actomyosin contractile ring assembly(GO:0000915) actomyosin contractile ring organization(GO:0044837) ubiquitin-independent protein catabolic process via the multivesicular body sorting pathway(GO:0090611) |
| 0.1 | 1.2 | GO:2000615 | regulation of histone H3-K9 acetylation(GO:2000615) |
| 0.1 | 0.1 | GO:0097167 | circadian regulation of translation(GO:0097167) |
| 0.1 | 1.5 | GO:0060575 | intestinal epithelial cell differentiation(GO:0060575) |
| 0.1 | 0.3 | GO:0090135 | actin filament branching(GO:0090135) protein localization to cell leading edge(GO:1902463) |
| 0.1 | 1.5 | GO:0032025 | response to cobalt ion(GO:0032025) |
| 0.1 | 1.2 | GO:0001542 | ovulation from ovarian follicle(GO:0001542) |
| 0.1 | 1.2 | GO:0044341 | sodium-dependent phosphate transport(GO:0044341) |
| 0.1 | 1.6 | GO:0016254 | preassembly of GPI anchor in ER membrane(GO:0016254) |
| 0.1 | 4.5 | GO:0035036 | sperm-egg recognition(GO:0035036) |
| 0.1 | 1.7 | GO:1900363 | regulation of mRNA polyadenylation(GO:1900363) |
| 0.1 | 0.8 | GO:0090161 | Golgi ribbon formation(GO:0090161) |
| 0.1 | 1.3 | GO:0032968 | positive regulation of transcription elongation from RNA polymerase II promoter(GO:0032968) |
| 0.1 | 6.2 | GO:0007157 | heterophilic cell-cell adhesion via plasma membrane cell adhesion molecules(GO:0007157) |
| 0.1 | 0.3 | GO:0002725 | negative regulation of T cell cytokine production(GO:0002725) |
| 0.1 | 0.9 | GO:2000427 | positive regulation of apoptotic cell clearance(GO:2000427) |
| 0.1 | 0.1 | GO:0032258 | CVT pathway(GO:0032258) |
| 0.1 | 0.6 | GO:0072553 | terminal button organization(GO:0072553) |
| 0.1 | 0.3 | GO:0072366 | positive regulation of gluconeogenesis by positive regulation of transcription from RNA polymerase II promoter(GO:0035948) regulation of cellular ketone metabolic process by positive regulation of transcription from RNA polymerase II promoter(GO:0072366) |
| 0.1 | 0.2 | GO:0044205 | 'de novo' UMP biosynthetic process(GO:0044205) |
| 0.1 | 1.2 | GO:0042908 | xenobiotic transport(GO:0042908) |
| 0.1 | 3.3 | GO:0090162 | establishment of epithelial cell polarity(GO:0090162) |
| 0.1 | 2.1 | GO:0045898 | regulation of RNA polymerase II transcriptional preinitiation complex assembly(GO:0045898) |
| 0.1 | 0.4 | GO:2000676 | positive regulation of type B pancreatic cell apoptotic process(GO:2000676) |
| 0.1 | 1.0 | GO:2000643 | positive regulation of early endosome to late endosome transport(GO:2000643) |
| 0.1 | 0.4 | GO:0000395 | mRNA 5'-splice site recognition(GO:0000395) |
| 0.1 | 0.2 | GO:0006043 | glucosamine catabolic process(GO:0006043) |
| 0.1 | 0.8 | GO:0051388 | positive regulation of neurotrophin TRK receptor signaling pathway(GO:0051388) |
| 0.1 | 0.3 | GO:0030961 | peptidyl-arginine hydroxylation(GO:0030961) |
| 0.1 | 0.7 | GO:0040033 | miRNA mediated inhibition of translation(GO:0035278) negative regulation of translation, ncRNA-mediated(GO:0040033) regulation of translation, ncRNA-mediated(GO:0045974) |
| 0.1 | 1.6 | GO:0051123 | RNA polymerase II transcriptional preinitiation complex assembly(GO:0051123) |
| 0.1 | 2.4 | GO:1901998 | toxin transport(GO:1901998) |
| 0.1 | 0.2 | GO:2000819 | regulation of nucleotide-excision repair(GO:2000819) |
| 0.1 | 0.3 | GO:0007549 | dosage compensation(GO:0007549) dosage compensation by inactivation of X chromosome(GO:0009048) |
| 0.1 | 0.1 | GO:1903862 | positive regulation of oxidative phosphorylation(GO:1903862) |
| 0.1 | 0.3 | GO:0003366 | cell-matrix adhesion involved in ameboidal cell migration(GO:0003366) |
| 0.1 | 0.8 | GO:0099515 | actin filament-based transport(GO:0099515) |
| 0.1 | 0.5 | GO:0060272 | embryonic skeletal joint morphogenesis(GO:0060272) |
| 0.1 | 0.2 | GO:0015744 | succinate transport(GO:0015744) succinate transmembrane transport(GO:0071422) |
| 0.1 | 3.0 | GO:0010862 | positive regulation of pathway-restricted SMAD protein phosphorylation(GO:0010862) |
| 0.1 | 0.3 | GO:1903232 | melanosome assembly(GO:1903232) |
| 0.1 | 0.4 | GO:0051798 | positive regulation of hair follicle development(GO:0051798) |
| 0.1 | 0.3 | GO:1902361 | mitochondrial pyruvate transport(GO:0006850) mitochondrial pyruvate transmembrane transport(GO:1902361) |
| 0.1 | 0.7 | GO:0061088 | regulation of sequestering of zinc ion(GO:0061088) |
| 0.1 | 2.1 | GO:0005980 | glycogen catabolic process(GO:0005980) |
| 0.1 | 0.8 | GO:0035269 | protein O-linked mannosylation(GO:0035269) |
| 0.1 | 0.2 | GO:0048318 | axial mesoderm development(GO:0048318) |
| 0.0 | 0.8 | GO:0070208 | protein heterotrimerization(GO:0070208) |
| 0.0 | 1.4 | GO:0030322 | stabilization of membrane potential(GO:0030322) |
| 0.0 | 1.3 | GO:0007064 | mitotic sister chromatid cohesion(GO:0007064) |
| 0.0 | 0.9 | GO:0016226 | iron-sulfur cluster assembly(GO:0016226) metallo-sulfur cluster assembly(GO:0031163) |
| 0.0 | 0.2 | GO:2000298 | regulation of Rho-dependent protein serine/threonine kinase activity(GO:2000298) |
| 0.0 | 0.2 | GO:0051088 | regulation of T cell chemotaxis(GO:0010819) positive regulation of T cell chemotaxis(GO:0010820) PMA-inducible membrane protein ectodomain proteolysis(GO:0051088) |
| 0.0 | 0.3 | GO:0080182 | histone H3-K4 trimethylation(GO:0080182) |
| 0.0 | 0.5 | GO:0000380 | alternative mRNA splicing, via spliceosome(GO:0000380) |
| 0.0 | 0.7 | GO:0045008 | depyrimidination(GO:0045008) |
| 0.0 | 0.6 | GO:0015014 | protein sulfation(GO:0006477) heparan sulfate proteoglycan biosynthetic process, polysaccharide chain biosynthetic process(GO:0015014) |
| 0.0 | 0.4 | GO:0045905 | translational frameshifting(GO:0006452) positive regulation of translational termination(GO:0045905) |
| 0.0 | 0.5 | GO:0018094 | protein polyglycylation(GO:0018094) |
| 0.0 | 0.3 | GO:0070358 | actin polymerization-dependent cell motility(GO:0070358) |
| 0.0 | 1.8 | GO:0000387 | spliceosomal snRNP assembly(GO:0000387) |
| 0.0 | 1.8 | GO:0000083 | regulation of transcription involved in G1/S transition of mitotic cell cycle(GO:0000083) |
| 0.0 | 0.9 | GO:0042276 | error-prone translesion synthesis(GO:0042276) |
| 0.0 | 0.2 | GO:0044313 | protein K6-linked deubiquitination(GO:0044313) |
| 0.0 | 0.1 | GO:0035964 | COPI-coated vesicle budding(GO:0035964) Golgi transport vesicle coating(GO:0048200) COPI coating of Golgi vesicle(GO:0048205) |
| 0.0 | 1.6 | GO:0030517 | negative regulation of axon extension(GO:0030517) |
| 0.0 | 0.5 | GO:0051457 | maintenance of protein location in nucleus(GO:0051457) |
| 0.0 | 0.5 | GO:0051382 | kinetochore assembly(GO:0051382) |
| 0.0 | 0.7 | GO:0051599 | response to hydrostatic pressure(GO:0051599) |
| 0.0 | 0.3 | GO:0008295 | spermidine biosynthetic process(GO:0008295) |
| 0.0 | 1.2 | GO:0006895 | Golgi to endosome transport(GO:0006895) |
| 0.0 | 0.7 | GO:0043983 | histone H4-K12 acetylation(GO:0043983) |
| 0.0 | 0.2 | GO:0009233 | menaquinone metabolic process(GO:0009233) |
| 0.0 | 3.7 | GO:0048477 | oogenesis(GO:0048477) |
| 0.0 | 1.9 | GO:0030490 | maturation of SSU-rRNA(GO:0030490) |
| 0.0 | 0.5 | GO:0032786 | positive regulation of DNA-templated transcription, elongation(GO:0032786) |
| 0.0 | 6.0 | GO:0030183 | B cell differentiation(GO:0030183) |
| 0.0 | 0.2 | GO:1902455 | negative regulation of stem cell population maintenance(GO:1902455) |
| 0.0 | 2.3 | GO:0035019 | somatic stem cell population maintenance(GO:0035019) |
| 0.0 | 3.8 | GO:0048678 | response to axon injury(GO:0048678) |
| 0.0 | 0.2 | GO:0042989 | sequestering of actin monomers(GO:0042989) |
| 0.0 | 0.6 | GO:0060009 | Sertoli cell development(GO:0060009) |
| 0.0 | 0.2 | GO:0006288 | base-excision repair, DNA ligation(GO:0006288) |
| 0.0 | 0.3 | GO:0045657 | positive regulation of monocyte differentiation(GO:0045657) |
| 0.0 | 0.7 | GO:0043653 | mitochondrial fragmentation involved in apoptotic process(GO:0043653) |
| 0.0 | 0.2 | GO:0071475 | cellular hyperosmotic salinity response(GO:0071475) |
| 0.0 | 0.8 | GO:0070816 | phosphorylation of RNA polymerase II C-terminal domain(GO:0070816) |
| 0.0 | 0.1 | GO:0036245 | cellular response to menadione(GO:0036245) |
| 0.0 | 0.3 | GO:0042255 | ribosome assembly(GO:0042255) |
| 0.0 | 0.2 | GO:1900020 | regulation of protein kinase C activity(GO:1900019) positive regulation of protein kinase C activity(GO:1900020) |
| 0.0 | 0.3 | GO:0010668 | ectodermal cell differentiation(GO:0010668) |
| 0.0 | 2.1 | GO:0071377 | cellular response to glucagon stimulus(GO:0071377) |
| 0.0 | 0.7 | GO:0051014 | actin filament severing(GO:0051014) |
| 0.0 | 0.4 | GO:0048387 | negative regulation of retinoic acid receptor signaling pathway(GO:0048387) |
| 0.0 | 0.1 | GO:1904211 | membrane protein proteolysis involved in retrograde protein transport, ER to cytosol(GO:1904211) |
| 0.0 | 0.6 | GO:0070914 | UV-damage excision repair(GO:0070914) |
| 0.0 | 0.7 | GO:0007379 | segment specification(GO:0007379) |
| 0.0 | 0.8 | GO:0015816 | glycine transport(GO:0015816) |
| 0.0 | 0.7 | GO:0038003 | opioid receptor signaling pathway(GO:0038003) |
| 0.0 | 1.2 | GO:0090503 | RNA phosphodiester bond hydrolysis, exonucleolytic(GO:0090503) |
| 0.0 | 0.2 | GO:2000210 | positive regulation of anoikis(GO:2000210) |
| 0.0 | 0.0 | GO:0021798 | forebrain dorsal/ventral pattern formation(GO:0021798) |
| 0.0 | 0.6 | GO:0032926 | negative regulation of activin receptor signaling pathway(GO:0032926) |
| 0.0 | 0.4 | GO:0032510 | endosome to lysosome transport via multivesicular body sorting pathway(GO:0032510) |
| 0.0 | 6.9 | GO:0009952 | anterior/posterior pattern specification(GO:0009952) |
| 0.0 | 2.7 | GO:0072431 | DNA damage response, signal transduction by p53 class mediator resulting in cell cycle arrest(GO:0006977) signal transduction involved in mitotic G1 DNA damage checkpoint(GO:0072431) intracellular signal transduction involved in G1 DNA damage checkpoint(GO:1902400) |
| 0.0 | 1.4 | GO:0031648 | protein destabilization(GO:0031648) |
| 0.0 | 0.4 | GO:0015886 | heme transport(GO:0015886) |
| 0.0 | 0.7 | GO:0090286 | cytoskeletal anchoring at nuclear membrane(GO:0090286) |
| 0.0 | 0.3 | GO:1904816 | positive regulation of protein localization to chromosome, telomeric region(GO:1904816) |
| 0.0 | 3.8 | GO:0006334 | nucleosome assembly(GO:0006334) |
| 0.0 | 1.1 | GO:0050655 | dermatan sulfate proteoglycan metabolic process(GO:0050655) |
| 0.0 | 1.5 | GO:0032467 | positive regulation of cytokinesis(GO:0032467) |
| 0.0 | 0.3 | GO:0097264 | self proteolysis(GO:0097264) |
| 0.0 | 0.1 | GO:0031120 | snoRNA guided rRNA pseudouridine synthesis(GO:0000454) snRNA pseudouridine synthesis(GO:0031120) |
| 0.0 | 3.7 | GO:0006501 | C-terminal protein lipidation(GO:0006501) |
| 0.0 | 0.9 | GO:0002115 | store-operated calcium entry(GO:0002115) |
| 0.0 | 0.4 | GO:1904153 | negative regulation of protein exit from endoplasmic reticulum(GO:0070862) negative regulation of retrograde protein transport, ER to cytosol(GO:1904153) |
| 0.0 | 0.5 | GO:0000920 | cell separation after cytokinesis(GO:0000920) |
| 0.0 | 1.0 | GO:0048246 | macrophage chemotaxis(GO:0048246) |
| 0.0 | 0.7 | GO:1902036 | regulation of hematopoietic stem cell differentiation(GO:1902036) |
| 0.0 | 4.3 | GO:0010212 | response to ionizing radiation(GO:0010212) |
| 0.0 | 2.2 | GO:0006369 | termination of RNA polymerase II transcription(GO:0006369) |
| 0.0 | 1.1 | GO:1901224 | positive regulation of NIK/NF-kappaB signaling(GO:1901224) |
| 0.0 | 0.5 | GO:0002467 | germinal center formation(GO:0002467) |
| 0.0 | 2.0 | GO:0007498 | mesoderm development(GO:0007498) |
| 0.0 | 0.1 | GO:0070544 | histone H3-K36 demethylation(GO:0070544) |
| 0.0 | 0.2 | GO:0007161 | calcium-independent cell-matrix adhesion(GO:0007161) |
| 0.0 | 0.4 | GO:0051969 | regulation of transmission of nerve impulse(GO:0051969) |
| 0.0 | 0.3 | GO:0051344 | negative regulation of cyclic-nucleotide phosphodiesterase activity(GO:0051344) |
| 0.0 | 0.1 | GO:0009298 | GDP-mannose biosynthetic process(GO:0009298) |
| 0.0 | 0.3 | GO:0042274 | ribosomal small subunit biogenesis(GO:0042274) |
| 0.0 | 0.1 | GO:0051673 | membrane disruption in other organism(GO:0051673) |
| 0.0 | 0.7 | GO:0040019 | positive regulation of embryonic development(GO:0040019) |
| 0.0 | 0.4 | GO:0036500 | ATF6-mediated unfolded protein response(GO:0036500) |
| 0.0 | 0.1 | GO:1901503 | ether lipid biosynthetic process(GO:0008611) glycerol ether biosynthetic process(GO:0046504) ether biosynthetic process(GO:1901503) |
| 0.0 | 1.6 | GO:0042267 | natural killer cell mediated cytotoxicity(GO:0042267) |
| 0.0 | 0.6 | GO:0043029 | T cell homeostasis(GO:0043029) |
| 0.0 | 0.2 | GO:2000270 | negative regulation of fibroblast apoptotic process(GO:2000270) |
| 0.0 | 0.7 | GO:0072697 | protein localization to cell cortex(GO:0072697) regulation of protein localization to cell cortex(GO:1904776) positive regulation of protein localization to cell cortex(GO:1904778) |
| 0.0 | 0.1 | GO:0071963 | establishment or maintenance of cell polarity regulating cell shape(GO:0071963) |
| 0.0 | 0.3 | GO:0071499 | cellular response to laminar fluid shear stress(GO:0071499) |
| 0.0 | 0.2 | GO:0000733 | DNA strand renaturation(GO:0000733) |
| 0.0 | 0.6 | GO:0030520 | intracellular estrogen receptor signaling pathway(GO:0030520) |
| 0.0 | 0.1 | GO:0038161 | prolactin signaling pathway(GO:0038161) |
| 0.0 | 0.1 | GO:0048549 | positive regulation of pinocytosis(GO:0048549) |
| 0.0 | 0.3 | GO:0007130 | synaptonemal complex assembly(GO:0007130) |
| 0.0 | 0.1 | GO:0033484 | nitric oxide homeostasis(GO:0033484) |
| 0.0 | 0.6 | GO:0032211 | negative regulation of telomere maintenance via telomerase(GO:0032211) |
| 0.0 | 3.1 | GO:0070268 | cornification(GO:0070268) |
| 0.0 | 0.5 | GO:0006362 | transcription elongation from RNA polymerase I promoter(GO:0006362) |
| 0.0 | 1.1 | GO:0048635 | negative regulation of muscle organ development(GO:0048635) |
| 0.0 | 0.1 | GO:0060087 | relaxation of vascular smooth muscle(GO:0060087) |
| 0.0 | 0.3 | GO:0035646 | endosome to melanosome transport(GO:0035646) endosome to pigment granule transport(GO:0043485) pigment granule maturation(GO:0048757) |
| 0.0 | 0.9 | GO:0045776 | negative regulation of blood pressure(GO:0045776) |
| 0.0 | 0.3 | GO:0070935 | 3'-UTR-mediated mRNA stabilization(GO:0070935) |
| 0.0 | 0.4 | GO:0051601 | exocyst localization(GO:0051601) |
| 0.0 | 0.5 | GO:0001893 | maternal placenta development(GO:0001893) |
| 0.0 | 0.3 | GO:0030828 | positive regulation of cGMP biosynthetic process(GO:0030828) |
| 0.0 | 0.1 | GO:0042779 | tRNA 3'-trailer cleavage, endonucleolytic(GO:0034414) tRNA 3'-trailer cleavage(GO:0042779) |
| 0.0 | 0.6 | GO:0030488 | tRNA methylation(GO:0030488) |
| 0.0 | 0.3 | GO:0016180 | snRNA processing(GO:0016180) |
| 0.0 | 1.1 | GO:0044364 | killing of cells of other organism(GO:0031640) disruption of cells of other organism(GO:0044364) |
| 0.0 | 0.1 | GO:1903300 | negative regulation of glucokinase activity(GO:0033132) negative regulation of hexokinase activity(GO:1903300) |
| 0.0 | 0.2 | GO:0048312 | intracellular distribution of mitochondria(GO:0048312) |
| 0.0 | 1.9 | GO:0031145 | anaphase-promoting complex-dependent catabolic process(GO:0031145) |
| 0.0 | 0.1 | GO:0033306 | phytol metabolic process(GO:0033306) fatty alcohol metabolic process(GO:1903173) |
| 0.0 | 0.1 | GO:1902570 | protein localization to nucleolus(GO:1902570) |
| 0.0 | 0.8 | GO:0006400 | tRNA modification(GO:0006400) |
| 0.0 | 0.3 | GO:0034384 | high-density lipoprotein particle clearance(GO:0034384) |
| 0.0 | 1.5 | GO:0006968 | cellular defense response(GO:0006968) |
| 0.0 | 0.3 | GO:1901750 | leukotriene D4 metabolic process(GO:1901748) leukotriene D4 biosynthetic process(GO:1901750) |
| 0.0 | 0.7 | GO:0015804 | neutral amino acid transport(GO:0015804) |
| 0.0 | 0.2 | GO:0031293 | membrane protein intracellular domain proteolysis(GO:0031293) |
| 0.0 | 0.2 | GO:0043982 | histone H4-K5 acetylation(GO:0043981) histone H4-K8 acetylation(GO:0043982) |
| 0.0 | 0.8 | GO:0045132 | meiotic chromosome segregation(GO:0045132) |
| 0.0 | 2.6 | GO:0048013 | ephrin receptor signaling pathway(GO:0048013) |
| 0.0 | 0.3 | GO:0007213 | G-protein coupled acetylcholine receptor signaling pathway(GO:0007213) |
| 0.0 | 0.2 | GO:0015781 | pyrimidine nucleotide-sugar transport(GO:0015781) |
| 0.0 | 0.3 | GO:0071218 | cellular response to misfolded protein(GO:0071218) |
| 0.0 | 0.3 | GO:0034587 | piRNA metabolic process(GO:0034587) |
| 0.0 | 2.5 | GO:0007286 | spermatid development(GO:0007286) |
| 0.0 | 0.4 | GO:0016024 | CDP-diacylglycerol biosynthetic process(GO:0016024) |
| 0.0 | 0.3 | GO:0045723 | positive regulation of fatty acid biosynthetic process(GO:0045723) |
| 0.0 | 0.5 | GO:0006646 | phosphatidylethanolamine biosynthetic process(GO:0006646) |
| 0.0 | 0.2 | GO:0006689 | ganglioside catabolic process(GO:0006689) |
| 0.0 | 0.2 | GO:0036010 | protein localization to endosome(GO:0036010) |
| 0.0 | 0.3 | GO:0070536 | protein K63-linked deubiquitination(GO:0070536) |
| 0.0 | 0.2 | GO:0098779 | mitophagy in response to mitochondrial depolarization(GO:0098779) |
| 0.0 | 1.1 | GO:0006910 | phagocytosis, recognition(GO:0006910) |
| 0.0 | 1.0 | GO:0015701 | bicarbonate transport(GO:0015701) |
| 0.0 | 0.1 | GO:0048280 | vesicle fusion with Golgi apparatus(GO:0048280) |
| 0.0 | 0.2 | GO:0001778 | plasma membrane repair(GO:0001778) |
| 0.0 | 0.5 | GO:0010717 | regulation of epithelial to mesenchymal transition(GO:0010717) |
| 0.0 | 1.3 | GO:1900181 | negative regulation of protein localization to nucleus(GO:1900181) |
| 0.0 | 0.4 | GO:0006406 | mRNA export from nucleus(GO:0006406) mRNA-containing ribonucleoprotein complex export from nucleus(GO:0071427) |
| 0.0 | 0.7 | GO:0043001 | Golgi to plasma membrane protein transport(GO:0043001) |
| 0.0 | 0.5 | GO:0072661 | protein targeting to plasma membrane(GO:0072661) |
| 0.0 | 0.6 | GO:0065004 | protein-DNA complex assembly(GO:0065004) |
| 0.0 | 1.3 | GO:2001237 | negative regulation of extrinsic apoptotic signaling pathway(GO:2001237) |
| 0.0 | 0.2 | GO:0035372 | protein localization to microtubule(GO:0035372) |
| 0.0 | 0.2 | GO:0032486 | Rap protein signal transduction(GO:0032486) |
| 0.0 | 0.2 | GO:0035196 | production of miRNAs involved in gene silencing by miRNA(GO:0035196) |
| 0.0 | 1.2 | GO:0045766 | positive regulation of angiogenesis(GO:0045766) |
| 0.0 | 0.4 | GO:0006308 | DNA catabolic process(GO:0006308) |
| 0.0 | 0.3 | GO:0045604 | regulation of epidermal cell differentiation(GO:0045604) |
| 0.0 | 0.8 | GO:0035722 | interleukin-12-mediated signaling pathway(GO:0035722) cellular response to interleukin-12(GO:0071349) |
| 0.0 | 0.0 | GO:0000451 | rRNA 2'-O-methylation(GO:0000451) |
| 0.0 | 0.5 | GO:0000245 | spliceosomal complex assembly(GO:0000245) |
| 0.0 | 0.1 | GO:0016240 | autophagosome docking(GO:0016240) |
| 0.0 | 0.2 | GO:0035360 | positive regulation of peroxisome proliferator activated receptor signaling pathway(GO:0035360) |
| 0.0 | 0.3 | GO:0001510 | RNA methylation(GO:0001510) |
| 0.0 | 1.0 | GO:0046546 | male gonad development(GO:0008584) development of primary male sexual characteristics(GO:0046546) |
Gene overrepresentation in cellular component category:
| Log-likelihood per target | Total log-likelihood | Term | Description |
|---|---|---|---|
| 2.4 | 19.1 | GO:0097129 | cyclin D2-CDK4 complex(GO:0097129) |
| 1.5 | 4.5 | GO:0044611 | nuclear pore inner ring(GO:0044611) |
| 1.3 | 11.3 | GO:0098575 | lumenal side of lysosomal membrane(GO:0098575) |
| 0.9 | 4.3 | GO:0071148 | TEAD-1-YAP complex(GO:0071148) TEAD-2-YAP complex(GO:0071149) |
| 0.6 | 8.0 | GO:0097136 | Bcl-2 family protein complex(GO:0097136) |
| 0.5 | 2.5 | GO:0070381 | endosome to plasma membrane transport vesicle(GO:0070381) |
| 0.5 | 4.7 | GO:0044194 | cytolytic granule(GO:0044194) |
| 0.5 | 4.1 | GO:0030896 | checkpoint clamp complex(GO:0030896) |
| 0.5 | 1.8 | GO:0045323 | interleukin-1 receptor complex(GO:0045323) |
| 0.4 | 4.8 | GO:0005879 | axonemal microtubule(GO:0005879) |
| 0.4 | 4.8 | GO:0036157 | outer dynein arm(GO:0036157) |
| 0.4 | 5.8 | GO:0005853 | eukaryotic translation elongation factor 1 complex(GO:0005853) |
| 0.4 | 2.5 | GO:0048476 | Holliday junction resolvase complex(GO:0048476) |
| 0.4 | 0.8 | GO:1990590 | ATF1-ATF4 transcription factor complex(GO:1990590) |
| 0.3 | 2.7 | GO:0031415 | NatA complex(GO:0031415) |
| 0.3 | 1.3 | GO:0035101 | FACT complex(GO:0035101) |
| 0.3 | 2.2 | GO:0089701 | U2AF(GO:0089701) |
| 0.3 | 1.8 | GO:0016035 | zeta DNA polymerase complex(GO:0016035) |
| 0.3 | 1.2 | GO:0071817 | MMXD complex(GO:0071817) |
| 0.3 | 2.1 | GO:0033553 | rDNA heterochromatin(GO:0033553) |
| 0.3 | 2.5 | GO:0097452 | GAIT complex(GO:0097452) |
| 0.3 | 0.8 | GO:0005656 | nuclear pre-replicative complex(GO:0005656) pre-replicative complex(GO:0036387) |
| 0.3 | 1.6 | GO:0033186 | CAF-1 complex(GO:0033186) |
| 0.2 | 0.7 | GO:0043511 | inhibin complex(GO:0043511) inhibin A complex(GO:0043512) |
| 0.2 | 3.6 | GO:0016281 | eukaryotic translation initiation factor 4F complex(GO:0016281) |
| 0.2 | 1.7 | GO:0031523 | Myb complex(GO:0031523) |
| 0.2 | 1.7 | GO:0071204 | histone pre-mRNA 3'end processing complex(GO:0071204) |
| 0.2 | 1.7 | GO:0070876 | SOSS complex(GO:0070876) |
| 0.2 | 2.9 | GO:0000506 | glycosylphosphatidylinositol-N-acetylglucosaminyltransferase (GPI-GnT) complex(GO:0000506) |
| 0.2 | 1.7 | GO:0042721 | mitochondrial inner membrane protein insertion complex(GO:0042721) |
| 0.2 | 2.1 | GO:0019907 | cyclin-dependent protein kinase activating kinase holoenzyme complex(GO:0019907) |
| 0.2 | 1.9 | GO:0044530 | supraspliceosomal complex(GO:0044530) |
| 0.2 | 1.2 | GO:0035363 | histone locus body(GO:0035363) |
| 0.2 | 3.7 | GO:0097487 | multivesicular body, internal vesicle(GO:0097487) |
| 0.2 | 8.7 | GO:0005721 | pericentric heterochromatin(GO:0005721) |
| 0.2 | 2.5 | GO:0098554 | cytoplasmic side of endoplasmic reticulum membrane(GO:0098554) |
| 0.2 | 25.1 | GO:0022625 | cytosolic large ribosomal subunit(GO:0022625) |
| 0.2 | 1.3 | GO:0034991 | nuclear meiotic cohesin complex(GO:0034991) |
| 0.2 | 3.3 | GO:0005641 | nuclear envelope lumen(GO:0005641) |
| 0.2 | 2.6 | GO:0070552 | BRISC complex(GO:0070552) |
| 0.2 | 2.6 | GO:0097413 | Lewy body(GO:0097413) |
| 0.2 | 3.3 | GO:0071203 | WASH complex(GO:0071203) |
| 0.2 | 2.5 | GO:0030991 | intraciliary transport particle A(GO:0030991) |
| 0.2 | 3.2 | GO:0035253 | ciliary rootlet(GO:0035253) |
| 0.2 | 15.5 | GO:0016235 | aggresome(GO:0016235) |
| 0.2 | 0.9 | GO:0034753 | nuclear aryl hydrocarbon receptor complex(GO:0034753) |
| 0.2 | 9.1 | GO:0044665 | MLL1/2 complex(GO:0044665) MLL1 complex(GO:0071339) |
| 0.2 | 1.1 | GO:0000801 | central element(GO:0000801) |
| 0.2 | 5.3 | GO:0005852 | eukaryotic translation initiation factor 3 complex(GO:0005852) |
| 0.2 | 0.9 | GO:0033596 | TSC1-TSC2 complex(GO:0033596) |
| 0.2 | 2.8 | GO:0042555 | MCM complex(GO:0042555) |
| 0.2 | 2.4 | GO:0033256 | I-kappaB/NF-kappaB complex(GO:0033256) |
| 0.2 | 0.7 | GO:0043293 | apoptosome(GO:0043293) |
| 0.2 | 1.3 | GO:1990111 | spermatoproteasome complex(GO:1990111) |
| 0.2 | 0.6 | GO:1990879 | CST complex(GO:1990879) |
| 0.2 | 11.8 | GO:0022627 | cytosolic small ribosomal subunit(GO:0022627) |
| 0.2 | 0.5 | GO:1990923 | PET complex(GO:1990923) |
| 0.2 | 1.7 | GO:0005638 | lamin filament(GO:0005638) |
| 0.1 | 2.5 | GO:0001520 | outer dense fiber(GO:0001520) |
| 0.1 | 1.9 | GO:0036128 | CatSper complex(GO:0036128) |
| 0.1 | 1.2 | GO:0033503 | HULC complex(GO:0033503) |
| 0.1 | 3.1 | GO:0005885 | Arp2/3 protein complex(GO:0005885) |
| 0.1 | 0.6 | GO:0000942 | condensed nuclear chromosome outer kinetochore(GO:0000942) |
| 0.1 | 1.4 | GO:0097504 | Gemini of coiled bodies(GO:0097504) |
| 0.1 | 0.1 | GO:0072588 | box H/ACA snoRNP complex(GO:0031429) box H/ACA RNP complex(GO:0072588) box H/ACA scaRNP complex(GO:0072589) box H/ACA telomerase RNP complex(GO:0090661) |
| 0.1 | 0.5 | GO:0071004 | U2-type prespliceosome(GO:0071004) |
| 0.1 | 1.6 | GO:0005785 | signal recognition particle receptor complex(GO:0005785) |
| 0.1 | 0.9 | GO:0000243 | commitment complex(GO:0000243) |
| 0.1 | 0.9 | GO:0030121 | AP-1 adaptor complex(GO:0030121) |
| 0.1 | 1.5 | GO:0071144 | SMAD2-SMAD3 protein complex(GO:0071144) |
| 0.1 | 0.6 | GO:0034751 | aryl hydrocarbon receptor complex(GO:0034751) |
| 0.1 | 0.5 | GO:0005899 | insulin receptor complex(GO:0005899) |
| 0.1 | 1.5 | GO:0034709 | methylosome(GO:0034709) |
| 0.1 | 4.0 | GO:0000178 | exosome (RNase complex)(GO:0000178) |
| 0.1 | 1.0 | GO:0000138 | Golgi trans cisterna(GO:0000138) |
| 0.1 | 0.7 | GO:0000408 | EKC/KEOPS complex(GO:0000408) |
| 0.1 | 2.5 | GO:0042405 | nuclear inclusion body(GO:0042405) |
| 0.1 | 1.9 | GO:0032040 | small-subunit processome(GO:0032040) |
| 0.1 | 0.3 | GO:0030981 | cortical microtubule cytoskeleton(GO:0030981) |
| 0.1 | 0.8 | GO:0032021 | NELF complex(GO:0032021) |
| 0.1 | 0.8 | GO:0034388 | Pwp2p-containing subcomplex of 90S preribosome(GO:0034388) |
| 0.1 | 0.3 | GO:0042719 | mitochondrial intermembrane space protein transporter complex(GO:0042719) |
| 0.1 | 8.0 | GO:0035577 | azurophil granule membrane(GO:0035577) |
| 0.1 | 1.0 | GO:0071986 | Ragulator complex(GO:0071986) |
| 0.1 | 0.7 | GO:0042824 | MHC class I peptide loading complex(GO:0042824) |
| 0.1 | 0.4 | GO:0098592 | cytoplasmic side of apical plasma membrane(GO:0098592) |
| 0.1 | 0.7 | GO:0001739 | sex chromatin(GO:0001739) |
| 0.1 | 1.6 | GO:0008250 | oligosaccharyltransferase complex(GO:0008250) |
| 0.1 | 2.1 | GO:0005671 | Ada2/Gcn5/Ada3 transcription activator complex(GO:0005671) |
| 0.1 | 0.8 | GO:0033276 | transcription factor TFTC complex(GO:0033276) |
| 0.1 | 3.0 | GO:0014731 | spectrin-associated cytoskeleton(GO:0014731) |
| 0.1 | 0.2 | GO:0033597 | mitotic checkpoint complex(GO:0033597) bub1-bub3 complex(GO:1990298) |
| 0.1 | 0.9 | GO:0072379 | BAT3 complex(GO:0071818) ER membrane insertion complex(GO:0072379) |
| 0.1 | 1.1 | GO:0002116 | semaphorin receptor complex(GO:0002116) |
| 0.1 | 0.5 | GO:0030905 | retromer, tubulation complex(GO:0030905) |
| 0.1 | 0.3 | GO:0030893 | meiotic cohesin complex(GO:0030893) |
| 0.1 | 1.1 | GO:0005744 | mitochondrial inner membrane presequence translocase complex(GO:0005744) |
| 0.1 | 1.2 | GO:0034098 | VCP-NPL4-UFD1 AAA ATPase complex(GO:0034098) |
| 0.1 | 0.6 | GO:0002177 | manchette(GO:0002177) |
| 0.1 | 1.2 | GO:0001931 | uropod(GO:0001931) cell trailing edge(GO:0031254) |
| 0.1 | 1.2 | GO:0048188 | Set1C/COMPASS complex(GO:0048188) |
| 0.1 | 7.5 | GO:0032154 | cleavage furrow(GO:0032154) cell surface furrow(GO:0097610) |
| 0.1 | 0.3 | GO:0071001 | U4/U6 snRNP(GO:0071001) |
| 0.1 | 1.5 | GO:0000164 | protein phosphatase type 1 complex(GO:0000164) |
| 0.1 | 0.8 | GO:0031313 | extrinsic component of endosome membrane(GO:0031313) |
| 0.1 | 2.6 | GO:0002080 | acrosomal membrane(GO:0002080) |
| 0.1 | 0.8 | GO:0005675 | holo TFIIH complex(GO:0005675) |
| 0.1 | 0.7 | GO:0030688 | preribosome, small subunit precursor(GO:0030688) |
| 0.1 | 10.6 | GO:0043202 | lysosomal lumen(GO:0043202) |
| 0.1 | 1.9 | GO:0005720 | nuclear heterochromatin(GO:0005720) |
| 0.1 | 0.5 | GO:0042382 | paraspeckles(GO:0042382) |
| 0.1 | 0.2 | GO:0030915 | Smc5-Smc6 complex(GO:0030915) |
| 0.1 | 12.6 | GO:0001650 | fibrillar center(GO:0001650) |
| 0.1 | 1.0 | GO:0071141 | SMAD protein complex(GO:0071141) |
| 0.1 | 0.6 | GO:0044294 | dendritic growth cone(GO:0044294) |
| 0.1 | 0.3 | GO:0034669 | integrin alpha4-beta7 complex(GO:0034669) |
| 0.1 | 2.8 | GO:0015030 | Cajal body(GO:0015030) |
| 0.1 | 0.3 | GO:0035841 | new growing cell tip(GO:0035841) |
| 0.0 | 0.2 | GO:0030687 | preribosome, large subunit precursor(GO:0030687) |
| 0.0 | 0.9 | GO:0035102 | PRC1 complex(GO:0035102) |
| 0.0 | 0.1 | GO:0097422 | tubular endosome(GO:0097422) |
| 0.0 | 3.0 | GO:0016592 | mediator complex(GO:0016592) |
| 0.0 | 2.8 | GO:0046658 | anchored component of plasma membrane(GO:0046658) |
| 0.0 | 0.5 | GO:0005827 | polar microtubule(GO:0005827) |
| 0.0 | 8.5 | GO:0090575 | RNA polymerase II transcription factor complex(GO:0090575) |
| 0.0 | 0.6 | GO:0031465 | Cul4B-RING E3 ubiquitin ligase complex(GO:0031465) |
| 0.0 | 1.4 | GO:0000930 | gamma-tubulin complex(GO:0000930) |
| 0.0 | 2.3 | GO:0005790 | smooth endoplasmic reticulum(GO:0005790) |
| 0.0 | 0.8 | GO:0005685 | U1 snRNP(GO:0005685) |
| 0.0 | 0.5 | GO:0000940 | condensed chromosome outer kinetochore(GO:0000940) |
| 0.0 | 1.1 | GO:0005952 | cAMP-dependent protein kinase complex(GO:0005952) |
| 0.0 | 0.7 | GO:0000780 | condensed nuclear chromosome, centromeric region(GO:0000780) |
| 0.0 | 0.5 | GO:0005697 | telomerase holoenzyme complex(GO:0005697) |
| 0.0 | 5.5 | GO:0071013 | catalytic step 2 spliceosome(GO:0071013) |
| 0.0 | 0.1 | GO:0032806 | carboxy-terminal domain protein kinase complex(GO:0032806) |
| 0.0 | 4.3 | GO:0005811 | lipid particle(GO:0005811) |
| 0.0 | 4.2 | GO:0035578 | azurophil granule lumen(GO:0035578) |
| 0.0 | 0.7 | GO:0005736 | DNA-directed RNA polymerase I complex(GO:0005736) |
| 0.0 | 4.9 | GO:0005798 | Golgi-associated vesicle(GO:0005798) |
| 0.0 | 1.6 | GO:0090545 | NuRD complex(GO:0016581) CHD-type complex(GO:0090545) |
| 0.0 | 0.7 | GO:0000153 | cytoplasmic ubiquitin ligase complex(GO:0000153) |
| 0.0 | 0.2 | GO:0043564 | Ku70:Ku80 complex(GO:0043564) |
| 0.0 | 0.2 | GO:0031074 | nucleocytoplasmic shuttling complex(GO:0031074) |
| 0.0 | 38.0 | GO:0016604 | nuclear body(GO:0016604) |
| 0.0 | 4.4 | GO:0005901 | caveola(GO:0005901) |
| 0.0 | 1.8 | GO:0031258 | lamellipodium membrane(GO:0031258) |
| 0.0 | 0.5 | GO:0044615 | nuclear pore nuclear basket(GO:0044615) |
| 0.0 | 2.7 | GO:0031093 | platelet alpha granule lumen(GO:0031093) |
| 0.0 | 1.0 | GO:0030285 | integral component of synaptic vesicle membrane(GO:0030285) intrinsic component of synaptic vesicle membrane(GO:0098563) |
| 0.0 | 1.4 | GO:0031519 | PcG protein complex(GO:0031519) |
| 0.0 | 0.3 | GO:0090543 | Flemming body(GO:0090543) |
| 0.0 | 0.7 | GO:1990023 | mitotic spindle midzone(GO:1990023) |
| 0.0 | 1.9 | GO:0002102 | podosome(GO:0002102) |
| 0.0 | 0.2 | GO:0031931 | TORC1 complex(GO:0031931) |
| 0.0 | 0.4 | GO:0005665 | DNA-directed RNA polymerase II, core complex(GO:0005665) |
| 0.0 | 0.6 | GO:0044853 | plasma membrane raft(GO:0044853) |
| 0.0 | 0.2 | GO:0031464 | Cul4A-RING E3 ubiquitin ligase complex(GO:0031464) |
| 0.0 | 1.4 | GO:0009925 | basal plasma membrane(GO:0009925) |
| 0.0 | 1.9 | GO:0030173 | integral component of Golgi membrane(GO:0030173) |
| 0.0 | 0.2 | GO:0031314 | extrinsic component of mitochondrial inner membrane(GO:0031314) |
| 0.0 | 0.2 | GO:0005663 | DNA replication factor C complex(GO:0005663) |
| 0.0 | 2.9 | GO:0017053 | transcriptional repressor complex(GO:0017053) |
| 0.0 | 26.3 | GO:0005730 | nucleolus(GO:0005730) |
| 0.0 | 0.4 | GO:0000815 | ESCRT III complex(GO:0000815) |
| 0.0 | 0.4 | GO:0000813 | ESCRT I complex(GO:0000813) |
| 0.0 | 3.8 | GO:0005581 | collagen trimer(GO:0005581) |
| 0.0 | 2.2 | GO:0031526 | brush border membrane(GO:0031526) |
| 0.0 | 0.4 | GO:0030008 | TRAPP complex(GO:0030008) |
| 0.0 | 4.5 | GO:0005882 | intermediate filament(GO:0005882) |
| 0.0 | 2.1 | GO:0005796 | Golgi lumen(GO:0005796) |
| 0.0 | 0.1 | GO:0031085 | BLOC-3 complex(GO:0031085) |
| 0.0 | 0.1 | GO:0005642 | annulate lamellae(GO:0005642) |
| 0.0 | 0.3 | GO:0032039 | integrator complex(GO:0032039) |
| 0.0 | 3.2 | GO:0035579 | specific granule membrane(GO:0035579) |
| 0.0 | 0.5 | GO:0035097 | histone methyltransferase complex(GO:0035097) |
| 0.0 | 0.7 | GO:0000795 | synaptonemal complex(GO:0000795) |
| 0.0 | 1.1 | GO:0042571 | immunoglobulin complex, circulating(GO:0042571) |
| 0.0 | 2.0 | GO:0001669 | acrosomal vesicle(GO:0001669) |
| 0.0 | 0.5 | GO:0032045 | guanyl-nucleotide exchange factor complex(GO:0032045) |
| 0.0 | 0.6 | GO:0031091 | platelet alpha granule(GO:0031091) |
| 0.0 | 1.2 | GO:0005791 | rough endoplasmic reticulum(GO:0005791) |
| 0.0 | 4.2 | GO:0000790 | nuclear chromatin(GO:0000790) |
| 0.0 | 0.2 | GO:0043190 | ATP-binding cassette (ABC) transporter complex(GO:0043190) |
| 0.0 | 2.3 | GO:0005793 | endoplasmic reticulum-Golgi intermediate compartment(GO:0005793) |
| 0.0 | 0.1 | GO:0097539 | ciliary transition fiber(GO:0097539) |
| 0.0 | 0.4 | GO:0036038 | MKS complex(GO:0036038) |
| 0.0 | 1.9 | GO:0000785 | chromatin(GO:0000785) |
| 0.0 | 0.5 | GO:0045111 | intermediate filament cytoskeleton(GO:0045111) |
| 0.0 | 4.5 | GO:0005788 | endoplasmic reticulum lumen(GO:0005788) |
| 0.0 | 0.4 | GO:0031235 | intrinsic component of the cytoplasmic side of the plasma membrane(GO:0031235) |
| 0.0 | 0.7 | GO:0001533 | cornified envelope(GO:0001533) |
| 0.0 | 0.6 | GO:0005844 | polysome(GO:0005844) |
| 0.0 | 0.1 | GO:0031332 | RISC complex(GO:0016442) RNAi effector complex(GO:0031332) |
| 0.0 | 0.6 | GO:0010494 | cytoplasmic stress granule(GO:0010494) |
| 0.0 | 0.4 | GO:0042629 | mast cell granule(GO:0042629) |
| 0.0 | 7.4 | GO:0005925 | focal adhesion(GO:0005925) |
| 0.0 | 1.5 | GO:0031514 | motile cilium(GO:0031514) |
Gene overrepresentation in molecular function category:
| Log-likelihood per target | Total log-likelihood | Term | Description |
|---|---|---|---|
| 1.9 | 9.5 | GO:0070180 | large ribosomal subunit rRNA binding(GO:0070180) |
| 1.4 | 12.5 | GO:0004024 | alcohol dehydrogenase activity, zinc-dependent(GO:0004024) |
| 1.3 | 3.9 | GO:0008330 | protein tyrosine/threonine phosphatase activity(GO:0008330) |
| 0.9 | 2.7 | GO:0052858 | peptidyl-lysine N-acetyltransferase activity, acting on acetyl phosphate as donor(GO:0052858) |
| 0.9 | 2.7 | GO:0008859 | exoribonuclease II activity(GO:0008859) |
| 0.8 | 3.3 | GO:1990189 | peptide-serine-N-acetyltransferase activity(GO:1990189) |
| 0.8 | 12.4 | GO:0004308 | exo-alpha-sialidase activity(GO:0004308) alpha-sialidase activity(GO:0016997) |
| 0.7 | 2.1 | GO:0016936 | galactoside binding(GO:0016936) |
| 0.7 | 2.8 | GO:0019770 | IgG receptor activity(GO:0019770) |
| 0.7 | 2.1 | GO:0046969 | histone deacetylase activity (H3-K9 specific)(GO:0032129) NAD-dependent histone deacetylase activity (H3-K9 specific)(GO:0046969) |
| 0.6 | 3.7 | GO:0035402 | histone kinase activity (H3-T11 specific)(GO:0035402) |
| 0.6 | 2.3 | GO:0061752 | telomeric repeat-containing RNA binding(GO:0061752) |
| 0.6 | 4.0 | GO:0046624 | sphingolipid transporter activity(GO:0046624) |
| 0.6 | 2.3 | GO:0019763 | immunoglobulin receptor activity(GO:0019763) |
| 0.6 | 7.8 | GO:0051434 | BH3 domain binding(GO:0051434) |
| 0.6 | 2.8 | GO:0005010 | insulin-like growth factor-activated receptor activity(GO:0005010) |
| 0.5 | 1.6 | GO:0048257 | 3'-flap endonuclease activity(GO:0048257) |
| 0.5 | 4.1 | GO:0008853 | exodeoxyribonuclease III activity(GO:0008853) |
| 0.5 | 5.2 | GO:0019826 | oxygen sensor activity(GO:0019826) |
| 0.5 | 2.3 | GO:0004392 | heme oxygenase (decyclizing) activity(GO:0004392) |
| 0.4 | 3.8 | GO:0008269 | JAK pathway signal transduction adaptor activity(GO:0008269) |
| 0.4 | 8.7 | GO:0061578 | Lys63-specific deubiquitinase activity(GO:0061578) |
| 0.4 | 20.2 | GO:0016538 | cyclin-dependent protein serine/threonine kinase regulator activity(GO:0016538) |
| 0.4 | 1.1 | GO:0033746 | histone demethylase activity (H3-R2 specific)(GO:0033746) histone demethylase activity (H4-R3 specific)(GO:0033749) |
| 0.4 | 2.2 | GO:0034186 | apolipoprotein A-I binding(GO:0034186) |
| 0.4 | 3.3 | GO:0008449 | N-acetylglucosamine-6-sulfatase activity(GO:0008449) |
| 0.4 | 1.8 | GO:0071558 | histone demethylase activity (H3-K27 specific)(GO:0071558) |
| 0.3 | 2.1 | GO:0004489 | methylenetetrahydrofolate reductase (NAD(P)H) activity(GO:0004489) |
| 0.3 | 1.0 | GO:0004574 | oligo-1,6-glucosidase activity(GO:0004574) |
| 0.3 | 1.7 | GO:0004802 | transketolase activity(GO:0004802) |
| 0.3 | 8.1 | GO:0032454 | histone demethylase activity (H3-K9 specific)(GO:0032454) |
| 0.3 | 2.3 | GO:0038052 | RNA polymerase II transcription factor activity, estrogen-activated sequence-specific DNA binding(GO:0038052) |
| 0.3 | 4.8 | GO:0045504 | dynein heavy chain binding(GO:0045504) |
| 0.3 | 4.7 | GO:0070700 | BMP receptor binding(GO:0070700) |
| 0.3 | 1.3 | GO:0015207 | ATP:ADP antiporter activity(GO:0005471) adenine transmembrane transporter activity(GO:0015207) |
| 0.3 | 2.2 | GO:0030628 | pre-mRNA 3'-splice site binding(GO:0030628) |
| 0.3 | 0.9 | GO:0004874 | aryl hydrocarbon receptor activity(GO:0004874) |
| 0.3 | 1.5 | GO:0008466 | glycogenin glucosyltransferase activity(GO:0008466) |
| 0.3 | 0.9 | GO:0030305 | beta-glucuronidase activity(GO:0004566) heparanase activity(GO:0030305) |
| 0.3 | 14.7 | GO:0005109 | frizzled binding(GO:0005109) |
| 0.3 | 2.6 | GO:0004727 | prenylated protein tyrosine phosphatase activity(GO:0004727) |
| 0.3 | 2.0 | GO:0004945 | angiotensin receptor activity(GO:0001595) angiotensin type II receptor activity(GO:0004945) |
| 0.3 | 2.9 | GO:0017176 | phosphatidylinositol N-acetylglucosaminyltransferase activity(GO:0017176) |
| 0.3 | 0.6 | GO:0043682 | copper-exporting ATPase activity(GO:0004008) copper-transporting ATPase activity(GO:0043682) |
| 0.3 | 0.8 | GO:1990932 | 5.8S rRNA binding(GO:1990932) |
| 0.3 | 1.9 | GO:0031752 | D5 dopamine receptor binding(GO:0031752) |
| 0.3 | 1.5 | GO:0004809 | tRNA (guanine-N2-)-methyltransferase activity(GO:0004809) |
| 0.2 | 2.0 | GO:0008172 | S-methyltransferase activity(GO:0008172) |
| 0.2 | 0.7 | GO:0005055 | laminin receptor activity(GO:0005055) |
| 0.2 | 1.4 | GO:0050252 | retinol O-fatty-acyltransferase activity(GO:0050252) |
| 0.2 | 2.0 | GO:0044547 | DNA topoisomerase binding(GO:0044547) |
| 0.2 | 0.7 | GO:0004850 | uridine phosphorylase activity(GO:0004850) |
| 0.2 | 0.7 | GO:0019777 | Atg12 transferase activity(GO:0019777) |
| 0.2 | 1.3 | GO:0036033 | mediator complex binding(GO:0036033) |
| 0.2 | 1.9 | GO:0003726 | double-stranded RNA adenosine deaminase activity(GO:0003726) |
| 0.2 | 2.0 | GO:0046974 | histone methyltransferase activity (H3-K9 specific)(GO:0046974) |
| 0.2 | 0.8 | GO:0008534 | oxidized purine nucleobase lesion DNA N-glycosylase activity(GO:0008534) |
| 0.2 | 1.8 | GO:0015186 | L-glutamine transmembrane transporter activity(GO:0015186) |
| 0.2 | 2.7 | GO:0051525 | NFAT protein binding(GO:0051525) |
| 0.2 | 1.9 | GO:0004720 | protein-lysine 6-oxidase activity(GO:0004720) |
| 0.2 | 4.8 | GO:0008349 | MAP kinase kinase kinase kinase activity(GO:0008349) |
| 0.2 | 1.7 | GO:0034988 | Fc-gamma receptor I complex binding(GO:0034988) |
| 0.2 | 0.4 | GO:0004530 | deoxyribonuclease I activity(GO:0004530) |
| 0.2 | 6.5 | GO:0003746 | translation elongation factor activity(GO:0003746) |
| 0.2 | 2.1 | GO:0019534 | toxin transporter activity(GO:0019534) |
| 0.2 | 0.9 | GO:0046964 | 3'-phosphoadenosine 5'-phosphosulfate transmembrane transporter activity(GO:0046964) |
| 0.2 | 1.5 | GO:0003886 | DNA (cytosine-5-)-methyltransferase activity(GO:0003886) |
| 0.2 | 2.7 | GO:0032050 | clathrin heavy chain binding(GO:0032050) |
| 0.2 | 3.1 | GO:0008199 | ferric iron binding(GO:0008199) |
| 0.2 | 1.4 | GO:0061665 | SUMO ligase activity(GO:0061665) |
| 0.2 | 1.4 | GO:1990446 | U1 snRNP binding(GO:1990446) |
| 0.2 | 0.5 | GO:0034057 | RNA strand-exchange activity(GO:0034057) |
| 0.2 | 0.6 | GO:0000033 | alpha-1,3-mannosyltransferase activity(GO:0000033) |
| 0.1 | 4.5 | GO:0035925 | mRNA 3'-UTR AU-rich region binding(GO:0035925) |
| 0.1 | 1.0 | GO:0042500 | aspartic endopeptidase activity, intramembrane cleaving(GO:0042500) |
| 0.1 | 1.7 | GO:0019864 | IgG binding(GO:0019864) |
| 0.1 | 3.4 | GO:0003708 | retinoic acid receptor activity(GO:0003708) |
| 0.1 | 0.5 | GO:0052810 | 1-phosphatidylinositol-5-kinase activity(GO:0052810) |
| 0.1 | 0.4 | GO:0070717 | poly-purine tract binding(GO:0070717) |
| 0.1 | 1.2 | GO:0015319 | sodium:inorganic phosphate symporter activity(GO:0015319) |
| 0.1 | 0.5 | GO:0031826 | type 2A serotonin receptor binding(GO:0031826) |
| 0.1 | 4.7 | GO:0017056 | structural constituent of nuclear pore(GO:0017056) |
| 0.1 | 0.8 | GO:0071074 | eukaryotic initiation factor eIF2 binding(GO:0071074) |
| 0.1 | 0.7 | GO:0015119 | hexose phosphate transmembrane transporter activity(GO:0015119) organophosphate:inorganic phosphate antiporter activity(GO:0015315) hexose-phosphate:inorganic phosphate antiporter activity(GO:0015526) glucose 6-phosphate:inorganic phosphate antiporter activity(GO:0061513) |
| 0.1 | 0.9 | GO:0004301 | epoxide hydrolase activity(GO:0004301) |
| 0.1 | 1.1 | GO:0004565 | beta-galactosidase activity(GO:0004565) |
| 0.1 | 1.2 | GO:0001025 | RNA polymerase III transcription factor binding(GO:0001025) |
| 0.1 | 1.2 | GO:1990825 | sequence-specific mRNA binding(GO:1990825) |
| 0.1 | 0.6 | GO:0004814 | arginine-tRNA ligase activity(GO:0004814) |
| 0.1 | 0.4 | GO:0016154 | thymidine phosphorylase activity(GO:0009032) pyrimidine-nucleoside phosphorylase activity(GO:0016154) |
| 0.1 | 0.8 | GO:0008479 | queuine tRNA-ribosyltransferase activity(GO:0008479) |
| 0.1 | 0.6 | GO:0004666 | prostaglandin-endoperoxide synthase activity(GO:0004666) arachidonate 15-lipoxygenase activity(GO:0050473) |
| 0.1 | 0.5 | GO:0001601 | peptide YY receptor activity(GO:0001601) |
| 0.1 | 4.6 | GO:0070064 | proline-rich region binding(GO:0070064) |
| 0.1 | 1.9 | GO:0022820 | potassium:chloride symporter activity(GO:0015379) potassium ion symporter activity(GO:0022820) |
| 0.1 | 0.9 | GO:0031962 | mineralocorticoid receptor binding(GO:0031962) |
| 0.1 | 0.3 | GO:0004346 | glucose-6-phosphatase activity(GO:0004346) sugar-terminal-phosphatase activity(GO:0050309) |
| 0.1 | 1.4 | GO:0008097 | 5S rRNA binding(GO:0008097) |
| 0.1 | 0.4 | GO:0008311 | double-stranded DNA 3'-5' exodeoxyribonuclease activity(GO:0008311) |
| 0.1 | 1.0 | GO:0035500 | MH2 domain binding(GO:0035500) |
| 0.1 | 5.2 | GO:0070577 | lysine-acetylated histone binding(GO:0070577) |
| 0.1 | 25.4 | GO:0003735 | structural constituent of ribosome(GO:0003735) |
| 0.1 | 2.6 | GO:0008179 | adenylate cyclase binding(GO:0008179) |
| 0.1 | 5.2 | GO:0031492 | nucleosomal DNA binding(GO:0031492) |
| 0.1 | 0.7 | GO:0031871 | proteinase activated receptor binding(GO:0031871) |
| 0.1 | 0.8 | GO:0051032 | nucleic acid transmembrane transporter activity(GO:0051032) RNA transmembrane transporter activity(GO:0051033) |
| 0.1 | 0.3 | GO:0030617 | transforming growth factor beta receptor, inhibitory cytoplasmic mediator activity(GO:0030617) |
| 0.1 | 0.3 | GO:0043739 | G/U mismatch-specific uracil-DNA glycosylase activity(GO:0043739) |
| 0.1 | 0.2 | GO:0042975 | peroxisome proliferator activated receptor binding(GO:0042975) |
| 0.1 | 0.8 | GO:0008821 | crossover junction endodeoxyribonuclease activity(GO:0008821) |
| 0.1 | 5.0 | GO:0000983 | transcription factor activity, RNA polymerase II core promoter sequence-specific(GO:0000983) |
| 0.1 | 0.3 | GO:0004766 | spermidine synthase activity(GO:0004766) |
| 0.1 | 0.9 | GO:0008379 | thioredoxin peroxidase activity(GO:0008379) |
| 0.1 | 1.3 | GO:0031419 | cobalamin binding(GO:0031419) |
| 0.1 | 3.0 | GO:0005095 | GTPase inhibitor activity(GO:0005095) |
| 0.1 | 1.9 | GO:0043522 | leucine zipper domain binding(GO:0043522) |
| 0.1 | 1.6 | GO:0004030 | aldehyde dehydrogenase [NAD(P)+] activity(GO:0004030) |
| 0.1 | 2.6 | GO:0042609 | CD4 receptor binding(GO:0042609) |
| 0.1 | 10.9 | GO:0019213 | deacetylase activity(GO:0019213) |
| 0.1 | 0.7 | GO:0008467 | [heparan sulfate]-glucosamine 3-sulfotransferase 1 activity(GO:0008467) |
| 0.1 | 0.4 | GO:0097322 | 7SK snRNA binding(GO:0097322) |
| 0.1 | 1.9 | GO:0015250 | water channel activity(GO:0015250) |
| 0.1 | 0.5 | GO:1990460 | leptin receptor binding(GO:1990460) |
| 0.1 | 0.8 | GO:0030284 | estrogen receptor activity(GO:0030284) |
| 0.1 | 0.6 | GO:0042392 | sphingosine-1-phosphate phosphatase activity(GO:0042392) |
| 0.1 | 1.1 | GO:0036435 | K48-linked polyubiquitin binding(GO:0036435) |
| 0.1 | 1.1 | GO:0004630 | phospholipase D activity(GO:0004630) |
| 0.1 | 1.8 | GO:0005149 | interleukin-1 receptor binding(GO:0005149) |
| 0.1 | 0.3 | GO:0002135 | CTP binding(GO:0002135) |
| 0.1 | 0.7 | GO:0044020 | histone methyltransferase activity (H4-R3 specific)(GO:0044020) |
| 0.1 | 5.1 | GO:0036002 | pre-mRNA binding(GO:0036002) |
| 0.1 | 13.4 | GO:0003725 | double-stranded RNA binding(GO:0003725) |
| 0.1 | 0.4 | GO:0003976 | UDP-N-acetylglucosamine-lysosomal-enzyme N-acetylglucosaminephosphotransferase activity(GO:0003976) |
| 0.1 | 0.4 | GO:0052836 | inositol 5-diphosphate pentakisphosphate 5-kinase activity(GO:0052836) inositol diphosphate tetrakisphosphate kinase activity(GO:0052839) |
| 0.1 | 0.6 | GO:0097108 | smoothened binding(GO:0005119) hedgehog family protein binding(GO:0097108) |
| 0.1 | 1.6 | GO:0046625 | sphingolipid binding(GO:0046625) |
| 0.1 | 1.6 | GO:0010314 | phosphatidylinositol-5-phosphate binding(GO:0010314) |
| 0.1 | 4.9 | GO:0005160 | transforming growth factor beta receptor binding(GO:0005160) |
| 0.1 | 6.7 | GO:0017112 | Rab guanyl-nucleotide exchange factor activity(GO:0017112) |
| 0.1 | 3.0 | GO:0005545 | 1-phosphatidylinositol binding(GO:0005545) |
| 0.1 | 1.8 | GO:0008432 | JUN kinase binding(GO:0008432) |
| 0.1 | 2.8 | GO:0004602 | glutathione peroxidase activity(GO:0004602) |
| 0.1 | 0.7 | GO:0071535 | RING-like zinc finger domain binding(GO:0071535) |
| 0.1 | 0.8 | GO:0070087 | chromo shadow domain binding(GO:0070087) |
| 0.1 | 1.4 | GO:0005172 | vascular endothelial growth factor receptor binding(GO:0005172) |
| 0.1 | 1.3 | GO:0003996 | acyl-CoA ligase activity(GO:0003996) |
| 0.1 | 1.2 | GO:0008559 | xenobiotic-transporting ATPase activity(GO:0008559) |
| 0.1 | 0.7 | GO:0004340 | glucokinase activity(GO:0004340) hexokinase activity(GO:0004396) fructokinase activity(GO:0008865) mannokinase activity(GO:0019158) |
| 0.1 | 1.7 | GO:0015643 | toxic substance binding(GO:0015643) |
| 0.1 | 0.4 | GO:0004918 | interleukin-8 receptor activity(GO:0004918) |
| 0.1 | 5.8 | GO:0004004 | ATP-dependent RNA helicase activity(GO:0004004) |
| 0.1 | 0.3 | GO:0031208 | POZ domain binding(GO:0031208) |
| 0.1 | 0.6 | GO:0010997 | anaphase-promoting complex binding(GO:0010997) |
| 0.1 | 0.2 | GO:0015140 | malate transmembrane transporter activity(GO:0015140) |
| 0.1 | 0.3 | GO:0050501 | hyaluronan synthase activity(GO:0050501) |
| 0.1 | 0.2 | GO:0005093 | Rab GDP-dissociation inhibitor activity(GO:0005093) |
| 0.1 | 0.2 | GO:0030158 | protein xylosyltransferase activity(GO:0030158) |
| 0.1 | 0.9 | GO:0015279 | store-operated calcium channel activity(GO:0015279) |
| 0.1 | 7.4 | GO:0000980 | RNA polymerase II distal enhancer sequence-specific DNA binding(GO:0000980) |
| 0.1 | 0.3 | GO:0070579 | methylcytosine dioxygenase activity(GO:0070579) |
| 0.1 | 1.0 | GO:0043138 | 3'-5' DNA helicase activity(GO:0043138) |
| 0.1 | 0.7 | GO:0016286 | small conductance calcium-activated potassium channel activity(GO:0016286) |
| 0.1 | 0.4 | GO:0004169 | dolichyl-phosphate-mannose-protein mannosyltransferase activity(GO:0004169) |
| 0.1 | 0.3 | GO:0004461 | lactose synthase activity(GO:0004461) |
| 0.1 | 0.7 | GO:0000340 | RNA 7-methylguanosine cap binding(GO:0000340) |
| 0.1 | 0.4 | GO:1990050 | phosphatidic acid transporter activity(GO:1990050) |
| 0.1 | 0.6 | GO:0001042 | RNA polymerase I core binding(GO:0001042) |
| 0.1 | 1.3 | GO:0048156 | tau protein binding(GO:0048156) |
| 0.1 | 0.3 | GO:0005087 | Ran guanyl-nucleotide exchange factor activity(GO:0005087) |
| 0.1 | 0.6 | GO:0043995 | histone acetyltransferase activity (H4-K5 specific)(GO:0043995) histone acetyltransferase activity (H4-K8 specific)(GO:0043996) histone acetyltransferase activity (H4-K16 specific)(GO:0046972) |
| 0.1 | 0.2 | GO:0004342 | glucosamine-6-phosphate deaminase activity(GO:0004342) |
| 0.1 | 1.5 | GO:0005314 | high-affinity glutamate transmembrane transporter activity(GO:0005314) |
| 0.1 | 0.2 | GO:0015562 | efflux transmembrane transporter activity(GO:0015562) |
| 0.1 | 1.5 | GO:0043274 | phospholipase binding(GO:0043274) |
| 0.1 | 1.7 | GO:0071837 | HMG box domain binding(GO:0071837) |
| 0.1 | 0.2 | GO:0004605 | phosphatidate cytidylyltransferase activity(GO:0004605) |
| 0.1 | 0.5 | GO:0035613 | RNA stem-loop binding(GO:0035613) |
| 0.1 | 4.3 | GO:0003743 | translation initiation factor activity(GO:0003743) |
| 0.1 | 0.4 | GO:0001515 | opioid peptide activity(GO:0001515) |
| 0.1 | 1.5 | GO:0001158 | enhancer sequence-specific DNA binding(GO:0001158) |
| 0.1 | 0.4 | GO:0042289 | MHC class II protein binding(GO:0042289) |
| 0.1 | 0.7 | GO:0031995 | insulin-like growth factor II binding(GO:0031995) |
| 0.1 | 1.6 | GO:0004298 | threonine-type endopeptidase activity(GO:0004298) threonine-type peptidase activity(GO:0070003) |
| 0.1 | 0.4 | GO:1990226 | histone methyltransferase binding(GO:1990226) |
| 0.1 | 0.4 | GO:0022897 | peptide:proton symporter activity(GO:0015333) proton-dependent peptide secondary active transmembrane transporter activity(GO:0022897) |
| 0.1 | 3.2 | GO:0005154 | epidermal growth factor receptor binding(GO:0005154) |
| 0.0 | 38.0 | GO:0001228 | transcriptional activator activity, RNA polymerase II transcription regulatory region sequence-specific binding(GO:0001228) |
| 0.0 | 1.1 | GO:0008603 | cAMP-dependent protein kinase regulator activity(GO:0008603) |
| 0.0 | 3.4 | GO:0005080 | protein kinase C binding(GO:0005080) |
| 0.0 | 1.9 | GO:0051371 | muscle alpha-actinin binding(GO:0051371) |
| 0.0 | 0.4 | GO:0001849 | complement component C1q binding(GO:0001849) |
| 0.0 | 0.2 | GO:0005280 | hydrogen:amino acid symporter activity(GO:0005280) |
| 0.0 | 0.5 | GO:0004784 | superoxide dismutase activity(GO:0004784) oxidoreductase activity, acting on superoxide radicals as acceptor(GO:0016721) |
| 0.0 | 6.1 | GO:0001618 | virus receptor activity(GO:0001618) |
| 0.0 | 1.0 | GO:0001054 | RNA polymerase I activity(GO:0001054) |
| 0.0 | 0.3 | GO:0008321 | Ral guanyl-nucleotide exchange factor activity(GO:0008321) |
| 0.0 | 1.6 | GO:0042288 | MHC class I protein binding(GO:0042288) |
| 0.0 | 0.6 | GO:0022833 | mechanically-gated ion channel activity(GO:0008381) mechanically gated channel activity(GO:0022833) |
| 0.0 | 0.7 | GO:0019531 | oxalate transmembrane transporter activity(GO:0019531) |
| 0.0 | 1.5 | GO:0043539 | protein serine/threonine kinase activator activity(GO:0043539) |
| 0.0 | 0.7 | GO:0019215 | intermediate filament binding(GO:0019215) |
| 0.0 | 0.5 | GO:0070735 | protein-glycine ligase activity(GO:0070735) |
| 0.0 | 0.2 | GO:0004167 | dopachrome isomerase activity(GO:0004167) |
| 0.0 | 0.2 | GO:0016426 | tRNA (adenine) methyltransferase activity(GO:0016426) |
| 0.0 | 1.5 | GO:0004697 | protein kinase C activity(GO:0004697) |
| 0.0 | 1.5 | GO:0008026 | ATP-dependent helicase activity(GO:0008026) purine NTP-dependent helicase activity(GO:0070035) |
| 0.0 | 1.3 | GO:0080025 | phosphatidylinositol-3,5-bisphosphate binding(GO:0080025) |
| 0.0 | 0.3 | GO:0008508 | bile acid:sodium symporter activity(GO:0008508) |
| 0.0 | 2.2 | GO:0031624 | ubiquitin conjugating enzyme binding(GO:0031624) |
| 0.0 | 1.3 | GO:0016864 | protein disulfide isomerase activity(GO:0003756) intramolecular oxidoreductase activity, transposing S-S bonds(GO:0016864) |
| 0.0 | 0.3 | GO:0000403 | Y-form DNA binding(GO:0000403) |
| 0.0 | 0.3 | GO:0017162 | aryl hydrocarbon receptor binding(GO:0017162) |
| 0.0 | 0.7 | GO:0003678 | DNA helicase activity(GO:0003678) |
| 0.0 | 0.2 | GO:0008190 | eukaryotic initiation factor 4E binding(GO:0008190) |
| 0.0 | 0.3 | GO:0035252 | UDP-xylosyltransferase activity(GO:0035252) xylosyltransferase activity(GO:0042285) |
| 0.0 | 0.2 | GO:0030550 | acetylcholine receptor inhibitor activity(GO:0030550) |
| 0.0 | 0.7 | GO:0004985 | opioid receptor activity(GO:0004985) |
| 0.0 | 1.0 | GO:0008494 | translation activator activity(GO:0008494) |
| 0.0 | 0.5 | GO:0015187 | glycine transmembrane transporter activity(GO:0015187) |
| 0.0 | 0.6 | GO:0048185 | activin binding(GO:0048185) |
| 0.0 | 1.1 | GO:0008327 | methyl-CpG binding(GO:0008327) |
| 0.0 | 1.2 | GO:0019992 | diacylglycerol binding(GO:0019992) |
| 0.0 | 0.7 | GO:0048406 | nerve growth factor binding(GO:0048406) |
| 0.0 | 0.2 | GO:0097100 | supercoiled DNA binding(GO:0097100) |
| 0.0 | 2.7 | GO:0004864 | protein phosphatase inhibitor activity(GO:0004864) |
| 0.0 | 0.3 | GO:0051864 | histone demethylase activity (H3-K36 specific)(GO:0051864) |
| 0.0 | 1.1 | GO:0008510 | sodium:bicarbonate symporter activity(GO:0008510) |
| 0.0 | 0.1 | GO:0004925 | prolactin receptor activity(GO:0004925) |
| 0.0 | 0.4 | GO:0089720 | caspase binding(GO:0089720) |
| 0.0 | 14.4 | GO:0000977 | RNA polymerase II regulatory region sequence-specific DNA binding(GO:0000977) RNA polymerase II regulatory region DNA binding(GO:0001012) |
| 0.0 | 2.2 | GO:0030331 | estrogen receptor binding(GO:0030331) |
| 0.0 | 0.9 | GO:0031491 | nucleosome binding(GO:0031491) |
| 0.0 | 0.8 | GO:0042800 | histone methyltransferase activity (H3-K4 specific)(GO:0042800) |
| 0.0 | 0.9 | GO:0032266 | phosphatidylinositol-3-phosphate binding(GO:0032266) |
| 0.0 | 0.3 | GO:0005157 | macrophage colony-stimulating factor receptor binding(GO:0005157) |
| 0.0 | 0.3 | GO:0001056 | RNA polymerase III activity(GO:0001056) |
| 0.0 | 0.8 | GO:0017049 | GTP-Rho binding(GO:0017049) |
| 0.0 | 0.5 | GO:0016423 | tRNA (guanine) methyltransferase activity(GO:0016423) |
| 0.0 | 1.9 | GO:0005484 | SNAP receptor activity(GO:0005484) |
| 0.0 | 0.3 | GO:0050833 | pyruvate transmembrane transporter activity(GO:0050833) |
| 0.0 | 0.3 | GO:0005094 | Rho GDP-dissociation inhibitor activity(GO:0005094) |
| 0.0 | 1.0 | GO:0000175 | 3'-5'-exoribonuclease activity(GO:0000175) |
| 0.0 | 0.8 | GO:0001190 | transcriptional activator activity, RNA polymerase II transcription factor binding(GO:0001190) transcriptional repressor activity, RNA polymerase II activating transcription factor binding(GO:0098811) |
| 0.0 | 1.5 | GO:0005547 | phosphatidylinositol-3,4,5-trisphosphate binding(GO:0005547) |
| 0.0 | 1.3 | GO:0001078 | transcriptional repressor activity, RNA polymerase II core promoter proximal region sequence-specific binding(GO:0001078) |
| 0.0 | 1.2 | GO:0042169 | SH2 domain binding(GO:0042169) |
| 0.0 | 0.8 | GO:0015175 | neutral amino acid transmembrane transporter activity(GO:0015175) |
| 0.0 | 2.1 | GO:0001104 | RNA polymerase II transcription cofactor activity(GO:0001104) |
| 0.0 | 0.2 | GO:0004095 | carnitine O-palmitoyltransferase activity(GO:0004095) |
| 0.0 | 0.5 | GO:0008143 | poly(A) binding(GO:0008143) |
| 0.0 | 0.6 | GO:0000030 | mannosyltransferase activity(GO:0000030) |
| 0.0 | 0.1 | GO:0004853 | uroporphyrinogen decarboxylase activity(GO:0004853) |
| 0.0 | 1.0 | GO:0003705 | transcription factor activity, RNA polymerase II distal enhancer sequence-specific binding(GO:0003705) |
| 0.0 | 1.4 | GO:0008094 | DNA-dependent ATPase activity(GO:0008094) |
| 0.0 | 0.7 | GO:0022841 | potassium ion leak channel activity(GO:0022841) |
| 0.0 | 1.6 | GO:0004693 | cyclin-dependent protein serine/threonine kinase activity(GO:0004693) |
| 0.0 | 1.7 | GO:0019894 | kinesin binding(GO:0019894) |
| 0.0 | 1.2 | GO:0051959 | dynein light intermediate chain binding(GO:0051959) |
| 0.0 | 0.5 | GO:0008195 | phosphatidate phosphatase activity(GO:0008195) |
| 0.0 | 0.5 | GO:0043495 | protein anchor(GO:0043495) |
| 0.0 | 0.2 | GO:0004645 | phosphorylase activity(GO:0004645) |
| 0.0 | 20.7 | GO:0003700 | transcription factor activity, sequence-specific DNA binding(GO:0003700) |
| 0.0 | 3.4 | GO:0017048 | Rho GTPase binding(GO:0017048) |
| 0.0 | 0.4 | GO:0052650 | NADP-retinol dehydrogenase activity(GO:0052650) |
| 0.0 | 0.1 | GO:0050254 | rhodopsin kinase activity(GO:0050254) |
| 0.0 | 1.7 | GO:0005507 | copper ion binding(GO:0005507) |
| 0.0 | 3.4 | GO:0043130 | ubiquitin binding(GO:0043130) |
| 0.0 | 0.2 | GO:0003910 | DNA ligase (ATP) activity(GO:0003910) |
| 0.0 | 0.7 | GO:0003950 | NAD+ ADP-ribosyltransferase activity(GO:0003950) |
| 0.0 | 0.5 | GO:0004190 | aspartic-type endopeptidase activity(GO:0004190) |
| 0.0 | 0.1 | GO:0004692 | cGMP-dependent protein kinase activity(GO:0004692) |
| 0.0 | 0.0 | GO:0008988 | rRNA (adenine-N6-)-methyltransferase activity(GO:0008988) |
| 0.0 | 0.3 | GO:0017091 | AU-rich element binding(GO:0017091) |
| 0.0 | 0.1 | GO:0042781 | 3'-tRNA processing endoribonuclease activity(GO:0042781) |
| 0.0 | 0.7 | GO:0051879 | Hsp90 protein binding(GO:0051879) |
| 0.0 | 0.9 | GO:0005385 | zinc ion transmembrane transporter activity(GO:0005385) |
| 0.0 | 0.2 | GO:0015232 | heme transporter activity(GO:0015232) |
| 0.0 | 0.7 | GO:0097200 | cysteine-type endopeptidase activity involved in execution phase of apoptosis(GO:0097200) |
| 0.0 | 1.5 | GO:0008138 | protein tyrosine/serine/threonine phosphatase activity(GO:0008138) |
| 0.0 | 0.8 | GO:0030544 | Hsp70 protein binding(GO:0030544) |
| 0.0 | 0.4 | GO:0016884 | carbon-nitrogen ligase activity, with glutamine as amido-N-donor(GO:0016884) |
| 0.0 | 1.1 | GO:0034987 | immunoglobulin receptor binding(GO:0034987) |
| 0.0 | 1.0 | GO:0008009 | chemokine activity(GO:0008009) |
| 0.0 | 0.3 | GO:0036374 | glutathione hydrolase activity(GO:0036374) |
| 0.0 | 0.1 | GO:0034513 | box H/ACA snoRNA binding(GO:0034513) |
| 0.0 | 0.9 | GO:0004715 | non-membrane spanning protein tyrosine kinase activity(GO:0004715) |
| 0.0 | 1.1 | GO:0016209 | antioxidant activity(GO:0016209) |
| 0.0 | 0.4 | GO:0017154 | semaphorin receptor activity(GO:0017154) |
| 0.0 | 0.7 | GO:0030296 | protein tyrosine kinase activator activity(GO:0030296) |
| 0.0 | 0.0 | GO:0070039 | rRNA (guanosine-2'-O-)-methyltransferase activity(GO:0070039) |
| 0.0 | 0.2 | GO:0017034 | Rap guanyl-nucleotide exchange factor activity(GO:0017034) |
| 0.0 | 0.6 | GO:0005158 | insulin receptor binding(GO:0005158) |
| 0.0 | 0.2 | GO:0050291 | sphingosine N-acyltransferase activity(GO:0050291) |
| 0.0 | 0.4 | GO:0071889 | 14-3-3 protein binding(GO:0071889) |
| 0.0 | 0.4 | GO:0005487 | nucleocytoplasmic transporter activity(GO:0005487) |
| 0.0 | 0.6 | GO:0004386 | helicase activity(GO:0004386) |
| 0.0 | 0.5 | GO:0042162 | telomeric DNA binding(GO:0042162) |
| 0.0 | 0.2 | GO:0043395 | heparan sulfate proteoglycan binding(GO:0043395) |
| 0.0 | 1.9 | GO:0005518 | collagen binding(GO:0005518) |
| 0.0 | 0.1 | GO:0015057 | thrombin receptor activity(GO:0015057) |
| 0.0 | 0.8 | GO:0005070 | SH3/SH2 adaptor activity(GO:0005070) |
| 0.0 | 0.1 | GO:0001594 | trace-amine receptor activity(GO:0001594) |
| 0.0 | 0.1 | GO:0000182 | rDNA binding(GO:0000182) |
| 0.0 | 1.4 | GO:0003714 | transcription corepressor activity(GO:0003714) |
| 0.0 | 2.5 | GO:0003682 | chromatin binding(GO:0003682) |
| 0.0 | 0.1 | GO:0002161 | aminoacyl-tRNA editing activity(GO:0002161) |
| 0.0 | 0.1 | GO:0004571 | mannosyl-oligosaccharide 1,2-alpha-mannosidase activity(GO:0004571) |
| 0.0 | 2.0 | GO:0017124 | SH3 domain binding(GO:0017124) |
Gene overrepresentation in curated gene sets: canonical pathways category:
| Log-likelihood per target | Total log-likelihood | Term | Description |
|---|---|---|---|
| 0.9 | 19.0 | SA REG CASCADE OF CYCLIN EXPR | Expression of cyclins regulates progression through the cell cycle by activating cyclin-dependent kinases. |
| 0.3 | 8.5 | SA PROGRAMMED CELL DEATH | Programmed cell death, or apoptosis, eliminates damaged or unneeded cells. |
| 0.2 | 0.4 | PID RANBP2 PATHWAY | Sumoylation by RanBP2 regulates transcriptional repression |
| 0.2 | 5.4 | PID HIF1A PATHWAY | Hypoxic and oxygen homeostasis regulation of HIF-1-alpha |
| 0.2 | 7.9 | PID BETA CATENIN DEG PATHWAY | Degradation of beta catenin |
| 0.2 | 11.8 | PID CD40 PATHWAY | CD40/CD40L signaling |
| 0.1 | 0.8 | SA G2 AND M PHASES | Cdc25 activates the cdc2/cyclin B complex to induce the G2/M transition. |
| 0.1 | 6.6 | PID FOXM1 PATHWAY | FOXM1 transcription factor network |
| 0.1 | 5.7 | PID HIF2PATHWAY | HIF-2-alpha transcription factor network |
| 0.1 | 1.4 | PID VEGF VEGFR PATHWAY | VEGF and VEGFR signaling network |
| 0.1 | 16.8 | PID MYC ACTIV PATHWAY | Validated targets of C-MYC transcriptional activation |
| 0.1 | 8.1 | PID ATR PATHWAY | ATR signaling pathway |
| 0.1 | 6.0 | ST ERK1 ERK2 MAPK PATHWAY | ERK1/ERK2 MAPK Pathway |
| 0.1 | 1.2 | SA G1 AND S PHASES | Cdk2, 4, and 6 bind cyclin D in G1, while cdk2/cyclin E promotes the G1/S transition. |
| 0.1 | 16.1 | PID AR PATHWAY | Coregulation of Androgen receptor activity |
| 0.1 | 3.8 | ST P38 MAPK PATHWAY | p38 MAPK Pathway |
| 0.1 | 3.4 | PID RETINOIC ACID PATHWAY | Retinoic acid receptors-mediated signaling |
| 0.1 | 2.0 | PID THROMBIN PAR4 PATHWAY | PAR4-mediated thrombin signaling events |
| 0.1 | 1.9 | PID ERB GENOMIC PATHWAY | Validated nuclear estrogen receptor beta network |
| 0.1 | 2.2 | PID TCR CALCIUM PATHWAY | Calcium signaling in the CD4+ TCR pathway |
| 0.1 | 3.6 | PID AP1 PATHWAY | AP-1 transcription factor network |
| 0.1 | 4.9 | PID AR TF PATHWAY | Regulation of Androgen receptor activity |
| 0.1 | 3.7 | PID IL2 1PATHWAY | IL2-mediated signaling events |
| 0.1 | 4.6 | PID FRA PATHWAY | Validated transcriptional targets of AP1 family members Fra1 and Fra2 |
| 0.1 | 1.4 | PID CIRCADIAN PATHWAY | Circadian rhythm pathway |
| 0.1 | 3.0 | PID SYNDECAN 2 PATHWAY | Syndecan-2-mediated signaling events |
| 0.1 | 5.5 | PID TGFBR PATHWAY | TGF-beta receptor signaling |
| 0.1 | 6.6 | PID IL4 2PATHWAY | IL4-mediated signaling events |
| 0.1 | 0.8 | PID VEGFR1 PATHWAY | VEGFR1 specific signals |
| 0.1 | 3.6 | PID BMP PATHWAY | BMP receptor signaling |
| 0.1 | 6.1 | PID ILK PATHWAY | Integrin-linked kinase signaling |
| 0.1 | 1.2 | PID SYNDECAN 3 PATHWAY | Syndecan-3-mediated signaling events |
| 0.1 | 0.5 | SA B CELL RECEPTOR COMPLEXES | Antigen binding to B cell receptors activates protein tyrosine kinases, such as the Src family, which ultimate activate MAP kinases. |
| 0.0 | 3.9 | PID RAC1 PATHWAY | RAC1 signaling pathway |
| 0.0 | 17.0 | NABA ECM REGULATORS | Genes encoding enzymes and their regulators involved in the remodeling of the extracellular matrix |
| 0.0 | 1.5 | PID PRL SIGNALING EVENTS PATHWAY | Signaling events mediated by PRL |
| 0.0 | 2.7 | PID RB 1PATHWAY | Regulation of retinoblastoma protein |
| 0.0 | 7.4 | PID P53 DOWNSTREAM PATHWAY | Direct p53 effectors |
| 0.0 | 2.0 | PID HDAC CLASSII PATHWAY | Signaling events mediated by HDAC Class II |
| 0.0 | 1.7 | PID WNT NONCANONICAL PATHWAY | Noncanonical Wnt signaling pathway |
| 0.0 | 3.4 | WNT SIGNALING | Genes related to Wnt-mediated signal transduction |
| 0.0 | 0.7 | PID ALK1 PATHWAY | ALK1 signaling events |
| 0.0 | 2.1 | PID ARF6 PATHWAY | Arf6 signaling events |
| 0.0 | 1.7 | PID HES HEY PATHWAY | Notch-mediated HES/HEY network |
| 0.0 | 1.2 | PID AMB2 NEUTROPHILS PATHWAY | amb2 Integrin signaling |
| 0.0 | 1.9 | PID IL12 2PATHWAY | IL12-mediated signaling events |
| 0.0 | 1.6 | PID ECADHERIN STABILIZATION PATHWAY | Stabilization and expansion of the E-cadherin adherens junction |
| 0.0 | 1.8 | PID PTP1B PATHWAY | Signaling events mediated by PTP1B |
| 0.0 | 0.9 | PID ATM PATHWAY | ATM pathway |
| 0.0 | 0.2 | PID IL2 PI3K PATHWAY | IL2 signaling events mediated by PI3K |
| 0.0 | 1.2 | PID HDAC CLASSI PATHWAY | Signaling events mediated by HDAC Class I |
| 0.0 | 1.4 | PID E2F PATHWAY | E2F transcription factor network |
| 0.0 | 1.1 | ST GA12 PATHWAY | G alpha 12 Pathway |
| 0.0 | 0.2 | ST TYPE I INTERFERON PATHWAY | Type I Interferon (alpha/beta IFN) Pathway |
| 0.0 | 1.3 | PID PLK1 PATHWAY | PLK1 signaling events |
| 0.0 | 0.8 | PID P53 REGULATION PATHWAY | p53 pathway |
| 0.0 | 1.2 | PID HEDGEHOG GLI PATHWAY | Hedgehog signaling events mediated by Gli proteins |
| 0.0 | 0.2 | PID PDGFRA PATHWAY | PDGFR-alpha signaling pathway |
| 0.0 | 1.1 | PID SMAD2 3NUCLEAR PATHWAY | Regulation of nuclear SMAD2/3 signaling |
| 0.0 | 0.9 | PID CD8 TCR PATHWAY | TCR signaling in naïve CD8+ T cells |
| 0.0 | 0.6 | PID INTEGRIN CS PATHWAY | Integrin family cell surface interactions |
| 0.0 | 0.2 | SIG CHEMOTAXIS | Genes related to chemotaxis |
| 0.0 | 0.7 | PID TAP63 PATHWAY | Validated transcriptional targets of TAp63 isoforms |
| 0.0 | 0.5 | PID THROMBIN PAR1 PATHWAY | PAR1-mediated thrombin signaling events |
| 0.0 | 0.4 | PID RET PATHWAY | Signaling events regulated by Ret tyrosine kinase |
| 0.0 | 0.7 | PID INTEGRIN A4B1 PATHWAY | Alpha4 beta1 integrin signaling events |
| 0.0 | 1.6 | PID RHOA REG PATHWAY | Regulation of RhoA activity |
| 0.0 | 0.4 | PID INSULIN PATHWAY | Insulin Pathway |
| 0.0 | 0.3 | PID ATF2 PATHWAY | ATF-2 transcription factor network |
| 0.0 | 0.5 | ST WNT BETA CATENIN PATHWAY | Wnt/beta-catenin Pathway |
| 0.0 | 0.3 | SIG INSULIN RECEPTOR PATHWAY IN CARDIAC MYOCYTES | Genes related to the insulin receptor pathway |
| 0.0 | 0.2 | PID FAK PATHWAY | Signaling events mediated by focal adhesion kinase |
| 0.0 | 0.7 | PID TRKR PATHWAY | Neurotrophic factor-mediated Trk receptor signaling |
Gene overrepresentation in curated gene sets: REACTOME pathways category:
| Log-likelihood per target | Total log-likelihood | Term | Description |
|---|---|---|---|
| 0.7 | 12.5 | REACTOME ETHANOL OXIDATION | Genes involved in Ethanol oxidation |
| 0.5 | 19.2 | REACTOME SIGNALING BY HIPPO | Genes involved in Signaling by Hippo |
| 0.4 | 18.7 | REACTOME MEIOTIC RECOMBINATION | Genes involved in Meiotic Recombination |
| 0.3 | 3.2 | REACTOME REGULATION OF THE FANCONI ANEMIA PATHWAY | Genes involved in Regulation of the Fanconi anemia pathway |
| 0.3 | 3.3 | REACTOME KERATAN SULFATE DEGRADATION | Genes involved in Keratan sulfate degradation |
| 0.3 | 40.2 | REACTOME PEPTIDE CHAIN ELONGATION | Genes involved in Peptide chain elongation |
| 0.2 | 3.6 | REACTOME UNWINDING OF DNA | Genes involved in Unwinding of DNA |
| 0.2 | 11.4 | REACTOME NEGATIVE REGULATORS OF RIG I MDA5 SIGNALING | Genes involved in Negative regulators of RIG-I/MDA5 signaling |
| 0.2 | 5.1 | REACTOME FORMATION OF THE TERNARY COMPLEX AND SUBSEQUENTLY THE 43S COMPLEX | Genes involved in Formation of the ternary complex, and subsequently, the 43S complex |
| 0.2 | 3.1 | REACTOME CALNEXIN CALRETICULIN CYCLE | Genes involved in Calnexin/calreticulin cycle |
| 0.2 | 6.6 | REACTOME OXYGEN DEPENDENT PROLINE HYDROXYLATION OF HYPOXIA INDUCIBLE FACTOR ALPHA | Genes involved in Oxygen-dependent Proline Hydroxylation of Hypoxia-inducible Factor Alpha |
| 0.2 | 13.0 | REACTOME GLYCOSPHINGOLIPID METABOLISM | Genes involved in Glycosphingolipid metabolism |
| 0.2 | 9.0 | REACTOME INTRINSIC PATHWAY FOR APOPTOSIS | Genes involved in Intrinsic Pathway for Apoptosis |
| 0.1 | 5.5 | REACTOME THROMBOXANE SIGNALLING THROUGH TP RECEPTOR | Genes involved in Thromboxane signalling through TP receptor |
| 0.1 | 2.8 | REACTOME PURINE CATABOLISM | Genes involved in Purine catabolism |
| 0.1 | 4.7 | REACTOME DESTABILIZATION OF MRNA BY KSRP | Genes involved in Destabilization of mRNA by KSRP |
| 0.1 | 2.4 | REACTOME ELONGATION ARREST AND RECOVERY | Genes involved in Elongation arrest and recovery |
| 0.1 | 5.4 | REACTOME SIGNALING BY NODAL | Genes involved in Signaling by NODAL |
| 0.1 | 2.4 | REACTOME METABOLISM OF POLYAMINES | Genes involved in Metabolism of polyamines |
| 0.1 | 6.5 | REACTOME GROWTH HORMONE RECEPTOR SIGNALING | Genes involved in Growth hormone receptor signaling |
| 0.1 | 1.9 | REACTOME PASSIVE TRANSPORT BY AQUAPORINS | Genes involved in Passive Transport by Aquaporins |
| 0.1 | 2.6 | REACTOME 3 UTR MEDIATED TRANSLATIONAL REGULATION | Genes involved in 3' -UTR-mediated translational regulation |
| 0.1 | 17.6 | REACTOME MRNA SPLICING | Genes involved in mRNA Splicing |
| 0.1 | 0.7 | REACTOME G ALPHA Z SIGNALLING EVENTS | Genes involved in G alpha (z) signalling events |
| 0.1 | 3.2 | REACTOME BIOSYNTHESIS OF THE N GLYCAN PRECURSOR DOLICHOL LIPID LINKED OLIGOSACCHARIDE LLO AND TRANSFER TO A NASCENT PROTEIN | Genes involved in Biosynthesis of the N-glycan precursor (dolichol lipid-linked oligosaccharide, LLO) and transfer to a nascent protein |
| 0.1 | 5.2 | REACTOME INTERACTIONS OF VPR WITH HOST CELLULAR PROTEINS | Genes involved in Interactions of Vpr with host cellular proteins |
| 0.1 | 1.0 | REACTOME PYRIMIDINE CATABOLISM | Genes involved in Pyrimidine catabolism |
| 0.1 | 1.7 | REACTOME METABOLISM OF NON CODING RNA | Genes involved in Metabolism of non-coding RNA |
| 0.1 | 6.0 | REACTOME MEIOSIS | Genes involved in Meiosis |
| 0.1 | 2.2 | REACTOME SYNTHESIS SECRETION AND INACTIVATION OF GIP | Genes involved in Synthesis, Secretion, and Inactivation of Glucose-dependent Insulinotropic Polypeptide (GIP) |
| 0.1 | 1.5 | REACTOME BASE FREE SUGAR PHOSPHATE REMOVAL VIA THE SINGLE NUCLEOTIDE REPLACEMENT PATHWAY | Genes involved in Base-free sugar-phosphate removal via the single-nucleotide replacement pathway |
| 0.1 | 2.7 | REACTOME RNA POL I TRANSCRIPTION INITIATION | Genes involved in RNA Polymerase I Transcription Initiation |
| 0.1 | 2.6 | REACTOME SEMA3A PAK DEPENDENT AXON REPULSION | Genes involved in Sema3A PAK dependent Axon repulsion |
| 0.1 | 9.4 | REACTOME NUCLEAR RECEPTOR TRANSCRIPTION PATHWAY | Genes involved in Nuclear Receptor transcription pathway |
| 0.1 | 0.5 | REACTOME TRAF3 DEPENDENT IRF ACTIVATION PATHWAY | Genes involved in TRAF3-dependent IRF activation pathway |
| 0.1 | 1.4 | REACTOME VEGF LIGAND RECEPTOR INTERACTIONS | Genes involved in VEGF ligand-receptor interactions |
| 0.1 | 2.0 | REACTOME METABOLISM OF PORPHYRINS | Genes involved in Metabolism of porphyrins |
| 0.1 | 0.2 | REACTOME RESOLUTION OF AP SITES VIA THE SINGLE NUCLEOTIDE REPLACEMENT PATHWAY | Genes involved in Resolution of AP sites via the single-nucleotide replacement pathway |
| 0.1 | 2.9 | REACTOME G2 M CHECKPOINTS | Genes involved in G2/M Checkpoints |
| 0.1 | 1.2 | REACTOME GLUCOSE TRANSPORT | Genes involved in Glucose transport |
| 0.1 | 0.6 | REACTOME MEMBRANE BINDING AND TARGETTING OF GAG PROTEINS | Genes involved in Membrane binding and targetting of GAG proteins |
| 0.1 | 0.6 | REACTOME CYCLIN A B1 ASSOCIATED EVENTS DURING G2 M TRANSITION | Genes involved in Cyclin A/B1 associated events during G2/M transition |
| 0.1 | 0.7 | REACTOME GLYCOPROTEIN HORMONES | Genes involved in Glycoprotein hormones |
| 0.1 | 0.1 | REACTOME MRNA DECAY BY 3 TO 5 EXORIBONUCLEASE | Genes involved in mRNA Decay by 3' to 5' Exoribonuclease |
| 0.1 | 1.7 | REACTOME HS GAG DEGRADATION | Genes involved in HS-GAG degradation |
| 0.1 | 1.6 | REACTOME SYNTHESIS OF GLYCOSYLPHOSPHATIDYLINOSITOL GPI | Genes involved in Synthesis of glycosylphosphatidylinositol (GPI) |
| 0.1 | 1.9 | REACTOME ZINC TRANSPORTERS | Genes involved in Zinc transporters |
| 0.1 | 5.4 | REACTOME INTERFERON ALPHA BETA SIGNALING | Genes involved in Interferon alpha/beta signaling |
| 0.1 | 6.0 | REACTOME AMINO ACID AND OLIGOPEPTIDE SLC TRANSPORTERS | Genes involved in Amino acid and oligopeptide SLC transporters |
| 0.1 | 2.4 | REACTOME BMAL1 CLOCK NPAS2 ACTIVATES CIRCADIAN EXPRESSION | Genes involved in BMAL1:CLOCK/NPAS2 Activates Circadian Expression |
| 0.1 | 1.2 | REACTOME INITIAL TRIGGERING OF COMPLEMENT | Genes involved in Initial triggering of complement |
| 0.0 | 4.9 | REACTOME TRANSPORT OF INORGANIC CATIONS ANIONS AND AMINO ACIDS OLIGOPEPTIDES | Genes involved in Transport of inorganic cations/anions and amino acids/oligopeptides |
| 0.0 | 3.2 | REACTOME TRANSLATION | Genes involved in Translation |
| 0.0 | 1.5 | REACTOME GLYCOGEN BREAKDOWN GLYCOGENOLYSIS | Genes involved in Glycogen breakdown (glycogenolysis) |
| 0.0 | 4.5 | REACTOME CYCLIN E ASSOCIATED EVENTS DURING G1 S TRANSITION | Genes involved in Cyclin E associated events during G1/S transition |
| 0.0 | 1.9 | REACTOME HORMONE SENSITIVE LIPASE HSL MEDIATED TRIACYLGLYCEROL HYDROLYSIS | Genes involved in Hormone-sensitive lipase (HSL)-mediated triacylglycerol hydrolysis |
| 0.0 | 1.0 | REACTOME ACTIVATION OF RAC | Genes involved in Activation of Rac |
| 0.0 | 1.4 | REACTOME SMAD2 SMAD3 SMAD4 HETEROTRIMER REGULATES TRANSCRIPTION | Genes involved in SMAD2/SMAD3:SMAD4 heterotrimer regulates transcription |
| 0.0 | 0.0 | REACTOME NEP NS2 INTERACTS WITH THE CELLULAR EXPORT MACHINERY | Genes involved in NEP/NS2 Interacts with the Cellular Export Machinery |
| 0.0 | 0.6 | REACTOME THROMBIN SIGNALLING THROUGH PROTEINASE ACTIVATED RECEPTORS PARS | Genes involved in Thrombin signalling through proteinase activated receptors (PARs) |
| 0.0 | 0.3 | REACTOME ADP SIGNALLING THROUGH P2RY12 | Genes involved in ADP signalling through P2Y purinoceptor 12 |
| 0.0 | 0.8 | REACTOME AKT PHOSPHORYLATES TARGETS IN THE CYTOSOL | Genes involved in AKT phosphorylates targets in the cytosol |
| 0.0 | 0.6 | REACTOME SIGNALING BY PDGF | Genes involved in Signaling by PDGF |
| 0.0 | 0.9 | REACTOME HS GAG BIOSYNTHESIS | Genes involved in HS-GAG biosynthesis |
| 0.0 | 0.5 | REACTOME REGULATION OF GENE EXPRESSION IN BETA CELLS | Genes involved in Regulation of gene expression in beta cells |
| 0.0 | 0.8 | REACTOME PROTEOLYTIC CLEAVAGE OF SNARE COMPLEX PROTEINS | Genes involved in Proteolytic cleavage of SNARE complex proteins |
| 0.0 | 1.0 | REACTOME ACTIVATED NOTCH1 TRANSMITS SIGNAL TO THE NUCLEUS | Genes involved in Activated NOTCH1 Transmits Signal to the Nucleus |
| 0.0 | 1.1 | REACTOME G1 PHASE | Genes involved in G1 Phase |
| 0.0 | 1.1 | REACTOME APC C CDC20 MEDIATED DEGRADATION OF MITOTIC PROTEINS | Genes involved in APC/C:Cdc20 mediated degradation of mitotic proteins |
| 0.0 | 1.1 | REACTOME CELL EXTRACELLULAR MATRIX INTERACTIONS | Genes involved in Cell-extracellular matrix interactions |
| 0.0 | 0.8 | REACTOME DEPOSITION OF NEW CENPA CONTAINING NUCLEOSOMES AT THE CENTROMERE | Genes involved in Deposition of New CENPA-containing Nucleosomes at the Centromere |
| 0.0 | 1.1 | REACTOME DARPP 32 EVENTS | Genes involved in DARPP-32 events |
| 0.0 | 0.5 | REACTOME REGULATORY RNA PATHWAYS | Genes involved in Regulatory RNA pathways |
| 0.0 | 0.3 | REACTOME COPI MEDIATED TRANSPORT | Genes involved in COPI Mediated Transport |
| 0.0 | 0.6 | REACTOME TGF BETA RECEPTOR SIGNALING IN EMT EPITHELIAL TO MESENCHYMAL TRANSITION | Genes involved in TGF-beta receptor signaling in EMT (epithelial to mesenchymal transition) |
| 0.0 | 0.6 | REACTOME HIGHLY CALCIUM PERMEABLE POSTSYNAPTIC NICOTINIC ACETYLCHOLINE RECEPTORS | Genes involved in Highly calcium permeable postsynaptic nicotinic acetylcholine receptors |
| 0.0 | 0.7 | REACTOME REGULATION OF INSULIN LIKE GROWTH FACTOR IGF ACTIVITY BY INSULIN LIKE GROWTH FACTOR BINDING PROTEINS IGFBPS | Genes involved in Regulation of Insulin-like Growth Factor (IGF) Activity by Insulin-like Growth Factor Binding Proteins (IGFBPs) |
| 0.0 | 1.6 | REACTOME NETRIN1 SIGNALING | Genes involved in Netrin-1 signaling |
| 0.0 | 1.2 | REACTOME ABC FAMILY PROTEINS MEDIATED TRANSPORT | Genes involved in ABC-family proteins mediated transport |
| 0.0 | 1.0 | REACTOME EFFECTS OF PIP2 HYDROLYSIS | Genes involved in Effects of PIP2 hydrolysis |
| 0.0 | 0.8 | REACTOME SYNTHESIS AND INTERCONVERSION OF NUCLEOTIDE DI AND TRIPHOSPHATES | Genes involved in Synthesis and interconversion of nucleotide di- and triphosphates |
| 0.0 | 0.5 | REACTOME SYNTHESIS OF PE | Genes involved in Synthesis of PE |
| 0.0 | 0.3 | REACTOME ALPHA LINOLENIC ACID ALA METABOLISM | Genes involved in alpha-linolenic acid (ALA) metabolism |
| 0.0 | 0.3 | REACTOME BILE SALT AND ORGANIC ANION SLC TRANSPORTERS | Genes involved in Bile salt and organic anion SLC transporters |
| 0.0 | 1.6 | REACTOME MITOTIC PROMETAPHASE | Genes involved in Mitotic Prometaphase |
| 0.0 | 0.8 | REACTOME TIGHT JUNCTION INTERACTIONS | Genes involved in Tight junction interactions |
| 0.0 | 1.6 | REACTOME TRANSCRIPTIONAL REGULATION OF WHITE ADIPOCYTE DIFFERENTIATION | Genes involved in Transcriptional Regulation of White Adipocyte Differentiation |
| 0.0 | 0.4 | REACTOME SIGNAL REGULATORY PROTEIN SIRP FAMILY INTERACTIONS | Genes involved in Signal regulatory protein (SIRP) family interactions |
| 0.0 | 0.1 | REACTOME INFLUENZA VIRAL RNA TRANSCRIPTION AND REPLICATION | Genes involved in Influenza Viral RNA Transcription and Replication |
| 0.0 | 1.1 | REACTOME SIGNALING BY NOTCH1 | Genes involved in Signaling by NOTCH1 |
| 0.0 | 0.4 | REACTOME INSULIN SYNTHESIS AND PROCESSING | Genes involved in Insulin Synthesis and Processing |
| 0.0 | 0.4 | REACTOME ENDOSOMAL SORTING COMPLEX REQUIRED FOR TRANSPORT ESCRT | Genes involved in Endosomal Sorting Complex Required For Transport (ESCRT) |
| 0.0 | 0.3 | REACTOME HDL MEDIATED LIPID TRANSPORT | Genes involved in HDL-mediated lipid transport |
| 0.0 | 1.3 | REACTOME NRAGE SIGNALS DEATH THROUGH JNK | Genes involved in NRAGE signals death through JNK |
| 0.0 | 0.3 | REACTOME HYALURONAN METABOLISM | Genes involved in Hyaluronan metabolism |
| 0.0 | 0.3 | REACTOME N GLYCAN ANTENNAE ELONGATION | Genes involved in N-Glycan antennae elongation |