Project
Illumina Body Map 2 (GSE30611)
Navigation
Downloads
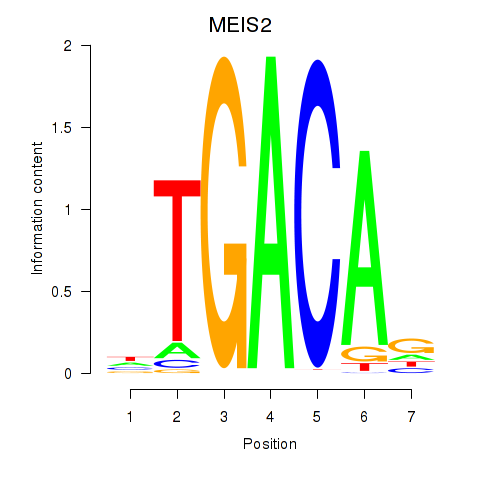
Results for MEIS2
Z-value: 2.44
Motif logo
Transcription factors associated with MEIS2
| Gene Symbol | Gene ID | Gene Info |
|---|---|---|
|
MEIS2
|
ENSG00000134138.20 | Meis homeobox 2 |
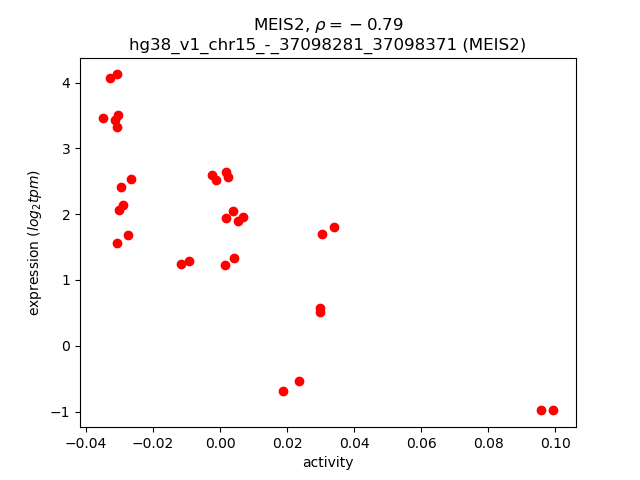
Activity-expression correlation:
| Gene | Promoter | Pearson corr. coef. | P-value | Plot |
|---|---|---|---|---|
| MEIS2 | hg38_v1_chr15_-_37098281_37098371 | -0.79 | 9.0e-08 | Click! |
Activity profile of MEIS2 motif
Sorted Z-values of MEIS2 motif
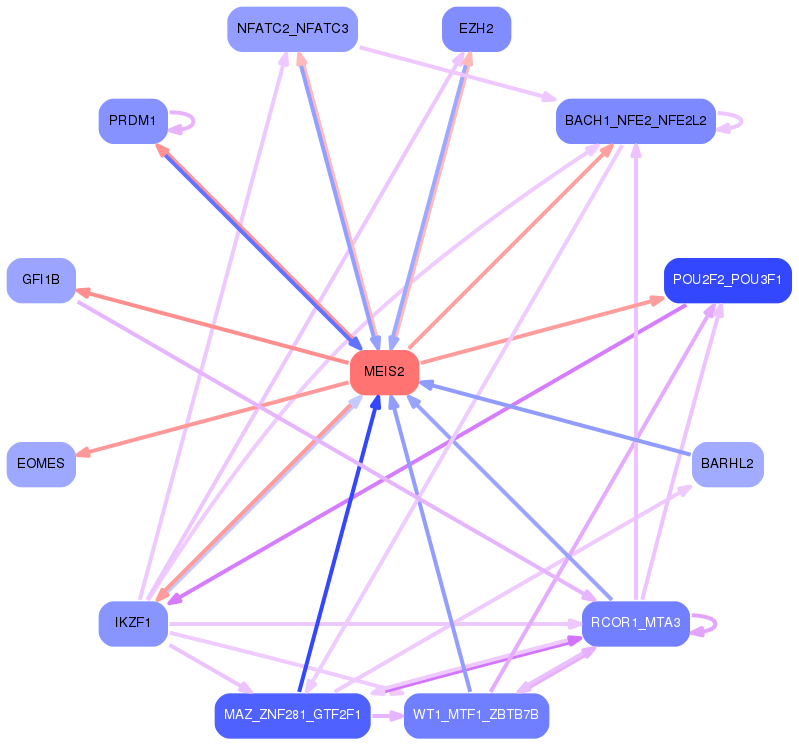
Network of associatons between targets according to the STRING database.

First level regulatory network of MEIS2
Gene Ontology Analysis
Gene overrepresentation in biological process category:
| Log-likelihood per target | Total log-likelihood | Term | Description |
|---|---|---|---|
| 2.8 | 8.5 | GO:0071613 | granzyme B production(GO:0071613) regulation of granzyme B production(GO:0071661) positive regulation of granzyme B production(GO:0071663) |
| 2.4 | 12.1 | GO:0032796 | uropod organization(GO:0032796) |
| 2.3 | 7.0 | GO:0002728 | negative regulation of natural killer cell cytokine production(GO:0002728) |
| 2.1 | 6.2 | GO:0033364 | mast cell secretory granule organization(GO:0033364) |
| 2.0 | 6.1 | GO:0002752 | cell surface pattern recognition receptor signaling pathway(GO:0002752) |
| 1.9 | 5.8 | GO:0001812 | positive regulation of type I hypersensitivity(GO:0001812) |
| 1.9 | 5.8 | GO:0035744 | T-helper 1 cell cytokine production(GO:0035744) |
| 1.7 | 6.9 | GO:1990108 | protein linear deubiquitination(GO:1990108) |
| 1.7 | 5.0 | GO:2000523 | regulation of T cell costimulation(GO:2000523) positive regulation of T cell costimulation(GO:2000525) |
| 1.6 | 9.7 | GO:1903904 | negative regulation of establishment of T cell polarity(GO:1903904) negative regulation of Rho guanyl-nucleotide exchange factor activity(GO:2001107) |
| 1.5 | 1.5 | GO:0032701 | negative regulation of interleukin-18 production(GO:0032701) |
| 1.5 | 3.0 | GO:0060559 | positive regulation of vitamin metabolic process(GO:0046136) positive regulation of vitamin D biosynthetic process(GO:0060557) positive regulation of calcidiol 1-monooxygenase activity(GO:0060559) |
| 1.5 | 4.5 | GO:0002380 | immunoglobulin secretion involved in immune response(GO:0002380) |
| 1.5 | 4.5 | GO:0002302 | CD8-positive, alpha-beta T cell differentiation involved in immune response(GO:0002302) |
| 1.5 | 5.9 | GO:0045065 | cytotoxic T cell differentiation(GO:0045065) |
| 1.5 | 4.5 | GO:1904266 | positive regulation of Schwann cell migration(GO:1900149) regulation of Schwann cell chemotaxis(GO:1904266) positive regulation of Schwann cell chemotaxis(GO:1904268) Schwann cell chemotaxis(GO:1990751) |
| 1.5 | 7.3 | GO:2000473 | regulation of hematopoietic stem cell migration(GO:2000471) positive regulation of hematopoietic stem cell migration(GO:2000473) |
| 1.4 | 4.3 | GO:0032761 | negative regulation of T cell tolerance induction(GO:0002665) negative regulation of T cell anergy(GO:0002668) negative regulation of lymphocyte anergy(GO:0002912) regulation of lymphotoxin A production(GO:0032681) positive regulation of lymphotoxin A production(GO:0032761) regulation of lymphotoxin A biosynthetic process(GO:0043016) positive regulation of lymphotoxin A biosynthetic process(GO:0043017) |
| 1.4 | 4.2 | GO:1990654 | sebum secreting cell proliferation(GO:1990654) |
| 1.4 | 9.5 | GO:0070269 | pyroptosis(GO:0070269) |
| 1.3 | 4.0 | GO:0061485 | memory T cell proliferation(GO:0061485) |
| 1.3 | 3.9 | GO:0006711 | estrogen catabolic process(GO:0006711) |
| 1.3 | 3.9 | GO:0002277 | myeloid dendritic cell activation involved in immune response(GO:0002277) |
| 1.2 | 3.7 | GO:0002432 | granuloma formation(GO:0002432) |
| 1.2 | 2.4 | GO:0035915 | pore formation in membrane of other organism(GO:0035915) |
| 1.2 | 3.5 | GO:0035397 | helper T cell enhancement of adaptive immune response(GO:0035397) |
| 1.2 | 5.9 | GO:0015855 | pyrimidine nucleobase transport(GO:0015855) purine nucleobase transmembrane transport(GO:1904823) |
| 1.2 | 3.5 | GO:0002503 | peptide antigen assembly with MHC class II protein complex(GO:0002503) |
| 1.1 | 1.1 | GO:1902214 | regulation of interleukin-4-mediated signaling pathway(GO:1902214) |
| 1.1 | 3.3 | GO:0019417 | sulfur oxidation(GO:0019417) |
| 1.1 | 3.3 | GO:0006844 | acyl carnitine transport(GO:0006844) acyl carnitine transmembrane transport(GO:1902616) |
| 1.1 | 7.5 | GO:0002925 | positive regulation of humoral immune response mediated by circulating immunoglobulin(GO:0002925) |
| 1.1 | 5.3 | GO:0071596 | ubiquitin-dependent protein catabolic process via the N-end rule pathway(GO:0071596) |
| 1.0 | 3.1 | GO:0019442 | tryptophan catabolic process to acetyl-CoA(GO:0019442) |
| 1.0 | 3.1 | GO:0002305 | gamma-delta intraepithelial T cell differentiation(GO:0002304) CD8-positive, gamma-delta intraepithelial T cell differentiation(GO:0002305) |
| 1.0 | 7.9 | GO:0046061 | dATP catabolic process(GO:0046061) |
| 1.0 | 4.0 | GO:0006740 | NADPH regeneration(GO:0006740) |
| 1.0 | 3.0 | GO:0003168 | Purkinje myocyte differentiation(GO:0003168) cardiac pacemaker cell fate commitment(GO:0060927) atrioventricular node cell fate commitment(GO:0060929) |
| 1.0 | 15.7 | GO:0002291 | T cell activation via T cell receptor contact with antigen bound to MHC molecule on antigen presenting cell(GO:0002291) |
| 1.0 | 4.9 | GO:0050902 | leukocyte adhesive activation(GO:0050902) |
| 1.0 | 17.5 | GO:0002517 | T cell tolerance induction(GO:0002517) |
| 1.0 | 2.9 | GO:0044725 | chromatin reprogramming in the zygote(GO:0044725) |
| 0.9 | 5.7 | GO:0060335 | positive regulation of response to interferon-gamma(GO:0060332) positive regulation of interferon-gamma-mediated signaling pathway(GO:0060335) |
| 0.9 | 3.7 | GO:1902023 | L-arginine import(GO:0043091) arginine import(GO:0090467) L-arginine transport(GO:1902023) |
| 0.9 | 2.7 | GO:0034130 | toll-like receptor 1 signaling pathway(GO:0034130) |
| 0.9 | 3.6 | GO:0030886 | negative regulation of myeloid dendritic cell activation(GO:0030886) |
| 0.9 | 5.4 | GO:0060370 | susceptibility to T cell mediated cytotoxicity(GO:0060370) |
| 0.9 | 3.5 | GO:0035606 | peptidyl-cysteine S-trans-nitrosylation(GO:0035606) |
| 0.9 | 7.0 | GO:2000660 | negative regulation of interleukin-1-mediated signaling pathway(GO:2000660) |
| 0.9 | 4.3 | GO:0038043 | interleukin-5-mediated signaling pathway(GO:0038043) |
| 0.9 | 6.9 | GO:1903433 | regulation of constitutive secretory pathway(GO:1903433) |
| 0.8 | 3.4 | GO:0002881 | negative regulation of chronic inflammatory response to non-antigenic stimulus(GO:0002881) |
| 0.8 | 5.7 | GO:0032621 | interleukin-18 production(GO:0032621) |
| 0.8 | 0.8 | GO:0097680 | double-strand break repair via classical nonhomologous end joining(GO:0097680) |
| 0.8 | 2.4 | GO:1904887 | regulation of thioredoxin peroxidase activity(GO:1903123) negative regulation of thioredoxin peroxidase activity(GO:1903124) negative regulation of thioredoxin peroxidase activity by peptidyl-threonine phosphorylation(GO:1903125) Wnt signalosome assembly(GO:1904887) negative regulation of peroxidase activity(GO:2000469) |
| 0.8 | 2.4 | GO:1902948 | regulation of choline O-acetyltransferase activity(GO:1902769) positive regulation of choline O-acetyltransferase activity(GO:1902771) negative regulation of tau-protein kinase activity(GO:1902948) positive regulation of early endosome to recycling endosome transport(GO:1902955) negative regulation of aspartic-type endopeptidase activity involved in amyloid precursor protein catabolic process(GO:1902960) negative regulation of neurofibrillary tangle assembly(GO:1902997) negative regulation of aspartic-type peptidase activity(GO:1905246) |
| 0.8 | 5.5 | GO:0010989 | negative regulation of low-density lipoprotein particle clearance(GO:0010989) |
| 0.8 | 3.9 | GO:1904884 | telomerase catalytic core complex assembly(GO:1904868) regulation of telomerase catalytic core complex assembly(GO:1904882) positive regulation of telomerase catalytic core complex assembly(GO:1904884) |
| 0.8 | 2.3 | GO:0002372 | myeloid dendritic cell cytokine production(GO:0002372) |
| 0.8 | 2.3 | GO:0006097 | glyoxylate cycle(GO:0006097) |
| 0.8 | 15.4 | GO:0002523 | leukocyte migration involved in inflammatory response(GO:0002523) |
| 0.8 | 3.0 | GO:0010902 | positive regulation of very-low-density lipoprotein particle remodeling(GO:0010902) |
| 0.8 | 2.3 | GO:0019836 | hemolysis by symbiont of host erythrocytes(GO:0019836) hemolysis in other organism(GO:0044179) hemolysis in other organism involved in symbiotic interaction(GO:0052331) |
| 0.8 | 4.5 | GO:1902361 | mitochondrial pyruvate transport(GO:0006850) mitochondrial pyruvate transmembrane transport(GO:1902361) |
| 0.8 | 5.3 | GO:0001920 | negative regulation of receptor recycling(GO:0001920) |
| 0.7 | 2.2 | GO:0006212 | uracil catabolic process(GO:0006212) beta-alanine biosynthetic process(GO:0019483) |
| 0.7 | 3.7 | GO:0045590 | negative regulation of regulatory T cell differentiation(GO:0045590) |
| 0.7 | 1.5 | GO:0001878 | response to yeast(GO:0001878) |
| 0.7 | 8.9 | GO:0090204 | protein localization to nuclear pore(GO:0090204) |
| 0.7 | 2.2 | GO:0045556 | TRAIL biosynthetic process(GO:0045553) regulation of TRAIL biosynthetic process(GO:0045554) positive regulation of TRAIL biosynthetic process(GO:0045556) |
| 0.7 | 6.5 | GO:0048769 | sarcomerogenesis(GO:0048769) |
| 0.7 | 2.1 | GO:0060309 | elastin catabolic process(GO:0060309) |
| 0.7 | 2.8 | GO:1904980 | positive regulation of endosome organization(GO:1904980) |
| 0.7 | 2.8 | GO:0033037 | polysaccharide localization(GO:0033037) |
| 0.7 | 4.9 | GO:0038195 | urokinase plasminogen activator signaling pathway(GO:0038195) |
| 0.7 | 11.0 | GO:2000400 | positive regulation of T cell differentiation in thymus(GO:0033089) positive regulation of thymocyte aggregation(GO:2000400) |
| 0.7 | 11.7 | GO:0002430 | complement receptor mediated signaling pathway(GO:0002430) |
| 0.7 | 2.7 | GO:0034444 | regulation of plasma lipoprotein particle oxidation(GO:0034444) negative regulation of plasma lipoprotein particle oxidation(GO:0034445) |
| 0.7 | 3.4 | GO:0034154 | toll-like receptor 7 signaling pathway(GO:0034154) |
| 0.7 | 3.4 | GO:2000537 | regulation of B cell chemotaxis(GO:2000537) positive regulation of B cell chemotaxis(GO:2000538) |
| 0.7 | 8.1 | GO:2000334 | blood microparticle formation(GO:0072564) regulation of blood microparticle formation(GO:2000332) positive regulation of blood microparticle formation(GO:2000334) |
| 0.7 | 6.0 | GO:1902261 | positive regulation of delayed rectifier potassium channel activity(GO:1902261) |
| 0.7 | 3.3 | GO:2000503 | positive regulation of natural killer cell chemotaxis(GO:2000503) |
| 0.7 | 3.3 | GO:0038155 | interleukin-23-mediated signaling pathway(GO:0038155) |
| 0.7 | 7.2 | GO:0048007 | antigen processing and presentation of lipid antigen via MHC class Ib(GO:0048003) antigen processing and presentation, exogenous lipid antigen via MHC class Ib(GO:0048007) |
| 0.6 | 1.9 | GO:0098707 | ferrous iron import into cell(GO:0097460) ferrous iron import across plasma membrane(GO:0098707) |
| 0.6 | 3.2 | GO:0032252 | secretory granule localization(GO:0032252) |
| 0.6 | 1.9 | GO:2000563 | positive regulation of CD4-positive, alpha-beta T cell proliferation(GO:2000563) |
| 0.6 | 10.8 | GO:0006957 | complement activation, alternative pathway(GO:0006957) |
| 0.6 | 3.1 | GO:1902523 | positive regulation of protein K63-linked ubiquitination(GO:1902523) |
| 0.6 | 3.1 | GO:0071409 | cellular response to cycloheximide(GO:0071409) |
| 0.6 | 8.7 | GO:1900625 | regulation of monocyte aggregation(GO:1900623) positive regulation of monocyte aggregation(GO:1900625) |
| 0.6 | 4.9 | GO:0038110 | interleukin-2-mediated signaling pathway(GO:0038110) |
| 0.6 | 3.7 | GO:0090294 | nitrogen catabolite regulation of transcription from RNA polymerase II promoter(GO:0001079) nitrogen catabolite activation of transcription from RNA polymerase II promoter(GO:0001080) regulation of urea metabolic process(GO:0034255) intracellular bile acid receptor signaling pathway(GO:0038185) interleukin-17 secretion(GO:0072615) nitrogen catabolite regulation of transcription(GO:0090293) nitrogen catabolite activation of transcription(GO:0090294) regulation of nitrogen cycle metabolic process(GO:1903314) positive regulation of glutamate metabolic process(GO:2000213) regulation of ammonia assimilation cycle(GO:2001248) positive regulation of ammonia assimilation cycle(GO:2001250) |
| 0.6 | 1.8 | GO:2000296 | negative regulation of hydrogen peroxide catabolic process(GO:2000296) |
| 0.6 | 4.3 | GO:0016098 | monoterpenoid metabolic process(GO:0016098) |
| 0.6 | 4.2 | GO:0019557 | histidine catabolic process to glutamate and formamide(GO:0019556) histidine catabolic process to glutamate and formate(GO:0019557) formamide metabolic process(GO:0043606) |
| 0.6 | 0.6 | GO:0071218 | cellular response to misfolded protein(GO:0071218) |
| 0.6 | 4.2 | GO:0051970 | negative regulation of transmission of nerve impulse(GO:0051970) |
| 0.6 | 1.2 | GO:0097536 | thymus epithelium morphogenesis(GO:0097536) regulation of positive thymic T cell selection(GO:1902232) |
| 0.6 | 3.5 | GO:0038112 | interleukin-8-mediated signaling pathway(GO:0038112) |
| 0.6 | 1.7 | GO:0032824 | negative regulation of natural killer cell differentiation(GO:0032824) negative regulation of natural killer cell differentiation involved in immune response(GO:0032827) |
| 0.6 | 0.6 | GO:0009257 | 10-formyltetrahydrofolate biosynthetic process(GO:0009257) |
| 0.6 | 1.7 | GO:1903210 | cellular response to nitrite(GO:0071250) response to nitrite(GO:0080033) glomerular visceral epithelial cell apoptotic process(GO:1903210) regulation of glomerular visceral epithelial cell apoptotic process(GO:1904633) positive regulation of glomerular visceral epithelial cell apoptotic process(GO:1904635) response to resveratrol(GO:1904638) cellular response to resveratrol(GO:1904639) positive regulation of progesterone biosynthetic process(GO:2000184) |
| 0.6 | 2.9 | GO:0002357 | defense response to tumor cell(GO:0002357) |
| 0.6 | 1.7 | GO:0072684 | mitochondrial tRNA 3'-trailer cleavage, endonucleolytic(GO:0072684) |
| 0.6 | 2.3 | GO:2000402 | negative regulation of lymphocyte migration(GO:2000402) |
| 0.6 | 0.6 | GO:0002399 | MHC class II protein complex assembly(GO:0002399) |
| 0.6 | 1.7 | GO:1904000 | positive regulation of eating behavior(GO:1904000) |
| 0.6 | 3.4 | GO:0043988 | histone H3-S28 phosphorylation(GO:0043988) |
| 0.6 | 1.7 | GO:0043376 | regulation of CD8-positive, alpha-beta T cell differentiation(GO:0043376) |
| 0.6 | 15.5 | GO:0002717 | positive regulation of natural killer cell mediated immunity(GO:0002717) |
| 0.6 | 3.9 | GO:0045347 | negative regulation of MHC class II biosynthetic process(GO:0045347) |
| 0.6 | 2.8 | GO:0061034 | olfactory bulb mitral cell layer development(GO:0061034) |
| 0.5 | 4.4 | GO:1900226 | negative regulation of NLRP3 inflammasome complex assembly(GO:1900226) |
| 0.5 | 2.7 | GO:0006288 | base-excision repair, DNA ligation(GO:0006288) |
| 0.5 | 2.2 | GO:0005986 | sucrose biosynthetic process(GO:0005986) |
| 0.5 | 2.2 | GO:0036414 | protein citrullination(GO:0018101) histone citrullination(GO:0036414) |
| 0.5 | 2.1 | GO:0060741 | prostate gland stromal morphogenesis(GO:0060741) |
| 0.5 | 4.7 | GO:2001199 | negative regulation of dendritic cell differentiation(GO:2001199) |
| 0.5 | 1.0 | GO:1905237 | response to cyclosporin A(GO:1905237) |
| 0.5 | 7.3 | GO:1900017 | positive regulation of cytokine production involved in inflammatory response(GO:1900017) |
| 0.5 | 2.1 | GO:0052027 | modulation of signal transduction in other organism(GO:0044501) modulation by symbiont of host signal transduction pathway(GO:0052027) modulation of signal transduction in other organism involved in symbiotic interaction(GO:0052250) modulation by symbiont of host I-kappaB kinase/NF-kappaB cascade(GO:0085032) |
| 0.5 | 73.9 | GO:0031295 | T cell costimulation(GO:0031295) |
| 0.5 | 1.5 | GO:0071677 | positive regulation of mononuclear cell migration(GO:0071677) |
| 0.5 | 12.8 | GO:0071803 | positive regulation of podosome assembly(GO:0071803) |
| 0.5 | 2.6 | GO:0048388 | endosomal lumen acidification(GO:0048388) |
| 0.5 | 1.0 | GO:0002378 | immunoglobulin biosynthetic process(GO:0002378) |
| 0.5 | 2.0 | GO:0010607 | negative regulation of cytoplasmic mRNA processing body assembly(GO:0010607) |
| 0.5 | 1.5 | GO:0002581 | negative regulation of antigen processing and presentation of peptide or polysaccharide antigen via MHC class II(GO:0002581) |
| 0.5 | 3.0 | GO:0000117 | regulation of transcription involved in G2/M transition of mitotic cell cycle(GO:0000117) |
| 0.5 | 2.0 | GO:0021571 | rhombomere 5 development(GO:0021571) |
| 0.5 | 4.4 | GO:0010898 | positive regulation of triglyceride catabolic process(GO:0010898) |
| 0.5 | 2.5 | GO:0018057 | peptidyl-lysine oxidation(GO:0018057) |
| 0.5 | 2.0 | GO:2000255 | negative regulation of male germ cell proliferation(GO:2000255) |
| 0.5 | 2.0 | GO:1902962 | regulation of metalloendopeptidase activity involved in amyloid precursor protein catabolic process(GO:1902962) negative regulation of metalloendopeptidase activity involved in amyloid precursor protein catabolic process(GO:1902963) |
| 0.5 | 6.8 | GO:0043374 | CD8-positive, alpha-beta T cell differentiation(GO:0043374) |
| 0.5 | 7.3 | GO:0018377 | protein myristoylation(GO:0018377) |
| 0.5 | 1.0 | GO:1903526 | negative regulation of membrane tubulation(GO:1903526) |
| 0.5 | 1.9 | GO:0032972 | regulation of muscle filament sliding speed(GO:0032972) |
| 0.5 | 1.9 | GO:0097466 | protein deglycosylation involved in glycoprotein catabolic process(GO:0035977) glycoprotein ERAD pathway(GO:0097466) mannose trimming involved in glycoprotein ERAD pathway(GO:1904382) |
| 0.5 | 40.6 | GO:0006968 | cellular defense response(GO:0006968) |
| 0.5 | 0.9 | GO:0032754 | positive regulation of interleukin-5 production(GO:0032754) |
| 0.5 | 3.7 | GO:0043615 | astrocyte cell migration(GO:0043615) |
| 0.5 | 1.4 | GO:0006683 | galactosylceramide catabolic process(GO:0006683) |
| 0.5 | 5.5 | GO:0043152 | induction of bacterial agglutination(GO:0043152) |
| 0.5 | 3.6 | GO:0015840 | urea transport(GO:0015840) |
| 0.5 | 2.3 | GO:0046167 | glycerol-3-phosphate biosynthetic process(GO:0046167) |
| 0.5 | 9.5 | GO:0008228 | opsonization(GO:0008228) |
| 0.5 | 2.7 | GO:0034196 | acylglycerol transport(GO:0034196) triglyceride transport(GO:0034197) |
| 0.4 | 1.3 | GO:0002325 | natural killer cell differentiation involved in immune response(GO:0002325) regulation of natural killer cell differentiation involved in immune response(GO:0032826) regulation of extrathymic T cell differentiation(GO:0033082) |
| 0.4 | 1.7 | GO:0070124 | mitochondrial translational initiation(GO:0070124) |
| 0.4 | 1.7 | GO:0006848 | pyruvate transport(GO:0006848) pyruvate transmembrane transport(GO:1901475) |
| 0.4 | 1.7 | GO:1904017 | cellular response to Thyroglobulin triiodothyronine(GO:1904017) |
| 0.4 | 1.7 | GO:1904479 | negative regulation of intestinal absorption(GO:1904479) |
| 0.4 | 1.3 | GO:0045085 | negative regulation of interleukin-2 biosynthetic process(GO:0045085) |
| 0.4 | 1.3 | GO:0002416 | IgG immunoglobulin transcytosis in epithelial cells mediated by FcRn immunoglobulin receptor(GO:0002416) |
| 0.4 | 7.2 | GO:0021842 | directional guidance of interneurons involved in migration from the subpallium to the cortex(GO:0021840) chemorepulsion involved in interneuron migration from the subpallium to the cortex(GO:0021842) ERBB3 signaling pathway(GO:0038129) |
| 0.4 | 6.7 | GO:1901898 | negative regulation of relaxation of cardiac muscle(GO:1901898) |
| 0.4 | 2.1 | GO:1901846 | positive regulation of cell communication by electrical coupling involved in cardiac conduction(GO:1901846) |
| 0.4 | 1.3 | GO:0060690 | epithelial cell differentiation involved in salivary gland development(GO:0060690) epithelial cell maturation involved in salivary gland development(GO:0060691) regulation of plasma cell differentiation(GO:1900098) positive regulation of plasma cell differentiation(GO:1900100) positive regulation of lactation(GO:1903489) |
| 0.4 | 3.3 | GO:0002480 | antigen processing and presentation of exogenous peptide antigen via MHC class I, TAP-independent(GO:0002480) |
| 0.4 | 2.9 | GO:0006083 | acetate metabolic process(GO:0006083) |
| 0.4 | 2.1 | GO:0032764 | negative regulation of mast cell cytokine production(GO:0032764) |
| 0.4 | 0.4 | GO:0002858 | natural killer cell mediated cytotoxicity directed against tumor cell target(GO:0002420) natural killer cell mediated immune response to tumor cell(GO:0002423) regulation of natural killer cell mediated immune response to tumor cell(GO:0002855) regulation of natural killer cell mediated cytotoxicity directed against tumor cell target(GO:0002858) |
| 0.4 | 1.7 | GO:0002625 | regulation of T cell antigen processing and presentation(GO:0002625) |
| 0.4 | 1.2 | GO:0003032 | detection of oxygen(GO:0003032) |
| 0.4 | 6.6 | GO:0015939 | pantothenate metabolic process(GO:0015939) |
| 0.4 | 2.0 | GO:0003245 | cardiac muscle tissue growth involved in heart morphogenesis(GO:0003245) |
| 0.4 | 1.6 | GO:2000733 | regulation of cell proliferation involved in mesonephros development(GO:2000606) negative regulation of cell proliferation involved in mesonephros development(GO:2000607) fibroblast growth factor receptor signaling pathway involved in ureteric bud formation(GO:2000699) glial cell-derived neurotrophic factor receptor signaling pathway involved in ureteric bud formation(GO:2000701) regulation of fibroblast growth factor receptor signaling pathway involved in ureteric bud formation(GO:2000702) negative regulation of fibroblast growth factor receptor signaling pathway involved in ureteric bud formation(GO:2000703) regulation of glial cell-derived neurotrophic factor receptor signaling pathway involved in ureteric bud formation(GO:2000733) negative regulation of glial cell-derived neurotrophic factor receptor signaling pathway involved in ureteric bud formation(GO:2000734) |
| 0.4 | 0.4 | GO:0043380 | regulation of memory T cell differentiation(GO:0043380) |
| 0.4 | 1.6 | GO:1902714 | negative regulation of interferon-gamma secretion(GO:1902714) |
| 0.4 | 1.2 | GO:1902994 | regulation of phospholipid efflux(GO:1902994) positive regulation of phospholipid efflux(GO:1902995) |
| 0.4 | 1.2 | GO:0048250 | mitochondrial iron ion transport(GO:0048250) |
| 0.4 | 1.2 | GO:0036290 | protein trans-autophosphorylation(GO:0036290) peptidyl-serine trans-autophosphorylation(GO:1990579) |
| 0.4 | 1.2 | GO:0033031 | positive regulation of neutrophil apoptotic process(GO:0033031) |
| 0.4 | 1.6 | GO:0010360 | negative regulation of anion channel activity(GO:0010360) |
| 0.4 | 0.8 | GO:0051801 | cytolysis in other organism involved in symbiotic interaction(GO:0051801) |
| 0.4 | 2.7 | GO:0032417 | positive regulation of sodium:proton antiporter activity(GO:0032417) |
| 0.4 | 1.6 | GO:0048205 | COPI-coated vesicle budding(GO:0035964) Golgi transport vesicle coating(GO:0048200) COPI coating of Golgi vesicle(GO:0048205) |
| 0.4 | 1.6 | GO:0042761 | very long-chain fatty acid biosynthetic process(GO:0042761) |
| 0.4 | 1.2 | GO:1904899 | regulation of hepatic stellate cell proliferation(GO:1904897) positive regulation of hepatic stellate cell proliferation(GO:1904899) hepatic stellate cell proliferation(GO:1990922) |
| 0.4 | 3.5 | GO:0061737 | leukotriene signaling pathway(GO:0061737) |
| 0.4 | 1.5 | GO:0031064 | negative regulation of histone deacetylation(GO:0031064) |
| 0.4 | 1.1 | GO:1900365 | positive regulation of mRNA polyadenylation(GO:1900365) |
| 0.4 | 0.8 | GO:0002901 | mature B cell apoptotic process(GO:0002901) regulation of mature B cell apoptotic process(GO:0002905) negative regulation of mature B cell apoptotic process(GO:0002906) |
| 0.4 | 1.5 | GO:0061582 | colon epithelial cell migration(GO:0061580) intestinal epithelial cell migration(GO:0061582) |
| 0.4 | 1.5 | GO:0014040 | positive regulation of Schwann cell differentiation(GO:0014040) conversion of ds siRNA to ss siRNA involved in RNA interference(GO:0033168) conversion of ds siRNA to ss siRNA(GO:0036404) |
| 0.4 | 1.8 | GO:0072709 | cellular response to sorbitol(GO:0072709) |
| 0.4 | 3.7 | GO:1904781 | positive regulation of protein localization to centrosome(GO:1904781) |
| 0.4 | 3.6 | GO:0048102 | autophagic cell death(GO:0048102) |
| 0.4 | 1.1 | GO:0031585 | regulation of inositol 1,4,5-trisphosphate-sensitive calcium-release channel activity(GO:0031585) positive regulation of inositol 1,4,5-trisphosphate-sensitive calcium-release channel activity(GO:0031587) |
| 0.4 | 0.4 | GO:0043006 | activation of phospholipase A2 activity by calcium-mediated signaling(GO:0043006) |
| 0.4 | 1.4 | GO:0019805 | quinolinate biosynthetic process(GO:0019805) |
| 0.4 | 1.8 | GO:1904059 | regulation of locomotor rhythm(GO:1904059) |
| 0.4 | 3.9 | GO:0031022 | nuclear migration along microfilament(GO:0031022) |
| 0.4 | 1.1 | GO:0032877 | positive regulation of DNA endoreduplication(GO:0032877) |
| 0.4 | 5.3 | GO:0035970 | peptidyl-threonine dephosphorylation(GO:0035970) |
| 0.4 | 1.1 | GO:0060392 | negative regulation of SMAD protein import into nucleus(GO:0060392) |
| 0.4 | 4.6 | GO:1902748 | positive regulation of lens fiber cell differentiation(GO:1902748) |
| 0.4 | 2.5 | GO:0009450 | gamma-aminobutyric acid catabolic process(GO:0009450) negative regulation of gamma-aminobutyric acid secretion(GO:0014053) aspartate secretion(GO:0061528) regulation of aspartate secretion(GO:1904448) positive regulation of aspartate secretion(GO:1904450) |
| 0.3 | 1.7 | GO:0061762 | CAMKK-AMPK signaling cascade(GO:0061762) |
| 0.3 | 1.0 | GO:0033632 | regulation of cell-cell adhesion mediated by integrin(GO:0033632) |
| 0.3 | 1.0 | GO:0030885 | regulation of myeloid dendritic cell activation(GO:0030885) |
| 0.3 | 0.3 | GO:0002428 | antigen processing and presentation of peptide antigen via MHC class Ib(GO:0002428) |
| 0.3 | 3.4 | GO:0042699 | follicle-stimulating hormone signaling pathway(GO:0042699) |
| 0.3 | 1.0 | GO:0090410 | malonate catabolic process(GO:0090410) |
| 0.3 | 0.3 | GO:0046668 | regulation of retinal cell programmed cell death(GO:0046668) |
| 0.3 | 2.0 | GO:0071461 | cellular response to redox state(GO:0071461) |
| 0.3 | 2.0 | GO:0032792 | negative regulation of CREB transcription factor activity(GO:0032792) |
| 0.3 | 1.0 | GO:0030221 | basophil differentiation(GO:0030221) |
| 0.3 | 1.0 | GO:0060330 | regulation of response to interferon-gamma(GO:0060330) |
| 0.3 | 1.0 | GO:2000449 | CD8-positive, alpha-beta T cell extravasation(GO:0035697) CD8-positive, alpha-beta cytotoxic T cell extravasation(GO:0035698) T cell extravasation(GO:0072683) regulation of T cell extravasation(GO:2000407) regulation of CD8-positive, alpha-beta T cell extravasation(GO:2000449) regulation of CD8-positive, alpha-beta cytotoxic T cell extravasation(GO:2000452) |
| 0.3 | 2.0 | GO:0009233 | menaquinone metabolic process(GO:0009233) |
| 0.3 | 4.3 | GO:0098735 | positive regulation of the force of heart contraction(GO:0098735) |
| 0.3 | 3.2 | GO:0001866 | NK T cell proliferation(GO:0001866) |
| 0.3 | 4.2 | GO:0044351 | macropinocytosis(GO:0044351) |
| 0.3 | 1.3 | GO:0045409 | negative regulation of interleukin-6 biosynthetic process(GO:0045409) regulation of neutrophil differentiation(GO:0045658) negative regulation of neutrophil differentiation(GO:0045659) |
| 0.3 | 4.8 | GO:2000271 | positive regulation of fibroblast apoptotic process(GO:2000271) |
| 0.3 | 22.9 | GO:0006910 | phagocytosis, recognition(GO:0006910) |
| 0.3 | 2.5 | GO:0061709 | reticulophagy(GO:0061709) |
| 0.3 | 0.3 | GO:0002085 | inhibition of neuroepithelial cell differentiation(GO:0002085) |
| 0.3 | 0.9 | GO:0036451 | cap mRNA methylation(GO:0036451) |
| 0.3 | 0.9 | GO:0051461 | positive regulation of corticotropin secretion(GO:0051461) |
| 0.3 | 1.3 | GO:0036058 | filtration diaphragm assembly(GO:0036058) slit diaphragm assembly(GO:0036060) |
| 0.3 | 0.9 | GO:0046108 | uridine metabolic process(GO:0046108) |
| 0.3 | 1.2 | GO:0060133 | somatotropin secreting cell development(GO:0060133) |
| 0.3 | 0.9 | GO:0033625 | positive regulation of integrin activation(GO:0033625) |
| 0.3 | 1.5 | GO:0071221 | response to bacterial lipopeptide(GO:0070339) cellular response to bacterial lipoprotein(GO:0071220) cellular response to bacterial lipopeptide(GO:0071221) |
| 0.3 | 2.8 | GO:0072540 | T-helper 17 cell lineage commitment(GO:0072540) |
| 0.3 | 0.9 | GO:1902938 | regulation of intracellular calcium activated chloride channel activity(GO:1902938) |
| 0.3 | 3.4 | GO:0006689 | ganglioside catabolic process(GO:0006689) |
| 0.3 | 0.6 | GO:2000981 | negative regulation of mechanoreceptor differentiation(GO:0045632) negative regulation of pro-B cell differentiation(GO:2000974) negative regulation of inner ear receptor cell differentiation(GO:2000981) |
| 0.3 | 1.8 | GO:0030581 | intracellular transport of viral protein in host cell(GO:0019060) symbiont intracellular protein transport in host(GO:0030581) intracellular protein transport in other organism involved in symbiotic interaction(GO:0051708) |
| 0.3 | 1.2 | GO:0050992 | dimethylallyl diphosphate biosynthetic process(GO:0050992) dimethylallyl diphosphate metabolic process(GO:0050993) |
| 0.3 | 5.1 | GO:0043402 | glucocorticoid mediated signaling pathway(GO:0043402) |
| 0.3 | 0.6 | GO:0050859 | negative regulation of B cell receptor signaling pathway(GO:0050859) |
| 0.3 | 0.9 | GO:0036333 | hepatocyte homeostasis(GO:0036333) response to tetrachloromethane(GO:1904772) |
| 0.3 | 1.8 | GO:2001151 | regulation of renal water transport(GO:2001151) positive regulation of renal water transport(GO:2001153) |
| 0.3 | 0.3 | GO:0016256 | N-glycan processing to lysosome(GO:0016256) |
| 0.3 | 0.3 | GO:1904923 | positive regulation of macromitophagy(GO:1901526) regulation of mitophagy in response to mitochondrial depolarization(GO:1904923) positive regulation of mitophagy in response to mitochondrial depolarization(GO:1904925) |
| 0.3 | 2.3 | GO:0008582 | regulation of synaptic growth at neuromuscular junction(GO:0008582) |
| 0.3 | 4.9 | GO:0039536 | negative regulation of RIG-I signaling pathway(GO:0039536) |
| 0.3 | 1.7 | GO:0060700 | regulation of ribonuclease activity(GO:0060700) |
| 0.3 | 1.4 | GO:0045591 | positive regulation of regulatory T cell differentiation(GO:0045591) |
| 0.3 | 0.3 | GO:0072387 | flavin adenine dinucleotide metabolic process(GO:0072387) |
| 0.3 | 0.9 | GO:0021965 | spinal cord ventral commissure morphogenesis(GO:0021965) |
| 0.3 | 1.1 | GO:0032207 | regulation of telomere maintenance via recombination(GO:0032207) negative regulation of telomere maintenance via recombination(GO:0032208) regulation of single strand break repair(GO:1903516) negative regulation of single strand break repair(GO:1903517) negative regulation of beta-galactosidase activity(GO:1903770) telomere single strand break repair(GO:1903823) negative regulation of telomere single strand break repair(GO:1903824) |
| 0.3 | 0.3 | GO:0021590 | cerebellum maturation(GO:0021590) cerebellar Purkinje cell layer maturation(GO:0021691) cerebellar cortex maturation(GO:0021699) |
| 0.3 | 1.7 | GO:0014835 | myoblast differentiation involved in skeletal muscle regeneration(GO:0014835) |
| 0.3 | 1.1 | GO:0044537 | regulation of circulating fibrinogen levels(GO:0044537) |
| 0.3 | 0.8 | GO:0035376 | sterol import(GO:0035376) cholesterol import(GO:0070508) |
| 0.3 | 0.3 | GO:1904058 | positive regulation of sensory perception of pain(GO:1904058) |
| 0.3 | 0.8 | GO:0001543 | ovarian follicle rupture(GO:0001543) |
| 0.3 | 1.7 | GO:0045346 | MHC class II biosynthetic process(GO:0045342) regulation of MHC class II biosynthetic process(GO:0045346) |
| 0.3 | 3.6 | GO:0060263 | regulation of respiratory burst(GO:0060263) |
| 0.3 | 2.2 | GO:0052405 | negative regulation by host of symbiont molecular function(GO:0052405) |
| 0.3 | 3.3 | GO:0002191 | cap-dependent translational initiation(GO:0002191) |
| 0.3 | 1.9 | GO:0050916 | sensory perception of sweet taste(GO:0050916) |
| 0.3 | 0.8 | GO:0003050 | regulation of systemic arterial blood pressure by atrial natriuretic peptide(GO:0003050) |
| 0.3 | 0.5 | GO:0051097 | negative regulation of helicase activity(GO:0051097) |
| 0.3 | 3.2 | GO:0060252 | positive regulation of glial cell proliferation(GO:0060252) |
| 0.3 | 0.5 | GO:2001180 | negative regulation of interleukin-10 secretion(GO:2001180) |
| 0.3 | 1.6 | GO:1902530 | regulation of protein linear polyubiquitination(GO:1902528) positive regulation of protein linear polyubiquitination(GO:1902530) |
| 0.3 | 1.6 | GO:0033299 | secretion of lysosomal enzymes(GO:0033299) |
| 0.3 | 2.9 | GO:0045163 | clustering of voltage-gated potassium channels(GO:0045163) |
| 0.3 | 0.8 | GO:0006788 | heme oxidation(GO:0006788) |
| 0.3 | 5.9 | GO:0050930 | induction of positive chemotaxis(GO:0050930) |
| 0.3 | 1.1 | GO:0002384 | hepatic immune response(GO:0002384) |
| 0.3 | 2.9 | GO:0009972 | cytidine catabolic process(GO:0006216) cytidine deamination(GO:0009972) cytidine metabolic process(GO:0046087) |
| 0.3 | 4.2 | GO:0002315 | marginal zone B cell differentiation(GO:0002315) |
| 0.3 | 0.8 | GO:0016237 | lysosomal microautophagy(GO:0016237) piecemeal microautophagy of nucleus(GO:0034727) modulation by virus of host autophagy(GO:0039519) suppression by virus of host autophagy(GO:0039521) |
| 0.3 | 7.1 | GO:0010663 | positive regulation of striated muscle cell apoptotic process(GO:0010663) positive regulation of cardiac muscle cell apoptotic process(GO:0010666) |
| 0.3 | 1.0 | GO:0033320 | UDP-D-xylose metabolic process(GO:0033319) UDP-D-xylose biosynthetic process(GO:0033320) |
| 0.3 | 49.6 | GO:0038094 | Fc-gamma receptor signaling pathway(GO:0038094) |
| 0.3 | 0.8 | GO:0098884 | postsynaptic neurotransmitter receptor internalization(GO:0098884) |
| 0.3 | 1.3 | GO:0044778 | meiotic DNA integrity checkpoint(GO:0044778) |
| 0.3 | 2.0 | GO:0019856 | 'de novo' pyrimidine nucleobase biosynthetic process(GO:0006207) pyrimidine nucleobase biosynthetic process(GO:0019856) |
| 0.3 | 0.8 | GO:0071529 | cementum mineralization(GO:0071529) |
| 0.3 | 0.8 | GO:0007402 | ganglion mother cell fate determination(GO:0007402) |
| 0.3 | 0.5 | GO:1903352 | L-ornithine transmembrane transport(GO:1903352) |
| 0.2 | 3.0 | GO:0050957 | equilibrioception(GO:0050957) |
| 0.2 | 1.0 | GO:0006480 | N-terminal protein amino acid methylation(GO:0006480) |
| 0.2 | 4.2 | GO:0003322 | pancreatic A cell development(GO:0003322) |
| 0.2 | 2.0 | GO:1901341 | activation of store-operated calcium channel activity(GO:0032237) positive regulation of store-operated calcium channel activity(GO:1901341) |
| 0.2 | 0.5 | GO:1903436 | regulation of cytokinetic process(GO:0032954) regulation of mitotic cytokinetic process(GO:1903436) positive regulation of mitotic cytokinetic process(GO:1903438) positive regulation of mitotic cytokinesis(GO:1903490) |
| 0.2 | 0.2 | GO:0019482 | beta-alanine metabolic process(GO:0019482) |
| 0.2 | 1.2 | GO:0051182 | coenzyme transport(GO:0051182) |
| 0.2 | 1.0 | GO:0002188 | translation reinitiation(GO:0002188) |
| 0.2 | 0.7 | GO:0061182 | negative regulation of chondrocyte development(GO:0061182) |
| 0.2 | 1.5 | GO:2000158 | positive regulation of ubiquitin-specific protease activity(GO:2000158) |
| 0.2 | 1.9 | GO:0035372 | protein localization to microtubule(GO:0035372) |
| 0.2 | 0.7 | GO:0046041 | ITP metabolic process(GO:0046041) |
| 0.2 | 0.2 | GO:0002019 | regulation of renal output by angiotensin(GO:0002019) |
| 0.2 | 1.4 | GO:0035897 | proteolysis in other organism(GO:0035897) |
| 0.2 | 1.2 | GO:0002074 | extraocular skeletal muscle development(GO:0002074) |
| 0.2 | 2.2 | GO:0034370 | triglyceride-rich lipoprotein particle remodeling(GO:0034370) |
| 0.2 | 4.5 | GO:0045162 | clustering of voltage-gated sodium channels(GO:0045162) |
| 0.2 | 0.7 | GO:0015734 | taurine transport(GO:0015734) |
| 0.2 | 1.4 | GO:0048241 | epinephrine transport(GO:0048241) |
| 0.2 | 0.2 | GO:0009436 | glyoxylate catabolic process(GO:0009436) |
| 0.2 | 0.5 | GO:0034729 | histone H3-K79 methylation(GO:0034729) |
| 0.2 | 0.5 | GO:1901857 | positive regulation of cellular respiration(GO:1901857) |
| 0.2 | 0.7 | GO:1901143 | insulin catabolic process(GO:1901143) |
| 0.2 | 0.2 | GO:1903217 | regulation of protein processing involved in protein targeting to mitochondrion(GO:1903216) negative regulation of protein processing involved in protein targeting to mitochondrion(GO:1903217) |
| 0.2 | 0.9 | GO:0097527 | necroptotic signaling pathway(GO:0097527) |
| 0.2 | 0.5 | GO:0046110 | xanthine metabolic process(GO:0046110) |
| 0.2 | 0.9 | GO:0098957 | anterograde axonal transport of mitochondrion(GO:0098957) |
| 0.2 | 6.6 | GO:0090208 | positive regulation of triglyceride metabolic process(GO:0090208) |
| 0.2 | 0.7 | GO:0046005 | positive regulation of circadian sleep/wake cycle, REM sleep(GO:0046005) |
| 0.2 | 1.1 | GO:0014042 | positive regulation of neuron maturation(GO:0014042) |
| 0.2 | 0.9 | GO:0010868 | negative regulation of triglyceride biosynthetic process(GO:0010868) regulation of SREBP signaling pathway(GO:2000638) negative regulation of SREBP signaling pathway(GO:2000639) |
| 0.2 | 0.7 | GO:0002949 | tRNA threonylcarbamoyladenosine modification(GO:0002949) |
| 0.2 | 0.7 | GO:0031627 | telomeric loop formation(GO:0031627) |
| 0.2 | 0.7 | GO:0090370 | negative regulation of cholesterol efflux(GO:0090370) |
| 0.2 | 0.7 | GO:0016267 | O-glycan processing, core 1(GO:0016267) |
| 0.2 | 0.9 | GO:0002322 | B cell proliferation involved in immune response(GO:0002322) |
| 0.2 | 5.8 | GO:0035589 | G-protein coupled purinergic nucleotide receptor signaling pathway(GO:0035589) |
| 0.2 | 0.9 | GO:0051919 | positive regulation of fibrinolysis(GO:0051919) |
| 0.2 | 0.9 | GO:0030578 | PML body organization(GO:0030578) |
| 0.2 | 0.7 | GO:0045730 | respiratory burst(GO:0045730) |
| 0.2 | 3.3 | GO:0046597 | negative regulation of viral entry into host cell(GO:0046597) |
| 0.2 | 0.7 | GO:0051939 | gamma-aminobutyric acid import(GO:0051939) |
| 0.2 | 0.9 | GO:0030423 | targeting of mRNA for destruction involved in RNA interference(GO:0030423) |
| 0.2 | 16.8 | GO:0038083 | peptidyl-tyrosine autophosphorylation(GO:0038083) |
| 0.2 | 0.4 | GO:0044010 | biofilm formation(GO:0042710) single-species biofilm formation(GO:0044010) single-species biofilm formation in or on host organism(GO:0044407) regulation of single-species biofilm formation(GO:1900190) negative regulation of single-species biofilm formation(GO:1900191) regulation of single-species biofilm formation in or on host organism(GO:1900228) negative regulation of single-species biofilm formation in or on host organism(GO:1900229) |
| 0.2 | 3.2 | GO:0071550 | death-inducing signaling complex assembly(GO:0071550) |
| 0.2 | 0.8 | GO:0021558 | trochlear nerve development(GO:0021558) regulation of timing of neuron differentiation(GO:0060164) |
| 0.2 | 2.9 | GO:1901223 | negative regulation of NIK/NF-kappaB signaling(GO:1901223) |
| 0.2 | 5.4 | GO:0006491 | N-glycan processing(GO:0006491) |
| 0.2 | 1.2 | GO:1902237 | positive regulation of endoplasmic reticulum stress-induced intrinsic apoptotic signaling pathway(GO:1902237) |
| 0.2 | 3.1 | GO:0071380 | cellular response to prostaglandin E stimulus(GO:0071380) |
| 0.2 | 2.3 | GO:0006335 | DNA replication-dependent nucleosome assembly(GO:0006335) DNA replication-dependent nucleosome organization(GO:0034723) |
| 0.2 | 1.2 | GO:0061732 | mitochondrial acetyl-CoA biosynthetic process from pyruvate(GO:0061732) |
| 0.2 | 6.0 | GO:0038180 | nerve growth factor signaling pathway(GO:0038180) |
| 0.2 | 0.6 | GO:0097272 | ammonia homeostasis(GO:0097272) |
| 0.2 | 1.4 | GO:0035616 | histone H2B conserved C-terminal lysine deubiquitination(GO:0035616) |
| 0.2 | 1.4 | GO:2000048 | negative regulation of cell-cell adhesion mediated by cadherin(GO:2000048) |
| 0.2 | 1.0 | GO:1904021 | negative regulation of G-protein coupled receptor internalization(GO:1904021) |
| 0.2 | 3.7 | GO:0072619 | interleukin-21 production(GO:0032625) interleukin-21 secretion(GO:0072619) |
| 0.2 | 1.4 | GO:0033211 | adiponectin-activated signaling pathway(GO:0033211) |
| 0.2 | 0.8 | GO:1904924 | negative regulation of mitophagy in response to mitochondrial depolarization(GO:1904924) |
| 0.2 | 0.2 | GO:1904779 | regulation of protein localization to centrosome(GO:1904779) |
| 0.2 | 1.0 | GO:0010587 | miRNA catabolic process(GO:0010587) |
| 0.2 | 4.0 | GO:0070544 | histone H3-K36 demethylation(GO:0070544) |
| 0.2 | 1.6 | GO:0036476 | neuron death in response to hydrogen peroxide(GO:0036476) regulation of hydrogen peroxide-induced neuron death(GO:1903207) negative regulation of hydrogen peroxide-induced neuron death(GO:1903208) |
| 0.2 | 1.0 | GO:0048840 | otolith development(GO:0048840) |
| 0.2 | 0.8 | GO:0006169 | adenosine salvage(GO:0006169) dATP biosynthetic process(GO:0006175) |
| 0.2 | 1.8 | GO:0031444 | slow-twitch skeletal muscle fiber contraction(GO:0031444) |
| 0.2 | 0.6 | GO:0006344 | maintenance of chromatin silencing(GO:0006344) |
| 0.2 | 4.8 | GO:0048757 | endosome to melanosome transport(GO:0035646) endosome to pigment granule transport(GO:0043485) pigment granule maturation(GO:0048757) |
| 0.2 | 1.0 | GO:0090076 | relaxation of skeletal muscle(GO:0090076) |
| 0.2 | 0.8 | GO:0060631 | regulation of meiosis I(GO:0060631) |
| 0.2 | 0.6 | GO:0017186 | peptidyl-pyroglutamic acid biosynthetic process, using glutaminyl-peptide cyclotransferase(GO:0017186) |
| 0.2 | 0.6 | GO:1904562 | phosphatidylinositol 5-phosphate metabolic process(GO:1904562) |
| 0.2 | 2.0 | GO:0021797 | forebrain anterior/posterior pattern specification(GO:0021797) |
| 0.2 | 2.9 | GO:0035590 | purinergic nucleotide receptor signaling pathway(GO:0035590) |
| 0.2 | 1.0 | GO:0015942 | formate metabolic process(GO:0015942) |
| 0.2 | 0.8 | GO:0006542 | glutamine biosynthetic process(GO:0006542) |
| 0.2 | 1.0 | GO:0002933 | lipid hydroxylation(GO:0002933) |
| 0.2 | 0.8 | GO:0015822 | mitochondrial ornithine transport(GO:0000066) ornithine transport(GO:0015822) |
| 0.2 | 1.7 | GO:0032202 | telomere assembly(GO:0032202) |
| 0.2 | 0.6 | GO:0061011 | hepatic duct development(GO:0061011) |
| 0.2 | 1.0 | GO:0042226 | interleukin-6 biosynthetic process(GO:0042226) |
| 0.2 | 0.6 | GO:0046338 | phosphatidylethanolamine catabolic process(GO:0046338) |
| 0.2 | 0.4 | GO:0090214 | spongiotrophoblast layer developmental growth(GO:0090214) |
| 0.2 | 0.6 | GO:0007174 | epidermal growth factor catabolic process(GO:0007174) |
| 0.2 | 1.0 | GO:0035745 | T-helper 2 cell cytokine production(GO:0035745) |
| 0.2 | 12.6 | GO:0006953 | acute-phase response(GO:0006953) |
| 0.2 | 2.1 | GO:0071287 | cellular response to manganese ion(GO:0071287) |
| 0.2 | 0.6 | GO:0060528 | secretory columnal luminar epithelial cell differentiation involved in prostate glandular acinus development(GO:0060528) |
| 0.2 | 0.4 | GO:0002339 | B cell selection(GO:0002339) |
| 0.2 | 0.4 | GO:0046133 | pyrimidine ribonucleoside catabolic process(GO:0046133) |
| 0.2 | 0.6 | GO:0002904 | positive regulation of B cell apoptotic process(GO:0002904) |
| 0.2 | 0.4 | GO:0036017 | response to erythropoietin(GO:0036017) cellular response to erythropoietin(GO:0036018) |
| 0.2 | 4.9 | GO:0050860 | negative regulation of T cell receptor signaling pathway(GO:0050860) |
| 0.2 | 1.3 | GO:2000491 | positive regulation of hepatic stellate cell activation(GO:2000491) |
| 0.2 | 1.1 | GO:0015783 | GDP-fucose transport(GO:0015783) purine nucleotide-sugar transport(GO:0036079) |
| 0.2 | 2.4 | GO:0050861 | positive regulation of B cell receptor signaling pathway(GO:0050861) |
| 0.2 | 1.9 | GO:0060665 | regulation of branching involved in salivary gland morphogenesis by mesenchymal-epithelial signaling(GO:0060665) |
| 0.2 | 0.4 | GO:0036289 | peptidyl-serine autophosphorylation(GO:0036289) |
| 0.2 | 1.5 | GO:0036337 | Fas signaling pathway(GO:0036337) |
| 0.2 | 2.0 | GO:0042866 | pyruvate biosynthetic process(GO:0042866) |
| 0.2 | 1.6 | GO:0007197 | adenylate cyclase-inhibiting G-protein coupled acetylcholine receptor signaling pathway(GO:0007197) |
| 0.2 | 1.8 | GO:0043570 | maintenance of DNA repeat elements(GO:0043570) |
| 0.2 | 11.7 | GO:0045576 | mast cell activation(GO:0045576) |
| 0.2 | 1.8 | GO:0071557 | histone H3-K27 demethylation(GO:0071557) |
| 0.2 | 3.3 | GO:0043368 | positive T cell selection(GO:0043368) |
| 0.2 | 0.9 | GO:0003068 | age-dependent response to oxidative stress(GO:0001306) age-dependent response to reactive oxygen species(GO:0001315) regulation of systemic arterial blood pressure by acetylcholine(GO:0003068) vasodilation by acetylcholine involved in regulation of systemic arterial blood pressure(GO:0003069) regulation of systemic arterial blood pressure by neurotransmitter(GO:0003070) age-dependent general metabolic decline(GO:0007571) |
| 0.2 | 0.7 | GO:0051490 | negative regulation of filopodium assembly(GO:0051490) |
| 0.2 | 7.0 | GO:0002755 | MyD88-dependent toll-like receptor signaling pathway(GO:0002755) |
| 0.2 | 0.9 | GO:1904428 | negative regulation of tubulin deacetylation(GO:1904428) |
| 0.2 | 0.7 | GO:0016240 | autophagosome docking(GO:0016240) |
| 0.2 | 1.6 | GO:0072513 | positive regulation of secondary heart field cardioblast proliferation(GO:0072513) |
| 0.2 | 0.5 | GO:0046416 | D-amino acid metabolic process(GO:0046416) |
| 0.2 | 0.7 | GO:0038161 | prolactin signaling pathway(GO:0038161) |
| 0.2 | 1.1 | GO:0072752 | cellular response to rapamycin(GO:0072752) |
| 0.2 | 0.9 | GO:0043504 | mitochondrial DNA repair(GO:0043504) |
| 0.2 | 3.7 | GO:0045835 | negative regulation of meiotic nuclear division(GO:0045835) |
| 0.2 | 1.6 | GO:0035583 | sequestering of TGFbeta in extracellular matrix(GO:0035583) |
| 0.2 | 0.7 | GO:0042776 | mitochondrial ATP synthesis coupled proton transport(GO:0042776) |
| 0.2 | 0.3 | GO:0038162 | erythropoietin-mediated signaling pathway(GO:0038162) |
| 0.2 | 27.3 | GO:0002377 | immunoglobulin production(GO:0002377) |
| 0.2 | 1.9 | GO:0032264 | IMP salvage(GO:0032264) |
| 0.2 | 0.7 | GO:1903060 | regulation of N-terminal protein palmitoylation(GO:0060254) negative regulation of N-terminal protein palmitoylation(GO:0060262) negative regulation of protein lipidation(GO:1903060) |
| 0.2 | 1.5 | GO:0051725 | protein de-ADP-ribosylation(GO:0051725) |
| 0.2 | 1.2 | GO:0090188 | negative regulation of pancreatic juice secretion(GO:0090188) |
| 0.2 | 1.7 | GO:0038203 | TORC2 signaling(GO:0038203) |
| 0.2 | 1.0 | GO:2000427 | positive regulation of apoptotic cell clearance(GO:2000427) |
| 0.2 | 1.9 | GO:0035984 | primary heart field specification(GO:0003138) sinoatrial valve development(GO:0003172) sinoatrial valve morphogenesis(GO:0003185) response to trichostatin A(GO:0035983) cellular response to trichostatin A(GO:0035984) |
| 0.2 | 0.7 | GO:1900165 | negative regulation of interleukin-6 secretion(GO:1900165) |
| 0.2 | 1.0 | GO:0030200 | heparan sulfate proteoglycan catabolic process(GO:0030200) |
| 0.2 | 0.5 | GO:1901053 | sarcosine metabolic process(GO:1901052) sarcosine catabolic process(GO:1901053) |
| 0.2 | 1.7 | GO:0006572 | tyrosine catabolic process(GO:0006572) |
| 0.2 | 1.0 | GO:0051122 | hepoxilin metabolic process(GO:0051121) hepoxilin biosynthetic process(GO:0051122) |
| 0.2 | 2.0 | GO:0003228 | atrial cardiac muscle tissue development(GO:0003228) atrial cardiac muscle tissue morphogenesis(GO:0055009) |
| 0.2 | 2.2 | GO:0060155 | platelet dense granule organization(GO:0060155) |
| 0.2 | 0.2 | GO:1903215 | negative regulation of protein targeting to mitochondrion(GO:1903215) |
| 0.2 | 2.0 | GO:0032482 | Rab protein signal transduction(GO:0032482) |
| 0.2 | 0.8 | GO:0035585 | calcium-mediated signaling using extracellular calcium source(GO:0035585) |
| 0.2 | 2.3 | GO:0061158 | 3'-UTR-mediated mRNA destabilization(GO:0061158) |
| 0.2 | 1.3 | GO:0072310 | glomerular visceral epithelial cell development(GO:0072015) glomerular epithelial cell development(GO:0072310) |
| 0.2 | 2.3 | GO:0032988 | ribonucleoprotein complex disassembly(GO:0032988) |
| 0.2 | 0.5 | GO:0036155 | acylglycerol acyl-chain remodeling(GO:0036155) |
| 0.2 | 3.6 | GO:0007597 | blood coagulation, intrinsic pathway(GO:0007597) |
| 0.2 | 1.2 | GO:0003363 | lamellipodium assembly involved in ameboidal cell migration(GO:0003363) extension of a leading process involved in cell motility in cerebral cortex radial glia guided migration(GO:0021816) |
| 0.2 | 1.0 | GO:0006696 | ergosterol biosynthetic process(GO:0006696) ergosterol metabolic process(GO:0008204) |
| 0.2 | 0.7 | GO:0002725 | negative regulation of T cell cytokine production(GO:0002725) |
| 0.2 | 3.9 | GO:0048742 | regulation of skeletal muscle fiber development(GO:0048742) |
| 0.2 | 0.7 | GO:2000196 | positive regulation of female gonad development(GO:2000196) |
| 0.2 | 2.1 | GO:0060059 | embryonic retina morphogenesis in camera-type eye(GO:0060059) |
| 0.2 | 0.8 | GO:0003408 | optic cup formation involved in camera-type eye development(GO:0003408) |
| 0.2 | 1.6 | GO:0010815 | bradykinin catabolic process(GO:0010815) |
| 0.2 | 1.9 | GO:0090527 | actin filament reorganization(GO:0090527) |
| 0.2 | 1.8 | GO:0060339 | negative regulation of type I interferon-mediated signaling pathway(GO:0060339) |
| 0.2 | 1.1 | GO:0030311 | poly-N-acetyllactosamine biosynthetic process(GO:0030311) |
| 0.2 | 0.2 | GO:0010157 | response to chlorate(GO:0010157) |
| 0.2 | 2.3 | GO:0090315 | negative regulation of protein targeting to membrane(GO:0090315) |
| 0.2 | 0.5 | GO:0014810 | positive regulation of skeletal muscle contraction by regulation of release of sequestered calcium ion(GO:0014810) |
| 0.2 | 0.3 | GO:2000049 | positive regulation of cell-cell adhesion mediated by cadherin(GO:2000049) |
| 0.2 | 1.3 | GO:0031936 | negative regulation of chromatin silencing(GO:0031936) |
| 0.2 | 8.3 | GO:0051569 | regulation of histone H3-K4 methylation(GO:0051569) |
| 0.2 | 0.2 | GO:0048859 | formation of anatomical boundary(GO:0048859) |
| 0.2 | 0.8 | GO:0030573 | bile acid catabolic process(GO:0030573) |
| 0.2 | 0.6 | GO:0010430 | fatty acid omega-oxidation(GO:0010430) |
| 0.2 | 1.4 | GO:2001300 | lipoxin metabolic process(GO:2001300) |
| 0.2 | 0.9 | GO:0006701 | progesterone biosynthetic process(GO:0006701) |
| 0.2 | 0.9 | GO:0021776 | smoothened signaling pathway involved in ventral spinal cord interneuron specification(GO:0021775) smoothened signaling pathway involved in spinal cord motor neuron cell fate specification(GO:0021776) |
| 0.2 | 5.6 | GO:0006099 | tricarboxylic acid cycle(GO:0006099) |
| 0.2 | 0.8 | GO:2000312 | regulation of kainate selective glutamate receptor activity(GO:2000312) |
| 0.2 | 1.1 | GO:2000189 | positive regulation of cholesterol homeostasis(GO:2000189) |
| 0.2 | 1.7 | GO:0002407 | dendritic cell chemotaxis(GO:0002407) |
| 0.2 | 0.5 | GO:0050883 | musculoskeletal movement, spinal reflex action(GO:0050883) |
| 0.2 | 0.5 | GO:0098507 | polynucleotide 5' dephosphorylation(GO:0098507) |
| 0.2 | 0.8 | GO:0001927 | exocyst assembly(GO:0001927) |
| 0.2 | 0.3 | GO:1904798 | regulation of core promoter binding(GO:1904796) positive regulation of core promoter binding(GO:1904798) |
| 0.2 | 1.2 | GO:0080182 | histone H3-K4 trimethylation(GO:0080182) |
| 0.2 | 3.7 | GO:0045063 | T-helper 1 cell differentiation(GO:0045063) |
| 0.2 | 0.9 | GO:0060010 | Sertoli cell fate commitment(GO:0060010) |
| 0.2 | 2.1 | GO:0034116 | positive regulation of heterotypic cell-cell adhesion(GO:0034116) |
| 0.2 | 1.4 | GO:0006616 | SRP-dependent cotranslational protein targeting to membrane, translocation(GO:0006616) |
| 0.2 | 0.3 | GO:0035441 | cell migration involved in vasculogenesis(GO:0035441) |
| 0.2 | 0.8 | GO:1903361 | protein localization to basolateral plasma membrane(GO:1903361) |
| 0.2 | 0.9 | GO:0070232 | regulation of T cell apoptotic process(GO:0070232) |
| 0.2 | 1.5 | GO:0002084 | protein depalmitoylation(GO:0002084) |
| 0.2 | 13.7 | GO:0060333 | interferon-gamma-mediated signaling pathway(GO:0060333) |
| 0.2 | 0.6 | GO:0036491 | regulation of translation initiation in response to endoplasmic reticulum stress(GO:0036491) eiF2alpha phosphorylation in response to endoplasmic reticulum stress(GO:0036492) negative regulation of endoplasmic reticulum stress-induced eIF2 alpha phosphorylation(GO:1903912) |
| 0.2 | 0.6 | GO:0051902 | negative regulation of mitochondrial depolarization(GO:0051902) |
| 0.1 | 1.3 | GO:0034316 | negative regulation of Arp2/3 complex-mediated actin nucleation(GO:0034316) |
| 0.1 | 1.2 | GO:0000183 | chromatin silencing at rDNA(GO:0000183) |
| 0.1 | 0.6 | GO:0042823 | pyridoxal phosphate biosynthetic process(GO:0042823) |
| 0.1 | 0.3 | GO:1904306 | regulation of gastro-intestinal system smooth muscle contraction(GO:1904304) positive regulation of gastro-intestinal system smooth muscle contraction(GO:1904306) |
| 0.1 | 0.1 | GO:0030718 | germ-line stem cell population maintenance(GO:0030718) |
| 0.1 | 0.4 | GO:1903452 | regulation of G1 to G0 transition(GO:1903450) positive regulation of G1 to G0 transition(GO:1903452) |
| 0.1 | 0.3 | GO:0097501 | stress response to metal ion(GO:0097501) |
| 0.1 | 1.3 | GO:0042346 | positive regulation of NF-kappaB import into nucleus(GO:0042346) |
| 0.1 | 3.8 | GO:0045747 | positive regulation of Notch signaling pathway(GO:0045747) |
| 0.1 | 1.2 | GO:0014744 | positive regulation of muscle adaptation(GO:0014744) |
| 0.1 | 0.7 | GO:2000270 | negative regulation of fibroblast apoptotic process(GO:2000270) |
| 0.1 | 6.7 | GO:0007205 | protein kinase C-activating G-protein coupled receptor signaling pathway(GO:0007205) |
| 0.1 | 2.6 | GO:0043248 | proteasome assembly(GO:0043248) |
| 0.1 | 3.2 | GO:0042347 | negative regulation of NF-kappaB import into nucleus(GO:0042347) |
| 0.1 | 1.7 | GO:0098870 | neuronal action potential propagation(GO:0019227) action potential propagation(GO:0098870) |
| 0.1 | 0.3 | GO:0032714 | negative regulation of interleukin-5 production(GO:0032714) |
| 0.1 | 2.5 | GO:0097094 | craniofacial suture morphogenesis(GO:0097094) |
| 0.1 | 0.6 | GO:0036496 | regulation of translational initiation by eIF2 alpha dephosphorylation(GO:0036496) |
| 0.1 | 0.9 | GO:0071494 | cellular response to UV-C(GO:0071494) |
| 0.1 | 0.7 | GO:0043950 | positive regulation of cAMP-mediated signaling(GO:0043950) |
| 0.1 | 1.7 | GO:0071361 | cellular response to ethanol(GO:0071361) |
| 0.1 | 0.3 | GO:0010870 | positive regulation of receptor biosynthetic process(GO:0010870) positive regulation of low-density lipoprotein particle receptor biosynthetic process(GO:0045716) |
| 0.1 | 1.7 | GO:0001561 | fatty acid alpha-oxidation(GO:0001561) |
| 0.1 | 0.3 | GO:1901069 | guanosine-containing compound catabolic process(GO:1901069) |
| 0.1 | 0.3 | GO:0002361 | CD4-positive, CD25-positive, alpha-beta regulatory T cell differentiation(GO:0002361) |
| 0.1 | 0.7 | GO:0006167 | AMP biosynthetic process(GO:0006167) |
| 0.1 | 2.0 | GO:0034498 | early endosome to Golgi transport(GO:0034498) |
| 0.1 | 6.0 | GO:0018345 | protein palmitoylation(GO:0018345) |
| 0.1 | 0.4 | GO:1903521 | apoptotic process involved in mammary gland involution(GO:0060057) positive regulation of apoptotic process involved in mammary gland involution(GO:0060058) positive regulation of apoptotic process involved in morphogenesis(GO:1902339) regulation of mammary gland involution(GO:1903519) positive regulation of mammary gland involution(GO:1903521) positive regulation of apoptotic process involved in development(GO:1904747) |
| 0.1 | 0.4 | GO:1902896 | terminal web assembly(GO:1902896) |
| 0.1 | 1.8 | GO:1990845 | adaptive thermogenesis(GO:1990845) |
| 0.1 | 1.1 | GO:0010510 | regulation of acetyl-CoA biosynthetic process from pyruvate(GO:0010510) |
| 0.1 | 0.7 | GO:1902904 | negative regulation of fibril organization(GO:1902904) chaperone-mediated autophagy translocation complex disassembly(GO:1904764) |
| 0.1 | 0.4 | GO:0035726 | common myeloid progenitor cell proliferation(GO:0035726) |
| 0.1 | 0.3 | GO:0031990 | mRNA export from nucleus in response to heat stress(GO:0031990) |
| 0.1 | 0.4 | GO:2000819 | regulation of nucleotide-excision repair(GO:2000819) |
| 0.1 | 92.9 | GO:0002283 | neutrophil activation involved in immune response(GO:0002283) neutrophil degranulation(GO:0043312) |
| 0.1 | 0.8 | GO:0048664 | neuron fate determination(GO:0048664) |
| 0.1 | 1.3 | GO:0090197 | positive regulation of chemokine secretion(GO:0090197) |
| 0.1 | 0.5 | GO:0045013 | carbon catabolite repression of transcription(GO:0045013) negative regulation of transcription by glucose(GO:0045014) |
| 0.1 | 0.4 | GO:0000967 | endonucleolytic cleavage to generate mature 5'-end of SSU-rRNA from (SSU-rRNA, 5.8S rRNA, LSU-rRNA)(GO:0000472) rRNA 5'-end processing(GO:0000967) ncRNA 5'-end processing(GO:0034471) |
| 0.1 | 2.1 | GO:0090168 | Golgi reassembly(GO:0090168) |
| 0.1 | 0.3 | GO:0006987 | activation of signaling protein activity involved in unfolded protein response(GO:0006987) |
| 0.1 | 1.1 | GO:0032780 | negative regulation of ATPase activity(GO:0032780) |
| 0.1 | 0.9 | GO:0070827 | chromatin maintenance(GO:0070827) |
| 0.1 | 0.4 | GO:0060018 | astrocyte fate commitment(GO:0060018) |
| 0.1 | 0.4 | GO:1904211 | membrane protein proteolysis involved in retrograde protein transport, ER to cytosol(GO:1904211) |
| 0.1 | 2.5 | GO:0043562 | cellular response to nitrogen starvation(GO:0006995) cellular response to nitrogen levels(GO:0043562) |
| 0.1 | 0.9 | GO:0051697 | protein delipidation(GO:0051697) |
| 0.1 | 0.1 | GO:0016078 | tRNA catabolic process(GO:0016078) |
| 0.1 | 1.0 | GO:0090625 | miRNA loading onto RISC involved in gene silencing by miRNA(GO:0035280) mRNA cleavage involved in gene silencing by siRNA(GO:0090625) |
| 0.1 | 0.6 | GO:0036233 | glycine import(GO:0036233) |
| 0.1 | 0.4 | GO:0051935 | amino acid neurotransmitter reuptake(GO:0051933) glutamate reuptake(GO:0051935) |
| 0.1 | 0.6 | GO:0030806 | negative regulation of cyclic nucleotide catabolic process(GO:0030806) negative regulation of cAMP catabolic process(GO:0030821) negative regulation of purine nucleotide catabolic process(GO:0033122) |
| 0.1 | 0.8 | GO:0071104 | response to interleukin-9(GO:0071104) |
| 0.1 | 0.5 | GO:0070681 | glutaminyl-tRNAGln biosynthesis via transamidation(GO:0070681) |
| 0.1 | 0.5 | GO:0070895 | transposon integration(GO:0070893) regulation of transposon integration(GO:0070894) negative regulation of transposon integration(GO:0070895) |
| 0.1 | 0.4 | GO:0071469 | cellular response to alkaline pH(GO:0071469) |
| 0.1 | 0.3 | GO:0051792 | medium-chain fatty acid biosynthetic process(GO:0051792) |
| 0.1 | 2.0 | GO:0010763 | positive regulation of fibroblast migration(GO:0010763) |
| 0.1 | 0.4 | GO:0009644 | response to high light intensity(GO:0009644) |
| 0.1 | 5.9 | GO:0007274 | neuromuscular synaptic transmission(GO:0007274) |
| 0.1 | 0.5 | GO:0000738 | DNA catabolic process, exonucleolytic(GO:0000738) |
| 0.1 | 3.4 | GO:0042136 | neurotransmitter biosynthetic process(GO:0042136) |
| 0.1 | 0.2 | GO:0070676 | intralumenal vesicle formation(GO:0070676) |
| 0.1 | 1.4 | GO:1990034 | calcium ion export from cell(GO:1990034) |
| 0.1 | 0.7 | GO:0090435 | protein localization to nuclear envelope(GO:0090435) |
| 0.1 | 0.4 | GO:2000017 | endocardial cell fate commitment(GO:0060957) endocardial cushion cell differentiation(GO:0061443) endocardial cushion cell fate commitment(GO:0061445) positive regulation of determination of dorsal identity(GO:2000017) |
| 0.1 | 2.0 | GO:0036295 | cellular response to increased oxygen levels(GO:0036295) |
| 0.1 | 0.7 | GO:0042094 | interleukin-2 biosynthetic process(GO:0042094) |
| 0.1 | 1.6 | GO:1903943 | negative regulation of myoblast fusion(GO:1901740) regulation of hepatocyte apoptotic process(GO:1903943) negative regulation of hepatocyte apoptotic process(GO:1903944) |
| 0.1 | 4.2 | GO:0048665 | neuron fate specification(GO:0048665) |
| 0.1 | 0.6 | GO:0010911 | regulation of isomerase activity(GO:0010911) positive regulation of isomerase activity(GO:0010912) regulation of DNA topoisomerase (ATP-hydrolyzing) activity(GO:2000371) positive regulation of DNA topoisomerase (ATP-hydrolyzing) activity(GO:2000373) |
| 0.1 | 2.4 | GO:0071397 | cellular response to cholesterol(GO:0071397) |
| 0.1 | 16.6 | GO:0050851 | antigen receptor-mediated signaling pathway(GO:0050851) |
| 0.1 | 3.8 | GO:0015879 | carnitine transport(GO:0015879) |
| 0.1 | 0.5 | GO:0003310 | pancreatic A cell differentiation(GO:0003310) |
| 0.1 | 1.0 | GO:0008340 | determination of adult lifespan(GO:0008340) |
| 0.1 | 1.7 | GO:0034472 | snRNA 3'-end processing(GO:0034472) |
| 0.1 | 0.5 | GO:0072334 | UDP-galactose transport(GO:0015785) UDP-galactose transmembrane transport(GO:0072334) |
| 0.1 | 0.4 | GO:0071462 | cellular response to water deprivation(GO:0042631) cellular response to water stimulus(GO:0071462) |
| 0.1 | 7.4 | GO:0000186 | activation of MAPKK activity(GO:0000186) |
| 0.1 | 0.8 | GO:0045647 | negative regulation of erythrocyte differentiation(GO:0045647) |
| 0.1 | 2.7 | GO:0009812 | flavonoid metabolic process(GO:0009812) |
| 0.1 | 1.2 | GO:0006878 | cellular copper ion homeostasis(GO:0006878) |
| 0.1 | 1.4 | GO:0032876 | negative regulation of DNA endoreduplication(GO:0032876) |
| 0.1 | 2.0 | GO:0035090 | maintenance of apical/basal cell polarity(GO:0035090) maintenance of epithelial cell apical/basal polarity(GO:0045199) |
| 0.1 | 1.5 | GO:0014870 | response to muscle inactivity(GO:0014870) |
| 0.1 | 0.6 | GO:0007172 | signal complex assembly(GO:0007172) |
| 0.1 | 1.2 | GO:0010032 | meiotic chromosome condensation(GO:0010032) |
| 0.1 | 4.6 | GO:0030212 | hyaluronan metabolic process(GO:0030212) |
| 0.1 | 0.5 | GO:0019626 | short-chain fatty acid catabolic process(GO:0019626) |
| 0.1 | 0.8 | GO:0036112 | medium-chain fatty-acyl-CoA metabolic process(GO:0036112) |
| 0.1 | 0.7 | GO:0010793 | regulation of mRNA export from nucleus(GO:0010793) |
| 0.1 | 0.2 | GO:0001970 | positive regulation of activation of membrane attack complex(GO:0001970) |
| 0.1 | 0.2 | GO:0032620 | interleukin-17 production(GO:0032620) |
| 0.1 | 0.6 | GO:0048680 | positive regulation of axon regeneration(GO:0048680) positive regulation of neuron projection regeneration(GO:0070572) |
| 0.1 | 0.7 | GO:0071955 | recycling endosome to Golgi transport(GO:0071955) |
| 0.1 | 0.2 | GO:1990000 | amyloid fibril formation(GO:1990000) |
| 0.1 | 0.6 | GO:0042415 | norepinephrine metabolic process(GO:0042415) |
| 0.1 | 2.8 | GO:0006020 | inositol metabolic process(GO:0006020) |
| 0.1 | 0.7 | GO:0021764 | amygdala development(GO:0021764) |
| 0.1 | 0.3 | GO:0070175 | positive regulation of enamel mineralization(GO:0070175) |
| 0.1 | 3.1 | GO:0007257 | activation of JUN kinase activity(GO:0007257) |
| 0.1 | 0.2 | GO:0086073 | bundle of His cell-Purkinje myocyte adhesion involved in cell communication(GO:0086073) |
| 0.1 | 0.4 | GO:0010869 | regulation of receptor biosynthetic process(GO:0010869) |
| 0.1 | 0.9 | GO:0002036 | regulation of L-glutamate transport(GO:0002036) |
| 0.1 | 2.4 | GO:0060211 | regulation of nuclear-transcribed mRNA poly(A) tail shortening(GO:0060211) positive regulation of nuclear-transcribed mRNA poly(A) tail shortening(GO:0060213) |
| 0.1 | 0.6 | GO:0030321 | transepithelial chloride transport(GO:0030321) |
| 0.1 | 0.8 | GO:0010818 | T cell chemotaxis(GO:0010818) |
| 0.1 | 4.7 | GO:0032012 | regulation of ARF protein signal transduction(GO:0032012) |
| 0.1 | 0.5 | GO:0090219 | negative regulation of lipid kinase activity(GO:0090219) |
| 0.1 | 0.7 | GO:0010890 | positive regulation of sequestering of triglyceride(GO:0010890) |
| 0.1 | 0.6 | GO:0002715 | regulation of natural killer cell mediated immunity(GO:0002715) |
| 0.1 | 0.2 | GO:0090298 | regulation of mitochondrial DNA replication(GO:0090296) negative regulation of mitochondrial DNA replication(GO:0090298) negative regulation of mitochondrial DNA metabolic process(GO:1901859) |
| 0.1 | 1.2 | GO:0043569 | negative regulation of insulin-like growth factor receptor signaling pathway(GO:0043569) |
| 0.1 | 1.0 | GO:0035494 | SNARE complex disassembly(GO:0035494) |
| 0.1 | 1.5 | GO:0043555 | regulation of translation in response to stress(GO:0043555) |
| 0.1 | 0.2 | GO:0001777 | T cell homeostatic proliferation(GO:0001777) regulation of T cell homeostatic proliferation(GO:0046013) |
| 0.1 | 0.3 | GO:0038193 | thromboxane A2 signaling pathway(GO:0038193) |
| 0.1 | 1.8 | GO:0070070 | proton-transporting V-type ATPase complex assembly(GO:0070070) vacuolar proton-transporting V-type ATPase complex assembly(GO:0070072) |
| 0.1 | 0.3 | GO:0019085 | early viral transcription(GO:0019085) |
| 0.1 | 0.4 | GO:0023021 | termination of signal transduction(GO:0023021) |
| 0.1 | 0.2 | GO:0042779 | tRNA 3'-trailer cleavage, endonucleolytic(GO:0034414) tRNA 3'-trailer cleavage(GO:0042779) |
| 0.1 | 0.5 | GO:1990426 | homologous recombination-dependent replication fork processing(GO:1990426) |
| 0.1 | 7.8 | GO:0032481 | positive regulation of type I interferon production(GO:0032481) |
| 0.1 | 1.2 | GO:0031119 | tRNA pseudouridine synthesis(GO:0031119) |
| 0.1 | 0.8 | GO:0030242 | pexophagy(GO:0030242) |
| 0.1 | 0.1 | GO:2000845 | testosterone secretion(GO:0035936) regulation of testosterone secretion(GO:2000843) positive regulation of testosterone secretion(GO:2000845) |
| 0.1 | 0.9 | GO:0051694 | pointed-end actin filament capping(GO:0051694) |
| 0.1 | 0.4 | GO:0032803 | regulation of low-density lipoprotein particle receptor catabolic process(GO:0032803) negative regulation of low-density lipoprotein particle receptor catabolic process(GO:0032804) |
| 0.1 | 0.4 | GO:0048715 | negative regulation of oligodendrocyte differentiation(GO:0048715) |
| 0.1 | 0.6 | GO:0060770 | negative regulation of epithelial cell proliferation involved in prostate gland development(GO:0060770) |
| 0.1 | 1.8 | GO:0003376 | sphingosine-1-phosphate signaling pathway(GO:0003376) |
| 0.1 | 0.7 | GO:0046092 | deoxycytidine metabolic process(GO:0046092) |
| 0.1 | 0.2 | GO:0015788 | UDP-N-acetylglucosamine transport(GO:0015788) UDP-N-acetylglucosamine transmembrane transport(GO:1990569) |
| 0.1 | 1.5 | GO:0006089 | lactate metabolic process(GO:0006089) |
| 0.1 | 0.2 | GO:0034287 | detection of carbohydrate stimulus(GO:0009730) detection of hexose stimulus(GO:0009732) detection of monosaccharide stimulus(GO:0034287) detection of glucose(GO:0051594) |
| 0.1 | 0.5 | GO:0009196 | dUDP biosynthetic process(GO:0006227) dTDP biosynthetic process(GO:0006233) pyrimidine nucleoside diphosphate metabolic process(GO:0009138) pyrimidine nucleoside diphosphate biosynthetic process(GO:0009139) pyrimidine deoxyribonucleoside diphosphate metabolic process(GO:0009196) pyrimidine deoxyribonucleoside diphosphate biosynthetic process(GO:0009197) dTDP metabolic process(GO:0046072) dUDP metabolic process(GO:0046077) |
| 0.1 | 34.9 | GO:0050911 | detection of chemical stimulus involved in sensory perception of smell(GO:0050911) |
| 0.1 | 0.4 | GO:0046603 | negative regulation of mitotic centrosome separation(GO:0046603) |
| 0.1 | 1.0 | GO:0098909 | regulation of cardiac muscle cell action potential involved in regulation of contraction(GO:0098909) |
| 0.1 | 2.5 | GO:0050962 | detection of light stimulus involved in visual perception(GO:0050908) detection of light stimulus involved in sensory perception(GO:0050962) |
| 0.1 | 0.7 | GO:0002677 | negative regulation of chronic inflammatory response(GO:0002677) |
| 0.1 | 0.6 | GO:0022027 | interkinetic nuclear migration(GO:0022027) |
| 0.1 | 0.5 | GO:0097026 | dendritic cell dendrite assembly(GO:0097026) |
| 0.1 | 1.1 | GO:0038171 | cannabinoid signaling pathway(GO:0038171) |
| 0.1 | 0.6 | GO:2001137 | positive regulation of endocytic recycling(GO:2001137) |
| 0.1 | 0.8 | GO:0010650 | positive regulation of cell communication by electrical coupling(GO:0010650) |
| 0.1 | 0.2 | GO:0061146 | Peyer's patch morphogenesis(GO:0061146) |
| 0.1 | 0.2 | GO:0014878 | response to electrical stimulus involved in regulation of muscle adaptation(GO:0014878) |
| 0.1 | 2.6 | GO:0002228 | natural killer cell mediated immunity(GO:0002228) |
| 0.1 | 0.9 | GO:0002820 | negative regulation of adaptive immune response(GO:0002820) |
| 0.1 | 0.7 | GO:0032025 | response to cobalt ion(GO:0032025) |
| 0.1 | 3.3 | GO:0002260 | lymphocyte homeostasis(GO:0002260) |
| 0.1 | 0.6 | GO:1903566 | positive regulation of protein localization to cilium(GO:1903566) |
| 0.1 | 0.4 | GO:0016259 | selenocysteine metabolic process(GO:0016259) |
| 0.1 | 2.5 | GO:0015936 | coenzyme A metabolic process(GO:0015936) |
| 0.1 | 0.5 | GO:0070901 | mitochondrial tRNA methylation(GO:0070901) |
| 0.1 | 1.3 | GO:0046549 | retinal cone cell differentiation(GO:0042670) retinal cone cell development(GO:0046549) |
| 0.1 | 0.3 | GO:0099566 | regulation of postsynaptic cytosolic calcium ion concentration(GO:0099566) |
| 0.1 | 0.5 | GO:0097398 | response to interleukin-17(GO:0097396) cellular response to interleukin-17(GO:0097398) |
| 0.1 | 2.8 | GO:0001556 | oocyte maturation(GO:0001556) |
| 0.1 | 0.4 | GO:0003419 | growth plate cartilage chondrocyte proliferation(GO:0003419) |
| 0.1 | 1.0 | GO:0035965 | cardiolipin acyl-chain remodeling(GO:0035965) |
| 0.1 | 0.5 | GO:0048712 | negative regulation of astrocyte differentiation(GO:0048712) |
| 0.1 | 0.8 | GO:0090009 | primitive streak formation(GO:0090009) |
| 0.1 | 0.9 | GO:0043277 | apoptotic cell clearance(GO:0043277) |
| 0.1 | 4.7 | GO:0045652 | regulation of megakaryocyte differentiation(GO:0045652) |
| 0.1 | 0.5 | GO:0098838 | reduced folate transmembrane transport(GO:0098838) |
| 0.1 | 0.5 | GO:0006235 | dTTP biosynthetic process(GO:0006235) pyrimidine deoxyribonucleoside triphosphate biosynthetic process(GO:0009212) |
| 0.1 | 1.7 | GO:0002819 | regulation of adaptive immune response(GO:0002819) |
| 0.1 | 0.5 | GO:0051014 | actin filament severing(GO:0051014) |
| 0.1 | 0.3 | GO:0035048 | splicing factor protein import into nucleus(GO:0035048) |
| 0.1 | 0.1 | GO:0046102 | hypoxanthine metabolic process(GO:0046100) hypoxanthine biosynthetic process(GO:0046101) inosine metabolic process(GO:0046102) |
| 0.1 | 0.3 | GO:0070145 | mitochondrial asparaginyl-tRNA aminoacylation(GO:0070145) |
| 0.1 | 6.5 | GO:0006120 | mitochondrial electron transport, NADH to ubiquinone(GO:0006120) |
| 0.1 | 1.4 | GO:0045577 | regulation of B cell differentiation(GO:0045577) |
| 0.1 | 1.0 | GO:0046710 | GDP metabolic process(GO:0046710) |
| 0.1 | 0.2 | GO:0014901 | regulation of satellite cell activation involved in skeletal muscle regeneration(GO:0014717) satellite cell activation involved in skeletal muscle regeneration(GO:0014901) |
| 0.1 | 1.0 | GO:1990822 | basic amino acid transmembrane transport(GO:1990822) |
| 0.1 | 0.4 | GO:0090063 | positive regulation of microtubule nucleation(GO:0090063) |
| 0.1 | 0.4 | GO:0007252 | I-kappaB phosphorylation(GO:0007252) |
| 0.1 | 0.1 | GO:0042137 | sequestering of neurotransmitter(GO:0042137) |
| 0.1 | 4.9 | GO:0046626 | regulation of insulin receptor signaling pathway(GO:0046626) |
| 0.1 | 0.3 | GO:0006990 | positive regulation of transcription from RNA polymerase II promoter involved in unfolded protein response(GO:0006990) |
| 0.1 | 0.2 | GO:0097065 | anterior head development(GO:0097065) regulation of anterior head development(GO:2000742) positive regulation of anterior head development(GO:2000744) |
| 0.1 | 0.7 | GO:1902856 | negative regulation of nonmotile primary cilium assembly(GO:1902856) |
| 0.1 | 0.9 | GO:0002051 | osteoblast fate commitment(GO:0002051) |
| 0.1 | 0.6 | GO:0043653 | mitochondrial fragmentation involved in apoptotic process(GO:0043653) |
| 0.1 | 0.2 | GO:0038028 | insulin receptor signaling pathway via phosphatidylinositol 3-kinase(GO:0038028) |
| 0.1 | 0.5 | GO:0070966 | nuclear-transcribed mRNA catabolic process, no-go decay(GO:0070966) |
| 0.1 | 1.6 | GO:0019432 | triglyceride biosynthetic process(GO:0019432) |
| 0.1 | 1.0 | GO:0060453 | regulation of gastric acid secretion(GO:0060453) |
| 0.1 | 1.0 | GO:0048702 | embryonic neurocranium morphogenesis(GO:0048702) |
| 0.1 | 0.6 | GO:0035610 | protein side chain deglutamylation(GO:0035610) |
| 0.1 | 0.3 | GO:0009048 | dosage compensation(GO:0007549) dosage compensation by inactivation of X chromosome(GO:0009048) |
| 0.1 | 0.7 | GO:1900246 | positive regulation of RIG-I signaling pathway(GO:1900246) |
| 0.1 | 0.7 | GO:0032929 | negative regulation of superoxide anion generation(GO:0032929) |
| 0.1 | 0.4 | GO:0034093 | positive regulation of maintenance of sister chromatid cohesion(GO:0034093) positive regulation of maintenance of mitotic sister chromatid cohesion(GO:0034184) |
| 0.1 | 2.3 | GO:0007026 | negative regulation of microtubule depolymerization(GO:0007026) regulation of microtubule depolymerization(GO:0031114) |
| 0.1 | 0.2 | GO:0071043 | CUT catabolic process(GO:0071034) CUT metabolic process(GO:0071043) |
| 0.1 | 4.5 | GO:0006376 | mRNA splice site selection(GO:0006376) |
| 0.1 | 0.4 | GO:0035026 | leading edge cell differentiation(GO:0035026) |
| 0.1 | 0.4 | GO:0038169 | somatostatin receptor signaling pathway(GO:0038169) somatostatin signaling pathway(GO:0038170) |
| 0.1 | 2.0 | GO:0006123 | mitochondrial electron transport, cytochrome c to oxygen(GO:0006123) |
| 0.1 | 2.0 | GO:0031648 | protein destabilization(GO:0031648) |
| 0.1 | 0.2 | GO:0051799 | negative regulation of hair follicle development(GO:0051799) |
| 0.1 | 0.9 | GO:0019344 | cysteine biosynthetic process(GO:0019344) |
| 0.1 | 1.0 | GO:0048934 | peripheral nervous system neuron differentiation(GO:0048934) peripheral nervous system neuron development(GO:0048935) |
| 0.1 | 0.2 | GO:0035724 | CD24 biosynthetic process(GO:0035724) activation of meiosis involved in egg activation(GO:0060466) negative regulation of monocyte extravasation(GO:2000438) regulation of CD24 biosynthetic process(GO:2000559) positive regulation of CD24 biosynthetic process(GO:2000560) |
| 0.1 | 0.5 | GO:0033015 | porphyrin-containing compound catabolic process(GO:0006787) tetrapyrrole catabolic process(GO:0033015) heme catabolic process(GO:0042167) pigment catabolic process(GO:0046149) |
| 0.1 | 1.1 | GO:0016180 | snRNA processing(GO:0016180) |
| 0.1 | 0.3 | GO:0015742 | alpha-ketoglutarate transport(GO:0015742) |
| 0.1 | 1.1 | GO:2000251 | positive regulation of actin cytoskeleton reorganization(GO:2000251) |
| 0.1 | 0.5 | GO:0014067 | negative regulation of phosphatidylinositol 3-kinase signaling(GO:0014067) |
| 0.1 | 0.5 | GO:0001661 | conditioned taste aversion(GO:0001661) |
| 0.1 | 1.1 | GO:0031629 | synaptic vesicle fusion to presynaptic active zone membrane(GO:0031629) vesicle fusion to plasma membrane(GO:0099500) |
| 0.1 | 0.2 | GO:0090675 | intermicrovillar adhesion(GO:0090675) |
| 0.1 | 1.6 | GO:0032418 | lysosome localization(GO:0032418) |
| 0.1 | 1.1 | GO:0016024 | CDP-diacylglycerol biosynthetic process(GO:0016024) |
| 0.1 | 0.5 | GO:0006049 | UDP-N-acetylglucosamine catabolic process(GO:0006049) |
| 0.1 | 0.2 | GO:1990637 | response to prolactin(GO:1990637) |
| 0.1 | 0.7 | GO:0071044 | histone mRNA catabolic process(GO:0071044) |
| 0.1 | 0.4 | GO:0000429 | carbon catabolite regulation of transcription from RNA polymerase II promoter(GO:0000429) carbon catabolite activation of transcription from RNA polymerase II promoter(GO:0000436) carbon catabolite activation of transcription(GO:0045991) |
| 0.1 | 1.3 | GO:0019373 | epoxygenase P450 pathway(GO:0019373) |
| 0.1 | 1.2 | GO:0036344 | platelet formation(GO:0030220) platelet morphogenesis(GO:0036344) |
| 0.1 | 0.9 | GO:0000244 | spliceosomal tri-snRNP complex assembly(GO:0000244) |
| 0.1 | 0.6 | GO:0051835 | positive regulation of synapse structural plasticity(GO:0051835) |
| 0.1 | 0.8 | GO:1901096 | regulation of autophagosome maturation(GO:1901096) |
| 0.1 | 0.4 | GO:0031848 | protection from non-homologous end joining at telomere(GO:0031848) |
| 0.1 | 0.7 | GO:0046716 | muscle cell cellular homeostasis(GO:0046716) |
| 0.1 | 2.6 | GO:0030101 | natural killer cell activation(GO:0030101) |
| 0.1 | 3.6 | GO:0007040 | lysosome organization(GO:0007040) lytic vacuole organization(GO:0080171) |
| 0.1 | 0.2 | GO:1900368 | regulation of RNA interference(GO:1900368) |
| 0.1 | 0.6 | GO:0016255 | attachment of GPI anchor to protein(GO:0016255) |
| 0.1 | 0.3 | GO:1904970 | brush border assembly(GO:1904970) |
| 0.1 | 0.4 | GO:0019075 | virus maturation(GO:0019075) |
| 0.1 | 1.2 | GO:0015824 | proline transport(GO:0015824) |
| 0.1 | 0.4 | GO:0055005 | ventricular cardiac myofibril assembly(GO:0055005) |
| 0.1 | 0.8 | GO:0070050 | neuron cellular homeostasis(GO:0070050) |
| 0.1 | 0.1 | GO:0070173 | regulation of enamel mineralization(GO:0070173) |
| 0.1 | 0.5 | GO:0045188 | regulation of circadian sleep/wake cycle, non-REM sleep(GO:0045188) |
| 0.1 | 0.7 | GO:1904714 | regulation of chaperone-mediated autophagy(GO:1904714) |
| 0.1 | 1.4 | GO:0006555 | methionine metabolic process(GO:0006555) |
| 0.1 | 0.9 | GO:0060397 | JAK-STAT cascade involved in growth hormone signaling pathway(GO:0060397) |
| 0.1 | 1.8 | GO:0006054 | N-acetylneuraminate metabolic process(GO:0006054) |
| 0.1 | 0.7 | GO:0016556 | mRNA modification(GO:0016556) |
| 0.1 | 0.7 | GO:0031087 | nuclear-transcribed mRNA catabolic process, deadenylation-independent decay(GO:0031086) deadenylation-independent decapping of nuclear-transcribed mRNA(GO:0031087) |
| 0.1 | 0.3 | GO:0006172 | ADP biosynthetic process(GO:0006172) |
| 0.1 | 0.8 | GO:0051583 | dopamine uptake involved in synaptic transmission(GO:0051583) catecholamine uptake involved in synaptic transmission(GO:0051934) catecholamine uptake(GO:0090493) dopamine uptake(GO:0090494) |
| 0.1 | 0.7 | GO:0018401 | peptidyl-proline hydroxylation to 4-hydroxy-L-proline(GO:0018401) |
| 0.1 | 0.9 | GO:0044247 | polysaccharide catabolic process(GO:0000272) glycogen catabolic process(GO:0005980) glucan catabolic process(GO:0009251) cellular polysaccharide catabolic process(GO:0044247) |
| 0.1 | 0.2 | GO:0030576 | Cajal body organization(GO:0030576) |
| 0.1 | 0.6 | GO:0032287 | peripheral nervous system myelin maintenance(GO:0032287) |
| 0.1 | 0.3 | GO:2001013 | epithelial cell proliferation involved in renal tubule morphogenesis(GO:2001013) |
| 0.1 | 0.7 | GO:0006189 | 'de novo' IMP biosynthetic process(GO:0006189) |
| 0.1 | 1.0 | GO:0043508 | negative regulation of JUN kinase activity(GO:0043508) |
| 0.1 | 14.2 | GO:0031424 | keratinization(GO:0031424) |
| 0.1 | 0.5 | GO:0034244 | negative regulation of transcription elongation from RNA polymerase II promoter(GO:0034244) |
| 0.1 | 1.8 | GO:0097340 | inhibition of cysteine-type endopeptidase activity(GO:0097340) zymogen inhibition(GO:0097341) |
| 0.1 | 1.1 | GO:0071294 | cellular response to zinc ion(GO:0071294) |
| 0.1 | 1.4 | GO:0090200 | positive regulation of release of cytochrome c from mitochondria(GO:0090200) |
| 0.1 | 0.5 | GO:0050884 | neuromuscular process controlling posture(GO:0050884) |
| 0.1 | 0.1 | GO:1903630 | regulation of aminoacyl-tRNA ligase activity(GO:1903630) |
| 0.1 | 0.4 | GO:0018343 | protein farnesylation(GO:0018343) |
| 0.1 | 1.9 | GO:0034383 | low-density lipoprotein particle clearance(GO:0034383) |
| 0.1 | 0.7 | GO:0015693 | magnesium ion transport(GO:0015693) |
| 0.1 | 0.4 | GO:0021622 | optic vesicle morphogenesis(GO:0003404) optic cup structural organization(GO:0003409) oculomotor nerve morphogenesis(GO:0021622) oculomotor nerve formation(GO:0021623) |
| 0.1 | 0.4 | GO:0034227 | tRNA thio-modification(GO:0034227) |
| 0.1 | 0.3 | GO:0006107 | oxaloacetate metabolic process(GO:0006107) |
| 0.1 | 0.3 | GO:0072656 | maintenance of protein location in mitochondrion(GO:0072656) |
| 0.1 | 1.6 | GO:0006743 | ubiquinone metabolic process(GO:0006743) ubiquinone biosynthetic process(GO:0006744) quinone biosynthetic process(GO:1901663) |
| 0.1 | 1.1 | GO:0031163 | iron-sulfur cluster assembly(GO:0016226) metallo-sulfur cluster assembly(GO:0031163) |
| 0.1 | 0.8 | GO:0046135 | pyrimidine nucleoside catabolic process(GO:0046135) |
| 0.1 | 0.2 | GO:1904784 | NLRP1 inflammasome complex assembly(GO:1904784) |
| 0.1 | 0.3 | GO:0001560 | regulation of cell growth by extracellular stimulus(GO:0001560) |
| 0.1 | 0.3 | GO:0042738 | exogenous drug catabolic process(GO:0042738) |
| 0.1 | 0.8 | GO:0046951 | ketone body biosynthetic process(GO:0046951) |
| 0.1 | 0.4 | GO:0006772 | thiamine metabolic process(GO:0006772) |
| 0.1 | 2.6 | GO:0035338 | long-chain fatty-acyl-CoA biosynthetic process(GO:0035338) |
| 0.1 | 0.4 | GO:0033564 | anterior/posterior axon guidance(GO:0033564) |
| 0.1 | 0.2 | GO:1904044 | response to aldosterone(GO:1904044) cellular response to aldosterone(GO:1904045) |
| 0.1 | 2.9 | GO:0019985 | translesion synthesis(GO:0019985) |
| 0.1 | 0.2 | GO:0090149 | mitochondrial membrane fission(GO:0090149) |
| 0.1 | 0.2 | GO:0100057 | phenotypic switching(GO:0036166) regulation of phenotypic switching by transcription from RNA polymerase II promoter(GO:0100057) regulation of phenotypic switching(GO:1900239) regulation of hydrogen sulfide biosynthetic process(GO:1904826) positive regulation of hydrogen sulfide biosynthetic process(GO:1904828) |
| 0.1 | 1.2 | GO:0046337 | phosphatidylethanolamine metabolic process(GO:0046337) |
| 0.1 | 1.9 | GO:0006851 | mitochondrial calcium ion transport(GO:0006851) |
| 0.1 | 0.1 | GO:0045903 | positive regulation of translational fidelity(GO:0045903) |
| 0.1 | 1.0 | GO:0031284 | positive regulation of guanylate cyclase activity(GO:0031284) |
| 0.1 | 0.8 | GO:0015747 | urate transport(GO:0015747) |
| 0.1 | 0.2 | GO:0034499 | late endosome to Golgi transport(GO:0034499) |
| 0.1 | 0.3 | GO:0007168 | receptor guanylyl cyclase signaling pathway(GO:0007168) |
| 0.1 | 0.2 | GO:0000023 | maltose metabolic process(GO:0000023) |
| 0.1 | 7.8 | GO:0090630 | activation of GTPase activity(GO:0090630) |
| 0.1 | 2.8 | GO:0071431 | tRNA export from nucleus(GO:0006409) tRNA-containing ribonucleoprotein complex export from nucleus(GO:0071431) |
| 0.1 | 0.2 | GO:1903755 | regulation of SUMO transferase activity(GO:1903182) positive regulation of SUMO transferase activity(GO:1903755) |
| 0.1 | 0.2 | GO:0043587 | tongue morphogenesis(GO:0043587) |
| 0.1 | 1.2 | GO:0051560 | mitochondrial calcium ion homeostasis(GO:0051560) |
| 0.1 | 0.1 | GO:1901856 | negative regulation of cellular respiration(GO:1901856) |
| 0.1 | 0.2 | GO:0035627 | ceramide transport(GO:0035627) |
| 0.1 | 0.2 | GO:0032225 | regulation of synaptic transmission, dopaminergic(GO:0032225) |
| 0.1 | 0.3 | GO:1901503 | ether lipid biosynthetic process(GO:0008611) glycerol ether biosynthetic process(GO:0046504) ether biosynthetic process(GO:1901503) |
| 0.1 | 4.1 | GO:0000381 | regulation of alternative mRNA splicing, via spliceosome(GO:0000381) |
| 0.1 | 0.1 | GO:0048549 | positive regulation of pinocytosis(GO:0048549) |
| 0.1 | 0.2 | GO:0016121 | tetraterpenoid metabolic process(GO:0016108) carotenoid metabolic process(GO:0016116) carotene catabolic process(GO:0016121) xanthophyll metabolic process(GO:0016122) terpene catabolic process(GO:0046247) |
| 0.1 | 0.5 | GO:0017183 | peptidyl-diphthamide metabolic process(GO:0017182) peptidyl-diphthamide biosynthetic process from peptidyl-histidine(GO:0017183) |
| 0.1 | 0.3 | GO:0006707 | cholesterol catabolic process(GO:0006707) sterol catabolic process(GO:0016127) |
| 0.1 | 0.6 | GO:0000160 | phosphorelay signal transduction system(GO:0000160) |
| 0.1 | 0.2 | GO:0071348 | response to interleukin-11(GO:0071105) cellular response to interleukin-11(GO:0071348) |
| 0.1 | 0.4 | GO:1903715 | regulation of aerobic respiration(GO:1903715) |
| 0.1 | 1.7 | GO:0051016 | barbed-end actin filament capping(GO:0051016) |
| 0.1 | 0.6 | GO:0007213 | G-protein coupled acetylcholine receptor signaling pathway(GO:0007213) |
| 0.1 | 0.2 | GO:0005989 | lactose metabolic process(GO:0005988) lactose biosynthetic process(GO:0005989) |
| 0.1 | 0.3 | GO:0006907 | pinocytosis(GO:0006907) |
| 0.1 | 1.5 | GO:0016578 | histone deubiquitination(GO:0016578) |
| 0.1 | 0.1 | GO:0002101 | tRNA wobble cytosine modification(GO:0002101) |
| 0.1 | 0.1 | GO:2000676 | positive regulation of type B pancreatic cell apoptotic process(GO:2000676) |
| 0.1 | 0.9 | GO:0021930 | cell proliferation in hindbrain(GO:0021534) cell proliferation in external granule layer(GO:0021924) cerebellar granule cell precursor proliferation(GO:0021930) |
| 0.1 | 0.3 | GO:0060068 | vagina development(GO:0060068) |
| 0.1 | 0.3 | GO:1902231 | positive regulation of intrinsic apoptotic signaling pathway in response to DNA damage(GO:1902231) |
| 0.1 | 0.9 | GO:0017121 | phospholipid scrambling(GO:0017121) |
| 0.1 | 0.5 | GO:0035879 | plasma membrane lactate transport(GO:0035879) |
| 0.1 | 0.2 | GO:0035336 | long-chain fatty-acyl-CoA metabolic process(GO:0035336) |
| 0.1 | 0.9 | GO:0014029 | neural crest formation(GO:0014029) |
| 0.1 | 0.8 | GO:0007023 | post-chaperonin tubulin folding pathway(GO:0007023) |
| 0.1 | 0.1 | GO:0046532 | regulation of photoreceptor cell differentiation(GO:0046532) |
| 0.1 | 0.6 | GO:0071374 | cellular response to parathyroid hormone stimulus(GO:0071374) |
| 0.1 | 0.9 | GO:0009263 | deoxyribonucleotide biosynthetic process(GO:0009263) |
| 0.1 | 0.2 | GO:0030579 | ubiquitin-dependent SMAD protein catabolic process(GO:0030579) |
| 0.1 | 0.6 | GO:0007196 | adenylate cyclase-inhibiting G-protein coupled glutamate receptor signaling pathway(GO:0007196) |
| 0.1 | 0.3 | GO:0035063 | nuclear speck organization(GO:0035063) |
| 0.1 | 2.3 | GO:0035235 | ionotropic glutamate receptor signaling pathway(GO:0035235) |
| 0.0 | 1.0 | GO:0021796 | cerebral cortex regionalization(GO:0021796) |
| 0.0 | 0.1 | GO:2000416 | regulation of eosinophil migration(GO:2000416) positive regulation of eosinophil migration(GO:2000418) |
| 0.0 | 0.5 | GO:1903818 | positive regulation of voltage-gated potassium channel activity(GO:1903818) |
| 0.0 | 0.4 | GO:0019236 | response to pheromone(GO:0019236) |
| 0.0 | 0.1 | GO:0060750 | epithelial cell proliferation involved in mammary gland duct elongation(GO:0060750) |
| 0.0 | 0.3 | GO:0006003 | fructose 2,6-bisphosphate metabolic process(GO:0006003) |
| 0.0 | 0.2 | GO:0043686 | co-translational protein modification(GO:0043686) |
| 0.0 | 0.5 | GO:0033235 | positive regulation of protein sumoylation(GO:0033235) |
| 0.0 | 0.6 | GO:0006681 | galactosylceramide metabolic process(GO:0006681) |
| 0.0 | 0.4 | GO:0010792 | DNA double-strand break processing involved in repair via single-strand annealing(GO:0010792) |
| 0.0 | 0.1 | GO:1990523 | bone regeneration(GO:1990523) |
| 0.0 | 0.9 | GO:1904886 | beta-catenin destruction complex disassembly(GO:1904886) |
| 0.0 | 0.4 | GO:0014010 | Schwann cell proliferation(GO:0014010) |
| 0.0 | 0.3 | GO:0019348 | dolichol metabolic process(GO:0019348) |
| 0.0 | 0.1 | GO:0061113 | pancreas morphogenesis(GO:0061113) |
| 0.0 | 1.1 | GO:0034776 | response to histamine(GO:0034776) |
| 0.0 | 1.0 | GO:0019835 | cytolysis(GO:0019835) |
| 0.0 | 0.2 | GO:0007000 | nucleolus organization(GO:0007000) |
| 0.0 | 0.5 | GO:0090280 | positive regulation of calcium ion import(GO:0090280) |
| 0.0 | 0.1 | GO:1903774 | positive regulation of viral budding via host ESCRT complex(GO:1903774) |
| 0.0 | 1.3 | GO:0006515 | misfolded or incompletely synthesized protein catabolic process(GO:0006515) |
| 0.0 | 1.6 | GO:0089711 | L-glutamate transmembrane transport(GO:0089711) |
| 0.0 | 0.3 | GO:0015712 | hexose phosphate transport(GO:0015712) glucose-6-phosphate transport(GO:0015760) |
| 0.0 | 0.1 | GO:0035519 | protein K29-linked ubiquitination(GO:0035519) |
| 0.0 | 1.3 | GO:1901224 | positive regulation of NIK/NF-kappaB signaling(GO:1901224) |
| 0.0 | 0.5 | GO:0005981 | regulation of glycogen catabolic process(GO:0005981) |
| 0.0 | 0.1 | GO:0036369 | transcription factor catabolic process(GO:0036369) |
| 0.0 | 0.3 | GO:0006657 | CDP-choline pathway(GO:0006657) |
| 0.0 | 0.3 | GO:0098787 | mRNA cleavage involved in mRNA processing(GO:0098787) pre-mRNA cleavage required for polyadenylation(GO:0098789) |
| 0.0 | 0.4 | GO:0070535 | negative regulation of histone ubiquitination(GO:0033183) histone H2A K63-linked ubiquitination(GO:0070535) regulation of histone H2A K63-linked ubiquitination(GO:1901314) negative regulation of histone H2A K63-linked ubiquitination(GO:1901315) |
| 0.0 | 0.2 | GO:0044117 | growth involved in symbiotic interaction(GO:0044110) growth of symbiont involved in interaction with host(GO:0044116) growth of symbiont in host(GO:0044117) regulation of growth of symbiont in host(GO:0044126) modulation of growth of symbiont involved in interaction with host(GO:0044144) |
| 0.0 | 0.3 | GO:0001731 | formation of translation preinitiation complex(GO:0001731) |
| 0.0 | 0.4 | GO:0017196 | N-terminal peptidyl-methionine acetylation(GO:0017196) |
| 0.0 | 0.2 | GO:0016344 | meiotic chromosome movement towards spindle pole(GO:0016344) homologous chromosome movement towards spindle pole involved in homologous chromosome segregation(GO:0051758) |
| 0.0 | 0.5 | GO:0038003 | opioid receptor signaling pathway(GO:0038003) |
| 0.0 | 0.4 | GO:0050428 | purine ribonucleoside bisphosphate biosynthetic process(GO:0034036) 3'-phosphoadenosine 5'-phosphosulfate biosynthetic process(GO:0050428) |
| 0.0 | 0.1 | GO:0006452 | translational frameshifting(GO:0006452) positive regulation of translational termination(GO:0045905) |
| 0.0 | 0.1 | GO:0030259 | lipid glycosylation(GO:0030259) |
| 0.0 | 0.7 | GO:0006895 | Golgi to endosome transport(GO:0006895) |
| 0.0 | 1.6 | GO:0070979 | protein K11-linked ubiquitination(GO:0070979) |
| 0.0 | 0.1 | GO:1901656 | glycoside transport(GO:1901656) |
| 0.0 | 1.3 | GO:0055069 | zinc ion homeostasis(GO:0055069) |
| 0.0 | 0.4 | GO:0043249 | erythrocyte maturation(GO:0043249) |
| 0.0 | 9.8 | GO:0006413 | translational initiation(GO:0006413) |
| 0.0 | 0.6 | GO:0010642 | negative regulation of platelet-derived growth factor receptor signaling pathway(GO:0010642) |
| 0.0 | 0.1 | GO:0030974 | thiamine pyrophosphate transport(GO:0030974) |
| 0.0 | 2.8 | GO:0051865 | protein autoubiquitination(GO:0051865) |
| 0.0 | 3.3 | GO:0031532 | actin cytoskeleton reorganization(GO:0031532) |
| 0.0 | 0.9 | GO:0030322 | stabilization of membrane potential(GO:0030322) |
| 0.0 | 0.2 | GO:0046909 | intermembrane transport(GO:0046909) protein transport from ciliary membrane to plasma membrane(GO:1903445) |
| 0.0 | 0.2 | GO:0045824 | negative regulation of innate immune response(GO:0045824) |
| 0.0 | 0.4 | GO:0006685 | sphingomyelin catabolic process(GO:0006685) |
| 0.0 | 0.3 | GO:1904749 | regulation of protein localization to nucleolus(GO:1904749) |
| 0.0 | 0.6 | GO:1990126 | retrograde transport, endosome to plasma membrane(GO:1990126) |
| 0.0 | 0.3 | GO:0097647 | dimeric G-protein coupled receptor signaling pathway(GO:0038042) calcitonin family receptor signaling pathway(GO:0097646) amylin receptor signaling pathway(GO:0097647) |
| 0.0 | 0.2 | GO:0034421 | post-translational protein acetylation(GO:0034421) |
| 0.0 | 0.0 | GO:0021526 | medial motor column neuron differentiation(GO:0021526) |
| 0.0 | 0.1 | GO:1904692 | positive regulation of type B pancreatic cell proliferation(GO:1904692) |
| 0.0 | 0.3 | GO:0043101 | purine-containing compound salvage(GO:0043101) |
| 0.0 | 1.2 | GO:0022904 | respiratory electron transport chain(GO:0022904) |
| 0.0 | 3.2 | GO:0043484 | regulation of RNA splicing(GO:0043484) |
| 0.0 | 0.2 | GO:0000379 | tRNA-type intron splice site recognition and cleavage(GO:0000379) |
| 0.0 | 0.6 | GO:0070932 | histone H3 deacetylation(GO:0070932) |
| 0.0 | 0.5 | GO:0000038 | very long-chain fatty acid metabolic process(GO:0000038) |
| 0.0 | 0.1 | GO:0044829 | positive regulation by host of viral genome replication(GO:0044829) |
| 0.0 | 0.7 | GO:0097264 | self proteolysis(GO:0097264) |
| 0.0 | 0.1 | GO:1904977 | lymphatic endothelial cell migration(GO:1904977) |
| 0.0 | 0.0 | GO:0016188 | synaptic vesicle maturation(GO:0016188) |
| 0.0 | 0.2 | GO:0000098 | sulfur amino acid catabolic process(GO:0000098) |
| 0.0 | 0.2 | GO:0003418 | growth plate cartilage chondrocyte differentiation(GO:0003418) |
| 0.0 | 1.3 | GO:0000188 | inactivation of MAPK activity(GO:0000188) |
| 0.0 | 0.2 | GO:0048170 | positive regulation of long-term neuronal synaptic plasticity(GO:0048170) |
| 0.0 | 0.7 | GO:0007064 | mitotic sister chromatid cohesion(GO:0007064) |
| 0.0 | 0.2 | GO:0019418 | sulfide oxidation(GO:0019418) sulfide oxidation, using sulfide:quinone oxidoreductase(GO:0070221) |
| 0.0 | 0.6 | GO:0010603 | regulation of cytoplasmic mRNA processing body assembly(GO:0010603) |
| 0.0 | 0.8 | GO:0000291 | nuclear-transcribed mRNA catabolic process, exonucleolytic(GO:0000291) exonucleolytic nuclear-transcribed mRNA catabolic process involved in deadenylation-dependent decay(GO:0043928) |
| 0.0 | 2.0 | GO:0018279 | protein N-linked glycosylation via asparagine(GO:0018279) |
| 0.0 | 1.2 | GO:1903959 | regulation of anion transmembrane transport(GO:1903959) |
| 0.0 | 0.2 | GO:0046208 | spermine catabolic process(GO:0046208) |
| 0.0 | 0.1 | GO:0060399 | positive regulation of growth hormone receptor signaling pathway(GO:0060399) |
| 0.0 | 0.2 | GO:0051974 | negative regulation of telomerase activity(GO:0051974) |
| 0.0 | 0.5 | GO:0032793 | positive regulation of CREB transcription factor activity(GO:0032793) |
| 0.0 | 0.2 | GO:0071468 | cellular response to acidic pH(GO:0071468) |
| 0.0 | 0.5 | GO:0035994 | response to muscle stretch(GO:0035994) |
| 0.0 | 0.1 | GO:0060478 | acrosomal vesicle exocytosis(GO:0060478) |
| 0.0 | 0.1 | GO:0072539 | T-helper 17 type immune response(GO:0072538) T-helper 17 cell differentiation(GO:0072539) |
| 0.0 | 0.3 | GO:0042953 | lipoprotein transport(GO:0042953) lipoprotein localization(GO:0044872) |
| 0.0 | 0.2 | GO:1902857 | positive regulation of nonmotile primary cilium assembly(GO:1902857) |
| 0.0 | 0.2 | GO:0031937 | positive regulation of chromatin silencing(GO:0031937) |
| 0.0 | 0.1 | GO:0070212 | protein poly-ADP-ribosylation(GO:0070212) |
| 0.0 | 0.2 | GO:0043951 | negative regulation of cAMP-mediated signaling(GO:0043951) |
| 0.0 | 2.4 | GO:0030098 | lymphocyte differentiation(GO:0030098) |
| 0.0 | 0.2 | GO:0007182 | common-partner SMAD protein phosphorylation(GO:0007182) |
| 0.0 | 0.1 | GO:0044878 | abscission(GO:0009838) mitotic cytokinesis checkpoint(GO:0044878) |
| 0.0 | 0.9 | GO:0061418 | regulation of transcription from RNA polymerase II promoter in response to hypoxia(GO:0061418) |
| 0.0 | 0.2 | GO:0042796 | snRNA transcription from RNA polymerase III promoter(GO:0042796) |
| 0.0 | 0.9 | GO:0007214 | gamma-aminobutyric acid signaling pathway(GO:0007214) |
| 0.0 | 0.1 | GO:1902950 | regulation of dendritic spine maintenance(GO:1902950) |
| 0.0 | 0.1 | GO:0060261 | positive regulation of transcription initiation from RNA polymerase II promoter(GO:0060261) |
| 0.0 | 0.5 | GO:0032786 | positive regulation of DNA-templated transcription, elongation(GO:0032786) |
| 0.0 | 0.3 | GO:0071205 | protein localization to juxtaparanode region of axon(GO:0071205) |
| 0.0 | 0.3 | GO:0034058 | endosomal vesicle fusion(GO:0034058) |
| 0.0 | 0.2 | GO:0035021 | negative regulation of Rac protein signal transduction(GO:0035021) |
| 0.0 | 0.3 | GO:0006265 | DNA topological change(GO:0006265) |
| 0.0 | 0.2 | GO:0097052 | L-kynurenine metabolic process(GO:0097052) |
| 0.0 | 0.1 | GO:0006601 | creatine biosynthetic process(GO:0006601) |
| 0.0 | 0.2 | GO:0070940 | dephosphorylation of RNA polymerase II C-terminal domain(GO:0070940) |
| 0.0 | 0.3 | GO:0031274 | positive regulation of pseudopodium assembly(GO:0031274) |
| 0.0 | 0.8 | GO:0072662 | protein targeting to peroxisome(GO:0006625) peroxisomal transport(GO:0043574) protein localization to peroxisome(GO:0072662) establishment of protein localization to peroxisome(GO:0072663) |
| 0.0 | 0.4 | GO:0010803 | regulation of tumor necrosis factor-mediated signaling pathway(GO:0010803) |
| 0.0 | 0.1 | GO:0051877 | pigment granule aggregation in cell center(GO:0051877) |
| 0.0 | 0.1 | GO:0035853 | chromosome passenger complex localization to spindle midzone(GO:0035853) |
| 0.0 | 0.1 | GO:0097503 | sialylation(GO:0097503) |
| 0.0 | 0.4 | GO:0046835 | carbohydrate phosphorylation(GO:0046835) |
| 0.0 | 0.0 | GO:0006659 | phosphatidylserine biosynthetic process(GO:0006659) |
| 0.0 | 0.8 | GO:0035722 | interleukin-12-mediated signaling pathway(GO:0035722) response to interleukin-12(GO:0070671) cellular response to interleukin-12(GO:0071349) |
| 0.0 | 0.4 | GO:0046931 | pore complex assembly(GO:0046931) |
| 0.0 | 0.2 | GO:0001672 | regulation of chromatin assembly or disassembly(GO:0001672) |
| 0.0 | 0.1 | GO:0032020 | ISG15-protein conjugation(GO:0032020) |
| 0.0 | 0.1 | GO:0000451 | rRNA 2'-O-methylation(GO:0000451) |
| 0.0 | 0.6 | GO:0030262 | apoptotic nuclear changes(GO:0030262) |
| 0.0 | 0.6 | GO:0034199 | activation of protein kinase A activity(GO:0034199) |
| 0.0 | 0.4 | GO:0008334 | histone mRNA metabolic process(GO:0008334) |
| 0.0 | 0.3 | GO:0021819 | layer formation in cerebral cortex(GO:0021819) |
| 0.0 | 0.8 | GO:0051205 | protein insertion into membrane(GO:0051205) |
| 0.0 | 0.2 | GO:0006474 | N-terminal protein amino acid acetylation(GO:0006474) |
| 0.0 | 0.4 | GO:0048268 | clathrin coat assembly(GO:0048268) |
| 0.0 | 0.1 | GO:0043438 | acetoacetic acid metabolic process(GO:0043438) |
| 0.0 | 0.1 | GO:0032048 | cardiolipin metabolic process(GO:0032048) |
| 0.0 | 0.1 | GO:0071681 | response to indole-3-methanol(GO:0071680) cellular response to indole-3-methanol(GO:0071681) |
| 0.0 | 0.3 | GO:0047497 | establishment of mitochondrion localization, microtubule-mediated(GO:0034643) mitochondrion transport along microtubule(GO:0047497) |
| 0.0 | 0.1 | GO:0045792 | negative regulation of cell size(GO:0045792) |
| 0.0 | 0.2 | GO:0032888 | regulation of spindle elongation(GO:0032887) regulation of mitotic spindle elongation(GO:0032888) anastral spindle assembly(GO:0055048) protein localization to spindle pole body(GO:0071988) regulation of protein localization to spindle pole body(GO:1902363) positive regulation of protein localization to spindle pole body(GO:1902365) positive regulation of mitotic spindle elongation(GO:1902846) |
| 0.0 | 0.4 | GO:0018026 | peptidyl-lysine monomethylation(GO:0018026) |
| 0.0 | 0.1 | GO:0009726 | detection of endogenous stimulus(GO:0009726) |
| 0.0 | 0.2 | GO:0006379 | mRNA cleavage(GO:0006379) |
| 0.0 | 0.1 | GO:0006391 | transcription initiation from mitochondrial promoter(GO:0006391) |
| 0.0 | 0.2 | GO:0090179 | planar cell polarity pathway involved in neural tube closure(GO:0090179) |
| 0.0 | 1.1 | GO:0009583 | detection of light stimulus(GO:0009583) |
| 0.0 | 0.2 | GO:0045738 | negative regulation of DNA repair(GO:0045738) |
| 0.0 | 0.2 | GO:0002943 | tRNA dihydrouridine synthesis(GO:0002943) |
| 0.0 | 0.2 | GO:1901409 | positive regulation of phosphorylation of RNA polymerase II C-terminal domain(GO:1901409) |
| 0.0 | 0.1 | GO:0000706 | meiotic DNA double-strand break processing(GO:0000706) |
| 0.0 | 0.0 | GO:0046341 | CDP-diacylglycerol metabolic process(GO:0046341) |
| 0.0 | 0.1 | GO:0015781 | pyrimidine nucleotide-sugar transport(GO:0015781) |
| 0.0 | 0.2 | GO:0061087 | positive regulation of histone H3-K27 methylation(GO:0061087) |
| 0.0 | 1.0 | GO:0009301 | snRNA transcription(GO:0009301) snRNA transcription from RNA polymerase II promoter(GO:0042795) |
| 0.0 | 0.7 | GO:0016574 | histone ubiquitination(GO:0016574) |
| 0.0 | 0.6 | GO:0046856 | phosphatidylinositol dephosphorylation(GO:0046856) |
| 0.0 | 1.2 | GO:0030148 | sphingolipid biosynthetic process(GO:0030148) |
| 0.0 | 0.5 | GO:0008089 | anterograde axonal transport(GO:0008089) |
| 0.0 | 0.2 | GO:0008343 | adult feeding behavior(GO:0008343) |
| 0.0 | 0.2 | GO:0036066 | protein O-linked fucosylation(GO:0036066) |
| 0.0 | 0.2 | GO:0010579 | regulation of adenylate cyclase activity involved in G-protein coupled receptor signaling pathway(GO:0010578) positive regulation of adenylate cyclase activity involved in G-protein coupled receptor signaling pathway(GO:0010579) |
| 0.0 | 0.0 | GO:0018171 | peptidyl-cysteine oxidation(GO:0018171) |
| 0.0 | 0.0 | GO:0090270 | fibroblast growth factor production(GO:0090269) regulation of fibroblast growth factor production(GO:0090270) positive regulation of fibroblast growth factor production(GO:0090271) |
| 0.0 | 0.1 | GO:0045838 | positive regulation of membrane potential(GO:0045838) |
| 0.0 | 0.2 | GO:0000338 | protein deneddylation(GO:0000338) |
| 0.0 | 0.2 | GO:0039694 | viral RNA genome replication(GO:0039694) RNA replication(GO:0039703) |
| 0.0 | 0.5 | GO:0006383 | transcription from RNA polymerase III promoter(GO:0006383) |
| 0.0 | 0.1 | GO:0016139 | glycoside catabolic process(GO:0016139) |
| 0.0 | 0.1 | GO:0046618 | drug export(GO:0046618) |
| 0.0 | 0.1 | GO:1902080 | regulation of calcium ion import into sarcoplasmic reticulum(GO:1902080) negative regulation of calcium ion import into sarcoplasmic reticulum(GO:1902081) calcium ion import into sarcoplasmic reticulum(GO:1990036) |
| 0.0 | 0.1 | GO:1901029 | negative regulation of mitochondrial outer membrane permeabilization involved in apoptotic signaling pathway(GO:1901029) |
| 0.0 | 0.2 | GO:0035774 | positive regulation of insulin secretion involved in cellular response to glucose stimulus(GO:0035774) |
| 0.0 | 0.3 | GO:0006004 | fucose metabolic process(GO:0006004) |
| 0.0 | 0.3 | GO:0090286 | cytoskeletal anchoring at nuclear membrane(GO:0090286) |
| 0.0 | 0.1 | GO:0021514 | ventral spinal cord interneuron differentiation(GO:0021514) |
| 0.0 | 0.0 | GO:0061687 | detoxification of mercury ion(GO:0050787) detoxification of inorganic compound(GO:0061687) |
| 0.0 | 0.9 | GO:0045197 | establishment or maintenance of epithelial cell apical/basal polarity(GO:0045197) |
| 0.0 | 0.3 | GO:0070584 | mitochondrion morphogenesis(GO:0070584) |
| 0.0 | 0.5 | GO:0006909 | phagocytosis(GO:0006909) |
| 0.0 | 0.1 | GO:2001106 | regulation of Rho guanyl-nucleotide exchange factor activity(GO:2001106) |
| 0.0 | 0.1 | GO:0016576 | histone dephosphorylation(GO:0016576) |
| 0.0 | 0.1 | GO:1902455 | negative regulation of stem cell population maintenance(GO:1902455) |
| 0.0 | 0.2 | GO:0034975 | protein folding in endoplasmic reticulum(GO:0034975) |
| 0.0 | 0.2 | GO:0044804 | nucleophagy(GO:0044804) |
| 0.0 | 0.1 | GO:0019521 | aldonic acid metabolic process(GO:0019520) D-gluconate metabolic process(GO:0019521) |
| 0.0 | 0.0 | GO:0031584 | activation of phospholipase D activity(GO:0031584) |
| 0.0 | 0.1 | GO:0035022 | positive regulation of Rac protein signal transduction(GO:0035022) |
| 0.0 | 0.0 | GO:0061245 | establishment or maintenance of apical/basal cell polarity(GO:0035088) establishment or maintenance of bipolar cell polarity(GO:0061245) |
| 0.0 | 0.2 | GO:0003373 | dynamin polymerization involved in membrane fission(GO:0003373) dynamin polymerization involved in mitochondrial fission(GO:0003374) |
| 0.0 | 0.1 | GO:0044339 | canonical Wnt signaling pathway involved in osteoblast differentiation(GO:0044339) |
| 0.0 | 0.0 | GO:0051793 | medium-chain fatty acid catabolic process(GO:0051793) |
| 0.0 | 0.4 | GO:1904659 | hexose transmembrane transport(GO:0035428) glucose transmembrane transport(GO:1904659) |
| 0.0 | 0.9 | GO:0048791 | calcium ion-regulated exocytosis of neurotransmitter(GO:0048791) |
| 0.0 | 0.1 | GO:0097154 | GABAergic neuron differentiation(GO:0097154) |
| 0.0 | 0.1 | GO:0030261 | chromosome condensation(GO:0030261) |
| 0.0 | 0.1 | GO:0019255 | UDP-glucuronate biosynthetic process(GO:0006065) glucose 1-phosphate metabolic process(GO:0019255) |
| 0.0 | 0.1 | GO:1904903 | ESCRT complex disassembly(GO:1904896) ESCRT III complex disassembly(GO:1904903) |
| 0.0 | 0.1 | GO:0043982 | histone H4-K5 acetylation(GO:0043981) histone H4-K8 acetylation(GO:0043982) |
| 0.0 | 0.7 | GO:0043966 | histone H3 acetylation(GO:0043966) |
| 0.0 | 0.2 | GO:0008053 | mitochondrial fusion(GO:0008053) |
| 0.0 | 0.1 | GO:2001204 | regulation of osteoclast development(GO:2001204) |
Gene overrepresentation in cellular component category:
| Log-likelihood per target | Total log-likelihood | Term | Description |
|---|---|---|---|
| 2.1 | 4.2 | GO:0019815 | B cell receptor complex(GO:0019815) |
| 1.9 | 18.6 | GO:0034687 | integrin alphaL-beta2 complex(GO:0034687) |
| 1.6 | 9.5 | GO:0072557 | IPAF inflammasome complex(GO:0072557) |
| 1.5 | 4.5 | GO:0097679 | other organism cytoplasm(GO:0097679) |
| 1.4 | 4.1 | GO:0030526 | granulocyte macrophage colony-stimulating factor receptor complex(GO:0030526) |
| 1.3 | 4.0 | GO:0032997 | Fc receptor complex(GO:0032997) Fc-epsilon receptor I complex(GO:0032998) |
| 1.2 | 14.9 | GO:0042105 | alpha-beta T cell receptor complex(GO:0042105) |
| 1.2 | 12.7 | GO:0032010 | phagolysosome(GO:0032010) |
| 1.0 | 9.2 | GO:0005579 | membrane attack complex(GO:0005579) |
| 1.0 | 5.9 | GO:0036398 | TCR signalosome(GO:0036398) |
| 1.0 | 22.8 | GO:0042101 | T cell receptor complex(GO:0042101) |
| 0.9 | 2.8 | GO:0042022 | interleukin-12 receptor complex(GO:0042022) |
| 0.9 | 18.6 | GO:0042613 | MHC class II protein complex(GO:0042613) |
| 0.9 | 10.0 | GO:0035692 | macrophage migration inhibitory factor receptor complex(GO:0035692) |
| 0.9 | 7.1 | GO:0071595 | Nem1-Spo7 phosphatase complex(GO:0071595) |
| 0.8 | 9.7 | GO:0060171 | stereocilium membrane(GO:0060171) |
| 0.8 | 2.4 | GO:0099400 | cytoplasmic side of mitochondrial outer membrane(GO:0032473) caveola neck(GO:0099400) |
| 0.7 | 2.1 | GO:0036194 | muscle cell projection(GO:0036194) muscle cell projection membrane(GO:0036195) |
| 0.7 | 2.7 | GO:0035354 | Toll-like receptor 1-Toll-like receptor 2 protein complex(GO:0035354) |
| 0.7 | 26.7 | GO:0001891 | phagocytic cup(GO:0001891) |
| 0.7 | 2.6 | GO:0005944 | phosphatidylinositol 3-kinase complex, class IB(GO:0005944) |
| 0.6 | 3.8 | GO:0031232 | extrinsic component of external side of plasma membrane(GO:0031232) |
| 0.6 | 2.3 | GO:0005889 | hydrogen:potassium-exchanging ATPase complex(GO:0005889) |
| 0.6 | 1.7 | GO:1990843 | subsarcolemmal mitochondrion(GO:1990843) interfibrillar mitochondrion(GO:1990844) |
| 0.5 | 4.3 | GO:0034363 | intermediate-density lipoprotein particle(GO:0034363) |
| 0.5 | 2.7 | GO:0045272 | plasma membrane respiratory chain complex I(GO:0045272) |
| 0.5 | 1.0 | GO:0098576 | lumenal side of membrane(GO:0098576) |
| 0.5 | 9.6 | GO:0033093 | Weibel-Palade body(GO:0033093) |
| 0.5 | 12.0 | GO:0031254 | uropod(GO:0001931) cell trailing edge(GO:0031254) |
| 0.5 | 6.2 | GO:0005577 | fibrinogen complex(GO:0005577) |
| 0.5 | 2.8 | GO:1990584 | cardiac Troponin complex(GO:1990584) |
| 0.4 | 4.9 | GO:0042612 | MHC class I protein complex(GO:0042612) |
| 0.4 | 3.4 | GO:0043196 | varicosity(GO:0043196) |
| 0.4 | 1.2 | GO:0005638 | lamin filament(GO:0005638) |
| 0.4 | 1.2 | GO:0075341 | host cell PML body(GO:0075341) |
| 0.4 | 24.4 | GO:0019814 | immunoglobulin complex(GO:0019814) immunoglobulin complex, circulating(GO:0042571) |
| 0.4 | 1.2 | GO:0016590 | ACF complex(GO:0016590) |
| 0.4 | 1.2 | GO:1990630 | IRE1-RACK1-PP2A complex(GO:1990630) |
| 0.4 | 2.0 | GO:0070381 | endosome to plasma membrane transport vesicle(GO:0070381) |
| 0.4 | 3.1 | GO:0097129 | cyclin D2-CDK4 complex(GO:0097129) |
| 0.4 | 1.9 | GO:0071008 | U2-type post-mRNA release spliceosomal complex(GO:0071008) |
| 0.4 | 1.5 | GO:0033167 | ARC complex(GO:0033167) |
| 0.4 | 1.8 | GO:0036502 | Derlin-1-VIMP complex(GO:0036502) |
| 0.4 | 1.1 | GO:0097013 | phagocytic vesicle lumen(GO:0097013) |
| 0.4 | 1.4 | GO:0031084 | BLOC-2 complex(GO:0031084) |
| 0.4 | 3.9 | GO:0045252 | oxoglutarate dehydrogenase complex(GO:0045252) |
| 0.4 | 3.2 | GO:1990578 | perinuclear endoplasmic reticulum membrane(GO:1990578) |
| 0.4 | 2.5 | GO:0032144 | 4-aminobutyrate transaminase complex(GO:0032144) |
| 0.3 | 38.5 | GO:0101003 | ficolin-1-rich granule membrane(GO:0101003) |
| 0.3 | 1.9 | GO:0043291 | RAVE complex(GO:0043291) |
| 0.3 | 1.9 | GO:0016035 | zeta DNA polymerase complex(GO:0016035) |
| 0.3 | 1.6 | GO:0000839 | Hrd1p ubiquitin ligase ERAD-L complex(GO:0000839) |
| 0.3 | 2.2 | GO:0070876 | SOSS complex(GO:0070876) |
| 0.3 | 0.6 | GO:0034515 | proteasome storage granule(GO:0034515) |
| 0.3 | 1.2 | GO:0045323 | interleukin-1 receptor complex(GO:0045323) |
| 0.3 | 2.6 | GO:0044194 | cytolytic granule(GO:0044194) |
| 0.3 | 6.1 | GO:0071439 | clathrin complex(GO:0071439) |
| 0.3 | 17.6 | GO:0001772 | immunological synapse(GO:0001772) |
| 0.3 | 2.3 | GO:0070436 | Grb2-EGFR complex(GO:0070436) |
| 0.3 | 2.5 | GO:0032584 | growth cone membrane(GO:0032584) |
| 0.3 | 0.5 | GO:0031264 | death-inducing signaling complex(GO:0031264) |
| 0.3 | 5.4 | GO:0071438 | invadopodium membrane(GO:0071438) |
| 0.3 | 102.8 | GO:0009897 | external side of plasma membrane(GO:0009897) |
| 0.3 | 3.8 | GO:0019773 | proteasome core complex, alpha-subunit complex(GO:0019773) |
| 0.3 | 0.8 | GO:0032002 | interleukin-28 receptor complex(GO:0032002) |
| 0.3 | 1.1 | GO:0005896 | interleukin-6 receptor complex(GO:0005896) |
| 0.3 | 3.4 | GO:0033588 | Elongator holoenzyme complex(GO:0033588) |
| 0.3 | 3.2 | GO:0008541 | proteasome regulatory particle, lid subcomplex(GO:0008541) |
| 0.3 | 0.8 | GO:0098844 | postsynaptic endocytic zone membrane(GO:0098844) |
| 0.3 | 0.5 | GO:0098592 | cytoplasmic side of apical plasma membrane(GO:0098592) |
| 0.3 | 1.5 | GO:0097441 | basilar dendrite(GO:0097441) |
| 0.3 | 2.8 | GO:0098560 | cytoplasmic side of late endosome membrane(GO:0098560) |
| 0.2 | 1.0 | GO:0098855 | HCN channel complex(GO:0098855) |
| 0.2 | 1.0 | GO:0030895 | apolipoprotein B mRNA editing enzyme complex(GO:0030895) |
| 0.2 | 2.1 | GO:0098575 | lumenal side of lysosomal membrane(GO:0098575) |
| 0.2 | 20.9 | GO:0035580 | specific granule lumen(GO:0035580) |
| 0.2 | 20.0 | GO:0035577 | azurophil granule membrane(GO:0035577) |
| 0.2 | 3.0 | GO:0034098 | VCP-NPL4-UFD1 AAA ATPase complex(GO:0034098) |
| 0.2 | 0.7 | GO:0070069 | cytochrome complex(GO:0070069) |
| 0.2 | 60.3 | GO:0031234 | extrinsic component of cytoplasmic side of plasma membrane(GO:0031234) |
| 0.2 | 1.3 | GO:0033186 | CAF-1 complex(GO:0033186) |
| 0.2 | 4.3 | GO:0031618 | nuclear pericentric heterochromatin(GO:0031618) |
| 0.2 | 0.4 | GO:0072536 | interleukin-23 receptor complex(GO:0072536) |
| 0.2 | 42.9 | GO:0016605 | PML body(GO:0016605) |
| 0.2 | 0.9 | GO:0071256 | Sec61 translocon complex(GO:0005784) translocon complex(GO:0071256) |
| 0.2 | 3.2 | GO:0031462 | Cul2-RING ubiquitin ligase complex(GO:0031462) |
| 0.2 | 4.4 | GO:0030132 | clathrin coat of coated pit(GO:0030132) |
| 0.2 | 0.6 | GO:0009346 | citrate lyase complex(GO:0009346) |
| 0.2 | 3.4 | GO:0008290 | F-actin capping protein complex(GO:0008290) |
| 0.2 | 4.4 | GO:0042627 | chylomicron(GO:0042627) |
| 0.2 | 6.4 | GO:0005639 | integral component of nuclear inner membrane(GO:0005639) intrinsic component of nuclear inner membrane(GO:0031229) |
| 0.2 | 28.3 | GO:0035578 | azurophil granule lumen(GO:0035578) |
| 0.2 | 1.2 | GO:0005967 | mitochondrial pyruvate dehydrogenase complex(GO:0005967) |
| 0.2 | 7.1 | GO:0014731 | spectrin-associated cytoskeleton(GO:0014731) |
| 0.2 | 0.6 | GO:0034271 | phosphatidylinositol 3-kinase complex, class III, type I(GO:0034271) phosphatidylinositol 3-kinase complex, class III, type II(GO:0034272) |
| 0.2 | 2.7 | GO:0034362 | low-density lipoprotein particle(GO:0034362) |
| 0.2 | 1.7 | GO:0044754 | autolysosome(GO:0044754) |
| 0.2 | 0.6 | GO:0032419 | extrinsic component of lysosome membrane(GO:0032419) |
| 0.2 | 5.9 | GO:0000930 | gamma-tubulin complex(GO:0000930) |
| 0.2 | 1.0 | GO:0072559 | NLRP3 inflammasome complex(GO:0072559) |
| 0.2 | 1.5 | GO:1990452 | Parkin-FBXW7-Cul1 ubiquitin ligase complex(GO:1990452) |
| 0.2 | 0.4 | GO:0097637 | intrinsic component of autophagosome membrane(GO:0097636) integral component of autophagosome membrane(GO:0097637) |
| 0.2 | 0.7 | GO:0098843 | postsynaptic endocytic zone(GO:0098843) |
| 0.2 | 6.8 | GO:0031305 | intrinsic component of mitochondrial inner membrane(GO:0031304) integral component of mitochondrial inner membrane(GO:0031305) |
| 0.2 | 0.2 | GO:0043614 | multi-eIF complex(GO:0043614) |
| 0.2 | 1.1 | GO:0033553 | rDNA heterochromatin(GO:0033553) |
| 0.2 | 1.8 | GO:0072357 | PTW/PP1 phosphatase complex(GO:0072357) |
| 0.2 | 1.0 | GO:0000214 | tRNA-intron endonuclease complex(GO:0000214) |
| 0.2 | 2.6 | GO:0036020 | endolysosome membrane(GO:0036020) |
| 0.2 | 0.5 | GO:0033593 | BRCA2-MAGE-D1 complex(GO:0033593) |
| 0.2 | 2.0 | GO:0001940 | male pronucleus(GO:0001940) |
| 0.2 | 0.5 | GO:0034657 | GID complex(GO:0034657) |
| 0.2 | 1.9 | GO:0032593 | insulin-responsive compartment(GO:0032593) |
| 0.2 | 1.5 | GO:0030896 | checkpoint clamp complex(GO:0030896) |
| 0.2 | 1.0 | GO:1990037 | Lewy body core(GO:1990037) |
| 0.2 | 3.8 | GO:0000164 | protein phosphatase type 1 complex(GO:0000164) |
| 0.2 | 0.7 | GO:1990590 | ATF1-ATF4 transcription factor complex(GO:1990590) |
| 0.2 | 17.1 | GO:0033116 | endoplasmic reticulum-Golgi intermediate compartment membrane(GO:0033116) |
| 0.2 | 4.3 | GO:0016342 | catenin complex(GO:0016342) |
| 0.2 | 18.9 | GO:0035579 | specific granule membrane(GO:0035579) |
| 0.2 | 4.3 | GO:0097342 | ripoptosome(GO:0097342) |
| 0.2 | 1.0 | GO:1990876 | cytoplasmic side of nuclear pore(GO:1990876) |
| 0.2 | 0.8 | GO:0045273 | mitochondrial respiratory chain complex II, succinate dehydrogenase complex (ubiquinone)(GO:0005749) succinate dehydrogenase complex (ubiquinone)(GO:0045257) respiratory chain complex II(GO:0045273) succinate dehydrogenase complex(GO:0045281) fumarate reductase complex(GO:0045283) |
| 0.2 | 0.2 | GO:1990635 | proximal dendrite(GO:1990635) |
| 0.2 | 0.8 | GO:0016533 | cyclin-dependent protein kinase 5 holoenzyme complex(GO:0016533) |
| 0.2 | 3.2 | GO:0008385 | IkappaB kinase complex(GO:0008385) |
| 0.1 | 5.2 | GO:0030140 | trans-Golgi network transport vesicle(GO:0030140) |
| 0.1 | 0.6 | GO:0030891 | VCB complex(GO:0030891) |
| 0.1 | 1.7 | GO:0033269 | internode region of axon(GO:0033269) |
| 0.1 | 1.7 | GO:0097524 | sperm plasma membrane(GO:0097524) |
| 0.1 | 0.7 | GO:0042587 | glycogen granule(GO:0042587) |
| 0.1 | 2.7 | GO:0005885 | Arp2/3 protein complex(GO:0005885) |
| 0.1 | 1.0 | GO:0005971 | ribonucleoside-diphosphate reductase complex(GO:0005971) |
| 0.1 | 0.1 | GO:0030678 | mitochondrial ribonuclease P complex(GO:0030678) |
| 0.1 | 0.6 | GO:0097197 | tetraspanin-enriched microdomain(GO:0097197) |
| 0.1 | 3.3 | GO:0016281 | eukaryotic translation initiation factor 4F complex(GO:0016281) |
| 0.1 | 1.4 | GO:0019907 | cyclin-dependent protein kinase activating kinase holoenzyme complex(GO:0019907) |
| 0.1 | 0.6 | GO:0010370 | perinucleolar chromocenter(GO:0010370) |
| 0.1 | 0.8 | GO:0043625 | delta DNA polymerase complex(GO:0043625) |
| 0.1 | 0.9 | GO:0071986 | Ragulator complex(GO:0071986) |
| 0.1 | 0.5 | GO:0044307 | dendritic branch(GO:0044307) |
| 0.1 | 1.9 | GO:0070578 | RISC-loading complex(GO:0070578) |
| 0.1 | 1.0 | GO:1905202 | 3-methylcrotonyl-CoA carboxylase complex, mitochondrial(GO:0002169) methylcrotonoyl-CoA carboxylase complex(GO:1905202) |
| 0.1 | 1.1 | GO:0030061 | mitochondrial crista(GO:0030061) |
| 0.1 | 0.6 | GO:0030906 | retromer, cargo-selective complex(GO:0030906) |
| 0.1 | 8.0 | GO:0030670 | phagocytic vesicle membrane(GO:0030670) |
| 0.1 | 0.5 | GO:0030956 | glutamyl-tRNA(Gln) amidotransferase complex(GO:0030956) |
| 0.1 | 0.5 | GO:1902912 | pyruvate kinase complex(GO:1902912) |
| 0.1 | 1.1 | GO:0030870 | Mre11 complex(GO:0030870) |
| 0.1 | 2.0 | GO:0000322 | storage vacuole(GO:0000322) |
| 0.1 | 0.6 | GO:0034663 | endoplasmic reticulum chaperone complex(GO:0034663) |
| 0.1 | 1.2 | GO:0043190 | ATP-binding cassette (ABC) transporter complex(GO:0043190) |
| 0.1 | 1.0 | GO:1990745 | EARP complex(GO:1990745) |
| 0.1 | 0.9 | GO:0042765 | GPI-anchor transamidase complex(GO:0042765) |
| 0.1 | 0.4 | GO:0090651 | apical cytoplasm(GO:0090651) |
| 0.1 | 2.1 | GO:0005845 | mRNA cap binding complex(GO:0005845) |
| 0.1 | 9.6 | GO:0005793 | endoplasmic reticulum-Golgi intermediate compartment(GO:0005793) |
| 0.1 | 0.6 | GO:0019866 | organelle inner membrane(GO:0019866) |
| 0.1 | 1.2 | GO:0070522 | ERCC4-ERCC1 complex(GO:0070522) |
| 0.1 | 7.6 | GO:0090544 | BAF-type complex(GO:0090544) |
| 0.1 | 0.6 | GO:0020016 | ciliary pocket(GO:0020016) ciliary pocket membrane(GO:0020018) |
| 0.1 | 1.7 | GO:0005869 | dynactin complex(GO:0005869) |
| 0.1 | 0.6 | GO:0014802 | terminal cisterna(GO:0014802) |
| 0.1 | 2.2 | GO:0014701 | junctional sarcoplasmic reticulum membrane(GO:0014701) |
| 0.1 | 0.6 | GO:0060053 | neurofilament cytoskeleton(GO:0060053) |
| 0.1 | 0.6 | GO:1990796 | photoreceptor cell terminal bouton(GO:1990796) |
| 0.1 | 4.9 | GO:0044224 | juxtaparanode region of axon(GO:0044224) |
| 0.1 | 0.8 | GO:1990130 | Iml1 complex(GO:1990130) |
| 0.1 | 0.5 | GO:0042406 | extrinsic component of endoplasmic reticulum membrane(GO:0042406) |
| 0.1 | 0.7 | GO:0045254 | pyruvate dehydrogenase complex(GO:0045254) |
| 0.1 | 3.3 | GO:0005719 | nuclear euchromatin(GO:0005719) |
| 0.1 | 0.5 | GO:0001405 | presequence translocase-associated import motor(GO:0001405) |
| 0.1 | 0.9 | GO:0032777 | Piccolo NuA4 histone acetyltransferase complex(GO:0032777) |
| 0.1 | 2.8 | GO:0005892 | acetylcholine-gated channel complex(GO:0005892) |
| 0.1 | 1.7 | GO:0032039 | integrator complex(GO:0032039) |
| 0.1 | 0.8 | GO:0030126 | COPI vesicle coat(GO:0030126) COPI-coated vesicle membrane(GO:0030663) |
| 0.1 | 0.2 | GO:0005943 | phosphatidylinositol 3-kinase complex, class IA(GO:0005943) |
| 0.1 | 1.8 | GO:0046930 | pore complex(GO:0046930) |
| 0.1 | 1.9 | GO:0005642 | annulate lamellae(GO:0005642) |
| 0.1 | 0.5 | GO:0035841 | new growing cell tip(GO:0035841) |
| 0.1 | 0.4 | GO:0005965 | protein farnesyltransferase complex(GO:0005965) |
| 0.1 | 0.3 | GO:0071817 | MMXD complex(GO:0071817) |
| 0.1 | 2.0 | GO:0008074 | guanylate cyclase complex, soluble(GO:0008074) |
| 0.1 | 1.8 | GO:0000124 | SAGA complex(GO:0000124) |
| 0.1 | 0.5 | GO:0035068 | micro-ribonucleoprotein complex(GO:0035068) |
| 0.1 | 0.7 | GO:0032133 | chromosome passenger complex(GO:0032133) |
| 0.1 | 1.2 | GO:0044327 | dendritic spine head(GO:0044327) |
| 0.1 | 0.3 | GO:0044609 | DBIRD complex(GO:0044609) |
| 0.1 | 0.7 | GO:0097025 | MPP7-DLG1-LIN7 complex(GO:0097025) |
| 0.1 | 0.3 | GO:0030123 | AP-3 adaptor complex(GO:0030123) |
| 0.1 | 1.6 | GO:0034992 | microtubule organizing center attachment site(GO:0034992) LINC complex(GO:0034993) |
| 0.1 | 1.6 | GO:0031080 | nuclear pore outer ring(GO:0031080) |
| 0.1 | 0.8 | GO:0065010 | extracellular membrane-bounded organelle(GO:0065010) |
| 0.1 | 0.9 | GO:0031464 | Cul4A-RING E3 ubiquitin ligase complex(GO:0031464) |
| 0.1 | 1.0 | GO:0033256 | I-kappaB/NF-kappaB complex(GO:0033256) |
| 0.1 | 2.3 | GO:0032045 | guanyl-nucleotide exchange factor complex(GO:0032045) |
| 0.1 | 6.0 | GO:0022627 | cytosolic small ribosomal subunit(GO:0022627) |
| 0.1 | 0.8 | GO:0045120 | pronucleus(GO:0045120) |
| 0.1 | 3.1 | GO:0038201 | TOR complex(GO:0038201) |
| 0.1 | 0.5 | GO:0044530 | supraspliceosomal complex(GO:0044530) |
| 0.1 | 0.3 | GO:0017071 | intracellular cyclic nucleotide activated cation channel complex(GO:0017071) |
| 0.1 | 0.4 | GO:0070022 | transforming growth factor beta receptor homodimeric complex(GO:0070022) |
| 0.1 | 0.4 | GO:0001651 | dense fibrillar component(GO:0001651) |
| 0.1 | 1.7 | GO:0070938 | contractile ring(GO:0070938) |
| 0.1 | 0.6 | GO:0032279 | asymmetric synapse(GO:0032279) |
| 0.1 | 0.9 | GO:0005964 | phosphorylase kinase complex(GO:0005964) |
| 0.1 | 1.4 | GO:0043240 | Fanconi anaemia nuclear complex(GO:0043240) |
| 0.1 | 1.1 | GO:0034364 | high-density lipoprotein particle(GO:0034364) |
| 0.1 | 0.3 | GO:0002189 | ribose phosphate diphosphokinase complex(GO:0002189) |
| 0.1 | 1.4 | GO:0005751 | mitochondrial respiratory chain complex IV(GO:0005751) |
| 0.1 | 0.5 | GO:0070545 | PeBoW complex(GO:0070545) |
| 0.1 | 1.1 | GO:0097451 | glial limiting end-foot(GO:0097451) |
| 0.1 | 0.5 | GO:0032044 | DSIF complex(GO:0032044) |
| 0.1 | 0.3 | GO:0097196 | Shu complex(GO:0097196) |
| 0.1 | 0.5 | GO:0016442 | RISC complex(GO:0016442) RNAi effector complex(GO:0031332) |
| 0.1 | 2.9 | GO:0032809 | neuronal cell body membrane(GO:0032809) cell body membrane(GO:0044298) |
| 0.1 | 0.6 | GO:0035976 | AP1 complex(GO:0035976) |
| 0.1 | 0.4 | GO:0030905 | retromer, tubulation complex(GO:0030905) |
| 0.1 | 0.4 | GO:0033263 | CORVET complex(GO:0033263) |
| 0.1 | 1.9 | GO:0030014 | CCR4-NOT complex(GO:0030014) |
| 0.1 | 0.4 | GO:0036156 | inner dynein arm(GO:0036156) |
| 0.1 | 0.3 | GO:0097545 | axonemal outer doublet(GO:0097545) |
| 0.1 | 1.4 | GO:0000407 | pre-autophagosomal structure(GO:0000407) |
| 0.1 | 0.9 | GO:0046581 | intercellular canaliculus(GO:0046581) |
| 0.1 | 3.0 | GO:1904724 | tertiary granule lumen(GO:1904724) |
| 0.1 | 0.7 | GO:0031390 | Ctf18 RFC-like complex(GO:0031390) |
| 0.1 | 6.2 | GO:0005746 | mitochondrial respiratory chain(GO:0005746) |
| 0.1 | 0.8 | GO:0000791 | euchromatin(GO:0000791) |
| 0.1 | 1.5 | GO:0035102 | PRC1 complex(GO:0035102) |
| 0.1 | 0.2 | GO:0044308 | axonal spine(GO:0044308) |
| 0.1 | 0.6 | GO:0097442 | CA3 pyramidal cell dendrite(GO:0097442) |
| 0.1 | 4.6 | GO:0031907 | peroxisomal matrix(GO:0005782) microbody lumen(GO:0031907) |
| 0.1 | 2.0 | GO:0031083 | BLOC-1 complex(GO:0031083) |
| 0.1 | 1.3 | GO:0012507 | ER to Golgi transport vesicle membrane(GO:0012507) |
| 0.1 | 0.3 | GO:0097058 | CRLF-CLCF1 complex(GO:0097058) |
| 0.1 | 6.3 | GO:0005776 | autophagosome(GO:0005776) |
| 0.1 | 5.8 | GO:0045095 | keratin filament(GO:0045095) |
| 0.1 | 5.9 | GO:0010494 | cytoplasmic stress granule(GO:0010494) |
| 0.1 | 0.2 | GO:1990462 | omegasome(GO:1990462) |
| 0.1 | 0.1 | GO:0070044 | synaptobrevin 2-SNAP-25-syntaxin-1a complex(GO:0070044) |
| 0.1 | 1.0 | GO:0005721 | pericentric heterochromatin(GO:0005721) |
| 0.1 | 0.8 | GO:0044666 | MLL3/4 complex(GO:0044666) |
| 0.1 | 0.2 | GO:0005592 | collagen type XI trimer(GO:0005592) |
| 0.1 | 0.2 | GO:0005956 | protein kinase CK2 complex(GO:0005956) |
| 0.1 | 0.9 | GO:0005828 | kinetochore microtubule(GO:0005828) |
| 0.1 | 0.4 | GO:0005958 | DNA-dependent protein kinase-DNA ligase 4 complex(GO:0005958) |
| 0.1 | 0.4 | GO:0097149 | centralspindlin complex(GO:0097149) |
| 0.1 | 0.5 | GO:0005683 | U7 snRNP(GO:0005683) |
| 0.1 | 0.9 | GO:0042584 | chromaffin granule membrane(GO:0042584) |
| 0.1 | 0.2 | GO:0072558 | NLRP1 inflammasome complex(GO:0072558) |
| 0.1 | 0.4 | GO:0048179 | activin receptor complex(GO:0048179) |
| 0.1 | 0.6 | GO:0030897 | HOPS complex(GO:0030897) |
| 0.1 | 2.7 | GO:0005801 | cis-Golgi network(GO:0005801) |
| 0.1 | 1.4 | GO:0031092 | platelet alpha granule membrane(GO:0031092) |
| 0.1 | 3.7 | GO:0042645 | nucleoid(GO:0009295) mitochondrial nucleoid(GO:0042645) |
| 0.1 | 0.2 | GO:0098839 | postsynaptic density membrane(GO:0098839) |
| 0.1 | 1.6 | GO:0031519 | PcG protein complex(GO:0031519) |
| 0.1 | 0.5 | GO:1990682 | CSF1-CSF1R complex(GO:1990682) |
| 0.1 | 2.4 | GO:1902711 | GABA-A receptor complex(GO:1902711) |
| 0.1 | 0.7 | GO:0097486 | multivesicular body lumen(GO:0097486) |
| 0.1 | 1.4 | GO:0033268 | node of Ranvier(GO:0033268) |
| 0.1 | 0.5 | GO:0016589 | NURF complex(GO:0016589) |
| 0.1 | 1.1 | GO:0030119 | AP-type membrane coat adaptor complex(GO:0030119) |
| 0.1 | 0.9 | GO:0071682 | endocytic vesicle lumen(GO:0071682) |
| 0.1 | 0.2 | GO:0089717 | spanning component of plasma membrane(GO:0044214) spanning component of membrane(GO:0089717) |
| 0.1 | 0.2 | GO:0044611 | nuclear pore inner ring(GO:0044611) |
| 0.1 | 0.3 | GO:0002079 | inner acrosomal membrane(GO:0002079) |
| 0.1 | 2.5 | GO:0008180 | COP9 signalosome(GO:0008180) |
| 0.1 | 0.9 | GO:0036056 | filtration diaphragm(GO:0036056) slit diaphragm(GO:0036057) |
| 0.1 | 0.4 | GO:0033165 | interphotoreceptor matrix(GO:0033165) |
| 0.1 | 0.3 | GO:0032937 | SREBP-SCAP-Insig complex(GO:0032937) |
| 0.1 | 0.2 | GO:1990246 | uniplex complex(GO:1990246) |
| 0.1 | 0.4 | GO:0043020 | NADPH oxidase complex(GO:0043020) |
| 0.1 | 4.3 | GO:0009898 | cytoplasmic side of plasma membrane(GO:0009898) |
| 0.1 | 5.6 | GO:0034774 | secretory granule lumen(GO:0034774) |
| 0.1 | 21.4 | GO:0000790 | nuclear chromatin(GO:0000790) |
| 0.1 | 0.4 | GO:0000408 | EKC/KEOPS complex(GO:0000408) |
| 0.1 | 0.9 | GO:0043083 | synaptic cleft(GO:0043083) |
| 0.1 | 3.9 | GO:0005876 | spindle microtubule(GO:0005876) |
| 0.0 | 0.4 | GO:0097452 | GAIT complex(GO:0097452) |
| 0.0 | 3.7 | GO:0035097 | histone methyltransferase complex(GO:0035097) |
| 0.0 | 0.4 | GO:0005851 | eukaryotic translation initiation factor 2B complex(GO:0005851) |
| 0.0 | 0.4 | GO:0034388 | Pwp2p-containing subcomplex of 90S preribosome(GO:0034388) |
| 0.0 | 0.5 | GO:0030904 | retromer complex(GO:0030904) |
| 0.0 | 0.3 | GO:1902560 | GMP reductase complex(GO:1902560) |
| 0.0 | 0.1 | GO:0030936 | collagen type XIII trimer(GO:0005600) transmembrane collagen trimer(GO:0030936) |
| 0.0 | 0.5 | GO:0030893 | meiotic cohesin complex(GO:0030893) |
| 0.0 | 0.8 | GO:0031588 | nucleotide-activated protein kinase complex(GO:0031588) |
| 0.0 | 0.3 | GO:0031298 | replication fork protection complex(GO:0031298) |
| 0.0 | 0.2 | GO:0071006 | U2-type catalytic step 1 spliceosome(GO:0071006) |
| 0.0 | 3.6 | GO:0005891 | voltage-gated calcium channel complex(GO:0005891) |
| 0.0 | 0.2 | GO:0005863 | striated muscle myosin thick filament(GO:0005863) |
| 0.0 | 0.3 | GO:0061689 | tricellular tight junction(GO:0061689) |
| 0.0 | 0.4 | GO:0000796 | condensin complex(GO:0000796) |
| 0.0 | 0.2 | GO:0098554 | cytoplasmic side of endoplasmic reticulum membrane(GO:0098554) |
| 0.0 | 0.2 | GO:0070032 | synaptobrevin 2-SNAP-25-syntaxin-1a-complexin I complex(GO:0070032) |
| 0.0 | 1.1 | GO:0000178 | exosome (RNase complex)(GO:0000178) |
| 0.0 | 0.7 | GO:0016013 | syntrophin complex(GO:0016013) |
| 0.0 | 1.0 | GO:0035327 | transcriptionally active chromatin(GO:0035327) |
| 0.0 | 0.1 | GO:0000938 | GARP complex(GO:0000938) |
| 0.0 | 6.8 | GO:0030136 | clathrin-coated vesicle(GO:0030136) |
| 0.0 | 0.1 | GO:0060342 | photoreceptor inner segment membrane(GO:0060342) |
| 0.0 | 2.7 | GO:0044216 | other organism(GO:0044215) other organism cell(GO:0044216) other organism part(GO:0044217) |
| 0.0 | 0.6 | GO:0060091 | kinocilium(GO:0060091) |
| 0.0 | 0.5 | GO:0070937 | CRD-mediated mRNA stability complex(GO:0070937) |
| 0.0 | 0.4 | GO:0005833 | hemoglobin complex(GO:0005833) |
| 0.0 | 0.1 | GO:0034715 | pICln-Sm protein complex(GO:0034715) |
| 0.0 | 0.1 | GO:0032116 | SMC loading complex(GO:0032116) |
| 0.0 | 0.2 | GO:0033655 | host cell cytoplasm(GO:0030430) host cell cytoplasm part(GO:0033655) |
| 0.0 | 6.7 | GO:0031227 | intrinsic component of endoplasmic reticulum membrane(GO:0031227) |
| 0.0 | 0.5 | GO:0097038 | perinuclear endoplasmic reticulum(GO:0097038) |
| 0.0 | 0.5 | GO:0019774 | proteasome core complex, beta-subunit complex(GO:0019774) |
| 0.0 | 0.2 | GO:0005916 | fascia adherens(GO:0005916) |
| 0.0 | 0.9 | GO:0097381 | photoreceptor disc membrane(GO:0097381) |
| 0.0 | 0.9 | GO:0005790 | smooth endoplasmic reticulum(GO:0005790) |
| 0.0 | 3.9 | GO:1904813 | ficolin-1-rich granule(GO:0101002) ficolin-1-rich granule lumen(GO:1904813) |
| 0.0 | 16.0 | GO:0005743 | mitochondrial inner membrane(GO:0005743) |
| 0.0 | 3.9 | GO:0030667 | secretory granule membrane(GO:0030667) |
| 0.0 | 0.7 | GO:0031143 | pseudopodium(GO:0031143) |
| 0.0 | 0.5 | GO:0005853 | eukaryotic translation elongation factor 1 complex(GO:0005853) |
| 0.0 | 0.6 | GO:0044815 | DNA packaging complex(GO:0044815) |
| 0.0 | 0.3 | GO:0016602 | CCAAT-binding factor complex(GO:0016602) |
| 0.0 | 0.4 | GO:0005664 | origin recognition complex(GO:0000808) nuclear origin of replication recognition complex(GO:0005664) |
| 0.0 | 0.3 | GO:0008282 | ATP-sensitive potassium channel complex(GO:0008282) |
| 0.0 | 0.2 | GO:0005785 | signal recognition particle receptor complex(GO:0005785) |
| 0.0 | 0.2 | GO:0042599 | lamellar body(GO:0042599) |
| 0.0 | 0.2 | GO:0032311 | angiogenin-PRI complex(GO:0032311) |
| 0.0 | 3.9 | GO:0031901 | early endosome membrane(GO:0031901) |
| 0.0 | 0.3 | GO:0070449 | elongin complex(GO:0070449) |
| 0.0 | 2.7 | GO:0044439 | microbody part(GO:0044438) peroxisomal part(GO:0044439) |
| 0.0 | 0.3 | GO:0071541 | eukaryotic translation initiation factor 3 complex, eIF3m(GO:0071541) |
| 0.0 | 2.7 | GO:0031463 | Cul3-RING ubiquitin ligase complex(GO:0031463) |
| 0.0 | 0.5 | GO:0000813 | ESCRT I complex(GO:0000813) |
| 0.0 | 0.4 | GO:0017146 | NMDA selective glutamate receptor complex(GO:0017146) |
| 0.0 | 1.4 | GO:0032420 | stereocilium(GO:0032420) |
| 0.0 | 0.8 | GO:0005849 | mRNA cleavage factor complex(GO:0005849) |
| 0.0 | 0.1 | GO:0016600 | flotillin complex(GO:0016600) |
| 0.0 | 1.2 | GO:1990391 | DNA repair complex(GO:1990391) |
| 0.0 | 0.1 | GO:0005846 | nuclear cap binding complex(GO:0005846) |
| 0.0 | 1.5 | GO:0001917 | photoreceptor inner segment(GO:0001917) |
| 0.0 | 0.1 | GO:0033596 | TSC1-TSC2 complex(GO:0033596) |
| 0.0 | 1.1 | GO:0030173 | integral component of Golgi membrane(GO:0030173) |
| 0.0 | 3.3 | GO:0072562 | blood microparticle(GO:0072562) |
| 0.0 | 0.6 | GO:0035861 | site of double-strand break(GO:0035861) |
| 0.0 | 0.1 | GO:0005955 | calcineurin complex(GO:0005955) |
| 0.0 | 0.9 | GO:0033017 | sarcoplasmic reticulum membrane(GO:0033017) |
| 0.0 | 0.1 | GO:0000438 | core TFIIH complex portion of holo TFIIH complex(GO:0000438) |
| 0.0 | 0.1 | GO:0071204 | histone pre-mRNA 3'end processing complex(GO:0071204) |
| 0.0 | 0.2 | GO:0030008 | TRAPP complex(GO:0030008) |
| 0.0 | 0.6 | GO:0005682 | U5 snRNP(GO:0005682) |
| 0.0 | 0.1 | GO:0000172 | ribonuclease MRP complex(GO:0000172) |
| 0.0 | 7.4 | GO:0005759 | mitochondrial matrix(GO:0005759) |
| 0.0 | 0.5 | GO:0005669 | transcription factor TFIID complex(GO:0005669) |
| 0.0 | 0.9 | GO:0005758 | mitochondrial intermembrane space(GO:0005758) |
| 0.0 | 1.9 | GO:0042734 | presynaptic membrane(GO:0042734) |
| 0.0 | 0.1 | GO:1903440 | calcitonin family receptor complex(GO:1903439) amylin receptor complex(GO:1903440) |
| 0.0 | 0.3 | GO:0005952 | cAMP-dependent protein kinase complex(GO:0005952) |
| 0.0 | 6.2 | GO:0031965 | nuclear membrane(GO:0031965) |
| 0.0 | 0.2 | GO:0071141 | SMAD protein complex(GO:0071141) |
| 0.0 | 0.1 | GO:0005766 | primary lysosome(GO:0005766) azurophil granule(GO:0042582) |
| 0.0 | 0.3 | GO:0031414 | N-terminal protein acetyltransferase complex(GO:0031414) |
| 0.0 | 0.1 | GO:0000444 | MIS12/MIND type complex(GO:0000444) |
| 0.0 | 0.7 | GO:0042579 | peroxisome(GO:0005777) microbody(GO:0042579) |
| 0.0 | 0.7 | GO:0008023 | transcription elongation factor complex(GO:0008023) |
| 0.0 | 0.4 | GO:0005680 | anaphase-promoting complex(GO:0005680) |
| 0.0 | 0.4 | GO:0005665 | DNA-directed RNA polymerase II, core complex(GO:0005665) |
| 0.0 | 1.0 | GO:0032993 | protein-DNA complex(GO:0032993) |
| 0.0 | 0.7 | GO:0001533 | cornified envelope(GO:0001533) |
| 0.0 | 0.1 | GO:0005839 | proteasome core complex(GO:0005839) |
Gene overrepresentation in molecular function category:
| Log-likelihood per target | Total log-likelihood | Term | Description |
|---|---|---|---|
| 3.2 | 9.5 | GO:0005174 | CD40 receptor binding(GO:0005174) |
| 2.4 | 7.1 | GO:0004917 | interleukin-7 receptor activity(GO:0004917) |
| 2.3 | 6.9 | GO:0003692 | left-handed Z-DNA binding(GO:0003692) |
| 2.2 | 8.9 | GO:0017159 | pantetheine hydrolase activity(GO:0017159) |
| 1.8 | 7.0 | GO:0032560 | dGTPase activity(GO:0008832) triphosphoric monoester hydrolase activity(GO:0016793) guanyl deoxyribonucleotide binding(GO:0032560) dGTP binding(GO:0032567) |
| 1.7 | 18.7 | GO:0030369 | ICAM-3 receptor activity(GO:0030369) |
| 1.6 | 4.9 | GO:0005150 | interleukin-1, Type I receptor binding(GO:0005150) |
| 1.5 | 10.7 | GO:0004982 | N-formyl peptide receptor activity(GO:0004982) |
| 1.5 | 4.6 | GO:0036440 | citrate (Si)-synthase activity(GO:0004108) citrate synthase activity(GO:0036440) |
| 1.4 | 5.6 | GO:0033265 | choline binding(GO:0033265) |
| 1.3 | 4.0 | GO:0016652 | NAD(P)+ transhydrogenase activity(GO:0008746) oxidoreductase activity, acting on NAD(P)H, NAD(P) as acceptor(GO:0016652) |
| 1.2 | 5.9 | GO:0005350 | pyrimidine nucleobase transmembrane transporter activity(GO:0005350) |
| 1.1 | 4.6 | GO:0019976 | interleukin-2 receptor activity(GO:0004911) interleukin-2 binding(GO:0019976) |
| 1.1 | 3.3 | GO:0031896 | V2 vasopressin receptor binding(GO:0031896) |
| 1.1 | 3.3 | GO:0015227 | acyl carnitine transmembrane transporter activity(GO:0015227) |
| 1.0 | 17.9 | GO:0019864 | IgG binding(GO:0019864) |
| 1.0 | 4.8 | GO:0001069 | regulatory region RNA binding(GO:0001069) |
| 0.9 | 2.8 | GO:0016517 | interleukin-12 receptor activity(GO:0016517) |
| 0.9 | 2.8 | GO:0052854 | (S)-2-hydroxy-acid oxidase activity(GO:0003973) very-long-chain-(S)-2-hydroxy-acid oxidase activity(GO:0052852) long-chain-(S)-2-hydroxy-long-chain-acid oxidase activity(GO:0052853) medium-chain-(S)-2-hydroxy-acid oxidase activity(GO:0052854) |
| 0.9 | 2.8 | GO:0034602 | oxoglutarate dehydrogenase (NAD+) activity(GO:0034602) |
| 0.9 | 2.7 | GO:0035663 | Toll-like receptor 2 binding(GO:0035663) |
| 0.9 | 14.1 | GO:0001730 | 2'-5'-oligoadenylate synthetase activity(GO:0001730) |
| 0.9 | 3.5 | GO:0004711 | ribosomal protein S6 kinase activity(GO:0004711) |
| 0.9 | 4.3 | GO:0004914 | interleukin-5 receptor activity(GO:0004914) |
| 0.9 | 7.7 | GO:0035662 | Toll-like receptor 4 binding(GO:0035662) |
| 0.8 | 3.4 | GO:0016495 | C-X3-C chemokine receptor activity(GO:0016495) |
| 0.8 | 3.4 | GO:0030107 | HLA-A specific inhibitory MHC class I receptor activity(GO:0030107) |
| 0.8 | 3.3 | GO:0032396 | inhibitory MHC class I receptor activity(GO:0032396) |
| 0.8 | 4.9 | GO:0030377 | urokinase plasminogen activator receptor activity(GO:0030377) |
| 0.8 | 11.3 | GO:0016176 | superoxide-generating NADPH oxidase activator activity(GO:0016176) |
| 0.8 | 2.4 | GO:0034211 | GTP-dependent protein kinase activity(GO:0034211) peroxidase inhibitor activity(GO:0036479) |
| 0.8 | 4.8 | GO:0060230 | lipoprotein lipase activator activity(GO:0060230) |
| 0.8 | 7.2 | GO:0030883 | lipid antigen binding(GO:0030882) endogenous lipid antigen binding(GO:0030883) exogenous lipid antigen binding(GO:0030884) |
| 0.8 | 0.8 | GO:0050294 | steroid sulfotransferase activity(GO:0050294) |
| 0.8 | 1.6 | GO:0046979 | TAP2 binding(GO:0046979) |
| 0.8 | 2.3 | GO:0032428 | sphingolipid activator protein activity(GO:0030290) beta-N-acetylgalactosaminidase activity(GO:0032428) |
| 0.8 | 13.2 | GO:0042608 | T cell receptor binding(GO:0042608) |
| 0.8 | 2.3 | GO:0004450 | isocitrate dehydrogenase (NADP+) activity(GO:0004450) |
| 0.8 | 3.8 | GO:0048248 | CXCR3 chemokine receptor binding(GO:0048248) |
| 0.7 | 3.0 | GO:0010736 | serum response element binding(GO:0010736) |
| 0.7 | 0.7 | GO:0030911 | TPR domain binding(GO:0030911) |
| 0.7 | 2.1 | GO:0080130 | L-phenylalanine:2-oxoglutarate aminotransferase activity(GO:0080130) |
| 0.7 | 2.8 | GO:0008513 | secondary active organic cation transmembrane transporter activity(GO:0008513) |
| 0.7 | 2.8 | GO:0001632 | leukotriene B4 receptor activity(GO:0001632) |
| 0.7 | 2.1 | GO:0023029 | MHC class Ib protein binding(GO:0023029) |
| 0.7 | 3.4 | GO:0043423 | 3-phosphoinositide-dependent protein kinase binding(GO:0043423) |
| 0.7 | 8.1 | GO:0070892 | lipoteichoic acid receptor activity(GO:0070892) |
| 0.7 | 3.9 | GO:0004741 | [pyruvate dehydrogenase (lipoamide)] phosphatase activity(GO:0004741) |
| 0.7 | 3.3 | GO:0031726 | CCR1 chemokine receptor binding(GO:0031726) |
| 0.6 | 19.6 | GO:0042605 | peptide antigen binding(GO:0042605) |
| 0.6 | 6.3 | GO:0050833 | pyruvate transmembrane transporter activity(GO:0050833) |
| 0.6 | 3.7 | GO:1902122 | chenodeoxycholic acid binding(GO:1902122) |
| 0.6 | 3.0 | GO:0070051 | fibrinogen binding(GO:0070051) |
| 0.6 | 4.7 | GO:0004873 | asialoglycoprotein receptor activity(GO:0004873) |
| 0.6 | 3.5 | GO:0004918 | interleukin-8 receptor activity(GO:0004918) |
| 0.6 | 5.2 | GO:0070728 | leucine binding(GO:0070728) |
| 0.6 | 1.7 | GO:0016608 | growth hormone-releasing hormone activity(GO:0016608) |
| 0.6 | 2.8 | GO:0052798 | beta-galactoside alpha-2,3-sialyltransferase activity(GO:0052798) |
| 0.6 | 3.9 | GO:0016841 | ammonia-lyase activity(GO:0016841) |
| 0.6 | 12.3 | GO:0016493 | C-C chemokine receptor activity(GO:0016493) |
| 0.5 | 10.3 | GO:0042609 | CD4 receptor binding(GO:0042609) |
| 0.5 | 15.7 | GO:0042288 | MHC class I protein binding(GO:0042288) |
| 0.5 | 2.2 | GO:0042132 | fructose 1,6-bisphosphate 1-phosphatase activity(GO:0042132) |
| 0.5 | 2.7 | GO:0070579 | methylcytosine dioxygenase activity(GO:0070579) |
| 0.5 | 4.7 | GO:0019863 | IgE binding(GO:0019863) |
| 0.5 | 2.1 | GO:1902271 | D3 vitamins binding(GO:1902271) |
| 0.5 | 10.1 | GO:0009931 | calcium-dependent protein serine/threonine kinase activity(GO:0009931) |
| 0.5 | 6.0 | GO:0019865 | immunoglobulin binding(GO:0019865) |
| 0.5 | 3.8 | GO:0017018 | myosin phosphatase activity(GO:0017018) |
| 0.5 | 1.0 | GO:0042834 | peptidoglycan binding(GO:0042834) |
| 0.5 | 11.1 | GO:0032036 | myosin heavy chain binding(GO:0032036) |
| 0.5 | 1.4 | GO:0004336 | galactosylceramidase activity(GO:0004336) |
| 0.5 | 2.3 | GO:0004910 | interleukin-1, Type II, blocking receptor activity(GO:0004910) |
| 0.5 | 1.8 | GO:0017077 | oxidative phosphorylation uncoupler activity(GO:0017077) |
| 0.5 | 2.3 | GO:0004370 | glycerol kinase activity(GO:0004370) |
| 0.5 | 1.4 | GO:0033142 | progesterone receptor binding(GO:0033142) |
| 0.4 | 1.3 | GO:0004174 | electron-transferring-flavoprotein dehydrogenase activity(GO:0004174) oxidoreductase activity, acting on the CH-NH group of donors, quinone or similar compound as acceptor(GO:0016649) |
| 0.4 | 1.8 | GO:0001626 | nociceptin receptor activity(GO:0001626) |
| 0.4 | 3.1 | GO:0032393 | MHC class I receptor activity(GO:0032393) |
| 0.4 | 4.8 | GO:0016494 | C-X-C chemokine receptor activity(GO:0016494) |
| 0.4 | 0.9 | GO:0031893 | vasopressin receptor binding(GO:0031893) |
| 0.4 | 1.7 | GO:0008745 | N-acetylmuramoyl-L-alanine amidase activity(GO:0008745) |
| 0.4 | 93.9 | GO:0003823 | antigen binding(GO:0003823) |
| 0.4 | 2.2 | GO:0004668 | protein-arginine deiminase activity(GO:0004668) |
| 0.4 | 0.9 | GO:0050253 | retinyl-palmitate esterase activity(GO:0050253) |
| 0.4 | 0.8 | GO:0030172 | troponin C binding(GO:0030172) |
| 0.4 | 1.7 | GO:0102007 | lactonohydrolase activity(GO:0046573) acyl-L-homoserine-lactone lactonohydrolase activity(GO:0102007) |
| 0.4 | 2.9 | GO:0008467 | [heparan sulfate]-glucosamine 3-sulfotransferase 1 activity(GO:0008467) |
| 0.4 | 5.0 | GO:0038049 | transcription factor activity, ligand-activated RNA polymerase II transcription factor binding(GO:0038049) |
| 0.4 | 1.6 | GO:0004949 | cannabinoid receptor activity(GO:0004949) |
| 0.4 | 1.2 | GO:0051717 | inositol-1,3,4,5-tetrakisphosphate 3-phosphatase activity(GO:0051717) |
| 0.4 | 45.0 | GO:0004715 | non-membrane spanning protein tyrosine kinase activity(GO:0004715) |
| 0.4 | 1.2 | GO:0047860 | diiodophenylpyruvate reductase activity(GO:0047860) |
| 0.4 | 4.8 | GO:0004465 | lipoprotein lipase activity(GO:0004465) |
| 0.4 | 2.8 | GO:0050659 | N-acetylgalactosamine 4-sulfate 6-O-sulfotransferase activity(GO:0050659) |
| 0.4 | 1.2 | GO:0034188 | apolipoprotein A-I receptor activity(GO:0034188) phosphatidylserine-translocating ATPase activity(GO:0090556) |
| 0.4 | 3.9 | GO:0004677 | DNA-dependent protein kinase activity(GO:0004677) |
| 0.4 | 3.8 | GO:0005094 | Rho GDP-dissociation inhibitor activity(GO:0005094) |
| 0.4 | 1.9 | GO:0042781 | 3'-tRNA processing endoribonuclease activity(GO:0042781) |
| 0.4 | 0.8 | GO:0004906 | interferon-gamma receptor activity(GO:0004906) |
| 0.4 | 1.1 | GO:0004998 | transferrin receptor activity(GO:0004998) |
| 0.4 | 3.7 | GO:0031013 | troponin I binding(GO:0031013) |
| 0.4 | 0.4 | GO:0005026 | transforming growth factor beta receptor activity, type II(GO:0005026) |
| 0.4 | 1.1 | GO:0004566 | beta-glucuronidase activity(GO:0004566) heparanase activity(GO:0030305) |
| 0.4 | 6.6 | GO:0031433 | telethonin binding(GO:0031433) |
| 0.4 | 1.8 | GO:0033695 | oxidoreductase activity, acting on CH or CH2 groups, quinone or similar compound as acceptor(GO:0033695) caffeine oxidase activity(GO:0034875) |
| 0.4 | 1.5 | GO:0035800 | deubiquitinase activator activity(GO:0035800) |
| 0.4 | 1.1 | GO:0030272 | 5-formyltetrahydrofolate cyclo-ligase activity(GO:0030272) |
| 0.4 | 6.8 | GO:0046625 | sphingolipid binding(GO:0046625) |
| 0.4 | 16.8 | GO:0005540 | hyaluronic acid binding(GO:0005540) |
| 0.4 | 0.7 | GO:0004487 | methylenetetrahydrofolate dehydrogenase (NAD+) activity(GO:0004487) |
| 0.4 | 1.1 | GO:0005519 | cytoskeletal regulatory protein binding(GO:0005519) |
| 0.4 | 1.1 | GO:0005152 | interleukin-1 receptor antagonist activity(GO:0005152) |
| 0.4 | 3.2 | GO:0004704 | NF-kappaB-inducing kinase activity(GO:0004704) |
| 0.4 | 2.5 | GO:0047298 | 4-aminobutyrate transaminase activity(GO:0003867) succinate-semialdehyde dehydrogenase binding(GO:0032145) (S)-3-amino-2-methylpropionate transaminase activity(GO:0047298) |
| 0.4 | 1.8 | GO:0004392 | heme oxygenase (decyclizing) activity(GO:0004392) |
| 0.3 | 1.7 | GO:0048030 | disaccharide binding(GO:0048030) |
| 0.3 | 2.4 | GO:0004920 | interleukin-10 receptor activity(GO:0004920) |
| 0.3 | 2.8 | GO:0005134 | interleukin-2 receptor binding(GO:0005134) |
| 0.3 | 1.4 | GO:0016838 | carbon-oxygen lyase activity, acting on phosphates(GO:0016838) |
| 0.3 | 4.1 | GO:0033691 | sialic acid binding(GO:0033691) |
| 0.3 | 1.0 | GO:0090409 | malonyl-CoA synthetase activity(GO:0090409) |
| 0.3 | 8.1 | GO:0005176 | ErbB-2 class receptor binding(GO:0005176) |
| 0.3 | 7.0 | GO:0061578 | Lys63-specific deubiquitinase activity(GO:0061578) |
| 0.3 | 1.3 | GO:0030379 | neurotensin receptor activity, non-G-protein coupled(GO:0030379) |
| 0.3 | 4.3 | GO:0060229 | lipase activator activity(GO:0060229) |
| 0.3 | 1.0 | GO:0004346 | glucose-6-phosphatase activity(GO:0004346) sugar-terminal-phosphatase activity(GO:0050309) |
| 0.3 | 9.4 | GO:0005068 | transmembrane receptor protein tyrosine kinase adaptor activity(GO:0005068) |
| 0.3 | 2.6 | GO:0043812 | phosphatidylinositol-4-phosphate phosphatase activity(GO:0043812) |
| 0.3 | 0.3 | GO:0070697 | activin receptor binding(GO:0070697) |
| 0.3 | 0.9 | GO:0004483 | mRNA (nucleoside-2'-O-)-methyltransferase activity(GO:0004483) |
| 0.3 | 0.9 | GO:0047374 | methylumbelliferyl-acetate deacetylase activity(GO:0047374) |
| 0.3 | 1.3 | GO:0070053 | thrombospondin receptor activity(GO:0070053) |
| 0.3 | 1.9 | GO:0039552 | RIG-I binding(GO:0039552) |
| 0.3 | 1.6 | GO:1990450 | linear polyubiquitin binding(GO:1990450) |
| 0.3 | 0.9 | GO:0004850 | uridine phosphorylase activity(GO:0004850) |
| 0.3 | 2.5 | GO:0008454 | alpha-1,3-mannosylglycoprotein 4-beta-N-acetylglucosaminyltransferase activity(GO:0008454) |
| 0.3 | 2.8 | GO:0099580 | ion antiporter activity involved in regulation of postsynaptic membrane potential(GO:0099580) |
| 0.3 | 4.3 | GO:0035612 | AP-2 adaptor complex binding(GO:0035612) |
| 0.3 | 0.9 | GO:0099530 | G-protein coupled receptor activity involved in regulation of postsynaptic membrane potential(GO:0099530) |
| 0.3 | 1.2 | GO:0051185 | coenzyme transporter activity(GO:0051185) |
| 0.3 | 1.5 | GO:0003943 | N-acetylgalactosamine-4-sulfatase activity(GO:0003943) |
| 0.3 | 1.2 | GO:0072320 | volume-sensitive chloride channel activity(GO:0072320) |
| 0.3 | 1.2 | GO:0004452 | isopentenyl-diphosphate delta-isomerase activity(GO:0004452) |
| 0.3 | 14.0 | GO:0004709 | MAP kinase kinase kinase activity(GO:0004709) |
| 0.3 | 1.8 | GO:0008113 | peptide-methionine (S)-S-oxide reductase activity(GO:0008113) |
| 0.3 | 1.2 | GO:0005011 | macrophage colony-stimulating factor receptor activity(GO:0005011) |
| 0.3 | 1.5 | GO:0042806 | fucose binding(GO:0042806) |
| 0.3 | 0.9 | GO:0008502 | melatonin receptor activity(GO:0008502) |
| 0.3 | 6.2 | GO:0001206 | transcriptional repressor activity, RNA polymerase II distal enhancer sequence-specific binding(GO:0001206) |
| 0.3 | 1.5 | GO:0015265 | urea channel activity(GO:0015265) |
| 0.3 | 2.9 | GO:0004126 | cytidine deaminase activity(GO:0004126) |
| 0.3 | 1.1 | GO:0002046 | opsin binding(GO:0002046) |
| 0.3 | 2.0 | GO:0009041 | uridylate kinase activity(GO:0009041) |
| 0.3 | 3.7 | GO:0030280 | structural constituent of epidermis(GO:0030280) |
| 0.3 | 1.4 | GO:0016822 | hydrolase activity, acting on acid carbon-carbon bonds(GO:0016822) hydrolase activity, acting on acid carbon-carbon bonds, in ketonic substances(GO:0016823) |
| 0.3 | 12.1 | GO:0019198 | transmembrane receptor protein tyrosine phosphatase activity(GO:0005001) transmembrane receptor protein phosphatase activity(GO:0019198) |
| 0.3 | 0.8 | GO:0004743 | pyruvate kinase activity(GO:0004743) |
| 0.3 | 2.2 | GO:0047623 | AMP deaminase activity(GO:0003876) adenosine-phosphate deaminase activity(GO:0047623) |
| 0.3 | 1.9 | GO:0030492 | hemoglobin binding(GO:0030492) |
| 0.3 | 9.1 | GO:0031489 | myosin V binding(GO:0031489) |
| 0.3 | 2.4 | GO:0070891 | lipoteichoic acid binding(GO:0070891) |
| 0.3 | 1.9 | GO:0003987 | acetate-CoA ligase activity(GO:0003987) |
| 0.3 | 1.1 | GO:0070119 | ciliary neurotrophic factor binding(GO:0070119) |
| 0.3 | 1.1 | GO:0001727 | lipid kinase activity(GO:0001727) |
| 0.3 | 1.6 | GO:0008240 | tripeptidyl-peptidase activity(GO:0008240) |
| 0.3 | 0.8 | GO:0019779 | Atg12 activating enzyme activity(GO:0019778) Atg8 activating enzyme activity(GO:0019779) |
| 0.3 | 1.0 | GO:0048040 | UDP-glucuronate decarboxylase activity(GO:0048040) |
| 0.3 | 1.0 | GO:0090554 | phosphatidylcholine-translocating ATPase activity(GO:0090554) |
| 0.3 | 0.8 | GO:0031798 | type 1 metabotropic glutamate receptor binding(GO:0031798) |
| 0.3 | 1.6 | GO:0016316 | phosphatidylinositol-3,4-bisphosphate 4-phosphatase activity(GO:0016316) inositol-1,3,4-trisphosphate 4-phosphatase activity(GO:0017161) phosphatidylinositol-4,5-bisphosphate 4-phosphatase activity(GO:0034597) inositol-3,4-bisphosphate 4-phosphatase activity(GO:0052828) |
| 0.3 | 1.0 | GO:0003858 | 3-hydroxybutyrate dehydrogenase activity(GO:0003858) |
| 0.3 | 7.0 | GO:0004143 | diacylglycerol kinase activity(GO:0004143) |
| 0.3 | 1.5 | GO:0003875 | ADP-ribosylarginine hydrolase activity(GO:0003875) |
| 0.3 | 3.3 | GO:0008142 | oxysterol binding(GO:0008142) |
| 0.3 | 4.6 | GO:0050700 | CARD domain binding(GO:0050700) |
| 0.3 | 1.3 | GO:0004699 | calcium-independent protein kinase C activity(GO:0004699) |
| 0.3 | 3.0 | GO:0035381 | extracellular ATP-gated cation channel activity(GO:0004931) ATP-gated ion channel activity(GO:0035381) |
| 0.2 | 2.5 | GO:0033857 | diphosphoinositol-pentakisphosphate kinase activity(GO:0033857) |
| 0.2 | 1.0 | GO:0071885 | N-terminal protein N-methyltransferase activity(GO:0071885) |
| 0.2 | 1.5 | GO:0004833 | tryptophan 2,3-dioxygenase activity(GO:0004833) |
| 0.2 | 2.5 | GO:0004720 | protein-lysine 6-oxidase activity(GO:0004720) |
| 0.2 | 0.7 | GO:0050613 | delta14-sterol reductase activity(GO:0050613) |
| 0.2 | 1.5 | GO:0035473 | lipase binding(GO:0035473) |
| 0.2 | 0.7 | GO:0004060 | arylamine N-acetyltransferase activity(GO:0004060) |
| 0.2 | 0.7 | GO:0000224 | peptide-N4-(N-acetyl-beta-glucosaminyl)asparagine amidase activity(GO:0000224) |
| 0.2 | 1.9 | GO:0005250 | A-type (transient outward) potassium channel activity(GO:0005250) ER retention sequence binding(GO:0046923) |
| 0.2 | 1.0 | GO:0004102 | choline O-acetyltransferase activity(GO:0004102) |
| 0.2 | 0.7 | GO:0005368 | taurine transmembrane transporter activity(GO:0005368) taurine:sodium symporter activity(GO:0005369) |
| 0.2 | 5.2 | GO:0042169 | SH2 domain binding(GO:0042169) |
| 0.2 | 5.5 | GO:0005522 | profilin binding(GO:0005522) |
| 0.2 | 1.2 | GO:0016262 | protein N-acetylglucosaminyltransferase activity(GO:0016262) |
| 0.2 | 7.5 | GO:0050811 | GABA receptor binding(GO:0050811) |
| 0.2 | 1.6 | GO:0097199 | cysteine-type endopeptidase activity involved in apoptotic signaling pathway(GO:0097199) |
| 0.2 | 0.7 | GO:0009032 | thymidine phosphorylase activity(GO:0009032) pyrimidine-nucleoside phosphorylase activity(GO:0016154) |
| 0.2 | 0.7 | GO:0031626 | beta-endorphin binding(GO:0031626) |
| 0.2 | 1.9 | GO:0004771 | sterol esterase activity(GO:0004771) |
| 0.2 | 0.9 | GO:0008431 | vitamin E binding(GO:0008431) |
| 0.2 | 1.2 | GO:0070653 | high-density lipoprotein particle receptor binding(GO:0070653) |
| 0.2 | 0.7 | GO:0033858 | N-acetylgalactosamine kinase activity(GO:0033858) |
| 0.2 | 5.4 | GO:0045295 | gamma-catenin binding(GO:0045295) |
| 0.2 | 10.4 | GO:0005164 | tumor necrosis factor receptor binding(GO:0005164) |
| 0.2 | 0.7 | GO:0016263 | glycoprotein-N-acetylgalactosamine 3-beta-galactosyltransferase activity(GO:0016263) |
| 0.2 | 0.4 | GO:0042020 | interleukin-23 binding(GO:0042019) interleukin-23 receptor activity(GO:0042020) |
| 0.2 | 5.8 | GO:0045028 | G-protein coupled nucleotide receptor activity(GO:0001608) G-protein coupled purinergic nucleotide receptor activity(GO:0045028) |
| 0.2 | 3.3 | GO:0005000 | vasopressin receptor activity(GO:0005000) |
| 0.2 | 1.3 | GO:0034647 | histone demethylase activity (H3-trimethyl-K4 specific)(GO:0034647) |
| 0.2 | 1.3 | GO:0016509 | long-chain-3-hydroxyacyl-CoA dehydrogenase activity(GO:0016509) |
| 0.2 | 1.5 | GO:0004499 | N,N-dimethylaniline monooxygenase activity(GO:0004499) |
| 0.2 | 1.3 | GO:0061649 | ubiquitinated histone binding(GO:0061649) |
| 0.2 | 1.5 | GO:0005330 | dopamine:sodium symporter activity(GO:0005330) |
| 0.2 | 5.1 | GO:0004806 | triglyceride lipase activity(GO:0004806) |
| 0.2 | 0.9 | GO:0005042 | netrin receptor activity(GO:0005042) |
| 0.2 | 3.0 | GO:0051525 | NFAT protein binding(GO:0051525) |
| 0.2 | 4.0 | GO:0003680 | AT DNA binding(GO:0003680) |
| 0.2 | 0.6 | GO:0003878 | ATP citrate synthase activity(GO:0003878) |
| 0.2 | 4.6 | GO:0016500 | protein-hormone receptor activity(GO:0016500) |
| 0.2 | 6.0 | GO:0019992 | diacylglycerol binding(GO:0019992) |
| 0.2 | 1.2 | GO:0004534 | 5'-3' exoribonuclease activity(GO:0004534) |
| 0.2 | 0.6 | GO:0000386 | second spliceosomal transesterification activity(GO:0000386) |
| 0.2 | 2.4 | GO:0008607 | phosphorylase kinase regulator activity(GO:0008607) |
| 0.2 | 3.9 | GO:0008391 | arachidonic acid monooxygenase activity(GO:0008391) arachidonic acid epoxygenase activity(GO:0008392) |
| 0.2 | 0.6 | GO:0031730 | CCR5 chemokine receptor binding(GO:0031730) |
| 0.2 | 1.8 | GO:0004571 | mannosyl-oligosaccharide 1,2-alpha-mannosidase activity(GO:0004571) |
| 0.2 | 4.0 | GO:0051864 | histone demethylase activity (H3-K36 specific)(GO:0051864) |
| 0.2 | 1.6 | GO:0030292 | protein tyrosine kinase inhibitor activity(GO:0030292) |
| 0.2 | 0.8 | GO:0004001 | adenosine kinase activity(GO:0004001) |
| 0.2 | 3.2 | GO:0031681 | G-protein beta-subunit binding(GO:0031681) |
| 0.2 | 0.6 | GO:0016603 | glutaminyl-peptide cyclotransferase activity(GO:0016603) |
| 0.2 | 0.8 | GO:0008177 | succinate dehydrogenase (ubiquinone) activity(GO:0008177) 3 iron, 4 sulfur cluster binding(GO:0051538) |
| 0.2 | 0.8 | GO:0004356 | glutamate-ammonia ligase activity(GO:0004356) ammonia ligase activity(GO:0016211) acid-ammonia (or amide) ligase activity(GO:0016880) |
| 0.2 | 1.3 | GO:0070087 | chromo shadow domain binding(GO:0070087) |
| 0.2 | 1.7 | GO:0015057 | thrombin receptor activity(GO:0015057) |
| 0.2 | 1.7 | GO:0001225 | RNA polymerase II transcription coactivator binding(GO:0001225) |
| 0.2 | 1.3 | GO:0001515 | opioid peptide activity(GO:0001515) |
| 0.2 | 10.2 | GO:0043027 | cysteine-type endopeptidase inhibitor activity involved in apoptotic process(GO:0043027) |
| 0.2 | 4.0 | GO:0030957 | Tat protein binding(GO:0030957) |
| 0.2 | 1.1 | GO:0016748 | succinyltransferase activity(GO:0016748) |
| 0.2 | 1.9 | GO:0050682 | AF-2 domain binding(GO:0050682) |
| 0.2 | 2.4 | GO:0016174 | NAD(P)H oxidase activity(GO:0016174) |
| 0.2 | 1.9 | GO:0004687 | myosin light chain kinase activity(GO:0004687) |
| 0.2 | 1.1 | GO:0004530 | deoxyribonuclease I activity(GO:0004530) |
| 0.2 | 1.1 | GO:0004505 | phenylalanine 4-monooxygenase activity(GO:0004505) |
| 0.2 | 1.1 | GO:0005457 | GDP-fucose transmembrane transporter activity(GO:0005457) purine nucleotide-sugar transmembrane transporter activity(GO:0036080) |
| 0.2 | 0.9 | GO:0003976 | UDP-N-acetylglucosamine-lysosomal-enzyme N-acetylglucosaminephosphotransferase activity(GO:0003976) |
| 0.2 | 1.1 | GO:0004740 | pyruvate dehydrogenase (acetyl-transferring) kinase activity(GO:0004740) |
| 0.2 | 2.2 | GO:0031802 | type 5 metabotropic glutamate receptor binding(GO:0031802) |
| 0.2 | 0.7 | GO:0008297 | single-stranded DNA exodeoxyribonuclease activity(GO:0008297) |
| 0.2 | 1.1 | GO:0003986 | acetyl-CoA hydrolase activity(GO:0003986) |
| 0.2 | 2.4 | GO:0010859 | calcium-dependent cysteine-type endopeptidase inhibitor activity(GO:0010859) |
| 0.2 | 1.6 | GO:0016907 | G-protein coupled acetylcholine receptor activity(GO:0016907) |
| 0.2 | 1.8 | GO:0071558 | histone demethylase activity (H3-K27 specific)(GO:0071558) |
| 0.2 | 2.5 | GO:0008329 | signaling pattern recognition receptor activity(GO:0008329) pattern recognition receptor activity(GO:0038187) |
| 0.2 | 2.2 | GO:0004630 | phospholipase D activity(GO:0004630) |
| 0.2 | 0.9 | GO:0051734 | ATP-dependent polydeoxyribonucleotide 5'-hydroxyl-kinase activity(GO:0046404) polydeoxyribonucleotide kinase activity(GO:0051733) ATP-dependent polynucleotide kinase activity(GO:0051734) |
| 0.2 | 2.3 | GO:0022850 | serotonin-gated cation channel activity(GO:0022850) |
| 0.2 | 0.7 | GO:0004974 | leukotriene receptor activity(GO:0004974) |
| 0.2 | 0.7 | GO:0004925 | prolactin receptor activity(GO:0004925) |
| 0.2 | 3.3 | GO:0052744 | phosphatidylinositol-3-phosphatase activity(GO:0004438) phosphatidylinositol monophosphate phosphatase activity(GO:0052744) |
| 0.2 | 5.1 | GO:0005095 | GTPase inhibitor activity(GO:0005095) |
| 0.2 | 5.6 | GO:0008190 | eukaryotic initiation factor 4E binding(GO:0008190) |
| 0.2 | 1.0 | GO:0036033 | mediator complex binding(GO:0036033) |
| 0.2 | 0.5 | GO:0042954 | lipoprotein transporter activity(GO:0042954) |
| 0.2 | 1.0 | GO:0060228 | phosphatidylcholine-sterol O-acyltransferase activator activity(GO:0060228) |
| 0.2 | 1.9 | GO:0004311 | farnesyltranstransferase activity(GO:0004311) |
| 0.2 | 0.5 | GO:0071209 | U7 snRNA binding(GO:0071209) |
| 0.2 | 0.5 | GO:0008480 | sarcosine dehydrogenase activity(GO:0008480) |
| 0.2 | 1.0 | GO:1904288 | BAT3 complex binding(GO:1904288) |
| 0.2 | 0.5 | GO:0008859 | exoribonuclease II activity(GO:0008859) |
| 0.2 | 2.5 | GO:0032050 | clathrin heavy chain binding(GO:0032050) |
| 0.2 | 2.3 | GO:0048406 | nerve growth factor binding(GO:0048406) |
| 0.2 | 9.9 | GO:1990841 | promoter-specific chromatin binding(GO:1990841) |
| 0.2 | 1.7 | GO:0016812 | hydrolase activity, acting on carbon-nitrogen (but not peptide) bonds, in cyclic amides(GO:0016812) |
| 0.2 | 1.3 | GO:0005222 | intracellular cAMP activated cation channel activity(GO:0005222) |
| 0.2 | 6.9 | GO:0008157 | protein phosphatase 1 binding(GO:0008157) |
| 0.2 | 0.5 | GO:0004985 | opioid receptor activity(GO:0004985) |
| 0.2 | 0.5 | GO:1990698 | palmitoleoyltransferase activity(GO:1990698) |
| 0.2 | 3.5 | GO:0001530 | lipopolysaccharide binding(GO:0001530) |
| 0.2 | 1.3 | GO:0000064 | L-ornithine transmembrane transporter activity(GO:0000064) |
| 0.2 | 1.0 | GO:0047894 | flavonol 3-sulfotransferase activity(GO:0047894) |
| 0.2 | 0.2 | GO:0070546 | L-phenylalanine aminotransferase activity(GO:0070546) |
| 0.2 | 0.6 | GO:0035276 | aldehyde oxidase activity(GO:0004031) ethanol binding(GO:0035276) |
| 0.2 | 1.9 | GO:0035312 | 5'-3' exodeoxyribonuclease activity(GO:0035312) |
| 0.2 | 2.3 | GO:0008603 | cAMP-dependent protein kinase regulator activity(GO:0008603) |
| 0.2 | 4.5 | GO:0102391 | decanoate--CoA ligase activity(GO:0102391) |
| 0.2 | 0.8 | GO:0016520 | growth hormone-releasing hormone receptor activity(GO:0016520) |
| 0.2 | 1.4 | GO:0030021 | extracellular matrix structural constituent conferring compression resistance(GO:0030021) structural constituent of tooth enamel(GO:0030345) |
| 0.2 | 0.5 | GO:0010698 | acetyltransferase activator activity(GO:0010698) |
| 0.2 | 2.5 | GO:0004308 | exo-alpha-sialidase activity(GO:0004308) alpha-sialidase activity(GO:0016997) |
| 0.2 | 0.5 | GO:0098518 | polynucleotide 5'-phosphatase activity(GO:0004651) polynucleotide phosphatase activity(GO:0098518) |
| 0.2 | 2.2 | GO:0030169 | low-density lipoprotein particle binding(GO:0030169) |
| 0.2 | 1.8 | GO:0070699 | type II activin receptor binding(GO:0070699) |
| 0.2 | 0.8 | GO:0097016 | L27 domain binding(GO:0097016) |
| 0.2 | 2.0 | GO:0086008 | voltage-gated potassium channel activity involved in cardiac muscle cell action potential repolarization(GO:0086008) |
| 0.2 | 1.5 | GO:0015016 | [heparan sulfate]-glucosamine N-sulfotransferase activity(GO:0015016) |
| 0.1 | 0.9 | GO:0015199 | amino-acid betaine transmembrane transporter activity(GO:0015199) carnitine transmembrane transporter activity(GO:0015226) |
| 0.1 | 0.4 | GO:0035605 | peptidyl-cysteine S-nitrosylase activity(GO:0035605) |
| 0.1 | 0.6 | GO:0004733 | pyridoxamine-phosphate oxidase activity(GO:0004733) |
| 0.1 | 0.7 | GO:0047280 | nicotinamide phosphoribosyltransferase activity(GO:0047280) |
| 0.1 | 6.8 | GO:0004683 | calmodulin-dependent protein kinase activity(GO:0004683) |
| 0.1 | 0.7 | GO:0033829 | O-fucosylpeptide 3-beta-N-acetylglucosaminyltransferase activity(GO:0033829) |
| 0.1 | 1.0 | GO:1903136 | cuprous ion binding(GO:1903136) |
| 0.1 | 0.6 | GO:0004379 | glycylpeptide N-tetradecanoyltransferase activity(GO:0004379) myristoyltransferase activity(GO:0019107) |
| 0.1 | 2.3 | GO:0038036 | sphingosine-1-phosphate receptor activity(GO:0038036) |
| 0.1 | 0.6 | GO:0070012 | oligopeptidase activity(GO:0070012) |
| 0.1 | 1.0 | GO:0016728 | ribonucleoside-diphosphate reductase activity, thioredoxin disulfide as acceptor(GO:0004748) oxidoreductase activity, acting on CH or CH2 groups, disulfide as acceptor(GO:0016728) ribonucleoside-diphosphate reductase activity(GO:0061731) |
| 0.1 | 0.4 | GO:0052739 | phosphatidylserine 1-acylhydrolase activity(GO:0052739) |
| 0.1 | 0.6 | GO:0005148 | prolactin receptor binding(GO:0005148) |
| 0.1 | 1.1 | GO:0008048 | calcium sensitive guanylate cyclase activator activity(GO:0008048) |
| 0.1 | 0.7 | GO:0016404 | 15-hydroxyprostaglandin dehydrogenase (NAD+) activity(GO:0016404) |
| 0.1 | 0.6 | GO:0010861 | thyroid hormone receptor activator activity(GO:0010861) thyroid hormone receptor coactivator activity(GO:0030375) |
| 0.1 | 0.6 | GO:0016165 | linoleate 13S-lipoxygenase activity(GO:0016165) |
| 0.1 | 14.4 | GO:0004722 | protein serine/threonine phosphatase activity(GO:0004722) |
| 0.1 | 1.6 | GO:0008553 | hydrogen-exporting ATPase activity, phosphorylative mechanism(GO:0008553) |
| 0.1 | 0.8 | GO:0004095 | carnitine O-palmitoyltransferase activity(GO:0004095) |
| 0.1 | 0.7 | GO:0004347 | glucose-6-phosphate isomerase activity(GO:0004347) |
| 0.1 | 0.4 | GO:0034512 | box C/D snoRNA binding(GO:0034512) |
| 0.1 | 1.2 | GO:1990599 | 3' overhang single-stranded DNA endodeoxyribonuclease activity(GO:1990599) |
| 0.1 | 0.4 | GO:0005497 | androgen binding(GO:0005497) |
| 0.1 | 9.0 | GO:0005549 | odorant binding(GO:0005549) |
| 0.1 | 0.8 | GO:0048039 | ubiquinone binding(GO:0048039) |
| 0.1 | 0.4 | GO:0016503 | pheromone receptor activity(GO:0016503) |
| 0.1 | 0.8 | GO:0004489 | methylenetetrahydrofolate reductase (NAD(P)H) activity(GO:0004489) |
| 0.1 | 10.0 | GO:0015485 | cholesterol binding(GO:0015485) |
| 0.1 | 0.4 | GO:0001133 | RNA polymerase II transcription factor activity, sequence-specific transcription regulatory region DNA binding(GO:0001133) |
| 0.1 | 1.0 | GO:0031849 | olfactory receptor binding(GO:0031849) |
| 0.1 | 0.3 | GO:0051373 | FATZ binding(GO:0051373) |
| 0.1 | 4.8 | GO:0003887 | DNA-directed DNA polymerase activity(GO:0003887) |
| 0.1 | 0.4 | GO:0000247 | C-8 sterol isomerase activity(GO:0000247) |
| 0.1 | 0.4 | GO:0004088 | carbamoyl-phosphate synthase (ammonia) activity(GO:0004087) carbamoyl-phosphate synthase (glutamine-hydrolyzing) activity(GO:0004088) |
| 0.1 | 0.3 | GO:0004613 | phosphoenolpyruvate carboxykinase activity(GO:0004611) phosphoenolpyruvate carboxykinase (GTP) activity(GO:0004613) |
| 0.1 | 1.0 | GO:0004485 | methylcrotonoyl-CoA carboxylase activity(GO:0004485) |
| 0.1 | 0.5 | GO:0050567 | glutaminyl-tRNA synthase (glutamine-hydrolyzing) activity(GO:0050567) |
| 0.1 | 0.7 | GO:0046935 | phosphatidylinositol 3-kinase regulator activity(GO:0035014) 1-phosphatidylinositol-3-kinase regulator activity(GO:0046935) |
| 0.1 | 5.8 | GO:0051539 | 4 iron, 4 sulfur cluster binding(GO:0051539) |
| 0.1 | 0.7 | GO:0005298 | proline:sodium symporter activity(GO:0005298) |
| 0.1 | 0.9 | GO:0003923 | GPI-anchor transamidase activity(GO:0003923) |
| 0.1 | 3.7 | GO:0070003 | threonine-type endopeptidase activity(GO:0004298) threonine-type peptidase activity(GO:0070003) |
| 0.1 | 0.5 | GO:0005459 | UDP-galactose transmembrane transporter activity(GO:0005459) |
| 0.1 | 1.1 | GO:0004176 | ATP-dependent peptidase activity(GO:0004176) |
| 0.1 | 0.5 | GO:0047946 | glutamine N-acyltransferase activity(GO:0047946) |
| 0.1 | 0.5 | GO:0005072 | transforming growth factor beta receptor, cytoplasmic mediator activity(GO:0005072) |
| 0.1 | 4.1 | GO:0032041 | histone deacetylase activity (H3-K14 specific)(GO:0031078) NAD-dependent histone deacetylase activity (H3-K14 specific)(GO:0032041) |
| 0.1 | 3.6 | GO:0043495 | protein anchor(GO:0043495) |
| 0.1 | 0.5 | GO:0004449 | isocitrate dehydrogenase (NAD+) activity(GO:0004449) |
| 0.1 | 1.8 | GO:0008503 | benzodiazepine receptor activity(GO:0008503) |
| 0.1 | 1.1 | GO:0019158 | glucokinase activity(GO:0004340) hexokinase activity(GO:0004396) fructokinase activity(GO:0008865) mannokinase activity(GO:0019158) |
| 0.1 | 1.0 | GO:0005087 | Ran guanyl-nucleotide exchange factor activity(GO:0005087) |
| 0.1 | 3.0 | GO:0042923 | neuropeptide binding(GO:0042923) |
| 0.1 | 3.6 | GO:0017056 | structural constituent of nuclear pore(GO:0017056) |
| 0.1 | 5.1 | GO:0019706 | protein-cysteine S-palmitoyltransferase activity(GO:0019706) protein-cysteine S-acyltransferase activity(GO:0019707) |
| 0.1 | 2.2 | GO:0015643 | toxic substance binding(GO:0015643) |
| 0.1 | 0.9 | GO:0050816 | phosphothreonine binding(GO:0050816) |
| 0.1 | 0.4 | GO:0051120 | hepoxilin A3 synthase activity(GO:0051120) |
| 0.1 | 5.3 | GO:0005086 | ARF guanyl-nucleotide exchange factor activity(GO:0005086) |
| 0.1 | 1.2 | GO:0045159 | myosin II binding(GO:0045159) |
| 0.1 | 0.8 | GO:0004035 | alkaline phosphatase activity(GO:0004035) |
| 0.1 | 0.4 | GO:0008665 | 2'-phosphotransferase activity(GO:0008665) |
| 0.1 | 0.5 | GO:0004464 | leukotriene-C4 synthase activity(GO:0004464) |
| 0.1 | 0.4 | GO:0000033 | alpha-1,3-mannosyltransferase activity(GO:0000033) |
| 0.1 | 3.0 | GO:0008527 | taste receptor activity(GO:0008527) |
| 0.1 | 1.0 | GO:0015252 | hydrogen ion channel activity(GO:0015252) |
| 0.1 | 0.7 | GO:0030144 | alpha-1,6-mannosylglycoprotein 6-beta-N-acetylglucosaminyltransferase activity(GO:0030144) |
| 0.1 | 1.4 | GO:0004457 | lactate dehydrogenase activity(GO:0004457) |
| 0.1 | 0.7 | GO:0030306 | ADP-ribosylation factor binding(GO:0030306) |
| 0.1 | 1.7 | GO:0015929 | hexosaminidase activity(GO:0015929) |
| 0.1 | 1.1 | GO:0017040 | ceramidase activity(GO:0017040) |
| 0.1 | 0.4 | GO:0047685 | amine sulfotransferase activity(GO:0047685) |
| 0.1 | 1.6 | GO:0035197 | siRNA binding(GO:0035197) |
| 0.1 | 1.4 | GO:0051434 | BH3 domain binding(GO:0051434) |
| 0.1 | 2.1 | GO:0042301 | phosphate ion binding(GO:0042301) |
| 0.1 | 2.9 | GO:0010485 | H4 histone acetyltransferase activity(GO:0010485) |
| 0.1 | 0.3 | GO:0004960 | thromboxane receptor activity(GO:0004960) thromboxane A2 receptor activity(GO:0004961) |
| 0.1 | 1.5 | GO:1901612 | cardiolipin binding(GO:1901612) |
| 0.1 | 1.2 | GO:0004969 | histamine receptor activity(GO:0004969) |
| 0.1 | 0.3 | GO:0015140 | malate transmembrane transporter activity(GO:0015140) |
| 0.1 | 0.6 | GO:0031493 | nucleosomal histone binding(GO:0031493) |
| 0.1 | 8.7 | GO:1990782 | protein tyrosine kinase binding(GO:1990782) |
| 0.1 | 2.3 | GO:0004691 | cAMP-dependent protein kinase activity(GO:0004691) |
| 0.1 | 0.5 | GO:0016934 | extracellular-glycine-gated ion channel activity(GO:0016933) extracellular-glycine-gated chloride channel activity(GO:0016934) |
| 0.1 | 1.7 | GO:1904264 | ubiquitin protein ligase activity involved in ERAD pathway(GO:1904264) |
| 0.1 | 7.0 | GO:0031593 | polyubiquitin binding(GO:0031593) |
| 0.1 | 0.6 | GO:0016314 | phosphatidylinositol-3,4,5-trisphosphate 3-phosphatase activity(GO:0016314) |
| 0.1 | 4.1 | GO:0071855 | neuropeptide receptor binding(GO:0071855) |
| 0.1 | 1.5 | GO:0071933 | Arp2/3 complex binding(GO:0071933) |
| 0.1 | 2.2 | GO:0047617 | acyl-CoA hydrolase activity(GO:0047617) |
| 0.1 | 2.8 | GO:0022848 | acetylcholine-gated cation channel activity(GO:0022848) |
| 0.1 | 0.6 | GO:0008035 | high-density lipoprotein particle binding(GO:0008035) |
| 0.1 | 0.9 | GO:0004559 | alpha-mannosidase activity(GO:0004559) |
| 0.1 | 0.2 | GO:0005462 | UDP-N-acetylglucosamine transmembrane transporter activity(GO:0005462) |
| 0.1 | 2.0 | GO:0004383 | guanylate cyclase activity(GO:0004383) |
| 0.1 | 0.8 | GO:0004430 | 1-phosphatidylinositol 4-kinase activity(GO:0004430) |
| 0.1 | 0.6 | GO:0046899 | nucleoside triphosphate adenylate kinase activity(GO:0046899) |
| 0.1 | 1.0 | GO:0042835 | BRE binding(GO:0042835) |
| 0.1 | 1.0 | GO:0004950 | G-protein coupled chemoattractant receptor activity(GO:0001637) chemokine receptor activity(GO:0004950) |
| 0.1 | 1.2 | GO:0043533 | inositol 1,3,4,5 tetrakisphosphate binding(GO:0043533) |
| 0.1 | 0.4 | GO:0050262 | ribosylnicotinamide kinase activity(GO:0050262) ribosylnicotinate kinase activity(GO:0061769) |
| 0.1 | 1.4 | GO:0017034 | Rap guanyl-nucleotide exchange factor activity(GO:0017034) |
| 0.1 | 0.9 | GO:0004875 | complement receptor activity(GO:0004875) |
| 0.1 | 2.6 | GO:0031698 | beta-2 adrenergic receptor binding(GO:0031698) |
| 0.1 | 3.1 | GO:0005035 | tumor necrosis factor-activated receptor activity(GO:0005031) death receptor activity(GO:0005035) |
| 0.1 | 0.8 | GO:0004046 | aminoacylase activity(GO:0004046) |
| 0.1 | 1.0 | GO:1990459 | transferrin receptor binding(GO:1990459) |
| 0.1 | 0.7 | GO:0019826 | oxygen sensor activity(GO:0019826) |
| 0.1 | 1.4 | GO:0008432 | JUN kinase binding(GO:0008432) |
| 0.1 | 3.8 | GO:0005044 | scavenger receptor activity(GO:0005044) |
| 0.1 | 3.5 | GO:0003746 | translation elongation factor activity(GO:0003746) |
| 0.1 | 0.3 | GO:0044715 | 8-oxo-dGDP phosphatase activity(GO:0044715) |
| 0.1 | 1.4 | GO:0004659 | prenyltransferase activity(GO:0004659) |
| 0.1 | 7.6 | GO:0070412 | R-SMAD binding(GO:0070412) |
| 0.1 | 1.5 | GO:0004971 | AMPA glutamate receptor activity(GO:0004971) |
| 0.1 | 0.7 | GO:0008525 | phosphatidylcholine transporter activity(GO:0008525) |
| 0.1 | 5.1 | GO:0030145 | manganese ion binding(GO:0030145) |
| 0.1 | 0.4 | GO:0004739 | pyruvate dehydrogenase (acetyl-transferring) activity(GO:0004739) |
| 0.1 | 0.5 | GO:0043546 | molybdopterin cofactor binding(GO:0043546) |
| 0.1 | 0.9 | GO:0030368 | interleukin-17 receptor activity(GO:0030368) |
| 0.1 | 0.3 | GO:0008988 | rRNA (adenine-N6-)-methyltransferase activity(GO:0008988) |
| 0.1 | 1.5 | GO:0017128 | phospholipid scramblase activity(GO:0017128) |
| 0.1 | 0.5 | GO:0004738 | pyruvate dehydrogenase activity(GO:0004738) pyruvate dehydrogenase [NAD(P)+] activity(GO:0034603) pyruvate dehydrogenase (NAD+) activity(GO:0034604) |
| 0.1 | 25.9 | GO:0004984 | olfactory receptor activity(GO:0004984) |
| 0.1 | 1.1 | GO:0004767 | sphingomyelin phosphodiesterase activity(GO:0004767) |
| 0.1 | 0.4 | GO:0016842 | amidine-lyase activity(GO:0016842) |
| 0.1 | 0.5 | GO:0072345 | NAADP-sensitive calcium-release channel activity(GO:0072345) |
| 0.1 | 0.5 | GO:0008518 | reduced folate carrier activity(GO:0008518) |
| 0.1 | 0.4 | GO:0004694 | eukaryotic translation initiation factor 2alpha kinase activity(GO:0004694) |
| 0.1 | 1.3 | GO:0005542 | folic acid binding(GO:0005542) |
| 0.1 | 1.8 | GO:0043325 | phosphatidylinositol-3,4-bisphosphate binding(GO:0043325) |
| 0.1 | 0.3 | GO:0050560 | aspartate-tRNA ligase activity(GO:0004815) aspartate-tRNA(Asn) ligase activity(GO:0050560) |
| 0.1 | 0.7 | GO:0004797 | deoxycytidine kinase activity(GO:0004137) thymidine kinase activity(GO:0004797) |
| 0.1 | 1.6 | GO:0017017 | MAP kinase tyrosine/serine/threonine phosphatase activity(GO:0017017) |
| 0.1 | 0.7 | GO:0051400 | BH domain binding(GO:0051400) |
| 0.1 | 2.5 | GO:0005092 | GDP-dissociation inhibitor activity(GO:0005092) |
| 0.1 | 1.2 | GO:0001135 | transcription factor activity, RNA polymerase II transcription factor recruiting(GO:0001135) |
| 0.1 | 0.3 | GO:0015193 | L-proline transmembrane transporter activity(GO:0015193) |
| 0.1 | 1.3 | GO:0070330 | aromatase activity(GO:0070330) |
| 0.1 | 1.0 | GO:0008474 | palmitoyl-(protein) hydrolase activity(GO:0008474) palmitoyl hydrolase activity(GO:0098599) |
| 0.1 | 0.6 | GO:0004594 | pantothenate kinase activity(GO:0004594) |
| 0.1 | 0.4 | GO:0004616 | phosphogluconate dehydrogenase (decarboxylating) activity(GO:0004616) |
| 0.1 | 2.2 | GO:0071949 | FAD binding(GO:0071949) |
| 0.1 | 2.9 | GO:0005544 | calcium-dependent phospholipid binding(GO:0005544) |
| 0.1 | 0.2 | GO:0016416 | O-palmitoyltransferase activity(GO:0016416) |
| 0.1 | 0.5 | GO:0050252 | retinol O-fatty-acyltransferase activity(GO:0050252) |
| 0.1 | 1.2 | GO:0015143 | urate transmembrane transporter activity(GO:0015143) salt transmembrane transporter activity(GO:1901702) |
| 0.1 | 1.5 | GO:0035198 | miRNA binding(GO:0035198) |
| 0.1 | 1.0 | GO:0035251 | UDP-glucosyltransferase activity(GO:0035251) |
| 0.1 | 0.6 | GO:0004045 | aminoacyl-tRNA hydrolase activity(GO:0004045) |
| 0.1 | 2.5 | GO:0001784 | phosphotyrosine binding(GO:0001784) |
| 0.1 | 0.5 | GO:0003726 | double-stranded RNA adenosine deaminase activity(GO:0003726) |
| 0.1 | 20.9 | GO:0017137 | Rab GTPase binding(GO:0017137) |
| 0.1 | 1.1 | GO:0017151 | DEAD/H-box RNA helicase binding(GO:0017151) |
| 0.1 | 0.2 | GO:0000822 | inositol hexakisphosphate binding(GO:0000822) |
| 0.1 | 2.7 | GO:0005545 | 1-phosphatidylinositol binding(GO:0005545) |
| 0.1 | 0.5 | GO:0070568 | guanylyltransferase activity(GO:0070568) |
| 0.1 | 0.3 | GO:0001588 | dopamine neurotransmitter receptor activity, coupled via Gs(GO:0001588) |
| 0.1 | 0.3 | GO:0061609 | fructose-1-phosphate aldolase activity(GO:0061609) |
| 0.1 | 0.9 | GO:0035005 | 1-phosphatidylinositol-4-phosphate 3-kinase activity(GO:0035005) |
| 0.1 | 0.3 | GO:0004966 | galanin receptor activity(GO:0004966) |
| 0.1 | 6.1 | GO:0018024 | histone-lysine N-methyltransferase activity(GO:0018024) |
| 0.1 | 3.1 | GO:0017166 | vinculin binding(GO:0017166) |
| 0.1 | 0.5 | GO:1990050 | phosphatidic acid transporter activity(GO:1990050) |
| 0.1 | 0.8 | GO:0005280 | hydrogen:amino acid symporter activity(GO:0005280) |
| 0.1 | 0.5 | GO:0003827 | alpha-1,3-mannosylglycoprotein 2-beta-N-acetylglucosaminyltransferase activity(GO:0003827) |
| 0.1 | 3.6 | GO:0036002 | pre-mRNA binding(GO:0036002) |
| 0.1 | 0.1 | GO:0038100 | nodal binding(GO:0038100) |
| 0.1 | 0.5 | GO:0034987 | immunoglobulin receptor binding(GO:0034987) |
| 0.1 | 0.2 | GO:0008441 | 3'(2'),5'-bisphosphate nucleotidase activity(GO:0008441) |
| 0.1 | 0.4 | GO:0004719 | protein-L-isoaspartate (D-aspartate) O-methyltransferase activity(GO:0004719) |
| 0.1 | 1.8 | GO:0097200 | cysteine-type endopeptidase activity involved in execution phase of apoptosis(GO:0097200) |
| 0.1 | 0.6 | GO:0000155 | phosphorelay sensor kinase activity(GO:0000155) |
| 0.1 | 1.0 | GO:0044213 | intronic transcription regulatory region sequence-specific DNA binding(GO:0001161) intronic transcription regulatory region DNA binding(GO:0044213) |
| 0.1 | 0.3 | GO:0004802 | transketolase activity(GO:0004802) |
| 0.1 | 2.1 | GO:0017081 | chloride channel regulator activity(GO:0017081) |
| 0.1 | 0.5 | GO:0003989 | acetyl-CoA carboxylase activity(GO:0003989) |
| 0.1 | 0.3 | GO:0051880 | G-quadruplex DNA binding(GO:0051880) |
| 0.1 | 0.6 | GO:0003956 | NAD(P)+-protein-arginine ADP-ribosyltransferase activity(GO:0003956) |
| 0.1 | 0.3 | GO:1990948 | ligase inhibitor activity(GO:0055104) ubiquitin ligase inhibitor activity(GO:1990948) |
| 0.1 | 0.2 | GO:0097689 | iron channel activity(GO:0097689) |
| 0.1 | 0.5 | GO:0001591 | dopamine neurotransmitter receptor activity, coupled via Gi/Go(GO:0001591) |
| 0.1 | 0.3 | GO:0046912 | transferase activity, transferring acyl groups, acyl groups converted into alkyl on transfer(GO:0046912) |
| 0.1 | 1.6 | GO:0015125 | bile acid transmembrane transporter activity(GO:0015125) |
| 0.1 | 0.7 | GO:0004467 | long-chain fatty acid-CoA ligase activity(GO:0004467) |
| 0.1 | 0.1 | GO:0034041 | sterol-transporting ATPase activity(GO:0034041) |
| 0.1 | 10.5 | GO:0004867 | serine-type endopeptidase inhibitor activity(GO:0004867) |
| 0.1 | 0.3 | GO:0050254 | rhodopsin kinase activity(GO:0050254) |
| 0.1 | 0.3 | GO:0043140 | ATP-dependent 3'-5' DNA helicase activity(GO:0043140) |
| 0.1 | 2.7 | GO:0001972 | retinoic acid binding(GO:0001972) |
| 0.1 | 0.5 | GO:0004111 | creatine kinase activity(GO:0004111) |
| 0.1 | 1.4 | GO:0005247 | voltage-gated chloride channel activity(GO:0005247) |
| 0.1 | 0.2 | GO:0015111 | iodide transmembrane transporter activity(GO:0015111) |
| 0.1 | 6.1 | GO:0030276 | clathrin binding(GO:0030276) |
| 0.1 | 0.3 | GO:0044378 | non-sequence-specific DNA binding, bending(GO:0044378) |
| 0.1 | 0.3 | GO:0004315 | 3-oxoacyl-[acyl-carrier-protein] synthase activity(GO:0004315) |
| 0.1 | 1.5 | GO:0005521 | lamin binding(GO:0005521) |
| 0.1 | 0.2 | GO:0090631 | pre-miRNA transporter activity(GO:0090631) |
| 0.1 | 0.5 | GO:0060698 | endoribonuclease inhibitor activity(GO:0060698) |
| 0.1 | 3.7 | GO:0043022 | ribosome binding(GO:0043022) |
| 0.1 | 0.2 | GO:0003918 | DNA topoisomerase type II (ATP-hydrolyzing) activity(GO:0003918) DNA topoisomerase II activity(GO:0061505) |
| 0.1 | 1.2 | GO:0005344 | oxygen transporter activity(GO:0005344) |
| 0.1 | 2.8 | GO:0000175 | 3'-5'-exoribonuclease activity(GO:0000175) |
| 0.1 | 1.0 | GO:0070410 | co-SMAD binding(GO:0070410) |
| 0.1 | 27.2 | GO:0030695 | GTPase regulator activity(GO:0030695) |
| 0.1 | 4.9 | GO:0003743 | translation initiation factor activity(GO:0003743) |
| 0.1 | 0.5 | GO:0004645 | phosphorylase activity(GO:0004645) |
| 0.1 | 0.2 | GO:0008453 | alanine-glyoxylate transaminase activity(GO:0008453) |
| 0.1 | 2.0 | GO:0008327 | methyl-CpG binding(GO:0008327) |
| 0.1 | 0.8 | GO:0005132 | type I interferon receptor binding(GO:0005132) |
| 0.1 | 0.2 | GO:0061656 | SUMO conjugating enzyme activity(GO:0061656) |
| 0.1 | 0.3 | GO:0031735 | CCR10 chemokine receptor binding(GO:0031735) |
| 0.1 | 0.2 | GO:0047708 | biotinidase activity(GO:0047708) |
| 0.1 | 0.3 | GO:0015526 | hexose phosphate transmembrane transporter activity(GO:0015119) organophosphate:inorganic phosphate antiporter activity(GO:0015315) hexose-phosphate:inorganic phosphate antiporter activity(GO:0015526) glucose 6-phosphate:inorganic phosphate antiporter activity(GO:0061513) |
| 0.1 | 0.3 | GO:0008281 | sulfonylurea receptor activity(GO:0008281) |
| 0.1 | 0.2 | GO:0008384 | IkappaB kinase activity(GO:0008384) |
| 0.1 | 0.3 | GO:0004596 | peptide alpha-N-acetyltransferase activity(GO:0004596) |
| 0.1 | 0.5 | GO:0061665 | SUMO ligase activity(GO:0061665) |
| 0.1 | 0.6 | GO:0015232 | heme transporter activity(GO:0015232) |
| 0.1 | 0.7 | GO:0016175 | superoxide-generating NADPH oxidase activity(GO:0016175) |
| 0.1 | 0.4 | GO:0047184 | 1-acylglycerophosphocholine O-acyltransferase activity(GO:0047184) |
| 0.1 | 0.3 | GO:0000405 | bubble DNA binding(GO:0000405) |
| 0.1 | 0.3 | GO:0004749 | ribose phosphate diphosphokinase activity(GO:0004749) |
| 0.1 | 1.0 | GO:0015174 | basic amino acid transmembrane transporter activity(GO:0015174) |
| 0.1 | 0.1 | GO:0010484 | H3 histone acetyltransferase activity(GO:0010484) |
| 0.1 | 2.6 | GO:0031624 | ubiquitin conjugating enzyme binding(GO:0031624) |
| 0.1 | 1.6 | GO:0001011 | transcription factor activity, sequence-specific DNA binding, RNA polymerase recruiting(GO:0001011) transcription factor activity, TFIIB-class binding(GO:0001087) |
| 0.1 | 0.3 | GO:0004105 | choline-phosphate cytidylyltransferase activity(GO:0004105) |
| 0.1 | 0.5 | GO:0001594 | trace-amine receptor activity(GO:0001594) |
| 0.1 | 1.6 | GO:0071617 | 1-acylglycerol-3-phosphate O-acyltransferase activity(GO:0003841) lysophosphatidic acid acyltransferase activity(GO:0042171) lysophospholipid acyltransferase activity(GO:0071617) |
| 0.1 | 0.7 | GO:0034061 | DNA polymerase activity(GO:0034061) |
| 0.1 | 0.5 | GO:0004332 | fructose-bisphosphate aldolase activity(GO:0004332) |
| 0.0 | 0.4 | GO:0098988 | adenylate cyclase inhibiting G-protein coupled glutamate receptor activity(GO:0001640) G-protein coupled glutamate receptor activity(GO:0098988) |
| 0.0 | 0.2 | GO:0008422 | beta-glucosidase activity(GO:0008422) |
| 0.0 | 1.6 | GO:0017091 | AU-rich element binding(GO:0017091) |
| 0.0 | 0.2 | GO:0005047 | signal recognition particle binding(GO:0005047) |
| 0.0 | 0.3 | GO:0003920 | GMP reductase activity(GO:0003920) oxidoreductase activity, acting on NAD(P)H, nitrogenous group as acceptor(GO:0016657) |
| 0.0 | 0.2 | GO:0052901 | polyamine oxidase activity(GO:0046592) spermine:oxygen oxidoreductase (spermidine-forming) activity(GO:0052901) |
| 0.0 | 1.4 | GO:0000993 | RNA polymerase II core binding(GO:0000993) |
| 0.0 | 2.8 | GO:0061650 | ubiquitin-like protein conjugating enzyme activity(GO:0061650) |
| 0.0 | 0.4 | GO:1990226 | histone methyltransferase binding(GO:1990226) |
| 0.0 | 0.9 | GO:0001222 | transcription corepressor binding(GO:0001222) |
| 0.0 | 1.4 | GO:0004869 | cysteine-type endopeptidase inhibitor activity(GO:0004869) |
| 0.0 | 2.4 | GO:0001102 | RNA polymerase II activating transcription factor binding(GO:0001102) |
| 0.0 | 0.3 | GO:0047696 | G-protein coupled receptor kinase activity(GO:0004703) beta-adrenergic receptor kinase activity(GO:0047696) |
| 0.0 | 1.6 | GO:0070577 | lysine-acetylated histone binding(GO:0070577) |
| 0.0 | 0.5 | GO:0019841 | retinol binding(GO:0019841) |
| 0.0 | 0.8 | GO:0009982 | pseudouridine synthase activity(GO:0009982) |
| 0.0 | 0.5 | GO:0015185 | gamma-aminobutyric acid:sodium symporter activity(GO:0005332) gamma-aminobutyric acid transmembrane transporter activity(GO:0015185) |
| 0.0 | 0.3 | GO:0035174 | histone serine kinase activity(GO:0035174) |
| 0.0 | 0.5 | GO:0015271 | outward rectifier potassium channel activity(GO:0015271) |
| 0.0 | 0.1 | GO:0035529 | NADH pyrophosphatase activity(GO:0035529) |
| 0.0 | 1.3 | GO:0051059 | NF-kappaB binding(GO:0051059) |
| 0.0 | 1.6 | GO:0046966 | thyroid hormone receptor binding(GO:0046966) |
| 0.0 | 3.0 | GO:0035064 | methylated histone binding(GO:0035064) |
| 0.0 | 0.1 | GO:0015275 | stretch-activated, cation-selective, calcium channel activity(GO:0015275) |
| 0.0 | 0.4 | GO:0003873 | 6-phosphofructo-2-kinase activity(GO:0003873) |
| 0.0 | 0.7 | GO:0003993 | acid phosphatase activity(GO:0003993) |
| 0.0 | 0.2 | GO:0008457 | beta-galactosyl-N-acetylglucosaminylgalactosylglucosyl-ceramide beta-1,3-acetylglucosaminyltransferase activity(GO:0008457) lactosylceramide 1,3-N-acetyl-beta-D-glucosaminyltransferase activity(GO:0047256) |
| 0.0 | 0.2 | GO:0050510 | N-acetylgalactosaminyl-proteoglycan 3-beta-glucuronosyltransferase activity(GO:0050510) |
| 0.0 | 0.6 | GO:0003688 | DNA replication origin binding(GO:0003688) |
| 0.0 | 0.4 | GO:0016361 | activin receptor activity, type I(GO:0016361) |
| 0.0 | 0.6 | GO:0047499 | calcium-independent phospholipase A2 activity(GO:0047499) |
| 0.0 | 0.2 | GO:0004307 | ethanolaminephosphotransferase activity(GO:0004307) |
| 0.0 | 0.3 | GO:0008853 | exodeoxyribonuclease III activity(GO:0008853) |
| 0.0 | 1.0 | GO:0034237 | protein kinase A regulatory subunit binding(GO:0034237) |
| 0.0 | 0.3 | GO:0031386 | protein tag(GO:0031386) |
| 0.0 | 1.6 | GO:0004866 | endopeptidase inhibitor activity(GO:0004866) |
| 0.0 | 0.1 | GO:0042947 | glucoside transmembrane transporter activity(GO:0042947) |
| 0.0 | 0.2 | GO:0032450 | maltose alpha-glucosidase activity(GO:0032450) |
| 0.0 | 0.0 | GO:0032407 | mismatch repair complex binding(GO:0032404) MutSalpha complex binding(GO:0032407) |
| 0.0 | 0.4 | GO:0097371 | MDM2/MDM4 family protein binding(GO:0097371) |
| 0.0 | 0.1 | GO:0031071 | cysteine desulfurase activity(GO:0031071) |
| 0.0 | 2.1 | GO:0004402 | histone acetyltransferase activity(GO:0004402) |
| 0.0 | 0.5 | GO:0046703 | natural killer cell lectin-like receptor binding(GO:0046703) |
| 0.0 | 0.1 | GO:0070644 | vitamin D response element binding(GO:0070644) |
| 0.0 | 0.2 | GO:0031543 | peptidyl-proline dioxygenase activity(GO:0031543) |
| 0.0 | 0.3 | GO:0043225 | anion transmembrane-transporting ATPase activity(GO:0043225) |
| 0.0 | 0.3 | GO:0038052 | RNA polymerase II transcription factor activity, estrogen-activated sequence-specific DNA binding(GO:0038052) |
| 0.0 | 0.1 | GO:0003985 | acetyl-CoA C-acetyltransferase activity(GO:0003985) |
| 0.0 | 0.1 | GO:0051021 | GDP-dissociation inhibitor binding(GO:0051021) Rho GDP-dissociation inhibitor binding(GO:0051022) |
| 0.0 | 1.2 | GO:0048027 | mRNA 5'-UTR binding(GO:0048027) |
| 0.0 | 0.2 | GO:0047493 | sphingomyelin synthase activity(GO:0033188) ceramide cholinephosphotransferase activity(GO:0047493) |
| 0.0 | 0.5 | GO:0005149 | interleukin-1 receptor binding(GO:0005149) |
| 0.0 | 0.3 | GO:0008097 | 5S rRNA binding(GO:0008097) |
| 0.0 | 0.2 | GO:0043023 | ribosomal large subunit binding(GO:0043023) |
| 0.0 | 2.8 | GO:0005070 | SH3/SH2 adaptor activity(GO:0005070) |
| 0.0 | 1.0 | GO:0022841 | potassium ion leak channel activity(GO:0022841) |
| 0.0 | 0.2 | GO:0080019 | fatty-acyl-CoA reductase (alcohol-forming) activity(GO:0080019) |
| 0.0 | 0.1 | GO:0004948 | calcitonin receptor activity(GO:0004948) |
| 0.0 | 0.4 | GO:0016884 | carbon-nitrogen ligase activity, with glutamine as amido-N-donor(GO:0016884) |
| 0.0 | 0.8 | GO:0008349 | MAP kinase kinase kinase kinase activity(GO:0008349) |
| 0.0 | 0.2 | GO:0052591 | sn-glycerol-3-phosphate:ubiquinone oxidoreductase activity(GO:0052590) sn-glycerol-3-phosphate:ubiquinone-8 oxidoreductase activity(GO:0052591) |
| 0.0 | 0.3 | GO:0031369 | translation initiation factor binding(GO:0031369) |
| 0.0 | 0.9 | GO:0030159 | receptor signaling complex scaffold activity(GO:0030159) |
| 0.0 | 0.9 | GO:0008066 | glutamate receptor activity(GO:0008066) |
| 0.0 | 0.1 | GO:0016714 | oxidoreductase activity, acting on paired donors, with incorporation or reduction of molecular oxygen, reduced pteridine as one donor, and incorporation of one atom of oxygen(GO:0016714) |
| 0.0 | 0.3 | GO:0042054 | histone methyltransferase activity(GO:0042054) |
| 0.0 | 1.5 | GO:0008138 | protein tyrosine/serine/threonine phosphatase activity(GO:0008138) |
| 0.0 | 0.2 | GO:1990430 | extracellular matrix protein binding(GO:1990430) |
| 0.0 | 0.2 | GO:0008428 | ribonuclease inhibitor activity(GO:0008428) |
| 0.0 | 0.1 | GO:0004339 | glucan 1,4-alpha-glucosidase activity(GO:0004339) |
| 0.0 | 0.1 | GO:0004766 | spermidine synthase activity(GO:0004766) |
| 0.0 | 7.3 | GO:0003735 | structural constituent of ribosome(GO:0003735) |
| 0.0 | 0.5 | GO:0008301 | DNA binding, bending(GO:0008301) |
| 0.0 | 0.1 | GO:0070039 | rRNA (guanosine-2'-O-)-methyltransferase activity(GO:0070039) |
| 0.0 | 0.5 | GO:0004000 | adenosine deaminase activity(GO:0004000) |
| 0.0 | 0.2 | GO:0031996 | thioesterase binding(GO:0031996) |
| 0.0 | 1.7 | GO:0035255 | ionotropic glutamate receptor binding(GO:0035255) |
| 0.0 | 0.1 | GO:0004090 | carbonyl reductase (NADPH) activity(GO:0004090) |
| 0.0 | 0.8 | GO:0008239 | dipeptidyl-peptidase activity(GO:0008239) |
| 0.0 | 0.1 | GO:0015222 | serotonin transmembrane transporter activity(GO:0015222) |
| 0.0 | 0.4 | GO:0004062 | aryl sulfotransferase activity(GO:0004062) |
| 0.0 | 4.1 | GO:0017124 | SH3 domain binding(GO:0017124) |
| 0.0 | 1.0 | GO:0022829 | wide pore channel activity(GO:0022829) |
| 0.0 | 0.1 | GO:0004144 | diacylglycerol O-acyltransferase activity(GO:0004144) |
| 0.0 | 1.6 | GO:0050681 | androgen receptor binding(GO:0050681) |
| 0.0 | 0.2 | GO:0008523 | sodium-dependent multivitamin transmembrane transporter activity(GO:0008523) |
| 0.0 | 0.2 | GO:0032027 | myosin light chain binding(GO:0032027) |
| 0.0 | 1.1 | GO:0051879 | Hsp90 protein binding(GO:0051879) |
| 0.0 | 0.2 | GO:0016670 | oxidoreductase activity, acting on a sulfur group of donors, oxygen as acceptor(GO:0016670) |
| 0.0 | 0.1 | GO:0090422 | thiamine pyrophosphate transporter activity(GO:0090422) |
| 0.0 | 0.6 | GO:0008195 | phosphatidate phosphatase activity(GO:0008195) |
| 0.0 | 1.0 | GO:0008331 | high voltage-gated calcium channel activity(GO:0008331) |
| 0.0 | 0.1 | GO:0047757 | chondroitin-glucuronate 5-epimerase activity(GO:0047757) |
| 0.0 | 0.1 | GO:0003828 | alpha-N-acetylneuraminate alpha-2,8-sialyltransferase activity(GO:0003828) |
| 0.0 | 0.4 | GO:0015501 | glutamate:sodium symporter activity(GO:0015501) |
| 0.0 | 0.2 | GO:0032184 | SUMO polymer binding(GO:0032184) |
| 0.0 | 0.1 | GO:0008332 | low voltage-gated calcium channel activity(GO:0008332) |
| 0.0 | 0.5 | GO:0048531 | beta-1,3-galactosyltransferase activity(GO:0048531) |
| 0.0 | 0.4 | GO:0034450 | ubiquitin-ubiquitin ligase activity(GO:0034450) |
| 0.0 | 1.8 | GO:0043130 | ubiquitin binding(GO:0043130) |
| 0.0 | 0.1 | GO:0047025 | 3-oxoacyl-[acyl-carrier-protein] reductase (NADH) activity(GO:0047025) |
| 0.0 | 2.0 | GO:0001085 | RNA polymerase II transcription factor binding(GO:0001085) |
| 0.0 | 7.5 | GO:0030246 | carbohydrate binding(GO:0030246) |
| 0.0 | 0.1 | GO:0017127 | cholesterol transporter activity(GO:0017127) |
| 0.0 | 0.1 | GO:0097100 | supercoiled DNA binding(GO:0097100) |
| 0.0 | 0.5 | GO:0008139 | nuclear localization sequence binding(GO:0008139) |
| 0.0 | 0.7 | GO:0008266 | poly-pyrimidine tract binding(GO:0008187) poly(U) RNA binding(GO:0008266) |
| 0.0 | 0.4 | GO:0016854 | racemase and epimerase activity(GO:0016854) |
| 0.0 | 0.5 | GO:0055056 | D-glucose transmembrane transporter activity(GO:0055056) |
| 0.0 | 0.1 | GO:0036505 | prosaposin receptor activity(GO:0036505) |
| 0.0 | 0.2 | GO:0022833 | mechanically-gated ion channel activity(GO:0008381) mechanically gated channel activity(GO:0022833) |
| 0.0 | 0.0 | GO:0016979 | lipoate-protein ligase activity(GO:0016979) |
| 0.0 | 0.2 | GO:0000213 | tRNA-intron endonuclease activity(GO:0000213) |
| 0.0 | 0.1 | GO:0019237 | centromeric DNA binding(GO:0019237) |
| 0.0 | 0.1 | GO:0005078 | MAP-kinase scaffold activity(GO:0005078) |
| 0.0 | 0.1 | GO:0031208 | POZ domain binding(GO:0031208) |
| 0.0 | 0.1 | GO:0033842 | N-acetyl-beta-glucosaminyl-glycoprotein 4-beta-N-acetylgalactosaminyltransferase activity(GO:0033842) |
| 0.0 | 0.2 | GO:0045134 | uridine-diphosphatase activity(GO:0045134) |
| 0.0 | 0.2 | GO:0017150 | tRNA dihydrouridine synthase activity(GO:0017150) |
| 0.0 | 0.5 | GO:0005487 | nucleocytoplasmic transporter activity(GO:0005487) |
| 0.0 | 0.1 | GO:0015165 | pyrimidine nucleotide-sugar transmembrane transporter activity(GO:0015165) |
| 0.0 | 0.2 | GO:0043142 | single-stranded DNA-dependent ATPase activity(GO:0043142) |
| 0.0 | 0.1 | GO:0004726 | non-membrane spanning protein tyrosine phosphatase activity(GO:0004726) |
| 0.0 | 0.1 | GO:0002151 | G-quadruplex RNA binding(GO:0002151) |
| 0.0 | 0.1 | GO:1990247 | N6-methyladenosine-containing RNA binding(GO:1990247) |
| 0.0 | 0.1 | GO:0004169 | dolichyl-phosphate-mannose-protein mannosyltransferase activity(GO:0004169) |
| 0.0 | 0.2 | GO:0005412 | glucose:sodium symporter activity(GO:0005412) |
| 0.0 | 0.2 | GO:1990829 | C-rich single-stranded DNA binding(GO:1990829) |
| 0.0 | 0.1 | GO:0016716 | oxidoreductase activity, acting on paired donors, with incorporation or reduction of molecular oxygen, another compound as one donor, and incorporation of one atom of oxygen(GO:0016716) |
| 0.0 | 1.2 | GO:0000979 | RNA polymerase II core promoter sequence-specific DNA binding(GO:0000979) |
| 0.0 | 0.1 | GO:0009008 | DNA-methyltransferase activity(GO:0009008) |
| 0.0 | 0.1 | GO:0015307 | drug:proton antiporter activity(GO:0015307) |
| 0.0 | 0.5 | GO:0030552 | cAMP binding(GO:0030552) |
| 0.0 | 3.4 | GO:0051020 | GTPase binding(GO:0051020) |
| 0.0 | 0.7 | GO:0051010 | microtubule plus-end binding(GO:0051010) |
| 0.0 | 0.1 | GO:0004492 | methylmalonyl-CoA decarboxylase activity(GO:0004492) |
| 0.0 | 0.1 | GO:0015279 | store-operated calcium channel activity(GO:0015279) |
| 0.0 | 1.2 | GO:0004004 | ATP-dependent RNA helicase activity(GO:0004004) |
| 0.0 | 1.5 | GO:0003697 | single-stranded DNA binding(GO:0003697) |
| 0.0 | 0.7 | GO:0005484 | SNAP receptor activity(GO:0005484) |
| 0.0 | 0.2 | GO:0097602 | cullin family protein binding(GO:0097602) |
| 0.0 | 0.1 | GO:0034713 | type I transforming growth factor beta receptor binding(GO:0034713) |
| 0.0 | 0.2 | GO:0003836 | beta-galactoside (CMP) alpha-2,3-sialyltransferase activity(GO:0003836) |
| 0.0 | 0.3 | GO:0004185 | serine-type carboxypeptidase activity(GO:0004185) |
| 0.0 | 0.0 | GO:0042328 | heparan sulfate N-acetylglucosaminyltransferase activity(GO:0042328) |
| 0.0 | 0.6 | GO:0048306 | calcium-dependent protein binding(GO:0048306) |
| 0.0 | 0.1 | GO:0004859 | phospholipase inhibitor activity(GO:0004859) |
| 0.0 | 0.2 | GO:0035591 | signaling adaptor activity(GO:0035591) |
| 0.0 | 0.1 | GO:0015272 | ATP-activated inward rectifier potassium channel activity(GO:0015272) |
Gene overrepresentation in curated gene sets: canonical pathways category:
| Log-likelihood per target | Total log-likelihood | Term | Description |
|---|---|---|---|
| 0.7 | 44.9 | PID INTEGRIN2 PATHWAY | Beta2 integrin cell surface interactions |
| 0.7 | 81.7 | PID CD8 TCR PATHWAY | TCR signaling in naïve CD8+ T cells |
| 0.7 | 28.8 | SA MMP CYTOKINE CONNECTION | Cytokines can induce activation of matrix metalloproteinases, which degrade extracellular matrix. |
| 0.5 | 18.3 | PID TOLL ENDOGENOUS PATHWAY | Endogenous TLR signaling |
| 0.4 | 24.8 | PID IL8 CXCR2 PATHWAY | IL8- and CXCR2-mediated signaling events |
| 0.4 | 15.8 | PID IL12 STAT4 PATHWAY | IL12 signaling mediated by STAT4 |
| 0.3 | 18.9 | PID CD8 TCR DOWNSTREAM PATHWAY | Downstream signaling in naïve CD8+ T cells |
| 0.3 | 25.2 | PID BCR 5PATHWAY | BCR signaling pathway |
| 0.3 | 11.9 | PID NFKAPPAB CANONICAL PATHWAY | Canonical NF-kappaB pathway |
| 0.3 | 3.3 | PID THROMBIN PAR4 PATHWAY | PAR4-mediated thrombin signaling events |
| 0.3 | 16.4 | PID IFNG PATHWAY | IFN-gamma pathway |
| 0.3 | 5.6 | PID IL5 PATHWAY | IL5-mediated signaling events |
| 0.3 | 7.7 | PID IL2 1PATHWAY | IL2-mediated signaling events |
| 0.2 | 2.6 | PID AMB2 NEUTROPHILS PATHWAY | amb2 Integrin signaling |
| 0.2 | 0.9 | PID TCR JNK PATHWAY | JNK signaling in the CD4+ TCR pathway |
| 0.2 | 7.0 | PID TRAIL PATHWAY | TRAIL signaling pathway |
| 0.2 | 2.9 | SA B CELL RECEPTOR COMPLEXES | Antigen binding to B cell receptors activates protein tyrosine kinases, such as the Src family, which ultimate activate MAP kinases. |
| 0.2 | 8.9 | PID IL2 STAT5 PATHWAY | IL2 signaling events mediated by STAT5 |
| 0.2 | 0.6 | PID AR NONGENOMIC PATHWAY | Nongenotropic Androgen signaling |
| 0.2 | 5.4 | PID EPHRINB REV PATHWAY | Ephrin B reverse signaling |
| 0.2 | 7.6 | PID IL6 7 PATHWAY | IL6-mediated signaling events |
| 0.2 | 6.7 | PID P38 MKK3 6PATHWAY | p38 MAPK signaling pathway |
| 0.2 | 4.7 | PID IL23 PATHWAY | IL23-mediated signaling events |
| 0.2 | 5.5 | PID GMCSF PATHWAY | GMCSF-mediated signaling events |
| 0.2 | 10.1 | PID PI3KCI PATHWAY | Class I PI3K signaling events |
| 0.2 | 14.9 | PID HNF3A PATHWAY | FOXA1 transcription factor network |
| 0.2 | 6.2 | PID CONE PATHWAY | Visual signal transduction: Cones |
| 0.2 | 13.8 | PID HNF3B PATHWAY | FOXA2 and FOXA3 transcription factor networks |
| 0.2 | 7.9 | PID FCER1 PATHWAY | Fc-epsilon receptor I signaling in mast cells |
| 0.2 | 9.9 | PID P38 ALPHA BETA DOWNSTREAM PATHWAY | Signaling mediated by p38-alpha and p38-beta |
| 0.2 | 8.3 | PID UPA UPAR PATHWAY | Urokinase-type plasminogen activator (uPA) and uPAR-mediated signaling |
| 0.2 | 14.7 | PID RAC1 PATHWAY | RAC1 signaling pathway |
| 0.1 | 1.3 | PID IL2 PI3K PATHWAY | IL2 signaling events mediated by PI3K |
| 0.1 | 6.3 | PID ERBB NETWORK PATHWAY | ErbB receptor signaling network |
| 0.1 | 7.3 | PID ERBB1 INTERNALIZATION PATHWAY | Internalization of ErbB1 |
| 0.1 | 2.4 | PID IL12 2PATHWAY | IL12-mediated signaling events |
| 0.1 | 1.8 | ST PAC1 RECEPTOR PATHWAY | PAC1 Receptor Pathway |
| 0.1 | 1.6 | PID IL27 PATHWAY | IL27-mediated signaling events |
| 0.1 | 4.7 | PID KIT PATHWAY | Signaling events mediated by Stem cell factor receptor (c-Kit) |
| 0.1 | 2.2 | PID INTEGRIN A9B1 PATHWAY | Alpha9 beta1 integrin signaling events |
| 0.1 | 1.7 | PID EPHB FWD PATHWAY | EPHB forward signaling |
| 0.1 | 0.5 | PID IL8 CXCR1 PATHWAY | IL8- and CXCR1-mediated signaling events |
| 0.1 | 0.9 | SA FAS SIGNALING | The TNF-type receptor Fas induces apoptosis on ligand binding. |
| 0.1 | 4.5 | PID IL1 PATHWAY | IL1-mediated signaling events |
| 0.1 | 6.8 | PID CDC42 PATHWAY | CDC42 signaling events |
| 0.1 | 8.1 | PID HDAC CLASSII PATHWAY | Signaling events mediated by HDAC Class II |
| 0.1 | 6.6 | PID ERBB1 DOWNSTREAM PATHWAY | ErbB1 downstream signaling |
| 0.1 | 3.3 | PID RAS PATHWAY | Regulation of Ras family activation |
| 0.1 | 7.6 | PID RAC1 REG PATHWAY | Regulation of RAC1 activity |
| 0.1 | 0.6 | SA PTEN PATHWAY | PTEN is a tumor suppressor that dephosphorylates the lipid messenger phosphatidylinositol triphosphate. |
| 0.1 | 2.7 | PID RHOA PATHWAY | RhoA signaling pathway |
| 0.1 | 0.6 | PID SYNDECAN 3 PATHWAY | Syndecan-3-mediated signaling events |
| 0.1 | 3.9 | PID TELOMERASE PATHWAY | Regulation of Telomerase |
| 0.1 | 2.1 | PID THROMBIN PAR1 PATHWAY | PAR1-mediated thrombin signaling events |
| 0.1 | 0.3 | ST GA13 PATHWAY | G alpha 13 Pathway |
| 0.1 | 0.3 | PID NFKAPPAB ATYPICAL PATHWAY | Atypical NF-kappaB pathway |
| 0.1 | 1.7 | PID ERB GENOMIC PATHWAY | Validated nuclear estrogen receptor beta network |
| 0.1 | 3.8 | PID FANCONI PATHWAY | Fanconi anemia pathway |
| 0.1 | 1.1 | PID ALK2 PATHWAY | ALK2 signaling events |
| 0.1 | 0.9 | SA PROGRAMMED CELL DEATH | Programmed cell death, or apoptosis, eliminates damaged or unneeded cells. |
| 0.1 | 1.0 | PID INTEGRIN3 PATHWAY | Beta3 integrin cell surface interactions |
| 0.1 | 7.2 | PID CMYB PATHWAY | C-MYB transcription factor network |
| 0.1 | 1.2 | ST ERK1 ERK2 MAPK PATHWAY | ERK1/ERK2 MAPK Pathway |
| 0.1 | 1.4 | PID RXR VDR PATHWAY | RXR and RAR heterodimerization with other nuclear receptor |
| 0.0 | 3.7 | PID E2F PATHWAY | E2F transcription factor network |
| 0.0 | 5.5 | PID SMAD2 3NUCLEAR PATHWAY | Regulation of nuclear SMAD2/3 signaling |
| 0.0 | 0.8 | SA CASPASE CASCADE | Apoptosis is mediated by caspases, cysteine proteases arranged in a proteolytic cascade. |
| 0.0 | 0.9 | PID ATF2 PATHWAY | ATF-2 transcription factor network |
| 0.0 | 2.3 | PID PDGFRB PATHWAY | PDGFR-beta signaling pathway |
| 0.0 | 0.5 | PID HDAC CLASSIII PATHWAY | Signaling events mediated by HDAC Class III |
| 0.0 | 1.4 | PID NFAT 3PATHWAY | Role of Calcineurin-dependent NFAT signaling in lymphocytes |
| 0.0 | 1.4 | PID AP1 PATHWAY | AP-1 transcription factor network |
| 0.0 | 2.4 | PID BETA CATENIN NUC PATHWAY | Regulation of nuclear beta catenin signaling and target gene transcription |
| 0.0 | 1.0 | PID NCADHERIN PATHWAY | N-cadherin signaling events |
| 0.0 | 0.7 | PID ALPHA SYNUCLEIN PATHWAY | Alpha-synuclein signaling |
| 0.0 | 1.3 | PID IL4 2PATHWAY | IL4-mediated signaling events |
| 0.0 | 0.6 | PID MAPK TRK PATHWAY | Trk receptor signaling mediated by the MAPK pathway |
| 0.0 | 2.3 | PID HIF1 TFPATHWAY | HIF-1-alpha transcription factor network |
| 0.0 | 0.3 | PID S1P META PATHWAY | Sphingosine 1-phosphate (S1P) pathway |
| 0.0 | 0.8 | PID FOXO PATHWAY | FoxO family signaling |
| 0.0 | 1.9 | PID PLK1 PATHWAY | PLK1 signaling events |
| 0.0 | 0.1 | PID ANGIOPOIETIN RECEPTOR PATHWAY | Angiopoietin receptor Tie2-mediated signaling |
| 0.0 | 1.1 | PID PS1 PATHWAY | Presenilin action in Notch and Wnt signaling |
| 0.0 | 0.6 | PID PTP1B PATHWAY | Signaling events mediated by PTP1B |
| 0.0 | 0.8 | PID RB 1PATHWAY | Regulation of retinoblastoma protein |
| 0.0 | 0.1 | PID HIV NEF PATHWAY | HIV-1 Nef: Negative effector of Fas and TNF-alpha |
| 0.0 | 0.6 | PID MYC PATHWAY | C-MYC pathway |
| 0.0 | 0.2 | ST P38 MAPK PATHWAY | p38 MAPK Pathway |
| 0.0 | 0.8 | PID AURORA A PATHWAY | Aurora A signaling |
| 0.0 | 0.9 | PID CDC42 REG PATHWAY | Regulation of CDC42 activity |
| 0.0 | 0.4 | PID LPA4 PATHWAY | LPA4-mediated signaling events |
| 0.0 | 1.5 | PID CASPASE PATHWAY | Caspase cascade in apoptosis |
| 0.0 | 1.3 | PID AR PATHWAY | Coregulation of Androgen receptor activity |
| 0.0 | 0.2 | PID RET PATHWAY | Signaling events regulated by Ret tyrosine kinase |
| 0.0 | 0.2 | PID ANTHRAX PATHWAY | Cellular roles of Anthrax toxin |
| 0.0 | 0.1 | PID CERAMIDE PATHWAY | Ceramide signaling pathway |
Gene overrepresentation in curated gene sets: REACTOME pathways category:
| Log-likelihood per target | Total log-likelihood | Term | Description |
|---|---|---|---|
| 1.4 | 39.4 | REACTOME PHOSPHORYLATION OF CD3 AND TCR ZETA CHAINS | Genes involved in Phosphorylation of CD3 and TCR zeta chains |
| 0.7 | 83.0 | REACTOME IMMUNOREGULATORY INTERACTIONS BETWEEN A LYMPHOID AND A NON LYMPHOID CELL | Genes involved in Immunoregulatory interactions between a Lymphoid and a non-Lymphoid cell |
| 0.6 | 10.5 | REACTOME CD28 DEPENDENT VAV1 PATHWAY | Genes involved in CD28 dependent Vav1 pathway |
| 0.6 | 11.6 | REACTOME COMMON PATHWAY | Genes involved in Common Pathway |
| 0.6 | 10.5 | REACTOME PLATELET ADHESION TO EXPOSED COLLAGEN | Genes involved in Platelet Adhesion to exposed collagen |
| 0.5 | 17.9 | REACTOME GENERATION OF SECOND MESSENGER MOLECULES | Genes involved in Generation of second messenger molecules |
| 0.5 | 14.9 | REACTOME CITRIC ACID CYCLE TCA CYCLE | Genes involved in Citric acid cycle (TCA cycle) |
| 0.4 | 3.6 | REACTOME TRAF6 MEDIATED IRF7 ACTIVATION IN TLR7 8 OR 9 SIGNALING | Genes involved in TRAF6 mediated IRF7 activation in TLR7/8 or 9 signaling |
| 0.4 | 0.4 | REACTOME PROSTACYCLIN SIGNALLING THROUGH PROSTACYCLIN RECEPTOR | Genes involved in Prostacyclin signalling through prostacyclin receptor |
| 0.4 | 3.1 | REACTOME PD1 SIGNALING | Genes involved in PD-1 signaling |
| 0.4 | 46.6 | REACTOME INTERFERON GAMMA SIGNALING | Genes involved in Interferon gamma signaling |
| 0.4 | 9.3 | REACTOME ACTIVATED TAK1 MEDIATES P38 MAPK ACTIVATION | Genes involved in activated TAK1 mediates p38 MAPK activation |
| 0.4 | 18.9 | REACTOME TCR SIGNALING | Genes involved in TCR signaling |
| 0.4 | 4.4 | REACTOME PLATELET SENSITIZATION BY LDL | Genes involved in Platelet sensitization by LDL |
| 0.4 | 7.4 | REACTOME IL 7 SIGNALING | Genes involved in Interleukin-7 signaling |
| 0.4 | 13.0 | REACTOME INFLAMMASOMES | Genes involved in Inflammasomes |
| 0.4 | 27.2 | REACTOME CHEMOKINE RECEPTORS BIND CHEMOKINES | Genes involved in Chemokine receptors bind chemokines |
| 0.3 | 6.3 | REACTOME REGULATION OF PYRUVATE DEHYDROGENASE PDH COMPLEX | Genes involved in Regulation of pyruvate dehydrogenase (PDH) complex |
| 0.3 | 0.7 | REACTOME NUCLEAR EVENTS KINASE AND TRANSCRIPTION FACTOR ACTIVATION | Genes involved in Nuclear Events (kinase and transcription factor activation) |
| 0.3 | 4.4 | REACTOME REGULATION OF THE FANCONI ANEMIA PATHWAY | Genes involved in Regulation of the Fanconi anemia pathway |
| 0.3 | 7.1 | REACTOME RIP MEDIATED NFKB ACTIVATION VIA DAI | Genes involved in RIP-mediated NFkB activation via DAI |
| 0.3 | 4.3 | REACTOME TRYPTOPHAN CATABOLISM | Genes involved in Tryptophan catabolism |
| 0.3 | 5.1 | REACTOME PASSIVE TRANSPORT BY AQUAPORINS | Genes involved in Passive Transport by Aquaporins |
| 0.3 | 7.4 | REACTOME CHYLOMICRON MEDIATED LIPID TRANSPORT | Genes involved in Chylomicron-mediated lipid transport |
| 0.3 | 4.7 | REACTOME CTNNB1 PHOSPHORYLATION CASCADE | Genes involved in Beta-catenin phosphorylation cascade |
| 0.3 | 5.2 | REACTOME XENOBIOTICS | Genes involved in Xenobiotics |
| 0.3 | 8.4 | REACTOME NUCLEOTIDE BINDING DOMAIN LEUCINE RICH REPEAT CONTAINING RECEPTOR NLR SIGNALING PATHWAYS | Genes involved in Nucleotide-binding domain, leucine rich repeat containing receptor (NLR) signaling pathways |
| 0.3 | 13.4 | REACTOME COMPLEMENT CASCADE | Genes involved in Complement cascade |
| 0.3 | 0.5 | REACTOME AUTODEGRADATION OF THE E3 UBIQUITIN LIGASE COP1 | Genes involved in Autodegradation of the E3 ubiquitin ligase COP1 |
| 0.3 | 2.1 | REACTOME REGULATION OF SIGNALING BY CBL | Genes involved in Regulation of signaling by CBL |
| 0.3 | 1.8 | REACTOME ACTIVATION OF NF KAPPAB IN B CELLS | Genes involved in Activation of NF-kappaB in B Cells |
| 0.3 | 9.3 | REACTOME IL RECEPTOR SHC SIGNALING | Genes involved in Interleukin receptor SHC signaling |
| 0.2 | 9.2 | REACTOME ANTIGEN ACTIVATES B CELL RECEPTOR LEADING TO GENERATION OF SECOND MESSENGERS | Genes involved in Antigen Activates B Cell Receptor Leading to Generation of Second Messengers |
| 0.2 | 7.8 | REACTOME G BETA GAMMA SIGNALLING THROUGH PI3KGAMMA | Genes involved in G beta:gamma signalling through PI3Kgamma |
| 0.2 | 10.8 | REACTOME IL1 SIGNALING | Genes involved in Interleukin-1 signaling |
| 0.2 | 6.9 | REACTOME EXTRINSIC PATHWAY FOR APOPTOSIS | Genes involved in Extrinsic Pathway for Apoptosis |
| 0.2 | 10.5 | REACTOME SYNTHESIS OF PIPS AT THE PLASMA MEMBRANE | Genes involved in Synthesis of PIPs at the plasma membrane |
| 0.2 | 4.4 | REACTOME IL 2 SIGNALING | Genes involved in Interleukin-2 signaling |
| 0.2 | 3.4 | REACTOME PLATELET CALCIUM HOMEOSTASIS | Genes involved in Platelet calcium homeostasis |
| 0.2 | 12.9 | REACTOME COSTIMULATION BY THE CD28 FAMILY | Genes involved in Costimulation by the CD28 family |
| 0.2 | 4.0 | REACTOME PYRIMIDINE CATABOLISM | Genes involved in Pyrimidine catabolism |
| 0.2 | 3.7 | REACTOME GPVI MEDIATED ACTIVATION CASCADE | Genes involved in GPVI-mediated activation cascade |
| 0.2 | 6.2 | REACTOME DOWNREGULATION OF ERBB2 ERBB3 SIGNALING | Genes involved in Downregulation of ERBB2:ERBB3 signaling |
| 0.2 | 0.8 | REACTOME TRANSFERRIN ENDOCYTOSIS AND RECYCLING | Genes involved in Transferrin endocytosis and recycling |
| 0.2 | 1.6 | REACTOME ERKS ARE INACTIVATED | Genes involved in ERKs are inactivated |
| 0.2 | 0.6 | REACTOME MRNA CAPPING | Genes involved in mRNA Capping |
| 0.2 | 5.4 | REACTOME ERK MAPK TARGETS | Genes involved in ERK/MAPK targets |
| 0.2 | 20.7 | REACTOME ANTIGEN PROCESSING CROSS PRESENTATION | Genes involved in Antigen processing-Cross presentation |
| 0.2 | 3.5 | REACTOME MTORC1 MEDIATED SIGNALLING | Genes involved in mTORC1-mediated signalling |
| 0.2 | 9.4 | REACTOME LYSOSOME VESICLE BIOGENESIS | Genes involved in Lysosome Vesicle Biogenesis |
| 0.2 | 3.0 | REACTOME RECYCLING OF BILE ACIDS AND SALTS | Genes involved in Recycling of bile acids and salts |
| 0.2 | 7.7 | REACTOME EFFECTS OF PIP2 HYDROLYSIS | Genes involved in Effects of PIP2 hydrolysis |
| 0.2 | 1.6 | REACTOME P38MAPK EVENTS | Genes involved in p38MAPK events |
| 0.2 | 1.8 | REACTOME ADVANCED GLYCOSYLATION ENDPRODUCT RECEPTOR SIGNALING | Genes involved in Advanced glycosylation endproduct receptor signaling |
| 0.2 | 4.4 | REACTOME PURINE SALVAGE | Genes involved in Purine salvage |
| 0.2 | 1.4 | REACTOME ARMS MEDIATED ACTIVATION | Genes involved in ARMS-mediated activation |
| 0.2 | 1.0 | REACTOME ACETYLCHOLINE NEUROTRANSMITTER RELEASE CYCLE | Genes involved in Acetylcholine Neurotransmitter Release Cycle |
| 0.2 | 0.2 | REACTOME RETROGRADE NEUROTROPHIN SIGNALLING | Genes involved in Retrograde neurotrophin signalling |
| 0.2 | 4.8 | REACTOME PRE NOTCH PROCESSING IN GOLGI | Genes involved in Pre-NOTCH Processing in Golgi |
| 0.2 | 2.5 | REACTOME ACTIVATION OF CHAPERONE GENES BY ATF6 ALPHA | Genes involved in Activation of Chaperone Genes by ATF6-alpha |
| 0.2 | 2.0 | REACTOME GAMMA CARBOXYLATION TRANSPORT AND AMINO TERMINAL CLEAVAGE OF PROTEINS | Genes involved in Gamma-carboxylation, transport, and amino-terminal cleavage of proteins |
| 0.1 | 4.0 | REACTOME ORGANIC CATION ANION ZWITTERION TRANSPORT | Genes involved in Organic cation/anion/zwitterion transport |
| 0.1 | 1.7 | REACTOME COPI MEDIATED TRANSPORT | Genes involved in COPI Mediated Transport |
| 0.1 | 6.0 | REACTOME REGULATION OF GENE EXPRESSION IN BETA CELLS | Genes involved in Regulation of gene expression in beta cells |
| 0.1 | 1.7 | REACTOME PTM GAMMA CARBOXYLATION HYPUSINE FORMATION AND ARYLSULFATASE ACTIVATION | Genes involved in PTM: gamma carboxylation, hypusine formation and arylsulfatase activation |
| 0.1 | 3.1 | REACTOME POST NMDA RECEPTOR ACTIVATION EVENTS | Genes involved in Post NMDA receptor activation events |
| 0.1 | 2.3 | REACTOME IL 3 5 AND GM CSF SIGNALING | Genes involved in Interleukin-3, 5 and GM-CSF signaling |
| 0.1 | 0.4 | REACTOME HORMONE LIGAND BINDING RECEPTORS | Genes involved in Hormone ligand-binding receptors |
| 0.1 | 1.1 | REACTOME IKK COMPLEX RECRUITMENT MEDIATED BY RIP1 | Genes involved in IKK complex recruitment mediated by RIP1 |
| 0.1 | 2.5 | REACTOME CLASS C 3 METABOTROPIC GLUTAMATE PHEROMONE RECEPTORS | Genes involved in Class C/3 (Metabotropic glutamate/pheromone receptors) |
| 0.1 | 2.7 | REACTOME BASE FREE SUGAR PHOSPHATE REMOVAL VIA THE SINGLE NUCLEOTIDE REPLACEMENT PATHWAY | Genes involved in Base-free sugar-phosphate removal via the single-nucleotide replacement pathway |
| 0.1 | 9.9 | REACTOME GLYCOSPHINGOLIPID METABOLISM | Genes involved in Glycosphingolipid metabolism |
| 0.1 | 2.8 | REACTOME PRESYNAPTIC NICOTINIC ACETYLCHOLINE RECEPTORS | Genes involved in Presynaptic nicotinic acetylcholine receptors |
| 0.1 | 1.2 | REACTOME IL 6 SIGNALING | Genes involved in Interleukin-6 signaling |
| 0.1 | 4.4 | REACTOME PKA MEDIATED PHOSPHORYLATION OF CREB | Genes involved in PKA-mediated phosphorylation of CREB |
| 0.1 | 0.9 | REACTOME SYNTHESIS SECRETION AND INACTIVATION OF GIP | Genes involved in Synthesis, Secretion, and Inactivation of Glucose-dependent Insulinotropic Polypeptide (GIP) |
| 0.1 | 1.3 | REACTOME CALNEXIN CALRETICULIN CYCLE | Genes involved in Calnexin/calreticulin cycle |
| 0.1 | 5.4 | REACTOME GABA SYNTHESIS RELEASE REUPTAKE AND DEGRADATION | Genes involved in GABA synthesis, release, reuptake and degradation |
| 0.1 | 8.0 | REACTOME BMAL1 CLOCK NPAS2 ACTIVATES CIRCADIAN EXPRESSION | Genes involved in BMAL1:CLOCK/NPAS2 Activates Circadian Expression |
| 0.1 | 2.4 | REACTOME VITAMIN B5 PANTOTHENATE METABOLISM | Genes involved in Vitamin B5 (pantothenate) metabolism |
| 0.1 | 4.8 | REACTOME ACTIVATED AMPK STIMULATES FATTY ACID OXIDATION IN MUSCLE | Genes involved in Activated AMPK stimulates fatty-acid oxidation in muscle |
| 0.1 | 3.5 | REACTOME THE ROLE OF NEF IN HIV1 REPLICATION AND DISEASE PATHOGENESIS | Genes involved in The role of Nef in HIV-1 replication and disease pathogenesis |
| 0.1 | 3.4 | REACTOME INSULIN SYNTHESIS AND PROCESSING | Genes involved in Insulin Synthesis and Processing |
| 0.1 | 0.9 | REACTOME ROLE OF SECOND MESSENGERS IN NETRIN1 SIGNALING | Genes involved in Role of second messengers in netrin-1 signaling |
| 0.1 | 2.7 | REACTOME RECYCLING PATHWAY OF L1 | Genes involved in Recycling pathway of L1 |
| 0.1 | 2.3 | REACTOME DESTABILIZATION OF MRNA BY TRISTETRAPROLIN TTP | Genes involved in Destabilization of mRNA by Tristetraprolin (TTP) |
| 0.1 | 1.5 | REACTOME PACKAGING OF TELOMERE ENDS | Genes involved in Packaging Of Telomere Ends |
| 0.1 | 2.1 | REACTOME G1 S SPECIFIC TRANSCRIPTION | Genes involved in G1/S-Specific Transcription |
| 0.1 | 1.9 | REACTOME PYRUVATE METABOLISM | Genes involved in Pyruvate metabolism |
| 0.1 | 2.8 | REACTOME TRAFFICKING OF GLUR2 CONTAINING AMPA RECEPTORS | Genes involved in Trafficking of GluR2-containing AMPA receptors |
| 0.1 | 2.0 | REACTOME OXYGEN DEPENDENT PROLINE HYDROXYLATION OF HYPOXIA INDUCIBLE FACTOR ALPHA | Genes involved in Oxygen-dependent Proline Hydroxylation of Hypoxia-inducible Factor Alpha |
| 0.1 | 0.7 | REACTOME NUCLEAR SIGNALING BY ERBB4 | Genes involved in Nuclear signaling by ERBB4 |
| 0.1 | 1.8 | REACTOME FANCONI ANEMIA PATHWAY | Genes involved in Fanconi Anemia pathway |
| 0.1 | 19.9 | REACTOME G ALPHA I SIGNALLING EVENTS | Genes involved in G alpha (i) signalling events |
| 0.1 | 5.9 | REACTOME GLUCOSE TRANSPORT | Genes involved in Glucose transport |
| 0.1 | 8.5 | REACTOME RESPIRATORY ELECTRON TRANSPORT ATP SYNTHESIS BY CHEMIOSMOTIC COUPLING AND HEAT PRODUCTION BY UNCOUPLING PROTEINS | Genes involved in Respiratory electron transport, ATP synthesis by chemiosmotic coupling, and heat production by uncoupling proteins. |
| 0.1 | 3.7 | REACTOME G0 AND EARLY G1 | Genes involved in G0 and Early G1 |
| 0.1 | 26.9 | REACTOME OLFACTORY SIGNALING PATHWAY | Genes involved in Olfactory Signaling Pathway |
| 0.1 | 2.6 | REACTOME N GLYCAN ANTENNAE ELONGATION | Genes involved in N-Glycan antennae elongation |
| 0.1 | 0.4 | REACTOME YAP1 AND WWTR1 TAZ STIMULATED GENE EXPRESSION | Genes involved in YAP1- and WWTR1 (TAZ)-stimulated gene expression |
| 0.1 | 1.7 | REACTOME NUCLEOTIDE LIKE PURINERGIC RECEPTORS | Genes involved in Nucleotide-like (purinergic) receptors |
| 0.1 | 0.8 | REACTOME RESOLUTION OF AP SITES VIA THE MULTIPLE NUCLEOTIDE PATCH REPLACEMENT PATHWAY | Genes involved in Resolution of AP sites via the multiple-nucleotide patch replacement pathway |
| 0.1 | 0.1 | REACTOME INTERACTIONS OF VPR WITH HOST CELLULAR PROTEINS | Genes involved in Interactions of Vpr with host cellular proteins |
| 0.1 | 2.1 | REACTOME TRAF6 MEDIATED IRF7 ACTIVATION | Genes involved in TRAF6 mediated IRF7 activation |
| 0.1 | 3.7 | REACTOME NEGATIVE REGULATORS OF RIG I MDA5 SIGNALING | Genes involved in Negative regulators of RIG-I/MDA5 signaling |
| 0.1 | 0.3 | REACTOME SHC1 EVENTS IN EGFR SIGNALING | Genes involved in SHC1 events in EGFR signaling |
| 0.1 | 0.9 | REACTOME REGULATED PROTEOLYSIS OF P75NTR | Genes involved in Regulated proteolysis of p75NTR |
| 0.1 | 3.5 | REACTOME LIGAND GATED ION CHANNEL TRANSPORT | Genes involved in Ligand-gated ion channel transport |
| 0.1 | 3.2 | REACTOME POST TRANSLATIONAL MODIFICATION SYNTHESIS OF GPI ANCHORED PROTEINS | Genes involved in Post-translational modification: synthesis of GPI-anchored proteins |
| 0.1 | 0.1 | REACTOME REMOVAL OF THE FLAP INTERMEDIATE FROM THE C STRAND | Genes involved in Removal of the Flap Intermediate from the C-strand |
| 0.1 | 1.6 | REACTOME GLYCOGEN BREAKDOWN GLYCOGENOLYSIS | Genes involved in Glycogen breakdown (glycogenolysis) |
| 0.1 | 6.5 | REACTOME NOTCH1 INTRACELLULAR DOMAIN REGULATES TRANSCRIPTION | Genes involved in NOTCH1 Intracellular Domain Regulates Transcription |
| 0.1 | 2.5 | REACTOME DOWNREGULATION OF SMAD2 3 SMAD4 TRANSCRIPTIONAL ACTIVITY | Genes involved in Downregulation of SMAD2/3:SMAD4 transcriptional activity |
| 0.1 | 0.7 | REACTOME REGULATION OF APOPTOSIS | Genes involved in Regulation of Apoptosis |
| 0.1 | 1.8 | REACTOME CYTOSOLIC SULFONATION OF SMALL MOLECULES | Genes involved in Cytosolic sulfonation of small molecules |
| 0.1 | 1.9 | REACTOME GLUCURONIDATION | Genes involved in Glucuronidation |
| 0.1 | 0.5 | REACTOME ABORTIVE ELONGATION OF HIV1 TRANSCRIPT IN THE ABSENCE OF TAT | Genes involved in Abortive elongation of HIV-1 transcript in the absence of Tat |
| 0.1 | 6.0 | REACTOME ACTIVATION OF THE MRNA UPON BINDING OF THE CAP BINDING COMPLEX AND EIFS AND SUBSEQUENT BINDING TO 43S | Genes involved in Activation of the mRNA upon binding of the cap-binding complex and eIFs, and subsequent binding to 43S |
| 0.1 | 0.1 | REACTOME ENERGY DEPENDENT REGULATION OF MTOR BY LKB1 AMPK | Genes involved in Energy dependent regulation of mTOR by LKB1-AMPK |
| 0.1 | 2.6 | REACTOME REGULATORY RNA PATHWAYS | Genes involved in Regulatory RNA pathways |
| 0.1 | 5.2 | REACTOME TRIGLYCERIDE BIOSYNTHESIS | Genes involved in Triglyceride Biosynthesis |
| 0.1 | 2.7 | REACTOME G1 PHASE | Genes involved in G1 Phase |
| 0.1 | 7.9 | REACTOME G ALPHA1213 SIGNALLING EVENTS | Genes involved in G alpha (12/13) signalling events |
| 0.1 | 2.1 | REACTOME CONVERSION FROM APC C CDC20 TO APC C CDH1 IN LATE ANAPHASE | Genes involved in Conversion from APC/C:Cdc20 to APC/C:Cdh1 in late anaphase |
| 0.1 | 3.7 | REACTOME GLUCONEOGENESIS | Genes involved in Gluconeogenesis |
| 0.1 | 2.1 | REACTOME AMYLOIDS | Genes involved in Amyloids |
| 0.1 | 0.8 | REACTOME RNA POL I TRANSCRIPTION TERMINATION | Genes involved in RNA Polymerase I Transcription Termination |
| 0.1 | 0.7 | REACTOME SYNTHESIS OF BILE ACIDS AND BILE SALTS VIA 24 HYDROXYCHOLESTEROL | Genes involved in Synthesis of bile acids and bile salts via 24-hydroxycholesterol |
| 0.1 | 0.3 | REACTOME APC C CDH1 MEDIATED DEGRADATION OF CDC20 AND OTHER APC C CDH1 TARGETED PROTEINS IN LATE MITOSIS EARLY G1 | Genes involved in APC/C:Cdh1 mediated degradation of Cdc20 and other APC/C:Cdh1 targeted proteins in late mitosis/early G1 |
| 0.1 | 1.3 | REACTOME RAP1 SIGNALLING | Genes involved in Rap1 signalling |
| 0.0 | 1.2 | REACTOME SIGNALING BY ERBB2 | Genes involved in Signaling by ERBB2 |
| 0.0 | 2.2 | REACTOME DEFENSINS | Genes involved in Defensins |
| 0.0 | 1.6 | REACTOME INTRINSIC PATHWAY FOR APOPTOSIS | Genes involved in Intrinsic Pathway for Apoptosis |
| 0.0 | 1.1 | REACTOME ABCA TRANSPORTERS IN LIPID HOMEOSTASIS | Genes involved in ABCA transporters in lipid homeostasis |
| 0.0 | 0.3 | REACTOME CYCLIN E ASSOCIATED EVENTS DURING G1 S TRANSITION | Genes involved in Cyclin E associated events during G1/S transition |
| 0.0 | 6.2 | REACTOME FACTORS INVOLVED IN MEGAKARYOCYTE DEVELOPMENT AND PLATELET PRODUCTION | Genes involved in Factors involved in megakaryocyte development and platelet production |
| 0.0 | 1.1 | REACTOME GROWTH HORMONE RECEPTOR SIGNALING | Genes involved in Growth hormone receptor signaling |
| 0.0 | 0.9 | REACTOME TANDEM PORE DOMAIN POTASSIUM CHANNELS | Genes involved in Tandem pore domain potassium channels |
| 0.0 | 0.4 | REACTOME CDC6 ASSOCIATION WITH THE ORC ORIGIN COMPLEX | Genes involved in CDC6 association with the ORC:origin complex |
| 0.0 | 0.4 | REACTOME MEMBRANE BINDING AND TARGETTING OF GAG PROTEINS | Genes involved in Membrane binding and targetting of GAG proteins |
| 0.0 | 0.4 | REACTOME SIGNALING BY CONSTITUTIVELY ACTIVE EGFR | Genes involved in Signaling by constitutively active EGFR |
| 0.0 | 1.7 | REACTOME ANTIVIRAL MECHANISM BY IFN STIMULATED GENES | Genes involved in Antiviral mechanism by IFN-stimulated genes |
| 0.0 | 0.3 | REACTOME APOPTOSIS INDUCED DNA FRAGMENTATION | Genes involved in Apoptosis induced DNA fragmentation |
| 0.0 | 0.2 | REACTOME ACETYLCHOLINE BINDING AND DOWNSTREAM EVENTS | Genes involved in Acetylcholine Binding And Downstream Events |
| 0.0 | 2.6 | REACTOME METABOLISM OF VITAMINS AND COFACTORS | Genes involved in Metabolism of vitamins and cofactors |
| 0.0 | 0.1 | REACTOME SPRY REGULATION OF FGF SIGNALING | Genes involved in Spry regulation of FGF signaling |
| 0.0 | 1.3 | REACTOME POST CHAPERONIN TUBULIN FOLDING PATHWAY | Genes involved in Post-chaperonin tubulin folding pathway |
| 0.0 | 0.8 | REACTOME SIGNALING BY THE B CELL RECEPTOR BCR | Genes involved in Signaling by the B Cell Receptor (BCR) |
| 0.0 | 0.8 | REACTOME FACILITATIVE NA INDEPENDENT GLUCOSE TRANSPORTERS | Genes involved in Facilitative Na+-independent glucose transporters |
| 0.0 | 0.4 | REACTOME PURINE CATABOLISM | Genes involved in Purine catabolism |
| 0.0 | 0.6 | REACTOME SYNTHESIS SECRETION AND DEACYLATION OF GHRELIN | Genes involved in Synthesis, Secretion, and Deacylation of Ghrelin |
| 0.0 | 0.2 | REACTOME RNA POL I PROMOTER OPENING | Genes involved in RNA Polymerase I Promoter Opening |
| 0.0 | 1.0 | REACTOME NEPHRIN INTERACTIONS | Genes involved in Nephrin interactions |
| 0.0 | 0.6 | REACTOME SIGNALING BY FGFR1 FUSION MUTANTS | Genes involved in Signaling by FGFR1 fusion mutants |
| 0.0 | 0.8 | REACTOME CASPASE MEDIATED CLEAVAGE OF CYTOSKELETAL PROTEINS | Genes involved in Caspase-mediated cleavage of cytoskeletal proteins |
| 0.0 | 0.7 | REACTOME MRNA SPLICING MINOR PATHWAY | Genes involved in mRNA Splicing - Minor Pathway |
| 0.0 | 1.1 | REACTOME ACTIVATION OF ATR IN RESPONSE TO REPLICATION STRESS | Genes involved in Activation of ATR in response to replication stress |
| 0.0 | 5.5 | REACTOME ANTIGEN PROCESSING UBIQUITINATION PROTEASOME DEGRADATION | Genes involved in Antigen processing: Ubiquitination & Proteasome degradation |
| 0.0 | 1.7 | REACTOME MYOGENESIS | Genes involved in Myogenesis |
| 0.0 | 0.9 | REACTOME INTERFERON SIGNALING | Genes involved in Interferon Signaling |
| 0.0 | 0.3 | REACTOME SYNTHESIS OF PIPS AT THE EARLY ENDOSOME MEMBRANE | Genes involved in Synthesis of PIPs at the early endosome membrane |
| 0.0 | 4.3 | REACTOME SIGNALING BY RHO GTPASES | Genes involved in Signaling by Rho GTPases |
| 0.0 | 2.6 | REACTOME MITOTIC PROMETAPHASE | Genes involved in Mitotic Prometaphase |
| 0.0 | 2.7 | REACTOME SRP DEPENDENT COTRANSLATIONAL PROTEIN TARGETING TO MEMBRANE | Genes involved in SRP-dependent cotranslational protein targeting to membrane |
| 0.0 | 0.3 | REACTOME EXTENSION OF TELOMERES | Genes involved in Extension of Telomeres |
| 0.0 | 1.5 | REACTOME STRIATED MUSCLE CONTRACTION | Genes involved in Striated Muscle Contraction |
| 0.0 | 0.2 | REACTOME CHONDROITIN SULFATE DERMATAN SULFATE METABOLISM | Genes involved in Chondroitin sulfate/dermatan sulfate metabolism |
| 0.0 | 1.4 | REACTOME GOLGI ASSOCIATED VESICLE BIOGENESIS | Genes involved in Golgi Associated Vesicle Biogenesis |
| 0.0 | 1.3 | REACTOME UNFOLDED PROTEIN RESPONSE | Genes involved in Unfolded Protein Response |
| 0.0 | 0.4 | REACTOME MRNA DECAY BY 5 TO 3 EXORIBONUCLEASE | Genes involved in mRNA Decay by 5' to 3' Exoribonuclease |
| 0.0 | 0.4 | REACTOME SLBP DEPENDENT PROCESSING OF REPLICATION DEPENDENT HISTONE PRE MRNAS | Genes involved in SLBP Dependent Processing of Replication-Dependent Histone Pre-mRNAs |
| 0.0 | 2.9 | REACTOME G ALPHA S SIGNALLING EVENTS | Genes involved in G alpha (s) signalling events |
| 0.0 | 1.4 | REACTOME DNA REPAIR | Genes involved in DNA Repair |
| 0.0 | 0.5 | REACTOME NA CL DEPENDENT NEUROTRANSMITTER TRANSPORTERS | Genes involved in Na+/Cl- dependent neurotransmitter transporters |
| 0.0 | 0.2 | REACTOME TGF BETA RECEPTOR SIGNALING IN EMT EPITHELIAL TO MESENCHYMAL TRANSITION | Genes involved in TGF-beta receptor signaling in EMT (epithelial to mesenchymal transition) |
| 0.0 | 0.1 | REACTOME PLATELET AGGREGATION PLUG FORMATION | Genes involved in Platelet Aggregation (Plug Formation) |
| 0.0 | 0.5 | REACTOME ADHERENS JUNCTIONS INTERACTIONS | Genes involved in Adherens junctions interactions |
| 0.0 | 0.1 | REACTOME G PROTEIN ACTIVATION | Genes involved in G-protein activation |
| 0.0 | 0.2 | REACTOME PI METABOLISM | Genes involved in PI Metabolism |
| 0.0 | 0.1 | REACTOME PRE NOTCH EXPRESSION AND PROCESSING | Genes involved in Pre-NOTCH Expression and Processing |
| 0.0 | 0.1 | REACTOME REGULATION OF BETA CELL DEVELOPMENT | Genes involved in Regulation of beta-cell development |
| 0.0 | 0.3 | REACTOME PROTEOLYTIC CLEAVAGE OF SNARE COMPLEX PROTEINS | Genes involved in Proteolytic cleavage of SNARE complex proteins |
| 0.0 | 0.3 | REACTOME MITOCHONDRIAL TRNA AMINOACYLATION | Genes involved in Mitochondrial tRNA aminoacylation |
| 0.0 | 0.9 | REACTOME CELL SURFACE INTERACTIONS AT THE VASCULAR WALL | Genes involved in Cell surface interactions at the vascular wall |