Project
Illumina Body Map 2 (GSE30611)
Navigation
Downloads
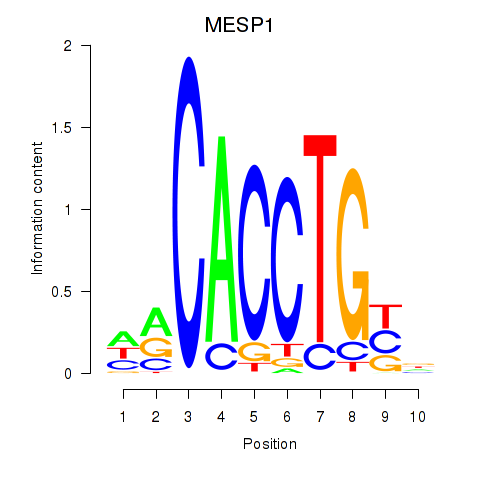
Results for MESP1
Z-value: 1.45
Motif logo
Transcription factors associated with MESP1
| Gene Symbol | Gene ID | Gene Info |
|---|---|---|
|
MESP1
|
ENSG00000166823.5 | mesoderm posterior bHLH transcription factor 1 |
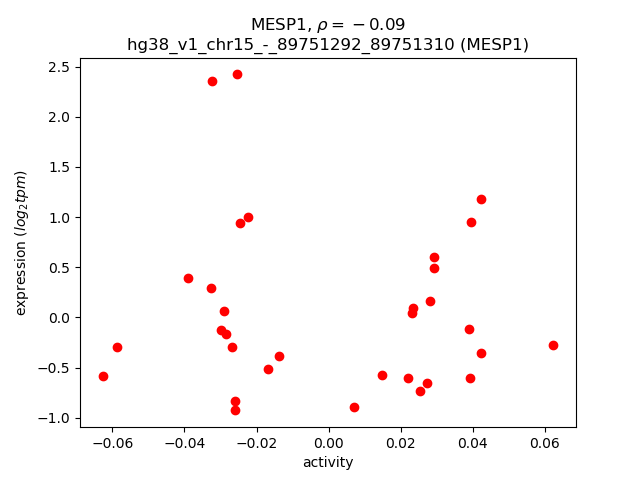
Activity-expression correlation:
| Gene | Promoter | Pearson corr. coef. | P-value | Plot |
|---|---|---|---|---|
| MESP1 | hg38_v1_chr15_-_89751292_89751310 | -0.09 | 6.3e-01 | Click! |
Activity profile of MESP1 motif
Sorted Z-values of MESP1 motif
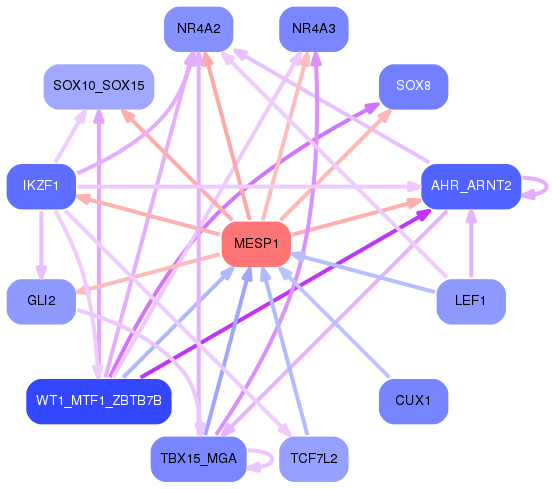
Network of associatons between targets according to the STRING database.

First level regulatory network of MESP1
Gene Ontology Analysis
Gene overrepresentation in biological process category:
| Log-likelihood per target | Total log-likelihood | Term | Description |
|---|---|---|---|
| 0.5 | 2.7 | GO:2001274 | negative regulation of glucose import in response to insulin stimulus(GO:2001274) |
| 0.5 | 1.5 | GO:0006589 | octopamine biosynthetic process(GO:0006589) octopamine metabolic process(GO:0046333) |
| 0.5 | 1.4 | GO:0003064 | regulation of heart rate by hormone(GO:0003064) negative regulation of potassium ion export(GO:1902303) |
| 0.5 | 2.3 | GO:0035962 | response to interleukin-13(GO:0035962) |
| 0.4 | 3.0 | GO:0045079 | negative regulation of chemokine biosynthetic process(GO:0045079) |
| 0.4 | 1.7 | GO:0045065 | cytotoxic T cell differentiation(GO:0045065) |
| 0.4 | 1.6 | GO:0021538 | epithalamus development(GO:0021538) habenula development(GO:0021986) |
| 0.4 | 1.5 | GO:0048627 | myoblast development(GO:0048627) |
| 0.4 | 2.2 | GO:0006546 | glycine catabolic process(GO:0006546) glycine decarboxylation via glycine cleavage system(GO:0019464) |
| 0.4 | 1.8 | GO:1903413 | cellular response to bile acid(GO:1903413) |
| 0.4 | 1.1 | GO:2000502 | negative regulation of natural killer cell chemotaxis(GO:2000502) |
| 0.3 | 2.4 | GO:0032485 | Ral protein signal transduction(GO:0032484) regulation of Ral protein signal transduction(GO:0032485) |
| 0.3 | 0.9 | GO:1990764 | regulation of myofibroblast contraction(GO:1904328) myofibroblast contraction(GO:1990764) |
| 0.3 | 0.9 | GO:0072034 | renal vesicle induction(GO:0072034) |
| 0.3 | 3.9 | GO:0051581 | negative regulation of neurotransmitter uptake(GO:0051581) regulation of serotonin uptake(GO:0051611) negative regulation of serotonin uptake(GO:0051612) |
| 0.3 | 1.5 | GO:0002913 | positive regulation of T cell anergy(GO:0002669) positive regulation of lymphocyte anergy(GO:0002913) |
| 0.3 | 0.9 | GO:0090273 | regulation of somatostatin secretion(GO:0090273) positive regulation of somatostatin secretion(GO:0090274) |
| 0.3 | 0.9 | GO:0060739 | mesenchymal-epithelial cell signaling involved in prostate gland development(GO:0060739) |
| 0.3 | 0.8 | GO:0070295 | renal water absorption(GO:0070295) |
| 0.3 | 1.0 | GO:1903892 | negative regulation of ATF6-mediated unfolded protein response(GO:1903892) |
| 0.3 | 1.3 | GO:0046878 | positive regulation of saliva secretion(GO:0046878) |
| 0.3 | 22.4 | GO:0006910 | phagocytosis, recognition(GO:0006910) |
| 0.3 | 1.0 | GO:0002337 | B-1a B cell differentiation(GO:0002337) |
| 0.2 | 2.2 | GO:0007197 | adenylate cyclase-inhibiting G-protein coupled acetylcholine receptor signaling pathway(GO:0007197) |
| 0.2 | 0.7 | GO:0030327 | prenylated protein catabolic process(GO:0030327) |
| 0.2 | 0.7 | GO:0002372 | myeloid dendritic cell cytokine production(GO:0002372) |
| 0.2 | 3.3 | GO:1900623 | regulation of monocyte aggregation(GO:1900623) positive regulation of monocyte aggregation(GO:1900625) |
| 0.2 | 1.4 | GO:0060800 | regulation of cell differentiation involved in embryonic placenta development(GO:0060800) |
| 0.2 | 3.8 | GO:0070779 | D-aspartate transport(GO:0070777) D-aspartate import(GO:0070779) |
| 0.2 | 1.6 | GO:0048050 | post-embryonic eye morphogenesis(GO:0048050) |
| 0.2 | 1.3 | GO:0071874 | microglia differentiation(GO:0014004) microglia development(GO:0014005) cellular response to norepinephrine stimulus(GO:0071874) |
| 0.2 | 1.6 | GO:2000860 | positive regulation of mineralocorticoid secretion(GO:2000857) positive regulation of aldosterone secretion(GO:2000860) |
| 0.2 | 2.9 | GO:0051388 | positive regulation of neurotrophin TRK receptor signaling pathway(GO:0051388) |
| 0.2 | 0.7 | GO:0070563 | negative regulation of vitamin D receptor signaling pathway(GO:0070563) |
| 0.2 | 0.6 | GO:0060901 | regulation of monophenol monooxygenase activity(GO:0032771) positive regulation of monophenol monooxygenase activity(GO:0032773) negative regulation of catagen(GO:0051796) regulation of hair cycle by canonical Wnt signaling pathway(GO:0060901) positive regulation of melanosome transport(GO:1902910) |
| 0.2 | 1.7 | GO:0021592 | fourth ventricle development(GO:0021592) |
| 0.2 | 3.1 | GO:0060385 | axonogenesis involved in innervation(GO:0060385) |
| 0.2 | 0.8 | GO:0048749 | compound eye development(GO:0048749) |
| 0.2 | 0.6 | GO:0032796 | uropod organization(GO:0032796) |
| 0.2 | 1.4 | GO:0060481 | lobar bronchus epithelium development(GO:0060481) |
| 0.2 | 1.6 | GO:0071109 | superior temporal gyrus development(GO:0071109) |
| 0.2 | 0.8 | GO:1904616 | regulation of actin filament binding(GO:1904529) regulation of actin binding(GO:1904616) |
| 0.2 | 0.4 | GO:1901491 | negative regulation of lymphangiogenesis(GO:1901491) |
| 0.2 | 0.7 | GO:0040040 | thermosensory behavior(GO:0040040) |
| 0.2 | 2.4 | GO:0032286 | central nervous system myelin maintenance(GO:0032286) |
| 0.2 | 2.1 | GO:0046959 | habituation(GO:0046959) |
| 0.2 | 0.9 | GO:0048496 | adherens junction maintenance(GO:0034334) maintenance of organ identity(GO:0048496) |
| 0.2 | 0.7 | GO:1902256 | apoptotic process involved in outflow tract morphogenesis(GO:0003275) regulation of apoptotic process involved in outflow tract morphogenesis(GO:1902256) |
| 0.2 | 1.9 | GO:0036371 | protein localization to T-tubule(GO:0036371) |
| 0.2 | 0.6 | GO:1902683 | regulation of receptor localization to synapse(GO:1902683) |
| 0.2 | 2.2 | GO:0016191 | synaptic vesicle uncoating(GO:0016191) |
| 0.2 | 0.8 | GO:0032849 | positive regulation of cellular pH reduction(GO:0032849) |
| 0.2 | 0.6 | GO:0002541 | activation of plasma proteins involved in acute inflammatory response(GO:0002541) |
| 0.2 | 1.4 | GO:0043314 | negative regulation of neutrophil degranulation(GO:0043314) |
| 0.2 | 0.6 | GO:0021965 | spinal cord ventral commissure morphogenesis(GO:0021965) |
| 0.1 | 0.7 | GO:0051758 | homologous chromosome movement towards spindle pole involved in homologous chromosome segregation(GO:0051758) |
| 0.1 | 0.7 | GO:1900194 | negative regulation of oocyte maturation(GO:1900194) |
| 0.1 | 1.9 | GO:0098887 | neurotransmitter receptor transport, endosome to postsynaptic membrane(GO:0098887) |
| 0.1 | 0.6 | GO:0060596 | mammary placode formation(GO:0060596) |
| 0.1 | 0.4 | GO:0046379 | extracellular polysaccharide biosynthetic process(GO:0045226) extracellular polysaccharide metabolic process(GO:0046379) |
| 0.1 | 3.9 | GO:0070262 | peptidyl-serine dephosphorylation(GO:0070262) |
| 0.1 | 0.7 | GO:0007206 | phospholipase C-activating G-protein coupled glutamate receptor signaling pathway(GO:0007206) |
| 0.1 | 4.0 | GO:2001135 | regulation of endocytic recycling(GO:2001135) |
| 0.1 | 15.3 | GO:0006958 | complement activation, classical pathway(GO:0006958) |
| 0.1 | 1.3 | GO:0060373 | regulation of ventricular cardiac muscle cell membrane depolarization(GO:0060373) |
| 0.1 | 1.1 | GO:0019236 | response to pheromone(GO:0019236) |
| 0.1 | 2.1 | GO:0048711 | positive regulation of astrocyte differentiation(GO:0048711) |
| 0.1 | 0.4 | GO:0015882 | L-ascorbic acid transport(GO:0015882) molecular hydrogen transport(GO:0015993) transepithelial L-ascorbic acid transport(GO:0070904) |
| 0.1 | 0.4 | GO:1902630 | regulation of membrane hyperpolarization(GO:1902630) |
| 0.1 | 0.8 | GO:2000501 | regulation of natural killer cell chemotaxis(GO:2000501) positive regulation of natural killer cell chemotaxis(GO:2000503) |
| 0.1 | 1.0 | GO:0050916 | sensory perception of sweet taste(GO:0050916) |
| 0.1 | 0.7 | GO:0032425 | positive regulation of mismatch repair(GO:0032425) |
| 0.1 | 1.6 | GO:0072592 | oxygen metabolic process(GO:0072592) |
| 0.1 | 0.7 | GO:1905000 | regulation of membrane repolarization during atrial cardiac muscle cell action potential(GO:1905000) |
| 0.1 | 0.5 | GO:0090299 | regulation of neural crest formation(GO:0090299) negative regulation of neural crest formation(GO:0090301) negative regulation of fibroblast growth factor receptor signaling pathway involved in neural plate anterior/posterior pattern formation(GO:2000314) |
| 0.1 | 2.0 | GO:0070327 | thyroid hormone transport(GO:0070327) |
| 0.1 | 0.1 | GO:0060738 | epithelial-mesenchymal signaling involved in prostate gland development(GO:0060738) |
| 0.1 | 2.2 | GO:0015871 | choline transport(GO:0015871) |
| 0.1 | 0.4 | GO:0061743 | motor learning(GO:0061743) |
| 0.1 | 3.1 | GO:0051014 | actin filament severing(GO:0051014) |
| 0.1 | 0.5 | GO:0035377 | transepithelial water transport(GO:0035377) positive regulation of cyclic nucleotide-gated ion channel activity(GO:1902161) |
| 0.1 | 1.9 | GO:0032074 | negative regulation of nuclease activity(GO:0032074) |
| 0.1 | 1.5 | GO:1900113 | negative regulation of histone H3-K9 trimethylation(GO:1900113) |
| 0.1 | 0.6 | GO:0035645 | enteric smooth muscle cell differentiation(GO:0035645) |
| 0.1 | 1.2 | GO:1902669 | positive regulation of axon guidance(GO:1902669) |
| 0.1 | 2.6 | GO:2001256 | regulation of store-operated calcium entry(GO:2001256) |
| 0.1 | 0.5 | GO:0071386 | cellular response to corticosterone stimulus(GO:0071386) |
| 0.1 | 0.6 | GO:0001575 | globoside metabolic process(GO:0001575) |
| 0.1 | 0.7 | GO:1903061 | positive regulation of protein lipidation(GO:1903061) |
| 0.1 | 2.1 | GO:0090050 | positive regulation of cell migration involved in sprouting angiogenesis(GO:0090050) |
| 0.1 | 1.4 | GO:1903142 | positive regulation of endothelial cell development(GO:1901552) positive regulation of establishment of endothelial barrier(GO:1903142) |
| 0.1 | 0.5 | GO:0038169 | somatostatin receptor signaling pathway(GO:0038169) somatostatin signaling pathway(GO:0038170) |
| 0.1 | 0.3 | GO:0038193 | thromboxane A2 signaling pathway(GO:0038193) |
| 0.1 | 1.3 | GO:0023041 | neuronal signal transduction(GO:0023041) |
| 0.1 | 0.4 | GO:2000777 | endomitotic cell cycle(GO:0007113) positive regulation of proteasomal ubiquitin-dependent protein catabolic process involved in cellular response to hypoxia(GO:2000777) |
| 0.1 | 0.7 | GO:0072156 | distal tubule morphogenesis(GO:0072156) |
| 0.1 | 2.4 | GO:0071786 | endoplasmic reticulum tubular network organization(GO:0071786) |
| 0.1 | 0.3 | GO:0021793 | chemorepulsion of branchiomotor axon(GO:0021793) |
| 0.1 | 0.6 | GO:1903296 | regulation of glutamate secretion, neurotransmission(GO:1903294) positive regulation of glutamate secretion, neurotransmission(GO:1903296) |
| 0.1 | 1.2 | GO:0045084 | positive regulation of interleukin-12 biosynthetic process(GO:0045084) |
| 0.1 | 0.5 | GO:0090370 | negative regulation of cholesterol efflux(GO:0090370) |
| 0.1 | 1.1 | GO:0098914 | membrane repolarization during atrial cardiac muscle cell action potential(GO:0098914) |
| 0.1 | 1.8 | GO:0070424 | regulation of nucleotide-binding oligomerization domain containing signaling pathway(GO:0070424) |
| 0.1 | 1.6 | GO:0060158 | phospholipase C-activating dopamine receptor signaling pathway(GO:0060158) |
| 0.1 | 0.6 | GO:0003199 | endocardial cushion to mesenchymal transition involved in heart valve formation(GO:0003199) |
| 0.1 | 0.4 | GO:0061092 | regulation of phospholipid translocation(GO:0061091) positive regulation of phospholipid translocation(GO:0061092) |
| 0.1 | 0.5 | GO:2000691 | regulation of cardiac muscle cell myoblast differentiation(GO:2000690) negative regulation of cardiac muscle cell myoblast differentiation(GO:2000691) |
| 0.1 | 0.3 | GO:1904897 | regulation of hepatic stellate cell proliferation(GO:1904897) positive regulation of hepatic stellate cell proliferation(GO:1904899) hepatic stellate cell proliferation(GO:1990922) |
| 0.1 | 1.8 | GO:0090177 | establishment of planar polarity involved in neural tube closure(GO:0090177) |
| 0.1 | 0.4 | GO:0035633 | maintenance of blood-brain barrier(GO:0035633) |
| 0.1 | 0.5 | GO:0048105 | establishment of body hair or bristle planar orientation(GO:0048104) establishment of body hair planar orientation(GO:0048105) |
| 0.1 | 0.9 | GO:1990034 | calcium ion export from cell(GO:1990034) |
| 0.1 | 0.4 | GO:0033563 | dorsal/ventral axon guidance(GO:0033563) |
| 0.1 | 0.9 | GO:0003402 | planar cell polarity pathway involved in axis elongation(GO:0003402) |
| 0.1 | 0.8 | GO:0030263 | apoptotic chromosome condensation(GO:0030263) |
| 0.1 | 0.7 | GO:0055011 | atrial cardiac muscle cell differentiation(GO:0055011) atrial cardiac muscle cell development(GO:0055014) |
| 0.1 | 0.4 | GO:1904428 | negative regulation of tubulin deacetylation(GO:1904428) |
| 0.1 | 0.5 | GO:0097021 | lymphocyte migration into lymphoid organs(GO:0097021) |
| 0.1 | 0.7 | GO:0046952 | ketone body catabolic process(GO:0046952) |
| 0.1 | 1.1 | GO:0098535 | de novo centriole assembly(GO:0098535) |
| 0.1 | 0.4 | GO:0003245 | cardiac muscle tissue growth involved in heart morphogenesis(GO:0003245) |
| 0.1 | 0.2 | GO:1901389 | regulation of transforming growth factor beta activation(GO:1901388) negative regulation of transforming growth factor beta activation(GO:1901389) |
| 0.1 | 1.6 | GO:0042340 | keratan sulfate catabolic process(GO:0042340) |
| 0.1 | 0.5 | GO:0044333 | Wnt signaling pathway involved in digestive tract morphogenesis(GO:0044333) |
| 0.1 | 0.4 | GO:0003366 | cell-matrix adhesion involved in ameboidal cell migration(GO:0003366) |
| 0.1 | 1.4 | GO:0016322 | neuron remodeling(GO:0016322) |
| 0.1 | 0.3 | GO:0034628 | nicotinamide nucleotide biosynthetic process from aspartate(GO:0019355) 'de novo' NAD biosynthetic process from aspartate(GO:0034628) |
| 0.1 | 0.7 | GO:1904879 | positive regulation of calcium ion transmembrane transport via high voltage-gated calcium channel(GO:1904879) |
| 0.1 | 0.5 | GO:1903936 | cellular response to sodium arsenite(GO:1903936) |
| 0.1 | 0.3 | GO:0072429 | response to intra-S DNA damage checkpoint signaling(GO:0072429) |
| 0.1 | 0.2 | GO:0070902 | mitochondrial tRNA pseudouridine synthesis(GO:0070902) |
| 0.1 | 0.1 | GO:1903412 | response to bile acid(GO:1903412) |
| 0.1 | 0.5 | GO:0015015 | heparan sulfate proteoglycan biosynthetic process, enzymatic modification(GO:0015015) |
| 0.1 | 0.4 | GO:0070370 | heat acclimation(GO:0010286) cellular heat acclimation(GO:0070370) |
| 0.1 | 1.0 | GO:0019388 | galactose catabolic process(GO:0019388) |
| 0.1 | 0.3 | GO:0097350 | neutrophil clearance(GO:0097350) |
| 0.1 | 0.2 | GO:0021558 | trochlear nerve development(GO:0021558) |
| 0.1 | 1.3 | GO:0089711 | L-glutamate transmembrane transport(GO:0089711) |
| 0.1 | 0.7 | GO:0098735 | positive regulation of the force of heart contraction(GO:0098735) |
| 0.1 | 0.2 | GO:2001287 | negative regulation of caveolin-mediated endocytosis(GO:2001287) |
| 0.1 | 0.3 | GO:1904936 | cerebral cortex GABAergic interneuron migration(GO:0021853) interneuron migration(GO:1904936) |
| 0.1 | 0.2 | GO:0019085 | early viral transcription(GO:0019085) |
| 0.1 | 0.2 | GO:0000412 | histone peptidyl-prolyl isomerization(GO:0000412) |
| 0.1 | 0.3 | GO:0008588 | release of cytoplasmic sequestered NF-kappaB(GO:0008588) |
| 0.1 | 0.6 | GO:0010724 | regulation of definitive erythrocyte differentiation(GO:0010724) |
| 0.1 | 1.8 | GO:0003334 | keratinocyte development(GO:0003334) |
| 0.1 | 0.4 | GO:0002924 | negative regulation of humoral immune response mediated by circulating immunoglobulin(GO:0002924) |
| 0.1 | 0.1 | GO:0034124 | regulation of MyD88-dependent toll-like receptor signaling pathway(GO:0034124) |
| 0.1 | 0.3 | GO:0051970 | negative regulation of transmission of nerve impulse(GO:0051970) |
| 0.1 | 1.1 | GO:0097118 | neuroligin clustering involved in postsynaptic membrane assembly(GO:0097118) |
| 0.1 | 0.6 | GO:0021633 | optic nerve structural organization(GO:0021633) |
| 0.1 | 0.4 | GO:2000771 | regulation of unidimensional cell growth(GO:0051510) negative regulation of unidimensional cell growth(GO:0051511) establishment of cell polarity regulating cell shape(GO:0071964) regulation of establishment or maintenance of cell polarity regulating cell shape(GO:2000769) positive regulation of establishment or maintenance of cell polarity regulating cell shape(GO:2000771) regulation of establishment of cell polarity regulating cell shape(GO:2000782) positive regulation of establishment of cell polarity regulating cell shape(GO:2000784) positive regulation of barbed-end actin filament capping(GO:2000814) |
| 0.1 | 0.3 | GO:1901594 | detection of temperature stimulus involved in thermoception(GO:0050960) response to capsazepine(GO:1901594) |
| 0.1 | 0.8 | GO:0070863 | positive regulation of protein exit from endoplasmic reticulum(GO:0070863) |
| 0.1 | 0.3 | GO:0032237 | activation of store-operated calcium channel activity(GO:0032237) positive regulation of store-operated calcium channel activity(GO:1901341) |
| 0.1 | 0.4 | GO:0018032 | protein amidation(GO:0018032) |
| 0.1 | 1.2 | GO:0035414 | negative regulation of catenin import into nucleus(GO:0035414) |
| 0.1 | 0.3 | GO:1900369 | negative regulation of RNA interference(GO:1900369) |
| 0.1 | 0.8 | GO:0060707 | trophoblast giant cell differentiation(GO:0060707) |
| 0.1 | 1.5 | GO:0071481 | cellular response to X-ray(GO:0071481) |
| 0.1 | 0.4 | GO:1903826 | arginine transmembrane transport(GO:1903826) |
| 0.1 | 0.8 | GO:0007258 | JUN phosphorylation(GO:0007258) |
| 0.1 | 1.9 | GO:0042753 | positive regulation of circadian rhythm(GO:0042753) |
| 0.1 | 0.1 | GO:0003162 | atrioventricular node development(GO:0003162) cardiac septum cell differentiation(GO:0003292) atrioventricular node cell differentiation(GO:0060922) cardiac pacemaker cell development(GO:0060926) atrioventricular node cell development(GO:0060928) |
| 0.1 | 0.1 | GO:0002277 | myeloid dendritic cell activation involved in immune response(GO:0002277) |
| 0.1 | 0.3 | GO:1902283 | negative regulation of primary amine oxidase activity(GO:1902283) |
| 0.1 | 0.5 | GO:2000382 | positive regulation of mesoderm development(GO:2000382) |
| 0.1 | 0.2 | GO:1902269 | positive regulation of polyamine transmembrane transport(GO:1902269) |
| 0.1 | 0.4 | GO:0032383 | regulation of intracellular lipid transport(GO:0032377) regulation of intracellular sterol transport(GO:0032380) regulation of intracellular cholesterol transport(GO:0032383) |
| 0.1 | 2.2 | GO:0008045 | motor neuron axon guidance(GO:0008045) |
| 0.1 | 0.5 | GO:0031536 | positive regulation of exit from mitosis(GO:0031536) |
| 0.1 | 1.0 | GO:0070861 | regulation of protein exit from endoplasmic reticulum(GO:0070861) |
| 0.1 | 0.7 | GO:0043117 | positive regulation of vascular permeability(GO:0043117) |
| 0.1 | 0.1 | GO:2000417 | negative regulation of eosinophil migration(GO:2000417) |
| 0.1 | 10.5 | GO:0002377 | immunoglobulin production(GO:0002377) |
| 0.1 | 5.9 | GO:0042100 | B cell proliferation(GO:0042100) |
| 0.1 | 0.2 | GO:0042748 | circadian sleep/wake cycle, non-REM sleep(GO:0042748) |
| 0.1 | 0.2 | GO:0010512 | negative regulation of phosphatidylinositol biosynthetic process(GO:0010512) |
| 0.1 | 0.6 | GO:0006477 | protein sulfation(GO:0006477) |
| 0.1 | 0.3 | GO:0001692 | histamine metabolic process(GO:0001692) |
| 0.1 | 0.7 | GO:0032020 | ISG15-protein conjugation(GO:0032020) |
| 0.1 | 0.1 | GO:0002215 | defense response to nematode(GO:0002215) |
| 0.1 | 0.4 | GO:1905049 | negative regulation of metallopeptidase activity(GO:1905049) |
| 0.1 | 1.5 | GO:0030208 | dermatan sulfate biosynthetic process(GO:0030208) |
| 0.1 | 0.2 | GO:0097032 | mitochondrial electron transport, succinate to ubiquinone(GO:0006121) respiratory chain complex II assembly(GO:0034552) mitochondrial respiratory chain complex II assembly(GO:0034553) mitochondrial respiratory chain complex II biogenesis(GO:0097032) |
| 0.0 | 0.6 | GO:0018095 | protein polyglutamylation(GO:0018095) |
| 0.0 | 1.7 | GO:0046339 | diacylglycerol metabolic process(GO:0046339) |
| 0.0 | 0.1 | GO:0050928 | negative regulation of positive chemotaxis(GO:0050928) |
| 0.0 | 0.2 | GO:1901350 | cell-cell signaling involved in cell-cell junction organization(GO:1901350) |
| 0.0 | 0.1 | GO:0007057 | spindle assembly involved in female meiosis I(GO:0007057) |
| 0.0 | 0.1 | GO:1904479 | negative regulation of intestinal absorption(GO:1904479) |
| 0.0 | 0.6 | GO:2001199 | negative regulation of dendritic cell differentiation(GO:2001199) |
| 0.0 | 0.2 | GO:1902766 | skeletal muscle satellite cell migration(GO:1902766) |
| 0.0 | 0.8 | GO:0090361 | platelet-derived growth factor production(GO:0090360) regulation of platelet-derived growth factor production(GO:0090361) |
| 0.0 | 0.6 | GO:0097688 | AMPA glutamate receptor clustering(GO:0097113) glutamate receptor clustering(GO:0097688) |
| 0.0 | 2.4 | GO:0008038 | neuron recognition(GO:0008038) |
| 0.0 | 1.2 | GO:1905144 | acetylcholine receptor signaling pathway(GO:0095500) postsynaptic signal transduction(GO:0098926) signal transduction involved in cellular response to ammonium ion(GO:1903831) response to acetylcholine(GO:1905144) cellular response to acetylcholine(GO:1905145) |
| 0.0 | 0.4 | GO:0014827 | intestine smooth muscle contraction(GO:0014827) |
| 0.0 | 1.1 | GO:2000574 | regulation of microtubule motor activity(GO:2000574) |
| 0.0 | 0.4 | GO:0097411 | hypoxia-inducible factor-1alpha signaling pathway(GO:0097411) |
| 0.0 | 0.5 | GO:2000253 | positive regulation of feeding behavior(GO:2000253) |
| 0.0 | 0.3 | GO:0060012 | synaptic transmission, glycinergic(GO:0060012) |
| 0.0 | 0.7 | GO:0007196 | adenylate cyclase-inhibiting G-protein coupled glutamate receptor signaling pathway(GO:0007196) |
| 0.0 | 0.5 | GO:0035965 | cardiolipin acyl-chain remodeling(GO:0035965) |
| 0.0 | 1.0 | GO:0016075 | rRNA catabolic process(GO:0016075) |
| 0.0 | 0.2 | GO:0031914 | negative regulation of synaptic plasticity(GO:0031914) |
| 0.0 | 0.5 | GO:2000664 | interleukin-5 secretion(GO:0072603) regulation of interleukin-5 secretion(GO:2000662) positive regulation of interleukin-5 secretion(GO:2000664) |
| 0.0 | 0.3 | GO:0038195 | urokinase plasminogen activator signaling pathway(GO:0038195) |
| 0.0 | 0.4 | GO:0014051 | gamma-aminobutyric acid secretion(GO:0014051) |
| 0.0 | 0.4 | GO:0007168 | receptor guanylyl cyclase signaling pathway(GO:0007168) |
| 0.0 | 0.2 | GO:0070829 | response to vitamin B2(GO:0033274) heterochromatin maintenance(GO:0070829) |
| 0.0 | 0.1 | GO:0036048 | protein demalonylation(GO:0036046) peptidyl-lysine demalonylation(GO:0036047) protein desuccinylation(GO:0036048) peptidyl-lysine desuccinylation(GO:0036049) protein deglutarylation(GO:0061698) peptidyl-lysine deglutarylation(GO:0061699) |
| 0.0 | 0.5 | GO:0036444 | calcium ion transmembrane import into mitochondrion(GO:0036444) |
| 0.0 | 0.2 | GO:1902961 | regulation of aspartic-type endopeptidase activity involved in amyloid precursor protein catabolic process(GO:1902959) positive regulation of aspartic-type endopeptidase activity involved in amyloid precursor protein catabolic process(GO:1902961) regulation of aspartic-type peptidase activity(GO:1905245) positive regulation of aspartic-type peptidase activity(GO:1905247) |
| 0.0 | 0.9 | GO:0021957 | corticospinal tract morphogenesis(GO:0021957) |
| 0.0 | 1.5 | GO:0006884 | cell volume homeostasis(GO:0006884) |
| 0.0 | 0.4 | GO:0070995 | NADPH oxidation(GO:0070995) |
| 0.0 | 0.2 | GO:0016185 | synaptic vesicle budding from presynaptic endocytic zone membrane(GO:0016185) |
| 0.0 | 0.6 | GO:0019367 | fatty acid elongation, saturated fatty acid(GO:0019367) fatty acid elongation, unsaturated fatty acid(GO:0019368) fatty acid elongation, monounsaturated fatty acid(GO:0034625) fatty acid elongation, polyunsaturated fatty acid(GO:0034626) |
| 0.0 | 0.5 | GO:1902083 | negative regulation of peptidyl-cysteine S-nitrosylation(GO:1902083) |
| 0.0 | 0.2 | GO:0045196 | establishment or maintenance of neuroblast polarity(GO:0045196) establishment of neuroblast polarity(GO:0045200) |
| 0.0 | 0.2 | GO:0060040 | retinal bipolar neuron differentiation(GO:0060040) |
| 0.0 | 0.5 | GO:0048251 | elastic fiber assembly(GO:0048251) |
| 0.0 | 0.3 | GO:1902416 | positive regulation of mRNA binding(GO:1902416) |
| 0.0 | 0.8 | GO:0006527 | arginine catabolic process(GO:0006527) |
| 0.0 | 0.7 | GO:0038166 | angiotensin-activated signaling pathway(GO:0038166) |
| 0.0 | 0.3 | GO:0007296 | vitellogenesis(GO:0007296) |
| 0.0 | 0.2 | GO:0019348 | dolichol metabolic process(GO:0019348) |
| 0.0 | 1.2 | GO:0034755 | iron ion transmembrane transport(GO:0034755) |
| 0.0 | 0.3 | GO:2000490 | negative regulation of hepatic stellate cell activation(GO:2000490) |
| 0.0 | 0.3 | GO:0060080 | inhibitory postsynaptic potential(GO:0060080) |
| 0.0 | 0.4 | GO:0060075 | regulation of resting membrane potential(GO:0060075) |
| 0.0 | 0.6 | GO:2000310 | regulation of N-methyl-D-aspartate selective glutamate receptor activity(GO:2000310) |
| 0.0 | 0.1 | GO:0003221 | right ventricular cardiac muscle tissue morphogenesis(GO:0003221) |
| 0.0 | 1.4 | GO:0031648 | protein destabilization(GO:0031648) |
| 0.0 | 0.6 | GO:0051988 | regulation of attachment of spindle microtubules to kinetochore(GO:0051988) |
| 0.0 | 0.3 | GO:0006701 | progesterone biosynthetic process(GO:0006701) |
| 0.0 | 1.5 | GO:0035640 | exploration behavior(GO:0035640) |
| 0.0 | 0.2 | GO:0035494 | SNARE complex disassembly(GO:0035494) |
| 0.0 | 0.1 | GO:0006272 | leading strand elongation(GO:0006272) |
| 0.0 | 2.6 | GO:0015701 | bicarbonate transport(GO:0015701) |
| 0.0 | 2.3 | GO:0046677 | response to antibiotic(GO:0046677) |
| 0.0 | 1.9 | GO:2000300 | regulation of synaptic vesicle exocytosis(GO:2000300) |
| 0.0 | 0.2 | GO:0042374 | phylloquinone metabolic process(GO:0042374) phylloquinone catabolic process(GO:0042376) quinone catabolic process(GO:1901662) |
| 0.0 | 0.2 | GO:0006432 | phenylalanyl-tRNA aminoacylation(GO:0006432) |
| 0.0 | 0.3 | GO:0046070 | dGTP metabolic process(GO:0046070) |
| 0.0 | 0.6 | GO:0042832 | defense response to protozoan(GO:0042832) |
| 0.0 | 0.4 | GO:0001780 | neutrophil homeostasis(GO:0001780) |
| 0.0 | 3.1 | GO:0045576 | mast cell activation(GO:0045576) |
| 0.0 | 0.6 | GO:0010216 | maintenance of DNA methylation(GO:0010216) |
| 0.0 | 0.4 | GO:2000311 | regulation of alpha-amino-3-hydroxy-5-methyl-4-isoxazole propionate selective glutamate receptor activity(GO:2000311) |
| 0.0 | 1.5 | GO:0031116 | positive regulation of microtubule polymerization(GO:0031116) |
| 0.0 | 0.6 | GO:0032733 | positive regulation of interleukin-10 production(GO:0032733) |
| 0.0 | 0.2 | GO:0090073 | positive regulation of protein homodimerization activity(GO:0090073) |
| 0.0 | 0.1 | GO:1904338 | regulation of dopaminergic neuron differentiation(GO:1904338) |
| 0.0 | 0.7 | GO:0032780 | negative regulation of ATPase activity(GO:0032780) |
| 0.0 | 0.2 | GO:0007354 | zygotic determination of anterior/posterior axis, embryo(GO:0007354) |
| 0.0 | 0.3 | GO:1901187 | positive regulation of transcription from RNA polymerase II promoter in response to hypoxia(GO:0061419) regulation of ephrin receptor signaling pathway(GO:1901187) positive regulation of ephrin receptor signaling pathway(GO:1901189) regulation of canonical Wnt signaling pathway involved in cardiac muscle cell fate commitment(GO:1901295) positive regulation of canonical Wnt signaling pathway involved in cardiac muscle cell fate commitment(GO:1901297) regulation of canonical Wnt signaling pathway involved in heart development(GO:1905066) positive regulation of canonical Wnt signaling pathway involved in heart development(GO:1905068) |
| 0.0 | 0.1 | GO:0007386 | compartment pattern specification(GO:0007386) |
| 0.0 | 0.4 | GO:0001731 | formation of translation preinitiation complex(GO:0001731) |
| 0.0 | 0.3 | GO:0035437 | protein retention in ER lumen(GO:0006621) maintenance of protein localization in endoplasmic reticulum(GO:0035437) |
| 0.0 | 0.2 | GO:0045054 | constitutive secretory pathway(GO:0045054) regulation of constitutive secretory pathway(GO:1903433) |
| 0.0 | 0.1 | GO:1903225 | negative regulation of endodermal cell differentiation(GO:1903225) |
| 0.0 | 0.1 | GO:1902993 | positive regulation of amyloid precursor protein catabolic process(GO:1902993) |
| 0.0 | 0.3 | GO:0051964 | negative regulation of synapse assembly(GO:0051964) |
| 0.0 | 0.6 | GO:0046855 | phosphorylated carbohydrate dephosphorylation(GO:0046838) inositol phosphate dephosphorylation(GO:0046855) |
| 0.0 | 2.7 | GO:0007602 | phototransduction(GO:0007602) |
| 0.0 | 0.1 | GO:2001268 | negative regulation of cysteine-type endopeptidase activity involved in apoptotic signaling pathway(GO:2001268) |
| 0.0 | 0.1 | GO:0060282 | positive regulation of oocyte development(GO:0060282) |
| 0.0 | 0.0 | GO:0072166 | posterior mesonephric tubule development(GO:0072166) |
| 0.0 | 0.8 | GO:0000185 | activation of MAPKKK activity(GO:0000185) |
| 0.0 | 0.1 | GO:0015734 | taurine transport(GO:0015734) |
| 0.0 | 0.5 | GO:2000766 | negative regulation of cytoplasmic translation(GO:2000766) |
| 0.0 | 0.3 | GO:0097012 | cellular response to granulocyte macrophage colony-stimulating factor stimulus(GO:0097011) response to granulocyte macrophage colony-stimulating factor(GO:0097012) |
| 0.0 | 0.1 | GO:2001226 | negative regulation of chloride transport(GO:2001226) |
| 0.0 | 0.4 | GO:0035878 | nail development(GO:0035878) |
| 0.0 | 0.1 | GO:1902513 | regulation of organelle transport along microtubule(GO:1902513) |
| 0.0 | 0.9 | GO:0001573 | ganglioside metabolic process(GO:0001573) |
| 0.0 | 0.5 | GO:1904778 | regulation of protein localization to cell cortex(GO:1904776) positive regulation of protein localization to cell cortex(GO:1904778) |
| 0.0 | 0.2 | GO:1900383 | regulation of synaptic plasticity by receptor localization to synapse(GO:1900383) |
| 0.0 | 0.4 | GO:0002315 | marginal zone B cell differentiation(GO:0002315) |
| 0.0 | 0.3 | GO:0034244 | negative regulation of transcription elongation from RNA polymerase II promoter(GO:0034244) |
| 0.0 | 0.4 | GO:0014722 | regulation of skeletal muscle contraction by calcium ion signaling(GO:0014722) |
| 0.0 | 0.2 | GO:0050951 | sensory perception of temperature stimulus(GO:0050951) |
| 0.0 | 0.1 | GO:0070358 | actin polymerization-dependent cell motility(GO:0070358) |
| 0.0 | 0.2 | GO:2000348 | regulation of CD40 signaling pathway(GO:2000348) |
| 0.0 | 0.5 | GO:0007638 | mechanosensory behavior(GO:0007638) |
| 0.0 | 3.6 | GO:0008277 | regulation of G-protein coupled receptor protein signaling pathway(GO:0008277) |
| 0.0 | 0.6 | GO:0042744 | hydrogen peroxide catabolic process(GO:0042744) |
| 0.0 | 0.3 | GO:0010459 | negative regulation of heart rate(GO:0010459) |
| 0.0 | 0.3 | GO:0002862 | negative regulation of inflammatory response to antigenic stimulus(GO:0002862) |
| 0.0 | 0.1 | GO:1990086 | lens fiber cell apoptotic process(GO:1990086) |
| 0.0 | 0.3 | GO:0035269 | protein O-linked mannosylation(GO:0035269) |
| 0.0 | 0.1 | GO:1900220 | semaphorin-plexin signaling pathway involved in bone trabecula morphogenesis(GO:1900220) |
| 0.0 | 0.1 | GO:0060068 | vagina development(GO:0060068) |
| 0.0 | 0.3 | GO:0070197 | meiotic telomere tethering at nuclear periphery(GO:0044821) meiotic attachment of telomere to nuclear envelope(GO:0070197) chromosome attachment to the nuclear envelope(GO:0097240) |
| 0.0 | 0.6 | GO:0032060 | bleb assembly(GO:0032060) |
| 0.0 | 0.3 | GO:0043383 | negative T cell selection(GO:0043383) |
| 0.0 | 0.3 | GO:0019852 | L-ascorbic acid metabolic process(GO:0019852) |
| 0.0 | 0.1 | GO:1905165 | regulation of lysosomal protein catabolic process(GO:1905165) |
| 0.0 | 1.9 | GO:0006968 | cellular defense response(GO:0006968) |
| 0.0 | 0.3 | GO:0071985 | multivesicular body sorting pathway(GO:0071985) |
| 0.0 | 0.1 | GO:0003430 | growth plate cartilage chondrocyte growth(GO:0003430) |
| 0.0 | 0.1 | GO:0031548 | regulation of brain-derived neurotrophic factor receptor signaling pathway(GO:0031548) |
| 0.0 | 0.2 | GO:0010457 | centriole-centriole cohesion(GO:0010457) |
| 0.0 | 0.1 | GO:0017186 | peptidyl-pyroglutamic acid biosynthetic process, using glutaminyl-peptide cyclotransferase(GO:0017186) |
| 0.0 | 0.6 | GO:0099517 | anterograde synaptic vesicle transport(GO:0048490) synaptic vesicle cytoskeletal transport(GO:0099514) synaptic vesicle transport along microtubule(GO:0099517) |
| 0.0 | 0.2 | GO:0097396 | response to interleukin-17(GO:0097396) cellular response to interleukin-17(GO:0097398) |
| 0.0 | 0.4 | GO:0046856 | phosphatidylinositol dephosphorylation(GO:0046856) |
| 0.0 | 0.7 | GO:0051602 | response to electrical stimulus(GO:0051602) |
| 0.0 | 0.4 | GO:0006972 | hyperosmotic response(GO:0006972) |
| 0.0 | 0.8 | GO:0003197 | endocardial cushion development(GO:0003197) |
| 0.0 | 0.2 | GO:0007619 | courtship behavior(GO:0007619) female courtship behavior(GO:0008050) |
| 0.0 | 1.9 | GO:0007218 | neuropeptide signaling pathway(GO:0007218) |
| 0.0 | 0.8 | GO:0007143 | female meiotic division(GO:0007143) |
| 0.0 | 0.1 | GO:1990592 | protein polyufmylation(GO:1990564) protein K69-linked ufmylation(GO:1990592) |
| 0.0 | 0.2 | GO:0018206 | peptidyl-methionine modification(GO:0018206) |
| 0.0 | 0.3 | GO:0002026 | regulation of the force of heart contraction(GO:0002026) |
| 0.0 | 0.1 | GO:0071415 | cellular response to purine-containing compound(GO:0071415) |
| 0.0 | 0.3 | GO:0036159 | inner dynein arm assembly(GO:0036159) |
| 0.0 | 0.3 | GO:0051601 | exocyst localization(GO:0051601) |
| 0.0 | 0.1 | GO:0009407 | toxin catabolic process(GO:0009407) mycotoxin catabolic process(GO:0043387) aflatoxin catabolic process(GO:0046223) secondary metabolite catabolic process(GO:0090487) organic heteropentacyclic compound catabolic process(GO:1901377) regulation of glutathione biosynthetic process(GO:1903786) positive regulation of glutathione biosynthetic process(GO:1903788) |
| 0.0 | 0.3 | GO:0043457 | regulation of cellular respiration(GO:0043457) |
| 0.0 | 0.1 | GO:0021554 | optic nerve development(GO:0021554) |
| 0.0 | 0.3 | GO:0006833 | water transport(GO:0006833) |
| 0.0 | 0.7 | GO:0035116 | embryonic hindlimb morphogenesis(GO:0035116) |
| 0.0 | 0.7 | GO:0010644 | cell communication by electrical coupling(GO:0010644) |
| 0.0 | 0.6 | GO:0008210 | estrogen metabolic process(GO:0008210) |
| 0.0 | 0.1 | GO:0045602 | negative regulation of endothelial cell differentiation(GO:0045602) |
| 0.0 | 0.4 | GO:0008053 | mitochondrial fusion(GO:0008053) |
| 0.0 | 0.6 | GO:0010862 | positive regulation of pathway-restricted SMAD protein phosphorylation(GO:0010862) |
| 0.0 | 0.1 | GO:0048254 | snoRNA localization(GO:0048254) |
| 0.0 | 0.4 | GO:0033119 | negative regulation of RNA splicing(GO:0033119) |
| 0.0 | 0.4 | GO:0032418 | lysosome localization(GO:0032418) |
| 0.0 | 0.6 | GO:0000002 | mitochondrial genome maintenance(GO:0000002) |
| 0.0 | 0.2 | GO:0090331 | negative regulation of platelet aggregation(GO:0090331) |
| 0.0 | 0.2 | GO:0046839 | phospholipid dephosphorylation(GO:0046839) |
| 0.0 | 1.2 | GO:0071277 | cellular response to calcium ion(GO:0071277) |
| 0.0 | 0.4 | GO:0000729 | DNA double-strand break processing(GO:0000729) |
| 0.0 | 0.4 | GO:0016339 | calcium-dependent cell-cell adhesion via plasma membrane cell adhesion molecules(GO:0016339) |
| 0.0 | 0.7 | GO:0006376 | mRNA splice site selection(GO:0006376) |
| 0.0 | 1.0 | GO:0015914 | phospholipid transport(GO:0015914) |
| 0.0 | 0.1 | GO:0048672 | positive regulation of collateral sprouting(GO:0048672) |
| 0.0 | 0.2 | GO:0045601 | regulation of endothelial cell differentiation(GO:0045601) |
| 0.0 | 0.6 | GO:0031572 | G2 DNA damage checkpoint(GO:0031572) |
| 0.0 | 0.1 | GO:0007161 | calcium-independent cell-matrix adhesion(GO:0007161) |
| 0.0 | 1.0 | GO:0019233 | sensory perception of pain(GO:0019233) |
| 0.0 | 0.6 | GO:0007339 | binding of sperm to zona pellucida(GO:0007339) |
| 0.0 | 1.1 | GO:0006369 | termination of RNA polymerase II transcription(GO:0006369) |
| 0.0 | 0.5 | GO:0010762 | regulation of fibroblast migration(GO:0010762) |
Gene overrepresentation in cellular component category:
| Log-likelihood per target | Total log-likelihood | Term | Description |
|---|---|---|---|
| 0.5 | 3.2 | GO:0090498 | extrinsic component of Golgi membrane(GO:0090498) |
| 0.4 | 2.2 | GO:0019815 | B cell receptor complex(GO:0019815) |
| 0.4 | 22.4 | GO:0042571 | immunoglobulin complex(GO:0019814) immunoglobulin complex, circulating(GO:0042571) |
| 0.4 | 1.1 | GO:0005914 | spot adherens junction(GO:0005914) |
| 0.3 | 1.4 | GO:1902937 | inward rectifier potassium channel complex(GO:1902937) |
| 0.3 | 2.1 | GO:0032279 | asymmetric synapse(GO:0032279) |
| 0.2 | 1.1 | GO:0034753 | nuclear aryl hydrocarbon receptor complex(GO:0034753) |
| 0.2 | 2.4 | GO:0042105 | alpha-beta T cell receptor complex(GO:0042105) |
| 0.2 | 1.5 | GO:0097129 | cyclin D2-CDK4 complex(GO:0097129) |
| 0.2 | 2.2 | GO:0035692 | macrophage migration inhibitory factor receptor complex(GO:0035692) |
| 0.2 | 1.5 | GO:0030868 | smooth endoplasmic reticulum membrane(GO:0030868) smooth endoplasmic reticulum part(GO:0097425) |
| 0.2 | 2.3 | GO:0030314 | junctional membrane complex(GO:0030314) |
| 0.2 | 0.5 | GO:0034686 | integrin alphav-beta8 complex(GO:0034686) |
| 0.1 | 2.7 | GO:0034663 | endoplasmic reticulum chaperone complex(GO:0034663) |
| 0.1 | 2.1 | GO:0031209 | SCAR complex(GO:0031209) |
| 0.1 | 0.9 | GO:0097149 | centralspindlin complex(GO:0097149) |
| 0.1 | 1.1 | GO:0098536 | deuterosome(GO:0098536) |
| 0.1 | 1.3 | GO:1990761 | growth cone lamellipodium(GO:1990761) |
| 0.1 | 1.3 | GO:0098845 | postsynaptic endosome(GO:0098845) |
| 0.1 | 0.3 | GO:0060187 | cell pole(GO:0060187) |
| 0.1 | 2.2 | GO:0042101 | T cell receptor complex(GO:0042101) |
| 0.1 | 1.9 | GO:0032059 | bleb(GO:0032059) |
| 0.1 | 0.6 | GO:0005896 | interleukin-6 receptor complex(GO:0005896) |
| 0.1 | 0.7 | GO:0031523 | Myb complex(GO:0031523) |
| 0.1 | 1.3 | GO:0000137 | Golgi cis cisterna(GO:0000137) |
| 0.1 | 3.1 | GO:0031083 | BLOC-1 complex(GO:0031083) |
| 0.1 | 0.5 | GO:0031205 | endoplasmic reticulum Sec complex(GO:0031205) |
| 0.1 | 0.3 | GO:0000333 | telomerase catalytic core complex(GO:0000333) |
| 0.1 | 0.6 | GO:1990031 | pinceau fiber(GO:1990031) |
| 0.1 | 1.5 | GO:0035749 | myelin sheath adaxonal region(GO:0035749) |
| 0.1 | 0.2 | GO:1990917 | sperm head plasma membrane(GO:1990913) ooplasm(GO:1990917) |
| 0.1 | 0.6 | GO:0031233 | intrinsic component of external side of plasma membrane(GO:0031233) |
| 0.1 | 0.4 | GO:0034669 | integrin alpha4-beta7 complex(GO:0034669) |
| 0.1 | 0.5 | GO:1990246 | uniplex complex(GO:1990246) |
| 0.1 | 0.6 | GO:0005594 | collagen type IX trimer(GO:0005594) |
| 0.1 | 3.9 | GO:0000159 | protein phosphatase type 2A complex(GO:0000159) |
| 0.1 | 6.0 | GO:0005834 | heterotrimeric G-protein complex(GO:0005834) |
| 0.1 | 2.7 | GO:0005721 | pericentric heterochromatin(GO:0005721) |
| 0.1 | 0.6 | GO:0048787 | presynaptic active zone membrane(GO:0048787) |
| 0.1 | 0.3 | GO:0002133 | polycystin complex(GO:0002133) |
| 0.1 | 0.3 | GO:0034667 | integrin alpha3-beta1 complex(GO:0034667) |
| 0.1 | 0.2 | GO:0043260 | laminin-10 complex(GO:0043259) laminin-11 complex(GO:0043260) |
| 0.1 | 1.8 | GO:0032045 | guanyl-nucleotide exchange factor complex(GO:0032045) |
| 0.1 | 0.4 | GO:1990769 | proximal neuron projection(GO:1990769) |
| 0.1 | 1.8 | GO:0001518 | voltage-gated sodium channel complex(GO:0001518) |
| 0.1 | 0.4 | GO:0005967 | mitochondrial pyruvate dehydrogenase complex(GO:0005967) |
| 0.1 | 1.7 | GO:0005922 | connexon complex(GO:0005922) |
| 0.1 | 2.2 | GO:0071782 | endoplasmic reticulum tubular network(GO:0071782) |
| 0.1 | 3.1 | GO:0044224 | juxtaparanode region of axon(GO:0044224) |
| 0.1 | 0.7 | GO:0097197 | tetraspanin-enriched microdomain(GO:0097197) |
| 0.1 | 0.2 | GO:0070701 | mucus layer(GO:0070701) |
| 0.1 | 0.4 | GO:0097513 | myosin II filament(GO:0097513) |
| 0.0 | 2.2 | GO:0042629 | mast cell granule(GO:0042629) |
| 0.0 | 0.2 | GO:0009328 | phenylalanine-tRNA ligase complex(GO:0009328) |
| 0.0 | 0.3 | GO:0048476 | Holliday junction resolvase complex(GO:0048476) |
| 0.0 | 0.3 | GO:0032044 | DSIF complex(GO:0032044) |
| 0.0 | 1.1 | GO:0017146 | NMDA selective glutamate receptor complex(GO:0017146) |
| 0.0 | 1.4 | GO:0031095 | platelet dense tubular network membrane(GO:0031095) |
| 0.0 | 1.1 | GO:0031616 | spindle pole centrosome(GO:0031616) |
| 0.0 | 0.4 | GO:0097452 | GAIT complex(GO:0097452) |
| 0.0 | 0.9 | GO:0042589 | zymogen granule membrane(GO:0042589) |
| 0.0 | 1.6 | GO:0005614 | interstitial matrix(GO:0005614) |
| 0.0 | 0.1 | GO:1905103 | integral component of lysosomal membrane(GO:1905103) |
| 0.0 | 0.3 | GO:0034715 | pICln-Sm protein complex(GO:0034715) |
| 0.0 | 0.5 | GO:0002116 | semaphorin receptor complex(GO:0002116) |
| 0.0 | 0.8 | GO:0030130 | clathrin coat of trans-Golgi network vesicle(GO:0030130) |
| 0.0 | 0.4 | GO:0033269 | internode region of axon(GO:0033269) |
| 0.0 | 1.6 | GO:0016581 | NuRD complex(GO:0016581) CHD-type complex(GO:0090545) |
| 0.0 | 0.8 | GO:0043203 | axon hillock(GO:0043203) |
| 0.0 | 2.2 | GO:0001772 | immunological synapse(GO:0001772) |
| 0.0 | 0.4 | GO:0043190 | ATP-binding cassette (ABC) transporter complex(GO:0043190) |
| 0.0 | 1.1 | GO:0031307 | integral component of mitochondrial outer membrane(GO:0031307) |
| 0.0 | 2.0 | GO:0048786 | presynaptic active zone(GO:0048786) |
| 0.0 | 0.4 | GO:0097442 | CA3 pyramidal cell dendrite(GO:0097442) |
| 0.0 | 2.2 | GO:0043198 | dendritic shaft(GO:0043198) |
| 0.0 | 0.4 | GO:0005785 | signal recognition particle receptor complex(GO:0005785) |
| 0.0 | 2.4 | GO:0002102 | podosome(GO:0002102) |
| 0.0 | 0.4 | GO:0002193 | MAML1-RBP-Jkappa- ICN1 complex(GO:0002193) |
| 0.0 | 0.1 | GO:0005588 | collagen type V trimer(GO:0005588) |
| 0.0 | 2.5 | GO:0019005 | SCF ubiquitin ligase complex(GO:0019005) |
| 0.0 | 0.9 | GO:0005849 | mRNA cleavage factor complex(GO:0005849) |
| 0.0 | 0.2 | GO:0070847 | core mediator complex(GO:0070847) |
| 0.0 | 1.0 | GO:1990124 | messenger ribonucleoprotein complex(GO:1990124) |
| 0.0 | 1.0 | GO:0044295 | axonal growth cone(GO:0044295) |
| 0.0 | 0.2 | GO:0016012 | sarcoglycan complex(GO:0016012) |
| 0.0 | 0.4 | GO:0031088 | platelet dense granule membrane(GO:0031088) |
| 0.0 | 0.3 | GO:0032591 | dendritic spine membrane(GO:0032591) |
| 0.0 | 8.2 | GO:0099572 | postsynaptic density(GO:0014069) postsynaptic specialization(GO:0099572) |
| 0.0 | 0.1 | GO:0035370 | UBC13-UEV1A complex(GO:0035370) |
| 0.0 | 1.8 | GO:0031228 | intrinsic component of Golgi membrane(GO:0031228) |
| 0.0 | 3.4 | GO:0043204 | perikaryon(GO:0043204) |
| 0.0 | 0.3 | GO:0071438 | invadopodium membrane(GO:0071438) |
| 0.0 | 0.1 | GO:0005658 | alpha DNA polymerase:primase complex(GO:0005658) |
| 0.0 | 0.5 | GO:0030122 | AP-2 adaptor complex(GO:0030122) |
| 0.0 | 0.2 | GO:0061574 | ASAP complex(GO:0061574) |
| 0.0 | 0.2 | GO:0005583 | fibrillar collagen trimer(GO:0005583) banded collagen fibril(GO:0098643) |
| 0.0 | 1.6 | GO:0005881 | cytoplasmic microtubule(GO:0005881) |
| 0.0 | 0.2 | GO:0071541 | eukaryotic translation initiation factor 3 complex, eIF3m(GO:0071541) |
| 0.0 | 0.3 | GO:0033643 | host cell part(GO:0033643) |
| 0.0 | 7.7 | GO:0005578 | proteinaceous extracellular matrix(GO:0005578) |
| 0.0 | 0.6 | GO:0005720 | nuclear heterochromatin(GO:0005720) |
| 0.0 | 0.2 | GO:0008024 | cyclin/CDK positive transcription elongation factor complex(GO:0008024) |
| 0.0 | 2.2 | GO:0005581 | collagen trimer(GO:0005581) |
| 0.0 | 0.4 | GO:0031265 | CD95 death-inducing signaling complex(GO:0031265) |
| 0.0 | 0.1 | GO:0031313 | extrinsic component of endosome membrane(GO:0031313) |
| 0.0 | 0.8 | GO:0008180 | COP9 signalosome(GO:0008180) |
| 0.0 | 0.5 | GO:0005680 | anaphase-promoting complex(GO:0005680) |
| 0.0 | 0.4 | GO:0031258 | lamellipodium membrane(GO:0031258) |
| 0.0 | 1.1 | GO:0043195 | terminal bouton(GO:0043195) |
| 0.0 | 3.3 | GO:0031225 | anchored component of membrane(GO:0031225) |
| 0.0 | 1.2 | GO:0000118 | histone deacetylase complex(GO:0000118) |
| 0.0 | 0.2 | GO:0005869 | dynactin complex(GO:0005869) |
| 0.0 | 0.8 | GO:0042734 | presynaptic membrane(GO:0042734) |
| 0.0 | 0.3 | GO:0044232 | organelle membrane contact site(GO:0044232) |
| 0.0 | 0.3 | GO:0005689 | U12-type spliceosomal complex(GO:0005689) |
| 0.0 | 0.5 | GO:0008305 | integrin complex(GO:0008305) |
| 0.0 | 0.7 | GO:0005876 | spindle microtubule(GO:0005876) |
| 0.0 | 0.5 | GO:0000421 | autophagosome membrane(GO:0000421) |
| 0.0 | 0.1 | GO:1990745 | EARP complex(GO:1990745) |
| 0.0 | 0.0 | GO:0032116 | SMC loading complex(GO:0032116) |
| 0.0 | 0.6 | GO:0043596 | nuclear replication fork(GO:0043596) |
| 0.0 | 0.1 | GO:0072546 | ER membrane protein complex(GO:0072546) |
| 0.0 | 0.1 | GO:0097550 | transcriptional preinitiation complex(GO:0097550) |
| 0.0 | 1.3 | GO:0031234 | extrinsic component of cytoplasmic side of plasma membrane(GO:0031234) |
Gene overrepresentation in molecular function category:
| Log-likelihood per target | Total log-likelihood | Term | Description |
|---|---|---|---|
| 0.7 | 2.2 | GO:0004047 | aminomethyltransferase activity(GO:0004047) |
| 0.5 | 1.5 | GO:0004500 | dopamine beta-monooxygenase activity(GO:0004500) |
| 0.4 | 1.1 | GO:0004874 | aryl hydrocarbon receptor activity(GO:0004874) |
| 0.3 | 1.0 | GO:0019785 | ISG15-specific protease activity(GO:0019785) |
| 0.3 | 22.9 | GO:0034987 | immunoglobulin receptor binding(GO:0034987) |
| 0.3 | 1.3 | GO:0016639 | oxidoreductase activity, acting on the CH-NH2 group of donors, NAD or NADP as acceptor(GO:0016639) |
| 0.3 | 1.6 | GO:0031728 | CCR3 chemokine receptor binding(GO:0031728) |
| 0.3 | 1.2 | GO:0030550 | acetylcholine receptor inhibitor activity(GO:0030550) |
| 0.3 | 2.6 | GO:0015220 | choline transmembrane transporter activity(GO:0015220) |
| 0.3 | 2.3 | GO:0031849 | olfactory receptor binding(GO:0031849) |
| 0.3 | 1.1 | GO:0072320 | volume-sensitive chloride channel activity(GO:0072320) |
| 0.3 | 1.1 | GO:0031727 | CCR2 chemokine receptor binding(GO:0031727) |
| 0.3 | 1.6 | GO:0008321 | Ral guanyl-nucleotide exchange factor activity(GO:0008321) |
| 0.3 | 1.3 | GO:0005006 | epidermal growth factor-activated receptor activity(GO:0005006) |
| 0.3 | 3.8 | GO:0015501 | glutamate:sodium symporter activity(GO:0015501) |
| 0.2 | 2.2 | GO:0016907 | G-protein coupled acetylcholine receptor activity(GO:0016907) |
| 0.2 | 0.7 | GO:0099530 | G-protein coupled receptor activity involved in regulation of postsynaptic membrane potential(GO:0099530) |
| 0.2 | 1.7 | GO:0004471 | malate dehydrogenase (decarboxylating) (NAD+) activity(GO:0004471) malate dehydrogenase (decarboxylating) (NADP+) activity(GO:0004473) |
| 0.2 | 0.7 | GO:0000253 | 3-keto sterol reductase activity(GO:0000253) |
| 0.2 | 1.4 | GO:0050436 | microfibril binding(GO:0050436) |
| 0.2 | 1.4 | GO:0055131 | C3HC4-type RING finger domain binding(GO:0055131) |
| 0.2 | 1.1 | GO:0004995 | tachykinin receptor activity(GO:0004995) |
| 0.2 | 0.8 | GO:0031726 | CCR1 chemokine receptor binding(GO:0031726) |
| 0.2 | 2.6 | GO:0033691 | sialic acid binding(GO:0033691) |
| 0.2 | 1.9 | GO:0016286 | small conductance calcium-activated potassium channel activity(GO:0016286) |
| 0.2 | 0.7 | GO:0047977 | hepoxilin-epoxide hydrolase activity(GO:0047977) |
| 0.2 | 0.7 | GO:0004698 | calcium-dependent protein kinase C activity(GO:0004698) |
| 0.2 | 0.7 | GO:0008260 | 3-oxoacid CoA-transferase activity(GO:0008260) |
| 0.2 | 0.8 | GO:0033906 | hyaluronoglucuronidase activity(GO:0033906) |
| 0.2 | 1.6 | GO:0005094 | Rho GDP-dissociation inhibitor activity(GO:0005094) |
| 0.2 | 33.5 | GO:0003823 | antigen binding(GO:0003823) |
| 0.1 | 1.0 | GO:1990050 | phosphatidic acid transporter activity(GO:1990050) |
| 0.1 | 0.4 | GO:0015229 | L-ascorbate:sodium symporter activity(GO:0008520) L-ascorbic acid transporter activity(GO:0015229) sodium-dependent L-ascorbate transmembrane transporter activity(GO:0070890) |
| 0.1 | 2.2 | GO:0042608 | T cell receptor binding(GO:0042608) |
| 0.1 | 0.9 | GO:0031752 | D5 dopamine receptor binding(GO:0031752) |
| 0.1 | 1.3 | GO:0086006 | voltage-gated sodium channel activity involved in cardiac muscle cell action potential(GO:0086006) |
| 0.1 | 0.4 | GO:0017098 | sulfonylurea receptor binding(GO:0017098) |
| 0.1 | 0.5 | GO:0005260 | channel-conductance-controlling ATPase activity(GO:0005260) |
| 0.1 | 0.5 | GO:0061752 | telomeric repeat-containing RNA binding(GO:0061752) |
| 0.1 | 1.3 | GO:0005314 | high-affinity glutamate transmembrane transporter activity(GO:0005314) |
| 0.1 | 1.1 | GO:0008597 | calcium-dependent protein serine/threonine phosphatase regulator activity(GO:0008597) |
| 0.1 | 0.7 | GO:0047696 | beta-adrenergic receptor kinase activity(GO:0047696) |
| 0.1 | 3.6 | GO:0019992 | diacylglycerol binding(GO:0019992) |
| 0.1 | 0.5 | GO:0004994 | somatostatin receptor activity(GO:0004994) |
| 0.1 | 0.3 | GO:0004960 | thromboxane receptor activity(GO:0004960) thromboxane A2 receptor activity(GO:0004961) |
| 0.1 | 1.0 | GO:1903763 | gap junction channel activity involved in cell communication by electrical coupling(GO:1903763) |
| 0.1 | 2.4 | GO:0052629 | phosphatidylinositol-3,5-bisphosphate 3-phosphatase activity(GO:0052629) |
| 0.1 | 2.5 | GO:0004143 | diacylglycerol kinase activity(GO:0004143) |
| 0.1 | 3.1 | GO:0008510 | sodium:bicarbonate symporter activity(GO:0008510) |
| 0.1 | 0.5 | GO:0017095 | heparan sulfate 6-O-sulfotransferase activity(GO:0017095) |
| 0.1 | 0.3 | GO:0005519 | cytoskeletal regulatory protein binding(GO:0005519) |
| 0.1 | 0.8 | GO:0016403 | dimethylargininase activity(GO:0016403) |
| 0.1 | 0.5 | GO:1990430 | extracellular matrix protein binding(GO:1990430) |
| 0.1 | 0.3 | GO:0048257 | 3'-flap endonuclease activity(GO:0048257) |
| 0.1 | 0.9 | GO:0045545 | syndecan binding(GO:0045545) |
| 0.1 | 0.6 | GO:0004962 | endothelin receptor activity(GO:0004962) |
| 0.1 | 0.4 | GO:0050501 | hyaluronan synthase activity(GO:0050501) |
| 0.1 | 0.3 | GO:0005163 | nerve growth factor receptor binding(GO:0005163) |
| 0.1 | 0.4 | GO:0047179 | platelet-activating factor acetyltransferase activity(GO:0047179) |
| 0.1 | 0.7 | GO:0001640 | adenylate cyclase inhibiting G-protein coupled glutamate receptor activity(GO:0001640) G-protein coupled glutamate receptor activity(GO:0098988) |
| 0.1 | 2.9 | GO:0035259 | glucocorticoid receptor binding(GO:0035259) |
| 0.1 | 0.7 | GO:0099580 | ion antiporter activity involved in regulation of postsynaptic membrane potential(GO:0099580) |
| 0.1 | 0.4 | GO:0016404 | 15-hydroxyprostaglandin dehydrogenase (NAD+) activity(GO:0016404) |
| 0.1 | 1.9 | GO:0005522 | profilin binding(GO:0005522) |
| 0.1 | 0.3 | GO:0034714 | type III transforming growth factor beta receptor binding(GO:0034714) |
| 0.1 | 0.8 | GO:0030160 | GKAP/Homer scaffold activity(GO:0030160) |
| 0.1 | 1.0 | GO:0051425 | PTB domain binding(GO:0051425) |
| 0.1 | 0.7 | GO:0016670 | oxidoreductase activity, acting on a sulfur group of donors, oxygen as acceptor(GO:0016670) |
| 0.1 | 0.2 | GO:0042007 | interleukin-18 binding(GO:0042007) |
| 0.1 | 1.3 | GO:0009931 | calcium-dependent protein serine/threonine kinase activity(GO:0009931) calcium-dependent protein kinase activity(GO:0010857) |
| 0.1 | 0.6 | GO:0004614 | phosphoglucomutase activity(GO:0004614) |
| 0.1 | 0.5 | GO:0030144 | alpha-1,6-mannosylglycoprotein 6-beta-N-acetylglucosaminyltransferase activity(GO:0030144) |
| 0.1 | 1.5 | GO:0031697 | beta-1 adrenergic receptor binding(GO:0031697) |
| 0.1 | 0.3 | GO:0000309 | nicotinamide-nucleotide adenylyltransferase activity(GO:0000309) |
| 0.1 | 0.7 | GO:0015349 | thyroid hormone transmembrane transporter activity(GO:0015349) |
| 0.1 | 0.2 | GO:0004730 | pseudouridylate synthase activity(GO:0004730) |
| 0.1 | 2.7 | GO:0005388 | calcium-transporting ATPase activity(GO:0005388) |
| 0.1 | 0.3 | GO:0047888 | fatty acid peroxidase activity(GO:0047888) |
| 0.1 | 1.9 | GO:0003906 | DNA-(apurinic or apyrimidinic site) lyase activity(GO:0003906) |
| 0.1 | 0.7 | GO:0070740 | tubulin-glutamic acid ligase activity(GO:0070740) |
| 0.1 | 0.9 | GO:0070097 | delta-catenin binding(GO:0070097) |
| 0.1 | 0.4 | GO:0033829 | O-fucosylpeptide 3-beta-N-acetylglucosaminyltransferase activity(GO:0033829) |
| 0.1 | 1.2 | GO:0015379 | potassium:chloride symporter activity(GO:0015379) potassium ion symporter activity(GO:0022820) |
| 0.1 | 1.7 | GO:0051864 | histone demethylase activity (H3-K36 specific)(GO:0051864) |
| 0.1 | 0.6 | GO:0001517 | N-acetylglucosamine 6-O-sulfotransferase activity(GO:0001517) |
| 0.1 | 0.5 | GO:0008467 | [heparan sulfate]-glucosamine 3-sulfotransferase 1 activity(GO:0008467) |
| 0.1 | 0.3 | GO:0005152 | interleukin-1 receptor antagonist activity(GO:0005152) |
| 0.1 | 1.0 | GO:0070700 | BMP receptor binding(GO:0070700) |
| 0.1 | 1.6 | GO:0051428 | peptide hormone receptor binding(GO:0051428) |
| 0.1 | 0.5 | GO:0008532 | N-acetyllactosaminide beta-1,3-N-acetylglucosaminyltransferase activity(GO:0008532) |
| 0.1 | 1.1 | GO:0032051 | clathrin light chain binding(GO:0032051) |
| 0.1 | 0.3 | GO:0052594 | tryptamine:oxygen oxidoreductase (deaminating) activity(GO:0052593) aminoacetone:oxygen oxidoreductase(deaminating) activity(GO:0052594) aliphatic-amine oxidase activity(GO:0052595) phenethylamine:oxygen oxidoreductase (deaminating) activity(GO:0052596) |
| 0.1 | 2.2 | GO:0016805 | dipeptidase activity(GO:0016805) |
| 0.1 | 0.3 | GO:0016934 | extracellular-glycine-gated ion channel activity(GO:0016933) extracellular-glycine-gated chloride channel activity(GO:0016934) |
| 0.1 | 0.4 | GO:0032038 | myosin II heavy chain binding(GO:0032038) |
| 0.1 | 2.7 | GO:0005540 | hyaluronic acid binding(GO:0005540) |
| 0.1 | 1.2 | GO:0015250 | water channel activity(GO:0015250) |
| 0.1 | 1.5 | GO:0005247 | voltage-gated chloride channel activity(GO:0005247) |
| 0.1 | 1.3 | GO:0033130 | acetylcholine receptor binding(GO:0033130) |
| 0.1 | 0.6 | GO:0005138 | interleukin-6 receptor binding(GO:0005138) |
| 0.1 | 0.5 | GO:0030368 | interleukin-17 receptor activity(GO:0030368) |
| 0.1 | 0.7 | GO:0038132 | neuregulin binding(GO:0038132) |
| 0.1 | 1.0 | GO:0032036 | myosin heavy chain binding(GO:0032036) |
| 0.1 | 0.4 | GO:0004504 | peptidylglycine monooxygenase activity(GO:0004504) peptidylamidoglycolate lyase activity(GO:0004598) |
| 0.1 | 1.7 | GO:0042288 | MHC class I protein binding(GO:0042288) |
| 0.1 | 0.4 | GO:0048495 | Roundabout binding(GO:0048495) |
| 0.1 | 0.7 | GO:0015279 | store-operated calcium channel activity(GO:0015279) |
| 0.1 | 0.7 | GO:0017034 | Rap guanyl-nucleotide exchange factor activity(GO:0017034) |
| 0.1 | 1.8 | GO:0031078 | histone deacetylase activity (H3-K14 specific)(GO:0031078) NAD-dependent histone deacetylase activity (H3-K14 specific)(GO:0032041) |
| 0.0 | 0.6 | GO:0008020 | G-protein coupled photoreceptor activity(GO:0008020) |
| 0.0 | 0.3 | GO:0030377 | urokinase plasminogen activator receptor activity(GO:0030377) |
| 0.0 | 0.6 | GO:0022850 | serotonin-gated cation channel activity(GO:0022850) |
| 0.0 | 0.7 | GO:0086056 | voltage-gated calcium channel activity involved in AV node cell action potential(GO:0086056) |
| 0.0 | 0.7 | GO:0000182 | rDNA binding(GO:0000182) |
| 0.0 | 1.5 | GO:0005095 | GTPase inhibitor activity(GO:0005095) |
| 0.0 | 0.4 | GO:0043120 | tumor necrosis factor binding(GO:0043120) |
| 0.0 | 0.9 | GO:0004089 | carbonate dehydratase activity(GO:0004089) |
| 0.0 | 0.4 | GO:0008310 | single-stranded DNA 3'-5' exodeoxyribonuclease activity(GO:0008310) |
| 0.0 | 2.2 | GO:0031683 | G-protein beta/gamma-subunit complex binding(GO:0031683) |
| 0.0 | 0.4 | GO:0015181 | arginine transmembrane transporter activity(GO:0015181) |
| 0.0 | 0.6 | GO:0004705 | JUN kinase activity(GO:0004705) SAP kinase activity(GO:0016909) |
| 0.0 | 0.2 | GO:0043237 | laminin-1 binding(GO:0043237) |
| 0.0 | 0.3 | GO:0048101 | calcium- and calmodulin-regulated 3',5'-cyclic-GMP phosphodiesterase activity(GO:0048101) |
| 0.0 | 0.1 | GO:0097363 | protein O-GlcNAc transferase activity(GO:0097363) |
| 0.0 | 0.2 | GO:0004489 | methylenetetrahydrofolate reductase (NAD(P)H) activity(GO:0004489) |
| 0.0 | 0.1 | GO:0036054 | protein-malonyllysine demalonylase activity(GO:0036054) protein-succinyllysine desuccinylase activity(GO:0036055) protein-glutaryllysine deglutarylase activity(GO:0061697) |
| 0.0 | 0.3 | GO:0001515 | opioid peptide activity(GO:0001515) |
| 0.0 | 0.5 | GO:0039706 | co-receptor binding(GO:0039706) |
| 0.0 | 0.4 | GO:0004727 | prenylated protein tyrosine phosphatase activity(GO:0004727) |
| 0.0 | 0.4 | GO:0042296 | ISG15 transferase activity(GO:0042296) |
| 0.0 | 1.4 | GO:0099604 | calcium-release channel activity(GO:0015278) ligand-gated calcium channel activity(GO:0099604) |
| 0.0 | 0.5 | GO:0019855 | calcium channel inhibitor activity(GO:0019855) |
| 0.0 | 1.1 | GO:0015271 | outward rectifier potassium channel activity(GO:0015271) |
| 0.0 | 0.4 | GO:0003872 | 6-phosphofructokinase activity(GO:0003872) |
| 0.0 | 1.1 | GO:0050811 | GABA receptor binding(GO:0050811) |
| 0.0 | 0.5 | GO:0042731 | PH domain binding(GO:0042731) |
| 0.0 | 0.4 | GO:0005005 | transmembrane-ephrin receptor activity(GO:0005005) |
| 0.0 | 0.4 | GO:0043176 | amine binding(GO:0043176) serotonin binding(GO:0051378) |
| 0.0 | 1.2 | GO:0031005 | filamin binding(GO:0031005) |
| 0.0 | 1.0 | GO:0004185 | serine-type carboxypeptidase activity(GO:0004185) |
| 0.0 | 0.3 | GO:1990932 | 5.8S rRNA binding(GO:1990932) |
| 0.0 | 0.2 | GO:0003976 | UDP-N-acetylglucosamine-lysosomal-enzyme N-acetylglucosaminephosphotransferase activity(GO:0003976) |
| 0.0 | 0.2 | GO:0019763 | immunoglobulin receptor activity(GO:0019763) |
| 0.0 | 5.5 | GO:0005518 | collagen binding(GO:0005518) |
| 0.0 | 1.2 | GO:0050321 | tau-protein kinase activity(GO:0050321) |
| 0.0 | 0.1 | GO:0008294 | calcium- and calmodulin-responsive adenylate cyclase activity(GO:0008294) |
| 0.0 | 0.8 | GO:0008349 | MAP kinase kinase kinase kinase activity(GO:0008349) |
| 0.0 | 0.3 | GO:0043533 | inositol 1,3,4,5 tetrakisphosphate binding(GO:0043533) |
| 0.0 | 0.2 | GO:0004826 | phenylalanine-tRNA ligase activity(GO:0004826) |
| 0.0 | 1.7 | GO:0046875 | ephrin receptor binding(GO:0046875) |
| 0.0 | 1.2 | GO:0043274 | phospholipase binding(GO:0043274) |
| 0.0 | 0.2 | GO:0008273 | calcium, potassium:sodium antiporter activity(GO:0008273) |
| 0.0 | 0.1 | GO:0051185 | coenzyme transporter activity(GO:0051185) |
| 0.0 | 1.5 | GO:0030676 | Rac guanyl-nucleotide exchange factor activity(GO:0030676) |
| 0.0 | 1.6 | GO:0043027 | cysteine-type endopeptidase inhibitor activity involved in apoptotic process(GO:0043027) |
| 0.0 | 0.3 | GO:0019136 | deoxynucleoside kinase activity(GO:0019136) |
| 0.0 | 2.0 | GO:0042169 | SH2 domain binding(GO:0042169) |
| 0.0 | 3.7 | GO:0004722 | protein serine/threonine phosphatase activity(GO:0004722) |
| 0.0 | 0.1 | GO:0070320 | inward rectifier potassium channel inhibitor activity(GO:0070320) |
| 0.0 | 0.4 | GO:0022851 | GABA-gated chloride ion channel activity(GO:0022851) |
| 0.0 | 1.1 | GO:0038191 | neuropilin binding(GO:0038191) |
| 0.0 | 0.2 | GO:0032184 | SUMO polymer binding(GO:0032184) |
| 0.0 | 0.8 | GO:0001968 | fibronectin binding(GO:0001968) |
| 0.0 | 0.1 | GO:0005368 | taurine transmembrane transporter activity(GO:0005368) taurine:sodium symporter activity(GO:0005369) |
| 0.0 | 0.7 | GO:0008191 | metalloendopeptidase inhibitor activity(GO:0008191) |
| 0.0 | 0.9 | GO:0031489 | myosin V binding(GO:0031489) |
| 0.0 | 0.8 | GO:0005092 | GDP-dissociation inhibitor activity(GO:0005092) |
| 0.0 | 0.5 | GO:0005003 | ephrin receptor activity(GO:0005003) |
| 0.0 | 0.2 | GO:0042978 | ornithine decarboxylase activator activity(GO:0042978) |
| 0.0 | 0.6 | GO:0005068 | transmembrane receptor protein tyrosine kinase adaptor activity(GO:0005068) |
| 0.0 | 0.5 | GO:0017154 | semaphorin receptor activity(GO:0017154) |
| 0.0 | 0.9 | GO:0043539 | protein serine/threonine kinase activator activity(GO:0043539) |
| 0.0 | 2.1 | GO:0048365 | Rac GTPase binding(GO:0048365) |
| 0.0 | 1.1 | GO:0017075 | syntaxin-1 binding(GO:0017075) |
| 0.0 | 1.4 | GO:0032266 | phosphatidylinositol-3-phosphate binding(GO:0032266) |
| 0.0 | 0.1 | GO:0044736 | acid-sensing ion channel activity(GO:0044736) |
| 0.0 | 0.2 | GO:0004359 | glutaminase activity(GO:0004359) |
| 0.0 | 1.0 | GO:0044183 | protein binding involved in protein folding(GO:0044183) |
| 0.0 | 0.4 | GO:0030020 | extracellular matrix structural constituent conferring tensile strength(GO:0030020) |
| 0.0 | 1.0 | GO:0043014 | alpha-tubulin binding(GO:0043014) |
| 0.0 | 0.4 | GO:0046625 | sphingolipid binding(GO:0046625) |
| 0.0 | 1.6 | GO:0004407 | histone deacetylase activity(GO:0004407) |
| 0.0 | 0.1 | GO:0030235 | nitric-oxide synthase regulator activity(GO:0030235) |
| 0.0 | 1.1 | GO:0005227 | calcium activated cation channel activity(GO:0005227) |
| 0.0 | 0.4 | GO:0016494 | C-X-C chemokine receptor activity(GO:0016494) |
| 0.0 | 0.3 | GO:0046920 | alpha-(1->3)-fucosyltransferase activity(GO:0046920) |
| 0.0 | 0.4 | GO:0008140 | cAMP response element binding protein binding(GO:0008140) |
| 0.0 | 0.9 | GO:0017147 | Wnt-protein binding(GO:0017147) |
| 0.0 | 2.0 | GO:0005201 | extracellular matrix structural constituent(GO:0005201) |
| 0.0 | 0.4 | GO:0017162 | aryl hydrocarbon receptor binding(GO:0017162) |
| 0.0 | 0.1 | GO:0016603 | glutaminyl-peptide cyclotransferase activity(GO:0016603) |
| 0.0 | 0.5 | GO:0016864 | protein disulfide isomerase activity(GO:0003756) intramolecular oxidoreductase activity, transposing S-S bonds(GO:0016864) |
| 0.0 | 0.3 | GO:0008432 | JUN kinase binding(GO:0008432) |
| 0.0 | 0.1 | GO:0033746 | histone demethylase activity (H3-R2 specific)(GO:0033746) histone demethylase activity (H4-R3 specific)(GO:0033749) |
| 0.0 | 0.3 | GO:0001135 | transcription factor activity, RNA polymerase II transcription factor recruiting(GO:0001135) |
| 0.0 | 1.7 | GO:0070888 | E-box binding(GO:0070888) |
| 0.0 | 0.5 | GO:1905030 | voltage-gated sodium channel activity(GO:0005248) voltage-gated ion channel activity involved in regulation of postsynaptic membrane potential(GO:1905030) |
| 0.0 | 0.2 | GO:0031386 | protein tag(GO:0031386) |
| 0.0 | 0.1 | GO:0016524 | latrotoxin receptor activity(GO:0016524) |
| 0.0 | 0.8 | GO:0051721 | protein phosphatase 2A binding(GO:0051721) |
| 0.0 | 0.5 | GO:0001223 | transcription coactivator binding(GO:0001223) |
| 0.0 | 0.1 | GO:0036312 | phosphatidylinositol 3-kinase regulatory subunit binding(GO:0036312) |
| 0.0 | 0.1 | GO:0004035 | alkaline phosphatase activity(GO:0004035) |
| 0.0 | 0.1 | GO:0055104 | ligase inhibitor activity(GO:0055104) ubiquitin ligase inhibitor activity(GO:1990948) |
| 0.0 | 0.1 | GO:0048403 | brain-derived neurotrophic factor binding(GO:0048403) |
| 0.0 | 0.1 | GO:0050119 | N-acetylglucosamine deacetylase activity(GO:0050119) |
| 0.0 | 0.4 | GO:0005229 | intracellular calcium activated chloride channel activity(GO:0005229) |
| 0.0 | 0.1 | GO:0008823 | cupric reductase activity(GO:0008823) ferric-chelate reductase (NADPH) activity(GO:0052851) |
| 0.0 | 0.5 | GO:0016676 | cytochrome-c oxidase activity(GO:0004129) heme-copper terminal oxidase activity(GO:0015002) oxidoreductase activity, acting on a heme group of donors, oxygen as acceptor(GO:0016676) |
| 0.0 | 0.1 | GO:0005294 | neutral L-amino acid secondary active transmembrane transporter activity(GO:0005294) |
| 0.0 | 0.3 | GO:0000150 | recombinase activity(GO:0000150) |
| 0.0 | 0.1 | GO:0031687 | A2A adenosine receptor binding(GO:0031687) |
| 0.0 | 0.1 | GO:0070181 | small ribosomal subunit rRNA binding(GO:0070181) |
| 0.0 | 1.5 | GO:1902936 | phosphatidylinositol bisphosphate binding(GO:1902936) |
| 0.0 | 0.2 | GO:0070324 | thyroid hormone binding(GO:0070324) |
| 0.0 | 0.0 | GO:0070336 | flap-structured DNA binding(GO:0070336) |
| 0.0 | 0.3 | GO:0005024 | transforming growth factor beta-activated receptor activity(GO:0005024) |
| 0.0 | 0.2 | GO:0097371 | MDM2/MDM4 family protein binding(GO:0097371) |
| 0.0 | 0.6 | GO:1990841 | promoter-specific chromatin binding(GO:1990841) |
| 0.0 | 0.3 | GO:0005547 | phosphatidylinositol-3,4,5-trisphosphate binding(GO:0005547) |
| 0.0 | 0.3 | GO:0017127 | cholesterol transporter activity(GO:0017127) |
| 0.0 | 0.3 | GO:0004012 | phospholipid-translocating ATPase activity(GO:0004012) |
| 0.0 | 0.2 | GO:0048018 | receptor agonist activity(GO:0048018) |
| 0.0 | 0.4 | GO:0003950 | NAD+ ADP-ribosyltransferase activity(GO:0003950) |
| 0.0 | 0.5 | GO:0000900 | translation repressor activity, nucleic acid binding(GO:0000900) |
| 0.0 | 0.2 | GO:0030898 | actin-dependent ATPase activity(GO:0030898) |
Gene overrepresentation in curated gene sets: canonical pathways category:
| Log-likelihood per target | Total log-likelihood | Term | Description |
|---|---|---|---|
| 0.2 | 1.1 | PID TCR RAS PATHWAY | Ras signaling in the CD4+ TCR pathway |
| 0.1 | 1.9 | PID THROMBIN PAR4 PATHWAY | PAR4-mediated thrombin signaling events |
| 0.1 | 2.7 | SA CASPASE CASCADE | Apoptosis is mediated by caspases, cysteine proteases arranged in a proteolytic cascade. |
| 0.1 | 7.8 | PID CD8 TCR PATHWAY | TCR signaling in naïve CD8+ T cells |
| 0.1 | 1.3 | PID GLYPICAN 1PATHWAY | Glypican 1 network |
| 0.1 | 1.5 | PID S1P S1P4 PATHWAY | S1P4 pathway |
| 0.1 | 0.9 | PID TCR CALCIUM PATHWAY | Calcium signaling in the CD4+ TCR pathway |
| 0.1 | 0.6 | PID A6B1 A6B4 INTEGRIN PATHWAY | a6b1 and a6b4 Integrin signaling |
| 0.0 | 1.8 | PID ARF6 DOWNSTREAM PATHWAY | Arf6 downstream pathway |
| 0.0 | 2.4 | PID BCR 5PATHWAY | BCR signaling pathway |
| 0.0 | 3.5 | PID FRA PATHWAY | Validated transcriptional targets of AP1 family members Fra1 and Fra2 |
| 0.0 | 0.7 | PID PDGFRA PATHWAY | PDGFR-alpha signaling pathway |
| 0.0 | 2.8 | PID NFAT TFPATHWAY | Calcineurin-regulated NFAT-dependent transcription in lymphocytes |
| 0.0 | 1.1 | SA FAS SIGNALING | The TNF-type receptor Fas induces apoptosis on ligand binding. |
| 0.0 | 4.5 | PID RAC1 REG PATHWAY | Regulation of RAC1 activity |
| 0.0 | 0.3 | PID IL2 PI3K PATHWAY | IL2 signaling events mediated by PI3K |
| 0.0 | 2.9 | PID WNT NONCANONICAL PATHWAY | Noncanonical Wnt signaling pathway |
| 0.0 | 1.4 | PID FCER1 PATHWAY | Fc-epsilon receptor I signaling in mast cells |
| 0.0 | 0.9 | PID INTEGRIN5 PATHWAY | Beta5 beta6 beta7 and beta8 integrin cell surface interactions |
| 0.0 | 1.4 | PID RAS PATHWAY | Regulation of Ras family activation |
| 0.0 | 0.9 | SA TRKA RECEPTOR | The TrkA receptor binds nerve growth factor to activate MAP kinase pathways and promote cell growth. |
| 0.0 | 1.9 | PID IL2 STAT5 PATHWAY | IL2 signaling events mediated by STAT5 |
| 0.0 | 0.4 | PID S1P S1P2 PATHWAY | S1P2 pathway |
| 0.0 | 0.7 | PID EPHA FWDPATHWAY | EPHA forward signaling |
| 0.0 | 1.3 | PID CDC42 REG PATHWAY | Regulation of CDC42 activity |
| 0.0 | 0.2 | SA G2 AND M PHASES | Cdc25 activates the cdc2/cyclin B complex to induce the G2/M transition. |
| 0.0 | 1.2 | SA MMP CYTOKINE CONNECTION | Cytokines can induce activation of matrix metalloproteinases, which degrade extracellular matrix. |
| 0.0 | 0.4 | PID AP1 PATHWAY | AP-1 transcription factor network |
| 0.0 | 8.7 | NABA ECM GLYCOPROTEINS | Genes encoding structural ECM glycoproteins |
| 0.0 | 2.2 | PID IL4 2PATHWAY | IL4-mediated signaling events |
| 0.0 | 1.4 | ST GA13 PATHWAY | G alpha 13 Pathway |
| 0.0 | 2.6 | PID HDAC CLASSII PATHWAY | Signaling events mediated by HDAC Class II |
| 0.0 | 0.7 | PID HIF1A PATHWAY | Hypoxic and oxygen homeostasis regulation of HIF-1-alpha |
| 0.0 | 0.2 | PID ECADHERIN NASCENT AJ PATHWAY | E-cadherin signaling in the nascent adherens junction |
| 0.0 | 0.6 | PID IL8 CXCR1 PATHWAY | IL8- and CXCR1-mediated signaling events |
| 0.0 | 1.7 | PID ATR PATHWAY | ATR signaling pathway |
| 0.0 | 1.2 | NABA PROTEOGLYCANS | Genes encoding proteoglycans |
| 0.0 | 1.5 | PID HDAC CLASSI PATHWAY | Signaling events mediated by HDAC Class I |
| 0.0 | 0.3 | PID ERBB NETWORK PATHWAY | ErbB receptor signaling network |
| 0.0 | 1.3 | PID LKB1 PATHWAY | LKB1 signaling events |
| 0.0 | 0.7 | PID ALPHA SYNUCLEIN PATHWAY | Alpha-synuclein signaling |
| 0.0 | 0.7 | ST PHOSPHOINOSITIDE 3 KINASE PATHWAY | PI3K Pathway |
| 0.0 | 0.7 | PID HDAC CLASSIII PATHWAY | Signaling events mediated by HDAC Class III |
| 0.0 | 0.5 | PID NETRIN PATHWAY | Netrin-mediated signaling events |
| 0.0 | 1.2 | PID ARF6 PATHWAY | Arf6 signaling events |
| 0.0 | 0.4 | PID EPHRINB REV PATHWAY | Ephrin B reverse signaling |
| 0.0 | 0.6 | PID REELIN PATHWAY | Reelin signaling pathway |
| 0.0 | 0.8 | ST JNK MAPK PATHWAY | JNK MAPK Pathway |
| 0.0 | 0.8 | PID ERBB1 INTERNALIZATION PATHWAY | Internalization of ErbB1 |
| 0.0 | 0.8 | PID ENDOTHELIN PATHWAY | Endothelins |
| 0.0 | 0.4 | PID PI3KCI PATHWAY | Class I PI3K signaling events |
| 0.0 | 0.4 | PID IL6 7 PATHWAY | IL6-mediated signaling events |
| 0.0 | 0.4 | PID LIS1 PATHWAY | Lissencephaly gene (LIS1) in neuronal migration and development |
| 0.0 | 0.7 | PID AURORA A PATHWAY | Aurora A signaling |
| 0.0 | 0.9 | PID PLK1 PATHWAY | PLK1 signaling events |
| 0.0 | 0.3 | PID PI3K PLC TRK PATHWAY | Trk receptor signaling mediated by PI3K and PLC-gamma |
| 0.0 | 0.9 | PID SYNDECAN 1 PATHWAY | Syndecan-1-mediated signaling events |
| 0.0 | 0.5 | PID ATF2 PATHWAY | ATF-2 transcription factor network |
| 0.0 | 0.5 | PID INTEGRIN3 PATHWAY | Beta3 integrin cell surface interactions |
| 0.0 | 0.1 | SA G1 AND S PHASES | Cdk2, 4, and 6 bind cyclin D in G1, while cdk2/cyclin E promotes the G1/S transition. |
| 0.0 | 0.7 | PID INTEGRIN A4B1 PATHWAY | Alpha4 beta1 integrin signaling events |
| 0.0 | 0.5 | PID KIT PATHWAY | Signaling events mediated by Stem cell factor receptor (c-Kit) |
| 0.0 | 0.7 | PID HES HEY PATHWAY | Notch-mediated HES/HEY network |
| 0.0 | 1.1 | PID E2F PATHWAY | E2F transcription factor network |
| 0.0 | 0.7 | PID BETA CATENIN NUC PATHWAY | Regulation of nuclear beta catenin signaling and target gene transcription |
| 0.0 | 1.3 | PID MYC ACTIV PATHWAY | Validated targets of C-MYC transcriptional activation |
Gene overrepresentation in curated gene sets: REACTOME pathways category:
| Log-likelihood per target | Total log-likelihood | Term | Description |
|---|---|---|---|
| 0.2 | 3.7 | REACTOME REGULATION OF INSULIN SECRETION BY ACETYLCHOLINE | Genes involved in Regulation of Insulin Secretion by Acetylcholine |
| 0.1 | 3.0 | REACTOME HYALURONAN UPTAKE AND DEGRADATION | Genes involved in Hyaluronan uptake and degradation |
| 0.1 | 0.3 | REACTOME THROMBOXANE SIGNALLING THROUGH TP RECEPTOR | Genes involved in Thromboxane signalling through TP receptor |
| 0.1 | 1.6 | REACTOME KERATAN SULFATE DEGRADATION | Genes involved in Keratan sulfate degradation |
| 0.1 | 1.7 | REACTOME SYNTHESIS OF PIPS AT THE LATE ENDOSOME MEMBRANE | Genes involved in Synthesis of PIPs at the late endosome membrane |
| 0.1 | 2.1 | REACTOME TRANSLOCATION OF ZAP 70 TO IMMUNOLOGICAL SYNAPSE | Genes involved in Translocation of ZAP-70 to Immunological synapse |
| 0.1 | 0.4 | REACTOME HYALURONAN METABOLISM | Genes involved in Hyaluronan metabolism |
| 0.1 | 3.1 | REACTOME PLATELET CALCIUM HOMEOSTASIS | Genes involved in Platelet calcium homeostasis |
| 0.1 | 1.6 | REACTOME THE NLRP3 INFLAMMASOME | Genes involved in The NLRP3 inflammasome |
| 0.1 | 3.7 | REACTOME EFFECTS OF PIP2 HYDROLYSIS | Genes involved in Effects of PIP2 hydrolysis |
| 0.1 | 2.8 | REACTOME FORMATION OF TUBULIN FOLDING INTERMEDIATES BY CCT TRIC | Genes involved in Formation of tubulin folding intermediates by CCT/TriC |
| 0.1 | 0.6 | REACTOME DSCAM INTERACTIONS | Genes involved in DSCAM interactions |
| 0.1 | 1.7 | REACTOME GAP JUNCTION ASSEMBLY | Genes involved in Gap junction assembly |
| 0.1 | 2.1 | REACTOME AMINE COMPOUND SLC TRANSPORTERS | Genes involved in Amine compound SLC transporters |
| 0.1 | 3.6 | REACTOME BASIGIN INTERACTIONS | Genes involved in Basigin interactions |
| 0.1 | 1.1 | REACTOME OXYGEN DEPENDENT PROLINE HYDROXYLATION OF HYPOXIA INDUCIBLE FACTOR ALPHA | Genes involved in Oxygen-dependent Proline Hydroxylation of Hypoxia-inducible Factor Alpha |
| 0.1 | 0.5 | REACTOME ROLE OF SECOND MESSENGERS IN NETRIN1 SIGNALING | Genes involved in Role of second messengers in netrin-1 signaling |
| 0.1 | 0.9 | REACTOME REVERSIBLE HYDRATION OF CARBON DIOXIDE | Genes involved in Reversible Hydration of Carbon Dioxide |
| 0.0 | 4.6 | REACTOME AMINO ACID AND OLIGOPEPTIDE SLC TRANSPORTERS | Genes involved in Amino acid and oligopeptide SLC transporters |
| 0.0 | 1.3 | REACTOME SEMA3A PLEXIN REPULSION SIGNALING BY INHIBITING INTEGRIN ADHESION | Genes involved in SEMA3A-Plexin repulsion signaling by inhibiting Integrin adhesion |
| 0.0 | 0.8 | REACTOME APOPTOSIS INDUCED DNA FRAGMENTATION | Genes involved in Apoptosis induced DNA fragmentation |
| 0.0 | 1.6 | REACTOME RETROGRADE NEUROTROPHIN SIGNALLING | Genes involved in Retrograde neurotrophin signalling |
| 0.0 | 2.3 | REACTOME THROMBIN SIGNALLING THROUGH PROTEINASE ACTIVATED RECEPTORS PARS | Genes involved in Thrombin signalling through proteinase activated receptors (PARs) |
| 0.0 | 2.6 | REACTOME ANTIGEN ACTIVATES B CELL RECEPTOR LEADING TO GENERATION OF SECOND MESSENGERS | Genes involved in Antigen Activates B Cell Receptor Leading to Generation of Second Messengers |
| 0.0 | 3.4 | REACTOME CHEMOKINE RECEPTORS BIND CHEMOKINES | Genes involved in Chemokine receptors bind chemokines |
| 0.0 | 0.4 | REACTOME PRE NOTCH PROCESSING IN GOLGI | Genes involved in Pre-NOTCH Processing in Golgi |
| 0.0 | 0.8 | REACTOME CRMPS IN SEMA3A SIGNALING | Genes involved in CRMPs in Sema3A signaling |
| 0.0 | 0.6 | REACTOME JNK C JUN KINASES PHOSPHORYLATION AND ACTIVATION MEDIATED BY ACTIVATED HUMAN TAK1 | Genes involved in JNK (c-Jun kinases) phosphorylation and activation mediated by activated human TAK1 |
| 0.0 | 1.7 | REACTOME CHOLESTEROL BIOSYNTHESIS | Genes involved in Cholesterol biosynthesis |
| 0.0 | 0.6 | REACTOME ROLE OF DCC IN REGULATING APOPTOSIS | Genes involved in Role of DCC in regulating apoptosis |
| 0.0 | 3.1 | REACTOME VOLTAGE GATED POTASSIUM CHANNELS | Genes involved in Voltage gated Potassium channels |
| 0.0 | 0.7 | REACTOME INHIBITION OF INSULIN SECRETION BY ADRENALINE NORADRENALINE | Genes involved in Inhibition of Insulin Secretion by Adrenaline/Noradrenaline |
| 0.0 | 1.1 | REACTOME PROCESSING OF INTRONLESS PRE MRNAS | Genes involved in Processing of Intronless Pre-mRNAs |
| 0.0 | 0.4 | REACTOME PD1 SIGNALING | Genes involved in PD-1 signaling |
| 0.0 | 0.3 | REACTOME GAP JUNCTION TRAFFICKING | Genes involved in Gap junction trafficking |
| 0.0 | 1.8 | REACTOME G ALPHA Z SIGNALLING EVENTS | Genes involved in G alpha (z) signalling events |
| 0.0 | 1.0 | REACTOME N GLYCAN ANTENNAE ELONGATION | Genes involved in N-Glycan antennae elongation |
| 0.0 | 0.4 | REACTOME REGULATION OF INSULIN SECRETION | Genes involved in Regulation of Insulin Secretion |
| 0.0 | 2.7 | REACTOME TRANSPORT OF INORGANIC CATIONS ANIONS AND AMINO ACIDS OLIGOPEPTIDES | Genes involved in Transport of inorganic cations/anions and amino acids/oligopeptides |
| 0.0 | 0.9 | REACTOME CS DS DEGRADATION | Genes involved in CS/DS degradation |
| 0.0 | 1.5 | REACTOME HS GAG BIOSYNTHESIS | Genes involved in HS-GAG biosynthesis |
| 0.0 | 0.6 | REACTOME ACYL CHAIN REMODELLING OF PS | Genes involved in Acyl chain remodelling of PS |
| 0.0 | 0.6 | REACTOME IL 6 SIGNALING | Genes involved in Interleukin-6 signaling |
| 0.0 | 0.6 | REACTOME NEGATIVE REGULATION OF THE PI3K AKT NETWORK | Genes involved in Negative regulation of the PI3K/AKT network |
| 0.0 | 0.8 | REACTOME P38MAPK EVENTS | Genes involved in p38MAPK events |
| 0.0 | 1.5 | REACTOME CGMP EFFECTS | Genes involved in cGMP effects |
| 0.0 | 0.4 | REACTOME SEROTONIN RECEPTORS | Genes involved in Serotonin receptors |
| 0.0 | 1.0 | REACTOME LYSOSOME VESICLE BIOGENESIS | Genes involved in Lysosome Vesicle Biogenesis |
| 0.0 | 0.1 | REACTOME INHIBITION OF REPLICATION INITIATION OF DAMAGED DNA BY RB1 E2F1 | Genes involved in Inhibition of replication initiation of damaged DNA by RB1/E2F1 |
| 0.0 | 1.4 | REACTOME BMAL1 CLOCK NPAS2 ACTIVATES CIRCADIAN EXPRESSION | Genes involved in BMAL1:CLOCK/NPAS2 Activates Circadian Expression |
| 0.0 | 0.6 | REACTOME KERATAN SULFATE BIOSYNTHESIS | Genes involved in Keratan sulfate biosynthesis |
| 0.0 | 0.3 | REACTOME G PROTEIN ACTIVATION | Genes involved in G-protein activation |
| 0.0 | 0.7 | REACTOME NOTCH HLH TRANSCRIPTION PATHWAY | Genes involved in Notch-HLH transcription pathway |
| 0.0 | 0.6 | REACTOME NOREPINEPHRINE NEUROTRANSMITTER RELEASE CYCLE | Genes involved in Norepinephrine Neurotransmitter Release Cycle |
| 0.0 | 0.3 | REACTOME SEMA3A PAK DEPENDENT AXON REPULSION | Genes involved in Sema3A PAK dependent Axon repulsion |
| 0.0 | 1.3 | REACTOME ABC FAMILY PROTEINS MEDIATED TRANSPORT | Genes involved in ABC-family proteins mediated transport |
| 0.0 | 2.4 | REACTOME IMMUNOREGULATORY INTERACTIONS BETWEEN A LYMPHOID AND A NON LYMPHOID CELL | Genes involved in Immunoregulatory interactions between a Lymphoid and a non-Lymphoid cell |
| 0.0 | 0.7 | REACTOME DCC MEDIATED ATTRACTIVE SIGNALING | Genes involved in DCC mediated attractive signaling |
| 0.0 | 1.2 | REACTOME LIGAND GATED ION CHANNEL TRANSPORT | Genes involved in Ligand-gated ion channel transport |
| 0.0 | 0.3 | REACTOME TRAFFICKING AND PROCESSING OF ENDOSOMAL TLR | Genes involved in Trafficking and processing of endosomal TLR |
| 0.0 | 0.8 | REACTOME SIGNALING BY HIPPO | Genes involved in Signaling by Hippo |
| 0.0 | 0.3 | REACTOME PROCESSING OF CAPPED INTRONLESS PRE MRNA | Genes involved in Processing of Capped Intronless Pre-mRNA |
| 0.0 | 0.7 | REACTOME CA DEPENDENT EVENTS | Genes involved in Ca-dependent events |
| 0.0 | 1.0 | REACTOME SEMA4D IN SEMAPHORIN SIGNALING | Genes involved in Sema4D in semaphorin signaling |
| 0.0 | 0.2 | REACTOME REGULATION OF THE FANCONI ANEMIA PATHWAY | Genes involved in Regulation of the Fanconi anemia pathway |
| 0.0 | 1.4 | REACTOME G1 PHASE | Genes involved in G1 Phase |
| 0.0 | 1.2 | REACTOME NCAM1 INTERACTIONS | Genes involved in NCAM1 interactions |
| 0.0 | 0.6 | REACTOME NETRIN1 SIGNALING | Genes involved in Netrin-1 signaling |
| 0.0 | 4.6 | REACTOME SIGNALING BY RHO GTPASES | Genes involved in Signaling by Rho GTPases |
| 0.0 | 0.3 | REACTOME PASSIVE TRANSPORT BY AQUAPORINS | Genes involved in Passive Transport by Aquaporins |
| 0.0 | 0.3 | REACTOME TGF BETA RECEPTOR SIGNALING IN EMT EPITHELIAL TO MESENCHYMAL TRANSITION | Genes involved in TGF-beta receptor signaling in EMT (epithelial to mesenchymal transition) |
| 0.0 | 0.0 | REACTOME G ALPHA1213 SIGNALLING EVENTS | Genes involved in G alpha (12/13) signalling events |
| 0.0 | 0.3 | REACTOME EICOSANOID LIGAND BINDING RECEPTORS | Genes involved in Eicosanoid ligand-binding receptors |
| 0.0 | 0.6 | REACTOME NEPHRIN INTERACTIONS | Genes involved in Nephrin interactions |
| 0.0 | 0.4 | REACTOME PROLACTIN RECEPTOR SIGNALING | Genes involved in Prolactin receptor signaling |
| 0.0 | 1.3 | REACTOME NOTCH1 INTRACELLULAR DOMAIN REGULATES TRANSCRIPTION | Genes involved in NOTCH1 Intracellular Domain Regulates Transcription |
| 0.0 | 2.0 | REACTOME G ALPHA I SIGNALLING EVENTS | Genes involved in G alpha (i) signalling events |
| 0.0 | 0.4 | REACTOME ACTIVATION OF KAINATE RECEPTORS UPON GLUTAMATE BINDING | Genes involved in Activation of Kainate Receptors upon glutamate binding |
| 0.0 | 0.8 | REACTOME ADHERENS JUNCTIONS INTERACTIONS | Genes involved in Adherens junctions interactions |
| 0.0 | 0.2 | REACTOME THE ROLE OF NEF IN HIV1 REPLICATION AND DISEASE PATHOGENESIS | Genes involved in The role of Nef in HIV-1 replication and disease pathogenesis |
| 0.0 | 0.3 | REACTOME FGFR4 LIGAND BINDING AND ACTIVATION | Genes involved in FGFR4 ligand binding and activation |
| 0.0 | 0.4 | REACTOME SIGNALING BY FGFR | Genes involved in Signaling by FGFR |
| 0.0 | 1.2 | REACTOME INTEGRIN CELL SURFACE INTERACTIONS | Genes involved in Integrin cell surface interactions |
| 0.0 | 1.1 | REACTOME ACTIVATION OF CHAPERONE GENES BY XBP1S | Genes involved in Activation of Chaperone Genes by XBP1(S) |
| 0.0 | 0.3 | REACTOME TERMINATION OF O GLYCAN BIOSYNTHESIS | Genes involved in Termination of O-glycan biosynthesis |
| 0.0 | 0.4 | REACTOME DEPOSITION OF NEW CENPA CONTAINING NUCLEOSOMES AT THE CENTROMERE | Genes involved in Deposition of New CENPA-containing Nucleosomes at the Centromere |
| 0.0 | 0.3 | REACTOME GLUCAGON TYPE LIGAND RECEPTORS | Genes involved in Glucagon-type ligand receptors |
| 0.0 | 0.3 | REACTOME PURINE SALVAGE | Genes involved in Purine salvage |
| 0.0 | 0.4 | REACTOME CONVERSION FROM APC C CDC20 TO APC C CDH1 IN LATE ANAPHASE | Genes involved in Conversion from APC/C:Cdc20 to APC/C:Cdh1 in late anaphase |
| 0.0 | 0.4 | REACTOME EXTRINSIC PATHWAY FOR APOPTOSIS | Genes involved in Extrinsic Pathway for Apoptosis |