Project
Illumina Body Map 2 (GSE30611)
Navigation
Downloads
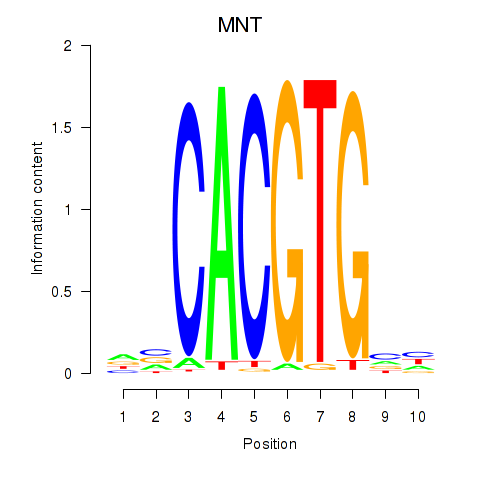
Results for MNT_HEY1_HEY2
Z-value: 1.46
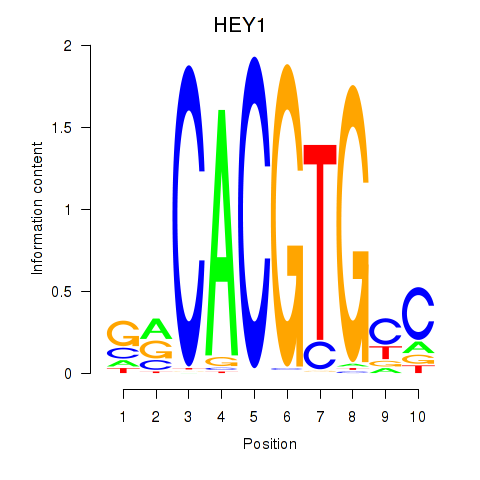
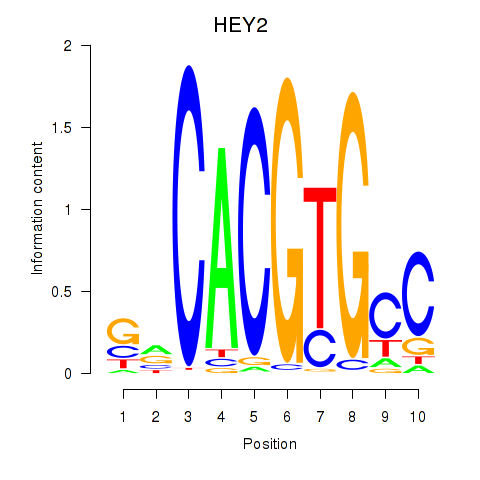
Motif logo
Transcription factors associated with MNT_HEY1_HEY2
| Gene Symbol | Gene ID | Gene Info |
|---|---|---|
|
MNT
|
ENSG00000070444.15 | MAX network transcriptional repressor |
|
HEY1
|
ENSG00000164683.18 | hes related family bHLH transcription factor with YRPW motif 1 |
|
HEY2
|
ENSG00000135547.9 | hes related family bHLH transcription factor with YRPW motif 2 |
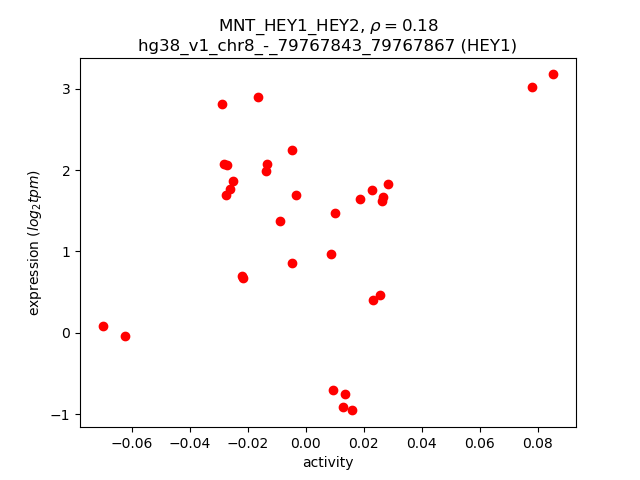
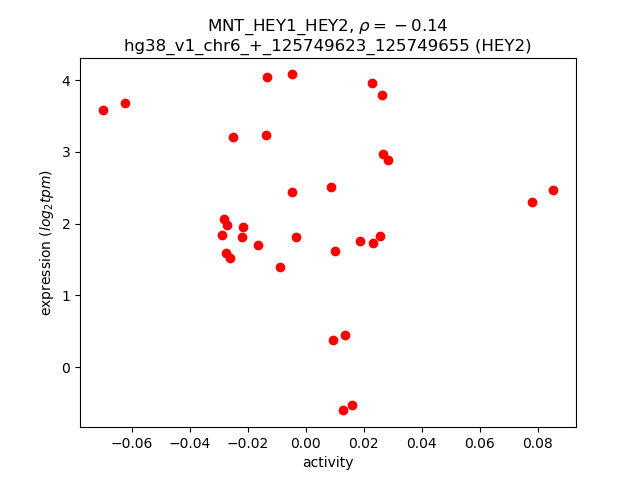
Activity-expression correlation:
| Gene | Promoter | Pearson corr. coef. | P-value | Plot |
|---|---|---|---|---|
| MNT | hg38_v1_chr17_-_2401038_2401104 | -0.22 | 2.3e-01 | Click! |
| HEY1 | hg38_v1_chr8_-_79767843_79767867 | 0.18 | 3.2e-01 | Click! |
| HEY2 | hg38_v1_chr6_+_125749623_125749655 | -0.14 | 4.3e-01 | Click! |
Activity profile of MNT_HEY1_HEY2 motif
Sorted Z-values of MNT_HEY1_HEY2 motif
| Promoter | Log-likelihood | Transcript | Gene | Gene Info |
|---|---|---|---|---|
| chr1_+_236686454 | 8.00 |
ENST00000542672.6
ENST00000366578.6 ENST00000682015.1 ENST00000651275.1 |
ACTN2
|
actinin alpha 2 |
| chr7_+_36389852 | 4.45 |
ENST00000265748.7
|
ANLN
|
anillin actin binding protein |
| chr1_-_241357225 | 4.36 |
ENST00000366565.5
|
RGS7
|
regulator of G protein signaling 7 |
| chr7_+_36389814 | 4.29 |
ENST00000396068.6
|
ANLN
|
anillin actin binding protein |
| chrX_-_13938378 | 4.13 |
ENST00000398361.7
|
GPM6B
|
glycoprotein M6B |
| chr17_-_3696033 | 4.07 |
ENST00000551178.5
ENST00000552276.5 ENST00000547178.5 |
P2RX5
|
purinergic receptor P2X 5 |
| chr1_+_203026481 | 3.85 |
ENST00000367240.6
|
PPFIA4
|
PTPRF interacting protein alpha 4 |
| chr1_+_150282526 | 3.80 |
ENST00000447007.5
ENST00000369095.5 ENST00000369094.5 ENST00000290363.6 |
CIART
|
circadian associated repressor of transcription |
| chrX_+_10158448 | 3.73 |
ENST00000380829.5
ENST00000421085.7 ENST00000674669.1 ENST00000454850.1 |
CLCN4
|
chloride voltage-gated channel 4 |
| chr7_-_44325421 | 3.62 |
ENST00000395747.6
ENST00000347193.8 ENST00000346990.8 ENST00000258682.10 ENST00000353625.8 ENST00000421607.1 ENST00000424197.5 |
CAMK2B
|
calcium/calmodulin dependent protein kinase II beta |
| chr3_-_42264887 | 3.58 |
ENST00000334681.9
|
CCK
|
cholecystokinin |
| chr9_-_137028271 | 3.33 |
ENST00000265662.9
ENST00000371605.7 |
ABCA2
|
ATP binding cassette subfamily A member 2 |
| chr11_-_45286265 | 3.29 |
ENST00000020926.8
|
SYT13
|
synaptotagmin 13 |
| chr17_+_32486975 | 3.24 |
ENST00000313401.4
|
CDK5R1
|
cyclin dependent kinase 5 regulatory subunit 1 |
| chr1_-_241357171 | 3.21 |
ENST00000440928.6
|
RGS7
|
regulator of G protein signaling 7 |
| chrX_+_153056458 | 3.13 |
ENST00000593810.3
|
PNMA3
|
PNMA family member 3 |
| chr17_-_46979240 | 3.10 |
ENST00000322329.5
|
RPRML
|
reprimo like |
| chr22_+_18110802 | 3.06 |
ENST00000330423.8
|
TUBA8
|
tubulin alpha 8 |
| chr2_-_219253909 | 3.05 |
ENST00000248437.9
|
TUBA4A
|
tubulin alpha 4a |
| chrX_-_13938618 | 3.02 |
ENST00000454189.6
|
GPM6B
|
glycoprotein M6B |
| chr1_-_241357085 | 2.99 |
ENST00000366564.5
|
RGS7
|
regulator of G protein signaling 7 |
| chr17_-_3696133 | 2.99 |
ENST00000225328.10
|
P2RX5
|
purinergic receptor P2X 5 |
| chrX_+_153056408 | 2.99 |
ENST00000619635.1
|
PNMA3
|
PNMA family member 3 |
| chr2_+_17540670 | 2.97 |
ENST00000451533.5
ENST00000295156.9 |
VSNL1
|
visinin like 1 |
| chr7_-_44325490 | 2.95 |
ENST00000350811.7
|
CAMK2B
|
calcium/calmodulin dependent protein kinase II beta |
| chr7_-_44325653 | 2.90 |
ENST00000440254.6
|
CAMK2B
|
calcium/calmodulin dependent protein kinase II beta |
| chr17_-_3696198 | 2.90 |
ENST00000345901.7
|
P2RX5
|
purinergic receptor P2X 5 |
| chr20_+_46029165 | 2.84 |
ENST00000616201.4
ENST00000616202.4 ENST00000616933.4 ENST00000626937.2 |
SLC12A5
|
solute carrier family 12 member 5 |
| chr2_+_17539964 | 2.80 |
ENST00000457525.5
|
VSNL1
|
visinin like 1 |
| chr16_+_6483379 | 2.74 |
ENST00000552089.5
|
RBFOX1
|
RNA binding fox-1 homolog 1 |
| chr1_-_25905989 | 2.69 |
ENST00000399728.5
|
STMN1
|
stathmin 1 |
| chr1_-_25906457 | 2.66 |
ENST00000426559.6
|
STMN1
|
stathmin 1 |
| chr1_+_11806213 | 2.63 |
ENST00000376496.4
|
CLCN6
|
chloride voltage-gated channel 6 |
| chr1_-_112956063 | 2.63 |
ENST00000538576.5
ENST00000369626.8 ENST00000458229.6 |
SLC16A1
|
solute carrier family 16 member 1 |
| chrX_-_20116595 | 2.62 |
ENST00000452324.3
|
MAP7D2
|
MAP7 domain containing 2 |
| chr3_+_10816201 | 2.57 |
ENST00000454147.1
ENST00000254488.7 |
SLC6A11
|
solute carrier family 6 member 11 |
| chr22_+_20965108 | 2.53 |
ENST00000399167.6
ENST00000399163.6 |
AIFM3
|
apoptosis inducing factor mitochondria associated 3 |
| chr22_+_18110305 | 2.51 |
ENST00000680175.1
ENST00000426208.5 |
TUBA8
|
tubulin alpha 8 |
| chrX_+_21374608 | 2.41 |
ENST00000644295.1
ENST00000645074.1 ENST00000645791.1 ENST00000643220.1 |
CNKSR2
|
connector enhancer of kinase suppressor of Ras 2 |
| chr1_-_25906411 | 2.39 |
ENST00000455785.7
|
STMN1
|
stathmin 1 |
| chr9_-_137028223 | 2.38 |
ENST00000341511.11
|
ABCA2
|
ATP binding cassette subfamily A member 2 |
| chr16_-_4538819 | 2.34 |
ENST00000564828.5
|
CDIP1
|
cell death inducing p53 target 1 |
| chr16_+_283157 | 2.31 |
ENST00000219406.11
ENST00000404312.5 ENST00000456379.1 |
PDIA2
|
protein disulfide isomerase family A member 2 |
| chr3_+_147409357 | 2.30 |
ENST00000282928.5
|
ZIC1
|
Zic family member 1 |
| chr1_+_11806096 | 2.29 |
ENST00000312413.10
ENST00000346436.11 |
CLCN6
|
chloride voltage-gated channel 6 |
| chr22_+_18110679 | 2.28 |
ENST00000316027.10
|
TUBA8
|
tubulin alpha 8 |
| chr11_-_89065969 | 2.28 |
ENST00000305447.5
|
GRM5
|
glutamate metabotropic receptor 5 |
| chr2_-_50347710 | 2.21 |
ENST00000342183.9
ENST00000401710.5 |
NRXN1
|
neurexin 1 |
| chr2_-_2326161 | 2.19 |
ENST00000649810.1
ENST00000648318.1 |
MYT1L
|
myelin transcription factor 1 like |
| chr1_+_50048014 | 2.16 |
ENST00000448907.7
|
ELAVL4
|
ELAV like RNA binding protein 4 |
| chr14_+_92323154 | 2.13 |
ENST00000532405.6
ENST00000676001.1 ENST00000531433.5 |
SLC24A4
|
solute carrier family 24 member 4 |
| chrX_+_10156960 | 2.11 |
ENST00000380833.9
|
CLCN4
|
chloride voltage-gated channel 4 |
| chr16_-_4538761 | 2.11 |
ENST00000567695.6
ENST00000562334.5 ENST00000562579.5 ENST00000563507.5 |
CDIP1
|
cell death inducing p53 target 1 |
| chr16_+_11668414 | 2.10 |
ENST00000329565.6
|
SNN
|
stannin |
| chr2_-_50347789 | 2.07 |
ENST00000628364.2
|
NRXN1
|
neurexin 1 |
| chr2_-_219253145 | 2.06 |
ENST00000456818.5
ENST00000447205.1 |
TUBA4A
|
tubulin alpha 4a |
| chr9_-_133609325 | 2.06 |
ENST00000673969.1
|
FAM163B
|
family with sequence similarity 163 member B |
| chrX_-_20116871 | 2.06 |
ENST00000379651.7
ENST00000443379.7 ENST00000379643.10 |
MAP7D2
|
MAP7 domain containing 2 |
| chr8_-_53842899 | 2.05 |
ENST00000524234.1
ENST00000521275.5 ENST00000396774.6 |
ATP6V1H
|
ATPase H+ transporting V1 subunit H |
| chr1_+_77281963 | 2.05 |
ENST00000354567.7
|
AK5
|
adenylate kinase 5 |
| chrX_+_21374357 | 2.04 |
ENST00000643841.1
ENST00000379510.5 ENST00000425654.7 ENST00000644798.1 ENST00000543067.6 |
CNKSR2
|
connector enhancer of kinase suppressor of Ras 2 |
| chr7_+_97732046 | 2.02 |
ENST00000350485.8
ENST00000346867.4 ENST00000319273.10 |
TAC1
|
tachykinin precursor 1 |
| chr1_+_209938169 | 2.01 |
ENST00000367019.5
ENST00000537238.5 ENST00000637265.1 |
SYT14
|
synaptotagmin 14 |
| chr3_+_50617390 | 1.98 |
ENST00000457064.1
|
MAPKAPK3
|
MAPK activated protein kinase 3 |
| chr16_+_83968244 | 1.91 |
ENST00000305202.9
|
NECAB2
|
N-terminal EF-hand calcium binding protein 2 |
| chr5_+_176810498 | 1.89 |
ENST00000509580.2
|
UNC5A
|
unc-5 netrin receptor A |
| chr1_-_154220533 | 1.86 |
ENST00000368518.5
ENST00000368519.5 ENST00000368521.10 |
C1orf43
|
chromosome 1 open reading frame 43 |
| chr6_-_70957029 | 1.86 |
ENST00000230053.11
|
B3GAT2
|
beta-1,3-glucuronyltransferase 2 |
| chr12_-_48999363 | 1.86 |
ENST00000421952.3
|
DDN
|
dendrin |
| chr2_-_2326210 | 1.84 |
ENST00000647755.1
|
MYT1L
|
myelin transcription factor 1 like |
| chr8_+_74320832 | 1.79 |
ENST00000676377.1
|
GDAP1
|
ganglioside induced differentiation associated protein 1 |
| chr1_-_154220615 | 1.79 |
ENST00000362076.8
ENST00000350592.7 ENST00000368516.1 ENST00000640799.1 |
C1orf43
|
chromosome 1 open reading frame 43 |
| chr8_-_53843228 | 1.79 |
ENST00000359530.7
|
ATP6V1H
|
ATPase H+ transporting V1 subunit H |
| chr7_+_8433602 | 1.77 |
ENST00000405863.6
|
NXPH1
|
neurexophilin 1 |
| chr12_-_57752106 | 1.74 |
ENST00000547853.1
|
CDK4
|
cyclin dependent kinase 4 |
| chr1_-_154558650 | 1.72 |
ENST00000292211.5
|
UBE2Q1
|
ubiquitin conjugating enzyme E2 Q1 |
| chr20_+_46029206 | 1.71 |
ENST00000243964.7
|
SLC12A5
|
solute carrier family 12 member 5 |
| chr10_-_102241502 | 1.70 |
ENST00000370002.8
|
PITX3
|
paired like homeodomain 3 |
| chrX_+_21374434 | 1.69 |
ENST00000279451.9
ENST00000645245.1 |
CNKSR2
|
connector enhancer of kinase suppressor of Ras 2 |
| chr19_+_4304588 | 1.68 |
ENST00000221856.11
|
FSD1
|
fibronectin type III and SPRY domain containing 1 |
| chr3_+_186930759 | 1.68 |
ENST00000677292.1
ENST00000458216.5 |
ST6GAL1
|
ST6 beta-galactoside alpha-2,6-sialyltransferase 1 |
| chr1_+_214281149 | 1.67 |
ENST00000366957.10
|
SMYD2
|
SET and MYND domain containing 2 |
| chr18_-_24397784 | 1.66 |
ENST00000399441.4
ENST00000319481.8 |
OSBPL1A
|
oxysterol binding protein like 1A |
| chr5_+_176810552 | 1.65 |
ENST00000329542.9
|
UNC5A
|
unc-5 netrin receptor A |
| chr18_+_34976928 | 1.65 |
ENST00000591734.5
ENST00000413393.5 ENST00000589180.5 ENST00000587359.5 |
MAPRE2
|
microtubule associated protein RP/EB family member 2 |
| chr8_+_66493556 | 1.63 |
ENST00000305454.8
ENST00000522977.5 ENST00000480005.1 |
VXN
|
vexin |
| chr17_-_76240289 | 1.62 |
ENST00000647930.1
ENST00000592271.1 ENST00000319945.10 |
RNF157
|
ring finger protein 157 |
| chr19_-_17688326 | 1.60 |
ENST00000552293.5
ENST00000551649.5 ENST00000519716.7 ENST00000550896.1 |
UNC13A
|
unc-13 homolog A |
| chr11_+_125904467 | 1.60 |
ENST00000263576.11
ENST00000530414.5 ENST00000530129.6 |
DDX25
|
DEAD-box helicase 25 |
| chr5_+_112738331 | 1.60 |
ENST00000512211.6
|
APC
|
APC regulator of WNT signaling pathway |
| chr1_-_25906931 | 1.59 |
ENST00000357865.6
|
STMN1
|
stathmin 1 |
| chr8_-_132481057 | 1.58 |
ENST00000388996.10
|
KCNQ3
|
potassium voltage-gated channel subfamily Q member 3 |
| chr2_-_49974083 | 1.57 |
ENST00000636345.1
|
NRXN1
|
neurexin 1 |
| chr12_-_44876294 | 1.56 |
ENST00000429094.7
ENST00000551601.5 ENST00000549027.5 ENST00000452445.6 |
NELL2
|
neural EGFL like 2 |
| chr8_+_74320613 | 1.55 |
ENST00000675821.1
|
GDAP1
|
ganglioside induced differentiation associated protein 1 |
| chr17_-_59106801 | 1.54 |
ENST00000393065.6
ENST00000262294.12 ENST00000393066.7 |
TRIM37
|
tripartite motif containing 37 |
| chrX_+_21374476 | 1.53 |
ENST00000644585.1
|
CNKSR2
|
connector enhancer of kinase suppressor of Ras 2 |
| chr12_-_102917203 | 1.53 |
ENST00000553106.6
ENST00000307000.7 |
PAH
|
phenylalanine hydroxylase |
| chr15_+_74826603 | 1.51 |
ENST00000395018.6
|
CPLX3
|
complexin 3 |
| chr4_+_176065980 | 1.50 |
ENST00000280190.8
|
WDR17
|
WD repeat domain 17 |
| chr19_+_41397803 | 1.50 |
ENST00000269980.7
ENST00000542943.5 ENST00000457836.6 |
BCKDHA
|
branched chain keto acid dehydrogenase E1 subunit alpha |
| chr1_+_150257247 | 1.50 |
ENST00000647854.1
|
CA14
|
carbonic anhydrase 14 |
| chr16_+_981762 | 1.49 |
ENST00000293894.4
|
SOX8
|
SRY-box transcription factor 8 |
| chr12_-_122266410 | 1.48 |
ENST00000451053.3
|
VPS33A
|
VPS33A core subunit of CORVET and HOPS complexes |
| chr19_+_4304632 | 1.48 |
ENST00000597590.5
|
FSD1
|
fibronectin type III and SPRY domain containing 1 |
| chr3_-_184261547 | 1.47 |
ENST00000296238.4
|
CAMK2N2
|
calcium/calmodulin dependent protein kinase II inhibitor 2 |
| chr18_+_34493289 | 1.47 |
ENST00000682923.1
ENST00000596745.5 ENST00000283365.14 ENST00000315456.10 ENST00000598774.6 ENST00000684266.1 ENST00000683092.1 ENST00000683379.1 ENST00000684359.1 |
DTNA
|
dystrobrevin alpha |
| chr5_+_110738983 | 1.45 |
ENST00000355943.8
ENST00000447245.6 |
SLC25A46
|
solute carrier family 25 member 46 |
| chr18_+_35041387 | 1.45 |
ENST00000538170.6
ENST00000300249.10 ENST00000588910.5 |
MAPRE2
|
microtubule associated protein RP/EB family member 2 |
| chr3_-_47578832 | 1.44 |
ENST00000264723.9
ENST00000610462.1 |
CSPG5
|
chondroitin sulfate proteoglycan 5 |
| chr2_-_49974182 | 1.43 |
ENST00000412315.5
ENST00000378262.7 |
NRXN1
|
neurexin 1 |
| chr3_+_186931344 | 1.42 |
ENST00000417392.5
|
ST6GAL1
|
ST6 beta-galactoside alpha-2,6-sialyltransferase 1 |
| chr5_+_112737847 | 1.42 |
ENST00000257430.9
ENST00000508376.6 |
APC
|
APC regulator of WNT signaling pathway |
| chr12_+_71439976 | 1.42 |
ENST00000536515.5
ENST00000540815.2 |
LGR5
|
leucine rich repeat containing G protein-coupled receptor 5 |
| chr18_+_9136757 | 1.40 |
ENST00000262126.9
ENST00000577992.1 |
ANKRD12
|
ankyrin repeat domain 12 |
| chr2_-_49974155 | 1.39 |
ENST00000635519.1
|
NRXN1
|
neurexin 1 |
| chr16_-_81096163 | 1.39 |
ENST00000566566.2
ENST00000569885.6 ENST00000561801.2 ENST00000639689.1 ENST00000638948.1 ENST00000564536.2 ENST00000638192.1 ENST00000640345.1 |
GCSH
ENSG00000260643.2
ENSG00000284512.1
|
glycine cleavage system protein H novel protein novel protein |
| chr7_+_76048036 | 1.39 |
ENST00000461263.2
ENST00000443006.5 ENST00000315758.10 |
MDH2
|
malate dehydrogenase 2 |
| chr8_+_66493514 | 1.36 |
ENST00000521495.5
|
VXN
|
vexin |
| chr3_-_149971200 | 1.35 |
ENST00000498307.5
ENST00000489155.1 |
PFN2
|
profilin 2 |
| chr7_-_37343079 | 1.35 |
ENST00000455879.5
|
ELMO1
|
engulfment and cell motility 1 |
| chr7_-_22356914 | 1.35 |
ENST00000344041.10
|
RAPGEF5
|
Rap guanine nucleotide exchange factor 5 |
| chr11_+_7513768 | 1.35 |
ENST00000528947.5
|
PPFIBP2
|
PPFIA binding protein 2 |
| chr10_+_123666355 | 1.35 |
ENST00000284674.2
|
GPR26
|
G protein-coupled receptor 26 |
| chrX_+_21374288 | 1.33 |
ENST00000642359.1
|
CNKSR2
|
connector enhancer of kinase suppressor of Ras 2 |
| chr18_+_46334007 | 1.33 |
ENST00000269439.12
ENST00000590330.1 |
RNF165
|
ring finger protein 165 |
| chr4_-_6200520 | 1.32 |
ENST00000409021.9
ENST00000409371.8 ENST00000282924.9 ENST00000531445.3 |
JAKMIP1
C4orf50
|
janus kinase and microtubule interacting protein 1 chromosome 4 open reading frame 50 |
| chr3_+_50617119 | 1.32 |
ENST00000430409.5
ENST00000621469.5 ENST00000357955.6 |
MAPKAPK3
|
MAPK activated protein kinase 3 |
| chr19_+_1067144 | 1.32 |
ENST00000313093.7
|
ARHGAP45
|
Rho GTPase activating protein 45 |
| chr10_-_131982006 | 1.31 |
ENST00000368636.8
|
BNIP3
|
BCL2 interacting protein 3 |
| chr2_-_101387453 | 1.31 |
ENST00000324768.6
|
CREG2
|
cellular repressor of E1A stimulated genes 2 |
| chr1_-_109619605 | 1.31 |
ENST00000679935.1
|
GNAT2
|
G protein subunit alpha transducin 2 |
| chr2_+_172556039 | 1.31 |
ENST00000410055.5
ENST00000282077.8 |
PDK1
|
pyruvate dehydrogenase kinase 1 |
| chr22_-_21735776 | 1.31 |
ENST00000339468.8
|
YPEL1
|
yippee like 1 |
| chr17_-_75855204 | 1.31 |
ENST00000589642.5
ENST00000593002.1 ENST00000590221.5 ENST00000587374.5 ENST00000585462.5 ENST00000254806.8 ENST00000433525.6 ENST00000626827.2 |
WBP2
|
WW domain binding protein 2 |
| chr1_-_13513988 | 1.31 |
ENST00000376085.4
|
LRRC38
|
leucine rich repeat containing 38 |
| chr7_+_76048146 | 1.30 |
ENST00000432020.2
|
MDH2
|
malate dehydrogenase 2 |
| chr17_-_76240478 | 1.29 |
ENST00000269391.11
|
RNF157
|
ring finger protein 157 |
| chr18_-_4455282 | 1.29 |
ENST00000315677.8
|
DLGAP1
|
DLG associated protein 1 |
| chr14_-_20461411 | 1.29 |
ENST00000250489.9
|
PIP4P1
|
phosphatidylinositol-4,5-bisphosphate 4-phosphatase 1 |
| chr19_+_1067272 | 1.29 |
ENST00000590214.5
|
ARHGAP45
|
Rho GTPase activating protein 45 |
| chr22_+_20965166 | 1.29 |
ENST00000441376.6
|
AIFM3
|
apoptosis inducing factor mitochondria associated 3 |
| chr19_-_48513919 | 1.29 |
ENST00000650440.1
|
LMTK3
|
lemur tyrosine kinase 3 |
| chr9_+_137877773 | 1.29 |
ENST00000371372.6
ENST00000277551.6 ENST00000277549.9 ENST00000371363.5 ENST00000371355.8 ENST00000371357.5 |
CACNA1B
|
calcium voltage-gated channel subunit alpha1 B |
| chr9_+_109780179 | 1.29 |
ENST00000314527.9
|
PALM2AKAP2
|
PALM2 and AKAP2 fusion |
| chrX_-_15854791 | 1.28 |
ENST00000545766.7
ENST00000380291.5 ENST00000672987.1 ENST00000329235.6 |
AP1S2
|
adaptor related protein complex 1 subunit sigma 2 |
| chr16_-_705726 | 1.28 |
ENST00000397621.6
ENST00000324361.9 |
FBXL16
|
F-box and leucine rich repeat protein 16 |
| chr14_-_20461465 | 1.27 |
ENST00000398020.6
|
PIP4P1
|
phosphatidylinositol-4,5-bisphosphate 4-phosphatase 1 |
| chr19_-_3868993 | 1.27 |
ENST00000674260.1
ENST00000592398.1 ENST00000439086.2 ENST00000262961.9 |
ZFR2
|
zinc finger RNA binding protein 2 |
| chrX_-_15854743 | 1.26 |
ENST00000450644.2
|
AP1S2
|
adaptor related protein complex 1 subunit sigma 2 |
| chr8_+_94895813 | 1.25 |
ENST00000396113.5
|
NDUFAF6
|
NADH:ubiquinone oxidoreductase complex assembly factor 6 |
| chr22_-_50085414 | 1.25 |
ENST00000311597.10
|
MLC1
|
modulator of VRAC current 1 |
| chr19_+_4402685 | 1.25 |
ENST00000585854.1
|
CHAF1A
|
chromatin assembly factor 1 subunit A |
| chr7_-_103989516 | 1.24 |
ENST00000343529.9
ENST00000424685.3 |
RELN
|
reelin |
| chr2_-_169362527 | 1.24 |
ENST00000649046.1
ENST00000443831.1 |
LRP2
|
LDL receptor related protein 2 |
| chr3_-_53046658 | 1.24 |
ENST00000483069.5
|
SFMBT1
|
Scm like with four mbt domains 1 |
| chr4_+_176065827 | 1.23 |
ENST00000508596.6
|
WDR17
|
WD repeat domain 17 |
| chr10_-_45594491 | 1.23 |
ENST00000453980.3
|
MARCHF8
|
membrane associated ring-CH-type finger 8 |
| chr10_+_62374361 | 1.23 |
ENST00000395254.8
|
ZNF365
|
zinc finger protein 365 |
| chr17_-_78128731 | 1.22 |
ENST00000592063.5
ENST00000590602.6 ENST00000589271.5 |
TMC6
|
transmembrane channel like 6 |
| chr8_+_108443601 | 1.22 |
ENST00000524143.5
ENST00000220853.8 |
EMC2
|
ER membrane protein complex subunit 2 |
| chr17_-_60392333 | 1.22 |
ENST00000590133.5
|
USP32
|
ubiquitin specific peptidase 32 |
| chr7_-_37342755 | 1.21 |
ENST00000455119.5
|
ELMO1
|
engulfment and cell motility 1 |
| chr12_-_122266425 | 1.20 |
ENST00000643696.1
ENST00000267199.9 |
VPS33A
|
VPS33A core subunit of CORVET and HOPS complexes |
| chr12_-_89709292 | 1.20 |
ENST00000551310.1
|
ATP2B1
|
ATPase plasma membrane Ca2+ transporting 1 |
| chr9_+_132670013 | 1.20 |
ENST00000483873.6
|
GTF3C4
|
general transcription factor IIIC subunit 4 |
| chr10_-_131981948 | 1.19 |
ENST00000633835.1
|
BNIP3
|
BCL2 interacting protein 3 |
| chr8_-_108083606 | 1.19 |
ENST00000276659.10
|
RSPO2
|
R-spondin 2 |
| chr18_+_34493428 | 1.19 |
ENST00000682483.1
|
DTNA
|
dystrobrevin alpha |
| chr8_+_94895837 | 1.19 |
ENST00000519136.5
|
NDUFAF6
|
NADH:ubiquinone oxidoreductase complex assembly factor 6 |
| chr22_-_36507022 | 1.19 |
ENST00000216187.10
ENST00000397224.9 ENST00000423980.1 |
FOXRED2
|
FAD dependent oxidoreductase domain containing 2 |
| chr10_-_133336862 | 1.19 |
ENST00000368555.3
ENST00000252939.9 ENST00000368558.1 |
CALY
|
calcyon neuron specific vesicular protein |
| chr19_-_8321354 | 1.18 |
ENST00000301457.3
|
NDUFA7
|
NADH:ubiquinone oxidoreductase subunit A7 |
| chr12_+_102957666 | 1.18 |
ENST00000266744.4
|
ASCL1
|
achaete-scute family bHLH transcription factor 1 |
| chr16_+_6483728 | 1.18 |
ENST00000675459.1
ENST00000551752.5 |
RBFOX1
|
RNA binding fox-1 homolog 1 |
| chr2_+_215312028 | 1.17 |
ENST00000236959.14
ENST00000435675.5 |
ATIC
|
5-aminoimidazole-4-carboxamide ribonucleotide formyltransferase/IMP cyclohydrolase |
| chr17_-_60391968 | 1.17 |
ENST00000393003.7
|
USP32
|
ubiquitin specific peptidase 32 |
| chr16_+_89575712 | 1.17 |
ENST00000319518.13
ENST00000268720.9 |
CPNE7
|
copine 7 |
| chr2_-_2326378 | 1.17 |
ENST00000647618.1
|
MYT1L
|
myelin transcription factor 1 like |
| chr17_-_78128630 | 1.16 |
ENST00000306591.11
|
TMC6
|
transmembrane channel like 6 |
| chr22_-_50085331 | 1.16 |
ENST00000395876.6
|
MLC1
|
modulator of VRAC current 1 |
| chr12_+_6724157 | 1.16 |
ENST00000544725.5
|
COPS7A
|
COP9 signalosome subunit 7A |
| chr18_+_34493386 | 1.15 |
ENST00000679936.1
|
DTNA
|
dystrobrevin alpha |
| chr5_+_43602648 | 1.15 |
ENST00000505678.6
ENST00000512422.5 ENST00000264663.9 ENST00000670904.1 ENST00000653251.1 |
NNT
|
nicotinamide nucleotide transhydrogenase |
| chr1_+_109619827 | 1.15 |
ENST00000667949.2
ENST00000342115.8 ENST00000528667.7 |
AMPD2
|
adenosine monophosphate deaminase 2 |
| chr10_-_73874502 | 1.15 |
ENST00000372765.5
ENST00000351293.7 ENST00000441192.2 ENST00000423381.6 |
CAMK2G
|
calcium/calmodulin dependent protein kinase II gamma |
| chr16_+_30065777 | 1.14 |
ENST00000395240.7
ENST00000566846.5 |
ALDOA
|
aldolase, fructose-bisphosphate A |
| chr12_+_116738285 | 1.14 |
ENST00000392549.7
ENST00000407967.7 |
RNFT2
|
ring finger protein, transmembrane 2 |
| chr16_-_1826778 | 1.14 |
ENST00000569339.1
ENST00000397356.8 ENST00000455446.6 ENST00000397353.6 |
HAGH
|
hydroxyacylglutathione hydrolase |
| chr11_-_119381629 | 1.14 |
ENST00000260187.7
ENST00000455332.6 |
USP2
|
ubiquitin specific peptidase 2 |
| chr7_+_43112593 | 1.14 |
ENST00000453890.5
ENST00000395891.7 |
HECW1
|
HECT, C2 and WW domain containing E3 ubiquitin protein ligase 1 |
| chr8_+_94895763 | 1.14 |
ENST00000523378.5
|
NDUFAF6
|
NADH:ubiquinone oxidoreductase complex assembly factor 6 |
| chr19_-_41994217 | 1.14 |
ENST00000648268.1
ENST00000545399.6 |
ATP1A3
|
ATPase Na+/K+ transporting subunit alpha 3 |
| chr7_-_103989649 | 1.13 |
ENST00000428762.6
|
RELN
|
reelin |
| chr7_-_44325577 | 1.13 |
ENST00000395749.7
|
CAMK2B
|
calcium/calmodulin dependent protein kinase II beta |
| chr13_+_27424583 | 1.13 |
ENST00000381140.10
|
GTF3A
|
general transcription factor IIIA |
| chr14_-_81221231 | 1.12 |
ENST00000434192.2
|
GTF2A1
|
general transcription factor IIA subunit 1 |
| chr7_-_44325617 | 1.11 |
ENST00000358707.7
ENST00000457475.5 |
CAMK2B
|
calcium/calmodulin dependent protein kinase II beta |
| chr14_-_91060578 | 1.11 |
ENST00000418736.6
ENST00000614987.5 |
RPS6KA5
|
ribosomal protein S6 kinase A5 |
| chr16_-_2196575 | 1.11 |
ENST00000343516.8
|
CASKIN1
|
CASK interacting protein 1 |
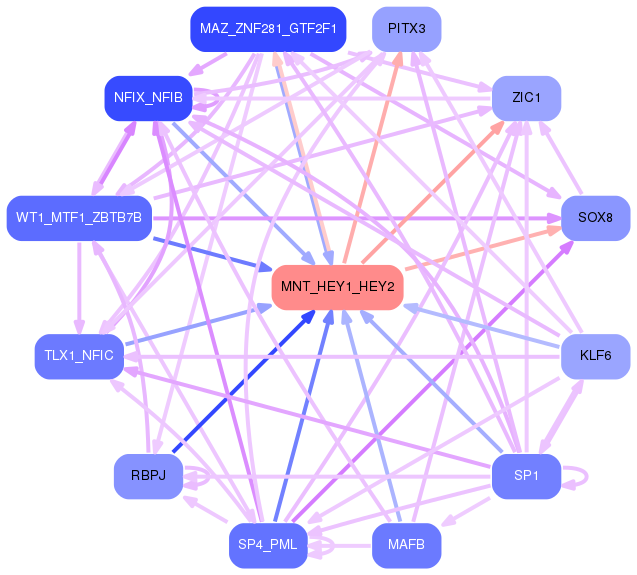
Network of associatons between targets according to the STRING database.

First level regulatory network of MNT_HEY1_HEY2
Gene Ontology Analysis
Gene overrepresentation in biological process category:
| Log-likelihood per target | Total log-likelihood | Term | Description |
|---|---|---|---|
| 2.7 | 8.0 | GO:0051695 | actin filament uncapping(GO:0051695) |
| 2.2 | 8.7 | GO:0000921 | septin ring assembly(GO:0000921) septin ring organization(GO:0031106) |
| 1.3 | 8.9 | GO:0051611 | negative regulation of neurotransmitter uptake(GO:0051581) regulation of serotonin uptake(GO:0051611) negative regulation of serotonin uptake(GO:0051612) |
| 1.2 | 5.0 | GO:0040040 | thermosensory behavior(GO:0040040) |
| 1.1 | 3.2 | GO:0021722 | superior olivary nucleus development(GO:0021718) superior olivary nucleus maturation(GO:0021722) |
| 0.8 | 5.7 | GO:0032380 | regulation of intracellular lipid transport(GO:0032377) regulation of intracellular sterol transport(GO:0032380) regulation of intracellular cholesterol transport(GO:0032383) |
| 0.7 | 10.4 | GO:0070494 | regulation of thrombin receptor signaling pathway(GO:0070494) negative regulation of thrombin receptor signaling pathway(GO:0070495) |
| 0.7 | 2.1 | GO:0006173 | dADP biosynthetic process(GO:0006173) |
| 0.7 | 2.0 | GO:0021529 | spinal cord oligodendrocyte cell differentiation(GO:0021529) spinal cord oligodendrocyte cell fate specification(GO:0021530) |
| 0.7 | 3.3 | GO:0007206 | phospholipase C-activating G-protein coupled glutamate receptor signaling pathway(GO:0007206) |
| 0.6 | 1.9 | GO:0070407 | oxidation-dependent protein catabolic process(GO:0070407) |
| 0.6 | 9.6 | GO:0097116 | gephyrin clustering involved in postsynaptic density assembly(GO:0097116) |
| 0.6 | 1.9 | GO:0042489 | negative regulation of odontogenesis of dentin-containing tooth(GO:0042489) |
| 0.6 | 2.4 | GO:0097477 | lateral motor column neuron migration(GO:0097477) |
| 0.5 | 1.5 | GO:0036353 | histone H2A-K119 monoubiquitination(GO:0036353) |
| 0.5 | 1.8 | GO:0045212 | negative regulation of synaptic transmission, cholinergic(GO:0032223) neurotransmitter receptor biosynthetic process(GO:0045212) |
| 0.5 | 12.9 | GO:0051823 | regulation of synapse structural plasticity(GO:0051823) |
| 0.5 | 1.8 | GO:1901079 | positive regulation of relaxation of muscle(GO:1901079) |
| 0.4 | 0.9 | GO:0051885 | positive regulation of anagen(GO:0051885) |
| 0.4 | 0.9 | GO:0021586 | pons maturation(GO:0021586) |
| 0.4 | 1.6 | GO:0009436 | glyoxylate catabolic process(GO:0009436) |
| 0.4 | 3.6 | GO:0071279 | cellular response to cobalt ion(GO:0071279) |
| 0.4 | 2.0 | GO:0046878 | positive regulation of saliva secretion(GO:0046878) |
| 0.4 | 3.5 | GO:0033564 | anterior/posterior axon guidance(GO:0033564) |
| 0.4 | 1.2 | GO:0046452 | dihydrofolate metabolic process(GO:0046452) |
| 0.4 | 1.9 | GO:1904021 | negative regulation of G-protein coupled receptor internalization(GO:1904021) |
| 0.4 | 1.1 | GO:0051596 | methylglyoxal catabolic process to D-lactate via S-lactoyl-glutathione(GO:0019243) methylglyoxal catabolic process(GO:0051596) methylglyoxal catabolic process to lactate(GO:0061727) |
| 0.4 | 1.5 | GO:0006175 | adenosine salvage(GO:0006169) dATP biosynthetic process(GO:0006175) |
| 0.4 | 1.5 | GO:0060018 | astrocyte fate commitment(GO:0060018) retinal rod cell differentiation(GO:0060221) |
| 0.4 | 1.4 | GO:0090149 | mitochondrial membrane fission(GO:0090149) |
| 0.4 | 2.2 | GO:0006740 | NADPH regeneration(GO:0006740) |
| 0.4 | 0.7 | GO:0003358 | noradrenergic neuron development(GO:0003358) |
| 0.3 | 1.7 | GO:1904933 | regulation of cell proliferation in midbrain(GO:1904933) |
| 0.3 | 3.4 | GO:0014718 | positive regulation of satellite cell activation involved in skeletal muscle regeneration(GO:0014718) |
| 0.3 | 1.0 | GO:1902771 | regulation of choline O-acetyltransferase activity(GO:1902769) positive regulation of choline O-acetyltransferase activity(GO:1902771) negative regulation of tau-protein kinase activity(GO:1902948) positive regulation of early endosome to recycling endosome transport(GO:1902955) negative regulation of aspartic-type endopeptidase activity involved in amyloid precursor protein catabolic process(GO:1902960) negative regulation of neurofibrillary tangle assembly(GO:1902997) negative regulation of aspartic-type peptidase activity(GO:1905246) |
| 0.3 | 1.9 | GO:0019464 | glycine catabolic process(GO:0006546) glycine decarboxylation via glycine cleavage system(GO:0019464) |
| 0.3 | 1.9 | GO:0019509 | L-methionine biosynthetic process from methylthioadenosine(GO:0019509) |
| 0.3 | 1.5 | GO:0061034 | olfactory bulb mitral cell layer development(GO:0061034) |
| 0.3 | 0.9 | GO:0019858 | cytosine metabolic process(GO:0019858) |
| 0.3 | 0.9 | GO:0097106 | postsynaptic density organization(GO:0097106) |
| 0.3 | 2.6 | GO:0035879 | plasma membrane lactate transport(GO:0035879) |
| 0.3 | 0.3 | GO:0035106 | operant conditioning(GO:0035106) |
| 0.3 | 5.4 | GO:0045475 | locomotor rhythm(GO:0045475) |
| 0.3 | 11.8 | GO:0035590 | purinergic nucleotide receptor signaling pathway(GO:0035590) |
| 0.3 | 0.8 | GO:0006391 | transcription initiation from mitochondrial promoter(GO:0006391) |
| 0.3 | 1.1 | GO:1902683 | regulation of receptor localization to synapse(GO:1902683) |
| 0.3 | 4.1 | GO:0006108 | malate metabolic process(GO:0006108) |
| 0.3 | 0.8 | GO:0006407 | rRNA export from nucleus(GO:0006407) |
| 0.3 | 1.1 | GO:0035606 | peptidyl-cysteine S-trans-nitrosylation(GO:0035606) |
| 0.3 | 1.3 | GO:0033058 | directional locomotion(GO:0033058) |
| 0.3 | 0.3 | GO:1904378 | maintenance of unfolded protein(GO:0036506) maintenance of unfolded protein involved in ERAD pathway(GO:1904378) |
| 0.3 | 0.5 | GO:2001245 | regulation of phosphatidylcholine biosynthetic process(GO:2001245) |
| 0.3 | 2.6 | GO:1904781 | positive regulation of protein localization to centrosome(GO:1904781) |
| 0.3 | 1.0 | GO:1901624 | negative regulation of lymphocyte chemotaxis(GO:1901624) |
| 0.3 | 1.5 | GO:0048631 | regulation of skeletal muscle tissue growth(GO:0048631) |
| 0.3 | 1.3 | GO:1904764 | negative regulation of fibril organization(GO:1902904) chaperone-mediated autophagy translocation complex disassembly(GO:1904764) |
| 0.2 | 2.9 | GO:0006621 | protein retention in ER lumen(GO:0006621) |
| 0.2 | 1.6 | GO:1900451 | positive regulation of glutamate receptor signaling pathway(GO:1900451) |
| 0.2 | 0.7 | GO:1990641 | response to iron ion starvation(GO:1990641) |
| 0.2 | 1.1 | GO:0019427 | acetate biosynthetic process(GO:0019413) acetyl-CoA biosynthetic process from acetate(GO:0019427) propionate biosynthetic process(GO:0019542) |
| 0.2 | 1.3 | GO:0043988 | histone H3-S28 phosphorylation(GO:0043988) |
| 0.2 | 0.7 | GO:0006864 | pyrimidine nucleotide transport(GO:0006864) mitochondrial pyrimidine nucleotide import(GO:1990519) |
| 0.2 | 1.5 | GO:0099558 | maintenance of synapse structure(GO:0099558) |
| 0.2 | 1.5 | GO:0099566 | regulation of postsynaptic cytosolic calcium ion concentration(GO:0099566) |
| 0.2 | 0.6 | GO:0045554 | TRAIL biosynthetic process(GO:0045553) regulation of TRAIL biosynthetic process(GO:0045554) positive regulation of TRAIL biosynthetic process(GO:0045556) |
| 0.2 | 0.6 | GO:0006059 | hexitol metabolic process(GO:0006059) |
| 0.2 | 0.6 | GO:0035568 | N-terminal peptidyl-alanine methylation(GO:0018011) N-terminal peptidyl-alanine trimethylation(GO:0018012) N-terminal peptidyl-glycine methylation(GO:0018013) N-terminal peptidyl-proline dimethylation(GO:0018016) peptidyl-alanine modification(GO:0018194) N-terminal peptidyl-proline methylation(GO:0035568) N-terminal peptidyl-serine methylation(GO:0035570) N-terminal peptidyl-serine dimethylation(GO:0035572) N-terminal peptidyl-serine trimethylation(GO:0035573) |
| 0.2 | 1.3 | GO:0061762 | CAMKK-AMPK signaling cascade(GO:0061762) |
| 0.2 | 3.3 | GO:0044351 | macropinocytosis(GO:0044351) |
| 0.2 | 0.6 | GO:0032877 | positive regulation of DNA endoreduplication(GO:0032877) |
| 0.2 | 2.7 | GO:0060075 | regulation of resting membrane potential(GO:0060075) |
| 0.2 | 0.2 | GO:0071816 | tail-anchored membrane protein insertion into ER membrane(GO:0071816) |
| 0.2 | 0.8 | GO:0019470 | 4-hydroxyproline catabolic process(GO:0019470) |
| 0.2 | 0.6 | GO:0072720 | response to dithiothreitol(GO:0072720) |
| 0.2 | 4.2 | GO:0010510 | regulation of acetyl-CoA biosynthetic process from pyruvate(GO:0010510) regulation of acyl-CoA biosynthetic process(GO:0050812) |
| 0.2 | 3.6 | GO:0032099 | negative regulation of response to food(GO:0032096) negative regulation of appetite(GO:0032099) |
| 0.2 | 0.8 | GO:0002032 | desensitization of G-protein coupled receptor protein signaling pathway by arrestin(GO:0002032) |
| 0.2 | 3.2 | GO:0000338 | protein deneddylation(GO:0000338) |
| 0.2 | 3.5 | GO:0047484 | regulation of response to osmotic stress(GO:0047484) |
| 0.2 | 1.1 | GO:0035523 | protein K29-linked deubiquitination(GO:0035523) |
| 0.2 | 2.6 | GO:0035524 | proline transmembrane transport(GO:0035524) |
| 0.2 | 1.1 | GO:0071051 | polyadenylation-dependent snoRNA 3'-end processing(GO:0071051) |
| 0.2 | 0.5 | GO:2000813 | negative regulation of barbed-end actin filament capping(GO:2000813) |
| 0.2 | 1.6 | GO:2000973 | regulation of pro-B cell differentiation(GO:2000973) |
| 0.2 | 0.5 | GO:0060730 | regulation of intestinal epithelial structure maintenance(GO:0060730) |
| 0.2 | 0.7 | GO:0039534 | negative regulation of MDA-5 signaling pathway(GO:0039534) |
| 0.2 | 0.7 | GO:1902544 | regulation of DNA N-glycosylase activity(GO:1902544) |
| 0.2 | 1.0 | GO:0051138 | positive regulation of NK T cell differentiation(GO:0051138) |
| 0.2 | 10.9 | GO:1903959 | regulation of anion transmembrane transport(GO:1903959) |
| 0.2 | 0.8 | GO:0002328 | pro-B cell differentiation(GO:0002328) |
| 0.2 | 1.3 | GO:0090238 | positive regulation of arachidonic acid secretion(GO:0090238) |
| 0.2 | 1.1 | GO:0008295 | spermidine biosynthetic process(GO:0008295) |
| 0.2 | 0.8 | GO:0050893 | sensory processing(GO:0050893) |
| 0.2 | 0.8 | GO:0046167 | glycerol-3-phosphate biosynthetic process(GO:0046167) |
| 0.2 | 1.9 | GO:0006189 | 'de novo' IMP biosynthetic process(GO:0006189) |
| 0.2 | 1.3 | GO:0071442 | positive regulation of histone H3-K14 acetylation(GO:0071442) |
| 0.2 | 0.6 | GO:0019355 | nicotinamide nucleotide biosynthetic process from aspartate(GO:0019355) 'de novo' NAD biosynthetic process from aspartate(GO:0034628) |
| 0.2 | 0.2 | GO:0010730 | negative regulation of hydrogen peroxide biosynthetic process(GO:0010730) |
| 0.2 | 1.1 | GO:0006120 | mitochondrial electron transport, NADH to ubiquinone(GO:0006120) |
| 0.2 | 1.5 | GO:0008063 | Toll signaling pathway(GO:0008063) |
| 0.2 | 1.7 | GO:0033299 | secretion of lysosomal enzymes(GO:0033299) |
| 0.2 | 0.5 | GO:0050975 | sensory perception of touch(GO:0050975) detection of mechanical stimulus involved in sensory perception of touch(GO:0050976) cellular response to alkaline pH(GO:0071469) |
| 0.2 | 1.1 | GO:0035616 | histone H2B conserved C-terminal lysine deubiquitination(GO:0035616) |
| 0.2 | 8.7 | GO:0033572 | transferrin transport(GO:0033572) |
| 0.2 | 0.5 | GO:0036090 | cleavage furrow ingression(GO:0036090) |
| 0.1 | 1.6 | GO:0034723 | DNA replication-dependent nucleosome assembly(GO:0006335) DNA replication-dependent nucleosome organization(GO:0034723) |
| 0.1 | 4.0 | GO:0009713 | catechol-containing compound biosynthetic process(GO:0009713) catecholamine biosynthetic process(GO:0042423) |
| 0.1 | 0.4 | GO:1902595 | regulation of DNA replication origin binding(GO:1902595) |
| 0.1 | 1.9 | GO:0042998 | positive regulation of Golgi to plasma membrane protein transport(GO:0042998) |
| 0.1 | 0.7 | GO:1903630 | regulation of aminoacyl-tRNA ligase activity(GO:1903630) |
| 0.1 | 1.4 | GO:0042791 | 5S class rRNA transcription from RNA polymerase III type 1 promoter(GO:0042791) tRNA transcription from RNA polymerase III promoter(GO:0042797) |
| 0.1 | 0.4 | GO:0070902 | mitochondrial tRNA pseudouridine synthesis(GO:0070902) |
| 0.1 | 0.6 | GO:2001206 | positive regulation of osteoclast development(GO:2001206) |
| 0.1 | 1.5 | GO:0006552 | leucine catabolic process(GO:0006552) |
| 0.1 | 2.1 | GO:0034058 | endosomal vesicle fusion(GO:0034058) |
| 0.1 | 2.4 | GO:0030043 | actin filament fragmentation(GO:0030043) |
| 0.1 | 0.6 | GO:0019074 | viral genome packaging(GO:0019072) viral RNA genome packaging(GO:0019074) |
| 0.1 | 0.4 | GO:0043504 | mitochondrial DNA repair(GO:0043504) |
| 0.1 | 0.4 | GO:1990785 | response to water-immersion restraint stress(GO:1990785) |
| 0.1 | 1.9 | GO:0019368 | fatty acid elongation, saturated fatty acid(GO:0019367) fatty acid elongation, unsaturated fatty acid(GO:0019368) fatty acid elongation, monounsaturated fatty acid(GO:0034625) fatty acid elongation, polyunsaturated fatty acid(GO:0034626) |
| 0.1 | 1.2 | GO:0051725 | protein de-ADP-ribosylation(GO:0051725) |
| 0.1 | 0.4 | GO:0006167 | AMP biosynthetic process(GO:0006167) |
| 0.1 | 1.3 | GO:0089711 | L-glutamate transmembrane transport(GO:0089711) |
| 0.1 | 1.2 | GO:0071386 | cellular response to corticosterone stimulus(GO:0071386) |
| 0.1 | 0.5 | GO:0016256 | N-glycan processing to lysosome(GO:0016256) |
| 0.1 | 0.5 | GO:0036116 | medium-chain fatty-acyl-CoA catabolic process(GO:0036114) long-chain fatty-acyl-CoA catabolic process(GO:0036116) palmitic acid metabolic process(GO:1900533) palmitic acid biosynthetic process(GO:1900535) |
| 0.1 | 0.6 | GO:0006500 | N-terminal protein palmitoylation(GO:0006500) |
| 0.1 | 0.4 | GO:0090365 | regulation of mRNA modification(GO:0090365) |
| 0.1 | 2.6 | GO:0015812 | gamma-aminobutyric acid transport(GO:0015812) |
| 0.1 | 2.4 | GO:0030388 | fructose 1,6-bisphosphate metabolic process(GO:0030388) |
| 0.1 | 0.7 | GO:0033133 | positive regulation of glucokinase activity(GO:0033133) positive regulation of hexokinase activity(GO:1903301) |
| 0.1 | 1.8 | GO:0070327 | thyroid hormone transport(GO:0070327) |
| 0.1 | 0.4 | GO:0007314 | oocyte construction(GO:0007308) oocyte axis specification(GO:0007309) oocyte anterior/posterior axis specification(GO:0007314) pole plasm assembly(GO:0007315) maternal determination of anterior/posterior axis, embryo(GO:0008358) P granule organization(GO:0030719) |
| 0.1 | 1.1 | GO:1990253 | cellular response to leucine starvation(GO:1990253) |
| 0.1 | 0.1 | GO:0098917 | retrograde trans-synaptic signaling(GO:0098917) |
| 0.1 | 2.2 | GO:0035751 | regulation of lysosomal lumen pH(GO:0035751) |
| 0.1 | 10.2 | GO:0048791 | calcium ion-regulated exocytosis of neurotransmitter(GO:0048791) |
| 0.1 | 0.6 | GO:0045113 | regulation of integrin biosynthetic process(GO:0045113) |
| 0.1 | 0.5 | GO:0086048 | membrane depolarization during bundle of His cell action potential(GO:0086048) |
| 0.1 | 1.0 | GO:0008343 | adult feeding behavior(GO:0008343) |
| 0.1 | 1.3 | GO:0006188 | IMP biosynthetic process(GO:0006188) IMP salvage(GO:0032264) |
| 0.1 | 1.3 | GO:0002759 | regulation of antimicrobial humoral response(GO:0002759) |
| 0.1 | 1.9 | GO:0060155 | platelet dense granule organization(GO:0060155) |
| 0.1 | 0.3 | GO:2000588 | positive regulation of platelet-derived growth factor receptor-beta signaling pathway(GO:2000588) |
| 0.1 | 5.2 | GO:0035774 | positive regulation of insulin secretion involved in cellular response to glucose stimulus(GO:0035774) |
| 0.1 | 1.3 | GO:0070131 | positive regulation of mitochondrial translation(GO:0070131) |
| 0.1 | 0.3 | GO:0043438 | acetoacetic acid metabolic process(GO:0043438) |
| 0.1 | 0.1 | GO:0002085 | inhibition of neuroepithelial cell differentiation(GO:0002085) |
| 0.1 | 0.3 | GO:0030576 | Cajal body organization(GO:0030576) |
| 0.1 | 0.5 | GO:0051643 | endoplasmic reticulum localization(GO:0051643) |
| 0.1 | 1.7 | GO:0070459 | prolactin secretion(GO:0070459) |
| 0.1 | 0.9 | GO:0030242 | pexophagy(GO:0030242) |
| 0.1 | 3.4 | GO:0071305 | cellular response to vitamin D(GO:0071305) |
| 0.1 | 0.1 | GO:0045082 | positive regulation of interleukin-10 biosynthetic process(GO:0045082) |
| 0.1 | 0.6 | GO:0009233 | menaquinone metabolic process(GO:0009233) |
| 0.1 | 0.9 | GO:0035494 | SNARE complex disassembly(GO:0035494) |
| 0.1 | 0.4 | GO:0021882 | regulation of transcription from RNA polymerase II promoter involved in forebrain neuron fate commitment(GO:0021882) cerebral cortex GABAergic interneuron fate commitment(GO:0021893) positive regulation of neural retina development(GO:0061075) positive regulation of retina development in camera-type eye(GO:1902868) positive regulation of amacrine cell differentiation(GO:1902871) |
| 0.1 | 0.5 | GO:0002572 | pro-T cell differentiation(GO:0002572) regulation of pro-T cell differentiation(GO:2000174) positive regulation of pro-T cell differentiation(GO:2000176) |
| 0.1 | 0.1 | GO:0006104 | succinyl-CoA metabolic process(GO:0006104) |
| 0.1 | 1.3 | GO:0010968 | regulation of microtubule nucleation(GO:0010968) |
| 0.1 | 0.4 | GO:0060295 | regulation of cilium movement involved in cell motility(GO:0060295) regulation of cilium beat frequency involved in ciliary motility(GO:0060296) regulation of cilium-dependent cell motility(GO:1902019) |
| 0.1 | 0.4 | GO:0072429 | response to intra-S DNA damage checkpoint signaling(GO:0072429) |
| 0.1 | 0.7 | GO:0043461 | proton-transporting ATP synthase complex assembly(GO:0043461) proton-transporting ATP synthase complex biogenesis(GO:0070272) |
| 0.1 | 0.3 | GO:0044725 | chromatin reprogramming in the zygote(GO:0044725) |
| 0.1 | 0.6 | GO:0070778 | L-aspartate transport(GO:0070778) L-aspartate transmembrane transport(GO:0089712) |
| 0.1 | 1.3 | GO:1903818 | positive regulation of voltage-gated potassium channel activity(GO:1903818) |
| 0.1 | 0.8 | GO:0006499 | N-terminal protein lipidation(GO:0006498) N-terminal protein myristoylation(GO:0006499) |
| 0.1 | 0.1 | GO:0030432 | peristalsis(GO:0030432) |
| 0.1 | 0.2 | GO:0006072 | glycerol-3-phosphate metabolic process(GO:0006072) |
| 0.1 | 1.7 | GO:0018026 | peptidyl-lysine monomethylation(GO:0018026) |
| 0.1 | 1.6 | GO:0042754 | negative regulation of circadian rhythm(GO:0042754) |
| 0.1 | 0.5 | GO:0010157 | response to chlorate(GO:0010157) |
| 0.1 | 0.8 | GO:1901525 | negative regulation of macromitophagy(GO:1901525) |
| 0.1 | 1.5 | GO:1903764 | regulation of voltage-gated potassium channel activity involved in ventricular cardiac muscle cell action potential repolarization(GO:1903760) regulation of potassium ion export across plasma membrane(GO:1903764) |
| 0.1 | 0.4 | GO:0061394 | regulation of transcription from RNA polymerase II promoter in response to arsenic-containing substance(GO:0061394) |
| 0.1 | 0.4 | GO:0099612 | protein localization to axon(GO:0099612) |
| 0.1 | 2.0 | GO:0060081 | membrane hyperpolarization(GO:0060081) |
| 0.1 | 0.9 | GO:0071502 | cellular response to temperature stimulus(GO:0071502) |
| 0.1 | 1.2 | GO:0007196 | adenylate cyclase-inhibiting G-protein coupled glutamate receptor signaling pathway(GO:0007196) |
| 0.1 | 0.4 | GO:0021773 | striatal medium spiny neuron differentiation(GO:0021773) lymphoid lineage cell migration(GO:0097534) lymphoid lineage cell migration into thymus(GO:0097535) |
| 0.1 | 0.4 | GO:0090383 | phagosome acidification(GO:0090383) |
| 0.1 | 0.5 | GO:0000960 | mitochondrial RNA catabolic process(GO:0000957) regulation of mitochondrial RNA catabolic process(GO:0000960) |
| 0.1 | 1.4 | GO:2001013 | epithelial cell proliferation involved in renal tubule morphogenesis(GO:2001013) |
| 0.1 | 0.5 | GO:0043137 | DNA replication, removal of RNA primer(GO:0043137) |
| 0.1 | 0.2 | GO:2001280 | positive regulation of prostaglandin biosynthetic process(GO:0031394) positive regulation of unsaturated fatty acid biosynthetic process(GO:2001280) |
| 0.1 | 0.6 | GO:0006535 | cysteine biosynthetic process from serine(GO:0006535) |
| 0.1 | 0.3 | GO:1902259 | regulation of delayed rectifier potassium channel activity(GO:1902259) |
| 0.1 | 0.9 | GO:0098735 | positive regulation of the force of heart contraction(GO:0098735) |
| 0.1 | 2.1 | GO:0071786 | endoplasmic reticulum tubular network organization(GO:0071786) |
| 0.1 | 5.2 | GO:0050690 | regulation of defense response to virus by virus(GO:0050690) |
| 0.1 | 1.6 | GO:0070050 | neuron cellular homeostasis(GO:0070050) |
| 0.1 | 2.2 | GO:1901897 | regulation of relaxation of cardiac muscle(GO:1901897) |
| 0.1 | 1.0 | GO:0016926 | protein desumoylation(GO:0016926) |
| 0.1 | 0.9 | GO:0000160 | phosphorelay signal transduction system(GO:0000160) |
| 0.1 | 0.6 | GO:0034316 | negative regulation of Arp2/3 complex-mediated actin nucleation(GO:0034316) |
| 0.1 | 0.5 | GO:0098838 | reduced folate transmembrane transport(GO:0098838) |
| 0.1 | 1.0 | GO:0051036 | regulation of endosome size(GO:0051036) |
| 0.1 | 1.0 | GO:0007256 | activation of JNKK activity(GO:0007256) |
| 0.1 | 1.8 | GO:1904816 | positive regulation of protein localization to chromosome, telomeric region(GO:1904816) |
| 0.1 | 0.2 | GO:0001543 | ovarian follicle rupture(GO:0001543) |
| 0.1 | 0.8 | GO:0015860 | purine nucleoside transmembrane transport(GO:0015860) |
| 0.1 | 1.0 | GO:1904322 | response to forskolin(GO:1904321) cellular response to forskolin(GO:1904322) |
| 0.1 | 1.6 | GO:0034587 | piRNA metabolic process(GO:0034587) |
| 0.1 | 1.7 | GO:1902260 | negative regulation of delayed rectifier potassium channel activity(GO:1902260) |
| 0.1 | 1.2 | GO:0098719 | sodium ion import(GO:0097369) sodium ion import across plasma membrane(GO:0098719) sodium ion import into cell(GO:1990118) |
| 0.1 | 0.8 | GO:0006572 | tyrosine catabolic process(GO:0006572) |
| 0.1 | 0.3 | GO:0015910 | peroxisomal long-chain fatty acid import(GO:0015910) |
| 0.1 | 0.3 | GO:0007386 | compartment pattern specification(GO:0007386) |
| 0.1 | 1.3 | GO:0009642 | response to light intensity(GO:0009642) |
| 0.1 | 2.1 | GO:0006054 | N-acetylneuraminate metabolic process(GO:0006054) |
| 0.1 | 0.5 | GO:0098828 | positive regulation of inhibitory postsynaptic potential(GO:0097151) modulation of inhibitory postsynaptic potential(GO:0098828) |
| 0.1 | 0.8 | GO:0046959 | habituation(GO:0046959) |
| 0.1 | 0.4 | GO:0060474 | positive regulation of sperm motility involved in capacitation(GO:0060474) |
| 0.1 | 0.4 | GO:0006772 | thiamine metabolic process(GO:0006772) |
| 0.1 | 0.3 | GO:0031120 | snRNA pseudouridine synthesis(GO:0031120) |
| 0.1 | 0.6 | GO:0009086 | methionine biosynthetic process(GO:0009086) |
| 0.1 | 3.9 | GO:0014047 | glutamate secretion(GO:0014047) |
| 0.1 | 0.4 | GO:0043366 | beta selection(GO:0043366) |
| 0.1 | 1.1 | GO:0002175 | protein localization to paranode region of axon(GO:0002175) |
| 0.1 | 1.8 | GO:2000300 | regulation of synaptic vesicle exocytosis(GO:2000300) |
| 0.1 | 1.5 | GO:2000766 | negative regulation of cytoplasmic translation(GO:2000766) |
| 0.1 | 3.9 | GO:0007274 | neuromuscular synaptic transmission(GO:0007274) |
| 0.1 | 3.6 | GO:0048665 | neuron fate specification(GO:0048665) |
| 0.1 | 0.3 | GO:1902809 | regulation of skeletal muscle fiber differentiation(GO:1902809) |
| 0.1 | 0.4 | GO:0033274 | response to vitamin B2(GO:0033274) heterochromatin maintenance(GO:0070829) |
| 0.1 | 2.8 | GO:0007628 | adult walking behavior(GO:0007628) |
| 0.1 | 0.2 | GO:1904861 | excitatory synapse assembly(GO:1904861) |
| 0.1 | 0.2 | GO:0035445 | borate transmembrane transport(GO:0035445) borate transport(GO:0046713) |
| 0.1 | 2.1 | GO:0097186 | amelogenesis(GO:0097186) |
| 0.1 | 1.4 | GO:0046928 | regulation of neurotransmitter secretion(GO:0046928) |
| 0.1 | 0.1 | GO:1901383 | negative regulation of chorionic trophoblast cell proliferation(GO:1901383) |
| 0.1 | 0.3 | GO:0061580 | colon epithelial cell migration(GO:0061580) |
| 0.1 | 0.7 | GO:0051388 | positive regulation of neurotrophin TRK receptor signaling pathway(GO:0051388) |
| 0.1 | 0.2 | GO:0061743 | motor learning(GO:0061743) |
| 0.1 | 1.0 | GO:0033617 | mitochondrial respiratory chain complex IV assembly(GO:0033617) |
| 0.1 | 0.2 | GO:0009720 | detection of hormone stimulus(GO:0009720) |
| 0.1 | 0.6 | GO:0008050 | female courtship behavior(GO:0008050) |
| 0.1 | 0.2 | GO:2000276 | negative regulation of oxidative phosphorylation uncoupler activity(GO:2000276) |
| 0.1 | 5.9 | GO:0010257 | NADH dehydrogenase complex assembly(GO:0010257) mitochondrial respiratory chain complex I assembly(GO:0032981) mitochondrial respiratory chain complex I biogenesis(GO:0097031) |
| 0.1 | 0.1 | GO:0016476 | regulation of embryonic cell shape(GO:0016476) |
| 0.1 | 0.2 | GO:0098904 | regulation of AV node cell action potential(GO:0098904) |
| 0.1 | 0.6 | GO:0003228 | atrial cardiac muscle tissue development(GO:0003228) atrial cardiac muscle tissue morphogenesis(GO:0055009) |
| 0.1 | 0.3 | GO:0035617 | stress granule disassembly(GO:0035617) |
| 0.1 | 0.8 | GO:0043117 | positive regulation of vascular permeability(GO:0043117) |
| 0.1 | 0.1 | GO:0018171 | peptidyl-cysteine oxidation(GO:0018171) |
| 0.1 | 0.4 | GO:0030311 | poly-N-acetyllactosamine biosynthetic process(GO:0030311) |
| 0.1 | 1.0 | GO:0021702 | cerebellar Purkinje cell layer formation(GO:0021694) cerebellar Purkinje cell differentiation(GO:0021702) |
| 0.1 | 1.3 | GO:0006975 | DNA damage induced protein phosphorylation(GO:0006975) |
| 0.1 | 1.2 | GO:0050862 | positive regulation of T cell receptor signaling pathway(GO:0050862) |
| 0.1 | 1.3 | GO:0001504 | neurotransmitter uptake(GO:0001504) |
| 0.1 | 1.5 | GO:0009083 | branched-chain amino acid catabolic process(GO:0009083) |
| 0.1 | 0.2 | GO:0019483 | beta-alanine biosynthetic process(GO:0019483) |
| 0.1 | 0.3 | GO:0060399 | positive regulation of growth hormone receptor signaling pathway(GO:0060399) |
| 0.1 | 0.5 | GO:0031119 | tRNA pseudouridine synthesis(GO:0031119) |
| 0.1 | 0.2 | GO:0033499 | galactose catabolic process via UDP-galactose(GO:0033499) |
| 0.1 | 3.5 | GO:0050650 | chondroitin sulfate proteoglycan biosynthetic process(GO:0050650) |
| 0.1 | 0.3 | GO:0070858 | negative regulation of bile acid biosynthetic process(GO:0070858) negative regulation of bile acid metabolic process(GO:1904252) |
| 0.1 | 1.2 | GO:0016446 | somatic hypermutation of immunoglobulin genes(GO:0016446) |
| 0.1 | 0.2 | GO:0048842 | positive regulation of axon extension involved in axon guidance(GO:0048842) |
| 0.1 | 1.7 | GO:0015671 | oxygen transport(GO:0015671) |
| 0.1 | 0.2 | GO:1902594 | viral penetration into host nucleus(GO:0075732) multi-organism nuclear import(GO:1902594) |
| 0.1 | 1.4 | GO:0006895 | Golgi to endosome transport(GO:0006895) |
| 0.1 | 0.1 | GO:0015911 | plasma membrane long-chain fatty acid transport(GO:0015911) |
| 0.1 | 0.2 | GO:1904640 | response to methionine(GO:1904640) |
| 0.1 | 0.2 | GO:0071344 | diphosphate metabolic process(GO:0071344) |
| 0.1 | 0.2 | GO:0002949 | tRNA threonylcarbamoyladenosine modification(GO:0002949) |
| 0.1 | 0.7 | GO:0072319 | synaptic vesicle uncoating(GO:0016191) vesicle uncoating(GO:0072319) |
| 0.1 | 1.2 | GO:0043374 | CD8-positive, alpha-beta T cell differentiation(GO:0043374) |
| 0.1 | 1.4 | GO:0007097 | nuclear migration(GO:0007097) |
| 0.1 | 0.2 | GO:0003331 | regulation of extracellular matrix constituent secretion(GO:0003330) positive regulation of extracellular matrix constituent secretion(GO:0003331) |
| 0.1 | 0.2 | GO:1903464 | negative regulation of mitotic cell cycle DNA replication(GO:1903464) |
| 0.1 | 0.1 | GO:1905247 | regulation of aspartic-type endopeptidase activity involved in amyloid precursor protein catabolic process(GO:1902959) positive regulation of aspartic-type endopeptidase activity involved in amyloid precursor protein catabolic process(GO:1902961) regulation of aspartic-type peptidase activity(GO:1905245) positive regulation of aspartic-type peptidase activity(GO:1905247) |
| 0.1 | 1.1 | GO:0034975 | protein folding in endoplasmic reticulum(GO:0034975) |
| 0.1 | 0.2 | GO:1990086 | lens fiber cell apoptotic process(GO:1990086) |
| 0.1 | 0.4 | GO:0021853 | cerebral cortex GABAergic interneuron migration(GO:0021853) interneuron migration(GO:1904936) |
| 0.0 | 0.3 | GO:0051012 | microtubule sliding(GO:0051012) |
| 0.0 | 0.2 | GO:0015770 | disaccharide transport(GO:0015766) sucrose transport(GO:0015770) oligosaccharide transport(GO:0015772) |
| 0.0 | 0.8 | GO:0000290 | deadenylation-dependent decapping of nuclear-transcribed mRNA(GO:0000290) |
| 0.0 | 0.0 | GO:0051958 | methotrexate transport(GO:0051958) |
| 0.0 | 0.4 | GO:0042426 | choline catabolic process(GO:0042426) |
| 0.0 | 0.3 | GO:0006642 | triglyceride mobilization(GO:0006642) |
| 0.0 | 0.1 | GO:0044806 | G-quadruplex DNA unwinding(GO:0044806) |
| 0.0 | 1.0 | GO:0048265 | response to pain(GO:0048265) |
| 0.0 | 0.4 | GO:0046604 | positive regulation of mitotic centrosome separation(GO:0046604) |
| 0.0 | 0.7 | GO:0035020 | regulation of Rac protein signal transduction(GO:0035020) |
| 0.0 | 0.3 | GO:0030836 | positive regulation of actin filament depolymerization(GO:0030836) |
| 0.0 | 0.1 | GO:0043622 | cortical microtubule organization(GO:0043622) establishment of centrosome localization(GO:0051660) |
| 0.0 | 0.7 | GO:2000507 | positive regulation of energy homeostasis(GO:2000507) |
| 0.0 | 2.1 | GO:0060384 | innervation(GO:0060384) |
| 0.0 | 0.7 | GO:0002726 | positive regulation of T cell cytokine production(GO:0002726) |
| 0.0 | 0.8 | GO:0014877 | response to muscle inactivity involved in regulation of muscle adaptation(GO:0014877) response to denervation involved in regulation of muscle adaptation(GO:0014894) |
| 0.0 | 1.2 | GO:0006590 | thyroid hormone generation(GO:0006590) |
| 0.0 | 0.2 | GO:2000672 | negative regulation of motor neuron apoptotic process(GO:2000672) |
| 0.0 | 4.5 | GO:0042771 | intrinsic apoptotic signaling pathway in response to DNA damage by p53 class mediator(GO:0042771) |
| 0.0 | 0.6 | GO:0098535 | de novo centriole assembly(GO:0098535) |
| 0.0 | 0.2 | GO:0071963 | establishment or maintenance of cell polarity regulating cell shape(GO:0071963) |
| 0.0 | 0.3 | GO:0010587 | miRNA catabolic process(GO:0010587) |
| 0.0 | 0.9 | GO:0042417 | dopamine metabolic process(GO:0042417) |
| 0.0 | 0.3 | GO:2000210 | positive regulation of anoikis(GO:2000210) |
| 0.0 | 0.2 | GO:2000182 | regulation of progesterone biosynthetic process(GO:2000182) |
| 0.0 | 0.2 | GO:0045065 | cytotoxic T cell differentiation(GO:0045065) |
| 0.0 | 0.6 | GO:0061088 | regulation of sequestering of zinc ion(GO:0061088) |
| 0.0 | 0.4 | GO:0035860 | glial cell-derived neurotrophic factor receptor signaling pathway(GO:0035860) |
| 0.0 | 0.0 | GO:1901856 | negative regulation of cellular respiration(GO:1901856) |
| 0.0 | 1.7 | GO:0009303 | rRNA transcription(GO:0009303) |
| 0.0 | 0.6 | GO:0001976 | neurological system process involved in regulation of systemic arterial blood pressure(GO:0001976) |
| 0.0 | 0.1 | GO:0014736 | regulation of muscle atrophy(GO:0014735) negative regulation of muscle atrophy(GO:0014736) response to injury involved in regulation of muscle adaptation(GO:0014876) |
| 0.0 | 0.4 | GO:0006659 | phosphatidylserine biosynthetic process(GO:0006659) |
| 0.0 | 0.4 | GO:0035965 | cardiolipin acyl-chain remodeling(GO:0035965) |
| 0.0 | 0.4 | GO:0070314 | G1 to G0 transition(GO:0070314) |
| 0.0 | 0.8 | GO:0036148 | phosphatidylglycerol acyl-chain remodeling(GO:0036148) |
| 0.0 | 0.5 | GO:0030050 | vesicle transport along actin filament(GO:0030050) |
| 0.0 | 0.2 | GO:0007296 | vitellogenesis(GO:0007296) |
| 0.0 | 0.1 | GO:0006286 | base-excision repair, base-free sugar-phosphate removal(GO:0006286) telomere maintenance via base-excision repair(GO:0097698) |
| 0.0 | 0.6 | GO:2000774 | positive regulation of cellular senescence(GO:2000774) |
| 0.0 | 0.6 | GO:0048172 | regulation of short-term neuronal synaptic plasticity(GO:0048172) |
| 0.0 | 0.8 | GO:0071361 | cellular response to ethanol(GO:0071361) |
| 0.0 | 0.6 | GO:0040032 | post-embryonic body morphogenesis(GO:0040032) |
| 0.0 | 0.3 | GO:0044565 | dendritic cell proliferation(GO:0044565) |
| 0.0 | 0.4 | GO:0090204 | protein localization to nuclear pore(GO:0090204) |
| 0.0 | 0.2 | GO:1900122 | B cell proliferation involved in immune response(GO:0002322) positive regulation of receptor binding(GO:1900122) |
| 0.0 | 0.6 | GO:0003322 | pancreatic A cell development(GO:0003322) |
| 0.0 | 0.4 | GO:0008612 | peptidyl-lysine modification to peptidyl-hypusine(GO:0008612) |
| 0.0 | 0.1 | GO:0032289 | central nervous system myelin formation(GO:0032289) |
| 0.0 | 0.9 | GO:0006744 | ubiquinone biosynthetic process(GO:0006744) quinone biosynthetic process(GO:1901663) |
| 0.0 | 0.3 | GO:0032966 | negative regulation of collagen biosynthetic process(GO:0032966) |
| 0.0 | 0.1 | GO:0001831 | trophectodermal cellular morphogenesis(GO:0001831) |
| 0.0 | 1.5 | GO:0032012 | regulation of ARF protein signal transduction(GO:0032012) |
| 0.0 | 1.3 | GO:0048873 | homeostasis of number of cells within a tissue(GO:0048873) |
| 0.0 | 0.5 | GO:0033578 | protein glycosylation in Golgi(GO:0033578) |
| 0.0 | 0.0 | GO:2001268 | negative regulation of cysteine-type endopeptidase activity involved in apoptotic signaling pathway(GO:2001268) |
| 0.0 | 0.2 | GO:0097428 | protein maturation by iron-sulfur cluster transfer(GO:0097428) |
| 0.0 | 0.7 | GO:0035090 | maintenance of apical/basal cell polarity(GO:0035090) maintenance of epithelial cell apical/basal polarity(GO:0045199) |
| 0.0 | 0.3 | GO:2000773 | negative regulation of cellular senescence(GO:2000773) |
| 0.0 | 0.1 | GO:0003050 | regulation of systemic arterial blood pressure by atrial natriuretic peptide(GO:0003050) |
| 0.0 | 0.2 | GO:0055011 | atrial cardiac muscle cell differentiation(GO:0055011) atrial cardiac muscle cell development(GO:0055014) |
| 0.0 | 0.8 | GO:0016254 | preassembly of GPI anchor in ER membrane(GO:0016254) |
| 0.0 | 0.4 | GO:0036444 | calcium ion transmembrane import into mitochondrion(GO:0036444) |
| 0.0 | 0.4 | GO:0006268 | DNA unwinding involved in DNA replication(GO:0006268) |
| 0.0 | 0.1 | GO:2000819 | regulation of nucleotide-excision repair(GO:2000819) |
| 0.0 | 0.2 | GO:1904263 | positive regulation of TORC1 signaling(GO:1904263) |
| 0.0 | 1.5 | GO:0006699 | bile acid biosynthetic process(GO:0006699) |
| 0.0 | 0.1 | GO:0090158 | endoplasmic reticulum membrane organization(GO:0090158) |
| 0.0 | 0.1 | GO:0051083 | 'de novo' cotranslational protein folding(GO:0051083) |
| 0.0 | 0.8 | GO:2000651 | positive regulation of sodium ion transmembrane transporter activity(GO:2000651) |
| 0.0 | 1.2 | GO:0042953 | lipoprotein transport(GO:0042953) lipoprotein localization(GO:0044872) |
| 0.0 | 0.2 | GO:0090241 | negative regulation of histone H4 acetylation(GO:0090241) |
| 0.0 | 0.7 | GO:0060314 | regulation of ryanodine-sensitive calcium-release channel activity(GO:0060314) |
| 0.0 | 0.7 | GO:0019371 | cyclooxygenase pathway(GO:0019371) |
| 0.0 | 2.7 | GO:0035722 | interleukin-12-mediated signaling pathway(GO:0035722) cellular response to interleukin-12(GO:0071349) |
| 0.0 | 1.2 | GO:0072332 | intrinsic apoptotic signaling pathway by p53 class mediator(GO:0072332) |
| 0.0 | 0.2 | GO:0042262 | DNA protection(GO:0042262) |
| 0.0 | 1.4 | GO:0061178 | regulation of insulin secretion involved in cellular response to glucose stimulus(GO:0061178) |
| 0.0 | 0.8 | GO:0006099 | tricarboxylic acid cycle(GO:0006099) |
| 0.0 | 0.3 | GO:0060050 | positive regulation of protein glycosylation(GO:0060050) |
| 0.0 | 0.2 | GO:0006983 | ER overload response(GO:0006983) |
| 0.0 | 1.6 | GO:0032728 | positive regulation of interferon-beta production(GO:0032728) |
| 0.0 | 3.9 | GO:0010923 | negative regulation of phosphatase activity(GO:0010923) |
| 0.0 | 0.1 | GO:1990504 | dense core granule exocytosis(GO:1990504) |
| 0.0 | 0.4 | GO:0070389 | chaperone cofactor-dependent protein refolding(GO:0070389) |
| 0.0 | 0.3 | GO:0070560 | protein secretion by platelet(GO:0070560) |
| 0.0 | 0.4 | GO:0072540 | T-helper 17 cell lineage commitment(GO:0072540) |
| 0.0 | 0.1 | GO:0035853 | chromosome passenger complex localization to spindle midzone(GO:0035853) |
| 0.0 | 0.3 | GO:0035434 | copper ion transmembrane transport(GO:0035434) |
| 0.0 | 0.2 | GO:0030885 | regulation of myeloid dendritic cell activation(GO:0030885) |
| 0.0 | 0.2 | GO:0002031 | G-protein coupled receptor internalization(GO:0002031) |
| 0.0 | 1.3 | GO:0090004 | positive regulation of establishment of protein localization to plasma membrane(GO:0090004) |
| 0.0 | 0.1 | GO:2001270 | regulation of cysteine-type endopeptidase activity involved in execution phase of apoptosis(GO:2001270) negative regulation of cysteine-type endopeptidase activity involved in execution phase of apoptosis(GO:2001271) |
| 0.0 | 0.4 | GO:0010499 | proteasomal ubiquitin-independent protein catabolic process(GO:0010499) |
| 0.0 | 0.5 | GO:0007144 | female meiosis I(GO:0007144) |
| 0.0 | 1.2 | GO:0050850 | positive regulation of calcium-mediated signaling(GO:0050850) |
| 0.0 | 0.1 | GO:1901097 | negative regulation of autophagosome maturation(GO:1901097) |
| 0.0 | 0.1 | GO:1903070 | negative regulation of ER-associated ubiquitin-dependent protein catabolic process(GO:1903070) |
| 0.0 | 0.1 | GO:0071372 | cellular response to follicle-stimulating hormone stimulus(GO:0071372) |
| 0.0 | 0.1 | GO:0034553 | respiratory chain complex II assembly(GO:0034552) mitochondrial respiratory chain complex II assembly(GO:0034553) mitochondrial respiratory chain complex II biogenesis(GO:0097032) |
| 0.0 | 0.1 | GO:1903286 | regulation of potassium ion import(GO:1903286) |
| 0.0 | 0.1 | GO:0006003 | fructose 2,6-bisphosphate metabolic process(GO:0006003) |
| 0.0 | 0.6 | GO:0007638 | mechanosensory behavior(GO:0007638) |
| 0.0 | 0.3 | GO:0000056 | ribosomal small subunit export from nucleus(GO:0000056) |
| 0.0 | 0.1 | GO:1904529 | regulation of actin filament binding(GO:1904529) regulation of actin binding(GO:1904616) |
| 0.0 | 0.5 | GO:0043457 | regulation of cellular respiration(GO:0043457) |
| 0.0 | 0.1 | GO:0097680 | double-strand break repair via classical nonhomologous end joining(GO:0097680) |
| 0.0 | 0.2 | GO:1900118 | negative regulation of execution phase of apoptosis(GO:1900118) |
| 0.0 | 0.8 | GO:0048663 | neuron fate commitment(GO:0048663) |
| 0.0 | 0.6 | GO:2000001 | regulation of DNA damage checkpoint(GO:2000001) |
| 0.0 | 0.2 | GO:0070127 | tRNA aminoacylation for mitochondrial protein translation(GO:0070127) |
| 0.0 | 0.6 | GO:0007413 | axonal fasciculation(GO:0007413) |
| 0.0 | 0.2 | GO:0072092 | ureteric bud invasion(GO:0072092) |
| 0.0 | 0.2 | GO:0051121 | hepoxilin metabolic process(GO:0051121) hepoxilin biosynthetic process(GO:0051122) |
| 0.0 | 0.1 | GO:0070662 | mast cell proliferation(GO:0070662) |
| 0.0 | 1.3 | GO:0032007 | negative regulation of TOR signaling(GO:0032007) |
| 0.0 | 0.3 | GO:0097688 | AMPA glutamate receptor clustering(GO:0097113) glutamate receptor clustering(GO:0097688) |
| 0.0 | 0.4 | GO:2000074 | regulation of type B pancreatic cell development(GO:2000074) |
| 0.0 | 0.1 | GO:2000312 | regulation of kainate selective glutamate receptor activity(GO:2000312) |
| 0.0 | 0.2 | GO:1904153 | negative regulation of protein exit from endoplasmic reticulum(GO:0070862) negative regulation of retrograde protein transport, ER to cytosol(GO:1904153) |
| 0.0 | 0.1 | GO:0000711 | meiotic DNA repair synthesis(GO:0000711) |
| 0.0 | 0.1 | GO:0045875 | negative regulation of sister chromatid cohesion(GO:0045875) |
| 0.0 | 2.8 | GO:0070125 | mitochondrial translational elongation(GO:0070125) |
| 0.0 | 0.2 | GO:0051152 | positive regulation of smooth muscle cell differentiation(GO:0051152) |
| 0.0 | 1.7 | GO:0071277 | cellular response to calcium ion(GO:0071277) |
| 0.0 | 0.3 | GO:0045955 | negative regulation of calcium ion-dependent exocytosis(GO:0045955) |
| 0.0 | 0.3 | GO:0007191 | adenylate cyclase-activating dopamine receptor signaling pathway(GO:0007191) |
| 0.0 | 0.1 | GO:0042796 | snRNA transcription from RNA polymerase III promoter(GO:0042796) |
| 0.0 | 0.3 | GO:0008090 | retrograde axonal transport(GO:0008090) |
| 0.0 | 0.9 | GO:0045746 | negative regulation of Notch signaling pathway(GO:0045746) |
| 0.0 | 0.1 | GO:0071557 | histone H3-K27 demethylation(GO:0071557) |
| 0.0 | 0.4 | GO:0014029 | neural crest formation(GO:0014029) |
| 0.0 | 0.2 | GO:0097154 | GABAergic neuron differentiation(GO:0097154) |
| 0.0 | 0.2 | GO:1902018 | negative regulation of cilium assembly(GO:1902018) |
| 0.0 | 1.4 | GO:0051491 | positive regulation of filopodium assembly(GO:0051491) |
| 0.0 | 0.3 | GO:0021859 | pyramidal neuron differentiation(GO:0021859) |
| 0.0 | 1.2 | GO:0006735 | NADH regeneration(GO:0006735) glycolytic process through fructose-6-phosphate(GO:0061615) glycolytic process through glucose-6-phosphate(GO:0061620) canonical glycolysis(GO:0061621) glucose catabolic process to pyruvate(GO:0061718) |
| 0.0 | 0.2 | GO:0018230 | peptidyl-L-cysteine S-palmitoylation(GO:0018230) peptidyl-S-diacylglycerol-L-cysteine biosynthetic process from peptidyl-cysteine(GO:0018231) |
| 0.0 | 0.9 | GO:0035176 | social behavior(GO:0035176) intraspecies interaction between organisms(GO:0051703) |
| 0.0 | 1.4 | GO:0048635 | negative regulation of muscle organ development(GO:0048635) |
| 0.0 | 2.3 | GO:0007218 | neuropeptide signaling pathway(GO:0007218) |
| 0.0 | 0.4 | GO:0003222 | ventricular trabecula myocardium morphogenesis(GO:0003222) |
| 0.0 | 0.1 | GO:0035865 | cellular response to potassium ion(GO:0035865) |
| 0.0 | 0.3 | GO:0006450 | regulation of translational fidelity(GO:0006450) |
| 0.0 | 0.0 | GO:1902174 | positive regulation of keratinocyte apoptotic process(GO:1902174) |
| 0.0 | 0.2 | GO:0016344 | meiotic chromosome movement towards spindle pole(GO:0016344) |
| 0.0 | 0.6 | GO:0008608 | attachment of spindle microtubules to kinetochore(GO:0008608) |
| 0.0 | 0.1 | GO:0045657 | positive regulation of monocyte differentiation(GO:0045657) |
| 0.0 | 0.3 | GO:0043011 | myeloid dendritic cell differentiation(GO:0043011) |
| 0.0 | 0.2 | GO:2000786 | positive regulation of autophagosome assembly(GO:2000786) |
| 0.0 | 0.9 | GO:0007520 | myoblast fusion(GO:0007520) |
| 0.0 | 0.2 | GO:0050482 | arachidonic acid secretion(GO:0050482) arachidonate transport(GO:1903963) |
| 0.0 | 0.3 | GO:0015074 | DNA integration(GO:0015074) |
| 0.0 | 0.7 | GO:0045577 | regulation of B cell differentiation(GO:0045577) |
| 0.0 | 0.8 | GO:0006688 | glycosphingolipid biosynthetic process(GO:0006688) |
| 0.0 | 0.3 | GO:0045835 | negative regulation of meiotic nuclear division(GO:0045835) |
| 0.0 | 1.1 | GO:0001541 | ovarian follicle development(GO:0001541) |
| 0.0 | 0.2 | GO:0051549 | positive regulation of keratinocyte migration(GO:0051549) |
| 0.0 | 0.4 | GO:0090331 | negative regulation of platelet aggregation(GO:0090331) |
| 0.0 | 0.6 | GO:0000729 | DNA double-strand break processing(GO:0000729) |
| 0.0 | 0.1 | GO:1902361 | mitochondrial pyruvate transport(GO:0006850) mitochondrial pyruvate transmembrane transport(GO:1902361) |
| 0.0 | 0.1 | GO:1903337 | positive regulation of vacuolar transport(GO:1903337) |
| 0.0 | 0.2 | GO:0051013 | microtubule severing(GO:0051013) |
| 0.0 | 0.5 | GO:0070584 | mitochondrion morphogenesis(GO:0070584) |
| 0.0 | 0.1 | GO:0000821 | regulation of arginine metabolic process(GO:0000821) |
| 0.0 | 0.2 | GO:0042048 | olfactory behavior(GO:0042048) |
| 0.0 | 0.2 | GO:1902748 | melanocyte migration(GO:0097324) positive regulation of lens fiber cell differentiation(GO:1902748) regulation of melanosome organization(GO:1903056) |
| 0.0 | 0.4 | GO:0055003 | cardiac myofibril assembly(GO:0055003) |
| 0.0 | 0.2 | GO:0050774 | negative regulation of dendrite morphogenesis(GO:0050774) |
| 0.0 | 0.2 | GO:0006677 | glycosylceramide metabolic process(GO:0006677) |
| 0.0 | 0.8 | GO:0046473 | phosphatidic acid metabolic process(GO:0046473) |
| 0.0 | 0.3 | GO:0033173 | calcineurin-NFAT signaling cascade(GO:0033173) |
| 0.0 | 0.2 | GO:0070475 | rRNA base methylation(GO:0070475) |
| 0.0 | 0.5 | GO:0006750 | glutathione biosynthetic process(GO:0006750) |
| 0.0 | 0.2 | GO:0007135 | meiosis II(GO:0007135) |
| 0.0 | 0.2 | GO:0002291 | T cell activation via T cell receptor contact with antigen bound to MHC molecule on antigen presenting cell(GO:0002291) |
| 0.0 | 0.3 | GO:0051601 | exocyst localization(GO:0051601) |
| 0.0 | 0.1 | GO:0018344 | protein geranylgeranylation(GO:0018344) |
| 0.0 | 0.3 | GO:0015816 | glycine transport(GO:0015816) |
| 0.0 | 0.3 | GO:0034498 | early endosome to Golgi transport(GO:0034498) |
| 0.0 | 2.2 | GO:0097194 | execution phase of apoptosis(GO:0097194) |
| 0.0 | 0.1 | GO:0002024 | diet induced thermogenesis(GO:0002024) |
| 0.0 | 0.5 | GO:0034063 | stress granule assembly(GO:0034063) |
| 0.0 | 0.4 | GO:2000785 | regulation of autophagosome assembly(GO:2000785) |
| 0.0 | 0.1 | GO:0006741 | NADP biosynthetic process(GO:0006741) |
| 0.0 | 0.2 | GO:0030953 | astral microtubule organization(GO:0030953) |
| 0.0 | 0.2 | GO:0051014 | actin filament severing(GO:0051014) |
| 0.0 | 0.1 | GO:0071871 | response to epinephrine(GO:0071871) |
| 0.0 | 0.7 | GO:0046847 | filopodium assembly(GO:0046847) |
| 0.0 | 0.3 | GO:0045899 | positive regulation of RNA polymerase II transcriptional preinitiation complex assembly(GO:0045899) |
| 0.0 | 0.1 | GO:2000311 | regulation of alpha-amino-3-hydroxy-5-methyl-4-isoxazole propionate selective glutamate receptor activity(GO:2000311) |
| 0.0 | 0.1 | GO:0019236 | response to pheromone(GO:0019236) |
| 0.0 | 0.2 | GO:0030951 | establishment or maintenance of microtubule cytoskeleton polarity(GO:0030951) |
| 0.0 | 0.2 | GO:0008535 | respiratory chain complex IV assembly(GO:0008535) |
| 0.0 | 0.1 | GO:0021562 | vestibulocochlear nerve development(GO:0021562) |
| 0.0 | 0.3 | GO:0050860 | negative regulation of T cell receptor signaling pathway(GO:0050860) |
| 0.0 | 0.1 | GO:0016240 | autophagosome docking(GO:0016240) |
| 0.0 | 0.2 | GO:0021554 | optic nerve development(GO:0021554) |
| 0.0 | 0.1 | GO:0006449 | regulation of translational termination(GO:0006449) |
| 0.0 | 0.4 | GO:0006465 | signal peptide processing(GO:0006465) |
| 0.0 | 0.3 | GO:0045943 | positive regulation of transcription from RNA polymerase I promoter(GO:0045943) |
| 0.0 | 0.2 | GO:0015919 | peroxisomal membrane transport(GO:0015919) protein import into peroxisome membrane(GO:0045046) |
| 0.0 | 0.4 | GO:0048268 | clathrin coat assembly(GO:0048268) |
| 0.0 | 0.1 | GO:0090344 | negative regulation of cell aging(GO:0090344) |
| 0.0 | 0.2 | GO:0060965 | negative regulation of gene silencing by miRNA(GO:0060965) |
| 0.0 | 0.7 | GO:0034260 | negative regulation of GTPase activity(GO:0034260) |
| 0.0 | 0.2 | GO:0008340 | determination of adult lifespan(GO:0008340) |
| 0.0 | 0.1 | GO:0035750 | protein localization to myelin sheath abaxonal region(GO:0035750) |
| 0.0 | 0.1 | GO:0070213 | protein auto-ADP-ribosylation(GO:0070213) |
| 0.0 | 0.4 | GO:0050962 | detection of light stimulus involved in visual perception(GO:0050908) detection of light stimulus involved in sensory perception(GO:0050962) |
| 0.0 | 0.2 | GO:0042753 | positive regulation of circadian rhythm(GO:0042753) |
| 0.0 | 0.2 | GO:0016255 | attachment of GPI anchor to protein(GO:0016255) |
| 0.0 | 0.1 | GO:1902307 | protein glutathionylation(GO:0010731) regulation of protein glutathionylation(GO:0010732) negative regulation of protein glutathionylation(GO:0010734) positive regulation of sodium ion transmembrane transport(GO:1902307) regulation of sodium ion export(GO:1903273) positive regulation of sodium ion export(GO:1903275) regulation of sodium ion export from cell(GO:1903276) positive regulation of sodium ion export from cell(GO:1903278) |
| 0.0 | 0.4 | GO:0007099 | centriole replication(GO:0007099) |
| 0.0 | 0.2 | GO:0043402 | glucocorticoid mediated signaling pathway(GO:0043402) |
| 0.0 | 0.5 | GO:0034243 | regulation of transcription elongation from RNA polymerase II promoter(GO:0034243) |
| 0.0 | 0.2 | GO:2000369 | regulation of clathrin-mediated endocytosis(GO:2000369) |
| 0.0 | 0.3 | GO:0006646 | phosphatidylethanolamine biosynthetic process(GO:0006646) |
| 0.0 | 0.2 | GO:0001829 | trophectodermal cell differentiation(GO:0001829) |
| 0.0 | 0.2 | GO:0034770 | histone H4-K20 methylation(GO:0034770) |
| 0.0 | 0.0 | GO:0097010 | eukaryotic translation initiation factor 4F complex assembly(GO:0097010) |
| 0.0 | 0.6 | GO:0046839 | phospholipid dephosphorylation(GO:0046839) |
| 0.0 | 0.0 | GO:0090410 | malonate catabolic process(GO:0090410) |
| 0.0 | 0.2 | GO:0014898 | muscle hypertrophy in response to stress(GO:0003299) cardiac muscle adaptation(GO:0014887) cardiac muscle hypertrophy in response to stress(GO:0014898) |
| 0.0 | 0.5 | GO:0007214 | gamma-aminobutyric acid signaling pathway(GO:0007214) |
| 0.0 | 0.2 | GO:0043248 | proteasome assembly(GO:0043248) |
| 0.0 | 0.0 | GO:0035038 | female pronucleus assembly(GO:0035038) |
| 0.0 | 0.1 | GO:0051415 | interphase microtubule nucleation by interphase microtubule organizing center(GO:0051415) microtubule nucleation by microtubule organizing center(GO:0051418) |
| 0.0 | 0.1 | GO:0035878 | nail development(GO:0035878) |
| 0.0 | 0.0 | GO:0046621 | negative regulation of organ growth(GO:0046621) |
| 0.0 | 0.2 | GO:2000144 | positive regulation of DNA-templated transcription, initiation(GO:2000144) |
| 0.0 | 0.0 | GO:0098534 | centriole assembly(GO:0098534) |
| 0.0 | 0.0 | GO:0010983 | positive regulation of high-density lipoprotein particle clearance(GO:0010983) |
| 0.0 | 0.1 | GO:0044341 | sodium-dependent phosphate transport(GO:0044341) |
| 0.0 | 0.4 | GO:0016339 | calcium-dependent cell-cell adhesion via plasma membrane cell adhesion molecules(GO:0016339) |
| 0.0 | 0.1 | GO:0000066 | mitochondrial ornithine transport(GO:0000066) |
| 0.0 | 0.0 | GO:0009443 | pyridoxal 5'-phosphate salvage(GO:0009443) |
| 0.0 | 0.2 | GO:0035330 | regulation of hippo signaling(GO:0035330) |
| 0.0 | 0.6 | GO:0032411 | positive regulation of transporter activity(GO:0032411) |
| 0.0 | 0.2 | GO:0034497 | protein localization to pre-autophagosomal structure(GO:0034497) |
| 0.0 | 0.2 | GO:0090360 | platelet-derived growth factor production(GO:0090360) regulation of platelet-derived growth factor production(GO:0090361) |
| 0.0 | 0.3 | GO:0007398 | ectoderm development(GO:0007398) |
Gene overrepresentation in cellular component category:
| Log-likelihood per target | Total log-likelihood | Term | Description |
|---|---|---|---|
| 0.9 | 8.7 | GO:0005826 | actomyosin contractile ring(GO:0005826) |
| 0.7 | 4.4 | GO:0000221 | vacuolar proton-transporting V-type ATPase, V1 domain(GO:0000221) |
| 0.6 | 3.2 | GO:0016533 | cyclin-dependent protein kinase 5 holoenzyme complex(GO:0016533) |
| 0.5 | 5.7 | GO:0098560 | cytoplasmic side of late endosome membrane(GO:0098560) |
| 0.5 | 3.0 | GO:0005967 | mitochondrial pyruvate dehydrogenase complex(GO:0005967) |
| 0.4 | 2.1 | GO:0033596 | TSC1-TSC2 complex(GO:0033596) |
| 0.4 | 5.1 | GO:0043190 | ATP-binding cassette (ABC) transporter complex(GO:0043190) |
| 0.4 | 0.4 | GO:1990769 | proximal neuron projection(GO:1990769) |
| 0.4 | 1.9 | GO:0005960 | glycine cleavage complex(GO:0005960) |
| 0.3 | 1.0 | GO:0030849 | autosome(GO:0030849) |
| 0.3 | 2.0 | GO:0033186 | CAF-1 complex(GO:0033186) |
| 0.3 | 10.0 | GO:0031229 | integral component of nuclear inner membrane(GO:0005639) intrinsic component of nuclear inner membrane(GO:0031229) |
| 0.3 | 1.2 | GO:0098559 | cytoplasmic side of early endosome membrane(GO:0098559) |
| 0.3 | 0.5 | GO:0019034 | viral replication complex(GO:0019034) |
| 0.3 | 2.1 | GO:0033263 | CORVET complex(GO:0033263) |
| 0.3 | 0.8 | GO:0097135 | cyclin E2-CDK2 complex(GO:0097135) |
| 0.2 | 1.2 | GO:0020003 | symbiont-containing vacuole(GO:0020003) |
| 0.2 | 4.2 | GO:0045240 | dihydrolipoyl dehydrogenase complex(GO:0045240) |
| 0.2 | 1.5 | GO:0044308 | axonal spine(GO:0044308) |
| 0.2 | 2.2 | GO:0044326 | dendritic spine neck(GO:0044326) |
| 0.2 | 8.5 | GO:0031143 | pseudopodium(GO:0031143) |
| 0.2 | 0.5 | GO:0070044 | synaptobrevin 2-SNAP-25-syntaxin-1a complex(GO:0070044) |
| 0.2 | 1.1 | GO:1990498 | mitotic spindle microtubule(GO:1990498) |
| 0.2 | 1.3 | GO:0017101 | aminoacyl-tRNA synthetase multienzyme complex(GO:0017101) |
| 0.2 | 1.9 | GO:1990635 | proximal dendrite(GO:1990635) |
| 0.2 | 4.2 | GO:0043083 | synaptic cleft(GO:0043083) |
| 0.2 | 2.8 | GO:0071439 | clathrin complex(GO:0071439) |
| 0.2 | 0.4 | GO:0061673 | mitotic spindle astral microtubule(GO:0061673) |
| 0.2 | 1.5 | GO:1905202 | 3-methylcrotonyl-CoA carboxylase complex, mitochondrial(GO:0002169) methylcrotonoyl-CoA carboxylase complex(GO:1905202) |
| 0.2 | 6.3 | GO:0031307 | integral component of mitochondrial outer membrane(GO:0031307) |
| 0.2 | 1.1 | GO:1990131 | Gtr1-Gtr2 GTPase complex(GO:1990131) |
| 0.2 | 4.2 | GO:0043203 | axon hillock(GO:0043203) |
| 0.2 | 1.7 | GO:0070761 | pre-snoRNP complex(GO:0070761) |
| 0.2 | 14.2 | GO:0033017 | sarcoplasmic reticulum membrane(GO:0033017) |
| 0.2 | 13.2 | GO:0005834 | heterotrimeric G-protein complex(GO:0005834) |
| 0.2 | 1.6 | GO:0044305 | calyx of Held(GO:0044305) |
| 0.2 | 0.6 | GO:0098855 | HCN channel complex(GO:0098855) |
| 0.2 | 1.3 | GO:0061202 | clathrin-sculpted gamma-aminobutyric acid transport vesicle(GO:0061200) clathrin-sculpted gamma-aminobutyric acid transport vesicle membrane(GO:0061202) |
| 0.2 | 3.9 | GO:0048786 | presynaptic active zone(GO:0048786) |
| 0.1 | 3.3 | GO:0032591 | dendritic spine membrane(GO:0032591) |
| 0.1 | 2.3 | GO:0005869 | dynactin complex(GO:0005869) |
| 0.1 | 1.4 | GO:0000127 | transcription factor TFIIIC complex(GO:0000127) |
| 0.1 | 0.5 | GO:0031084 | BLOC-2 complex(GO:0031084) |
| 0.1 | 0.5 | GO:0070032 | synaptobrevin 2-SNAP-25-syntaxin-1a-complexin I complex(GO:0070032) |
| 0.1 | 3.5 | GO:0032045 | guanyl-nucleotide exchange factor complex(GO:0032045) |
| 0.1 | 0.5 | GO:0034457 | Mpp10 complex(GO:0034457) |
| 0.1 | 0.4 | GO:1990617 | CHOP-ATF4 complex(GO:1990617) |
| 0.1 | 4.3 | GO:0032809 | neuronal cell body membrane(GO:0032809) cell body membrane(GO:0044298) |
| 0.1 | 0.5 | GO:0002189 | ribose phosphate diphosphokinase complex(GO:0002189) |
| 0.1 | 1.5 | GO:0005672 | transcription factor TFIIA complex(GO:0005672) |
| 0.1 | 0.9 | GO:0030121 | AP-1 adaptor complex(GO:0030121) |
| 0.1 | 0.6 | GO:1990584 | cardiac Troponin complex(GO:1990584) |
| 0.1 | 1.1 | GO:0032389 | MutLalpha complex(GO:0032389) |
| 0.1 | 0.4 | GO:1990316 | ATG1/ULK1 kinase complex(GO:1990316) |
| 0.1 | 17.3 | GO:0042734 | presynaptic membrane(GO:0042734) |
| 0.1 | 1.4 | GO:0072546 | ER membrane protein complex(GO:0072546) |
| 0.1 | 2.2 | GO:0031045 | dense core granule(GO:0031045) |
| 0.1 | 1.1 | GO:0008282 | ATP-sensitive potassium channel complex(GO:0008282) |
| 0.1 | 1.2 | GO:0005664 | origin recognition complex(GO:0000808) nuclear origin of replication recognition complex(GO:0005664) |
| 0.1 | 2.3 | GO:1990909 | Wnt signalosome(GO:1990909) |
| 0.1 | 0.5 | GO:0097513 | myosin II filament(GO:0097513) |
| 0.1 | 1.5 | GO:0033391 | chromatoid body(GO:0033391) |
| 0.1 | 0.4 | GO:0098592 | cytoplasmic side of apical plasma membrane(GO:0098592) |
| 0.1 | 1.7 | GO:0035631 | CD40 receptor complex(GO:0035631) |
| 0.1 | 1.1 | GO:0070449 | elongin complex(GO:0070449) |
| 0.1 | 0.7 | GO:0034388 | Pwp2p-containing subcomplex of 90S preribosome(GO:0034388) |
| 0.1 | 1.0 | GO:0000015 | phosphopyruvate hydratase complex(GO:0000015) |
| 0.1 | 0.6 | GO:0032299 | ribonuclease H2 complex(GO:0032299) |
| 0.1 | 1.5 | GO:0035748 | myelin sheath abaxonal region(GO:0035748) |
| 0.1 | 2.4 | GO:0035327 | transcriptionally active chromatin(GO:0035327) |
| 0.1 | 0.4 | GO:0005868 | cytoplasmic dynein complex(GO:0005868) |
| 0.1 | 0.6 | GO:0005797 | Golgi medial cisterna(GO:0005797) |
| 0.1 | 0.6 | GO:0030132 | clathrin coat of coated pit(GO:0030132) |
| 0.1 | 0.5 | GO:1990726 | Lsm1-7-Pat1 complex(GO:1990726) |
| 0.1 | 2.0 | GO:0005671 | Ada2/Gcn5/Ada3 transcription activator complex(GO:0005671) |
| 0.1 | 0.9 | GO:0097512 | cardiac myofibril(GO:0097512) |
| 0.1 | 1.0 | GO:0071203 | WASH complex(GO:0071203) |
| 0.1 | 0.1 | GO:0030430 | host cell cytoplasm(GO:0030430) host cell cytoplasm part(GO:0033655) |
| 0.1 | 3.6 | GO:0035371 | microtubule plus-end(GO:0035371) |
| 0.1 | 1.5 | GO:0008074 | guanylate cyclase complex, soluble(GO:0008074) |
| 0.1 | 0.7 | GO:0000220 | vacuolar proton-transporting V-type ATPase, V0 domain(GO:0000220) |
| 0.1 | 1.9 | GO:0031235 | intrinsic component of the cytoplasmic side of the plasma membrane(GO:0031235) |
| 0.1 | 0.4 | GO:0045254 | pyruvate dehydrogenase complex(GO:0045254) |
| 0.1 | 0.4 | GO:0048476 | Holliday junction resolvase complex(GO:0048476) |
| 0.1 | 2.2 | GO:0043194 | axon initial segment(GO:0043194) |
| 0.1 | 0.2 | GO:0005745 | m-AAA complex(GO:0005745) |
| 0.1 | 2.0 | GO:0031083 | BLOC-1 complex(GO:0031083) |
| 0.1 | 1.1 | GO:0005751 | mitochondrial respiratory chain complex IV(GO:0005751) |
| 0.1 | 0.1 | GO:0043196 | varicosity(GO:0043196) |
| 0.1 | 0.4 | GO:0032280 | symmetric synapse(GO:0032280) |
| 0.1 | 0.4 | GO:0000801 | central element(GO:0000801) |
| 0.1 | 1.9 | GO:0071782 | endoplasmic reticulum tubular network(GO:0071782) |
| 0.1 | 0.2 | GO:0070069 | cytochrome complex(GO:0070069) |
| 0.1 | 0.4 | GO:0070847 | core mediator complex(GO:0070847) |
| 0.1 | 0.2 | GO:0000333 | telomerase catalytic core complex(GO:0000333) |
| 0.1 | 3.6 | GO:0008180 | COP9 signalosome(GO:0008180) |
| 0.1 | 0.6 | GO:0032982 | myosin filament(GO:0032982) |
| 0.1 | 0.8 | GO:0099634 | postsynaptic specialization membrane(GO:0099634) |
| 0.1 | 0.9 | GO:0005845 | mRNA cap binding complex(GO:0005845) |
| 0.0 | 0.3 | GO:0033180 | proton-transporting V-type ATPase, V1 domain(GO:0033180) |
| 0.0 | 0.1 | GO:0097123 | cyclin A1-CDK2 complex(GO:0097123) |
| 0.0 | 0.2 | GO:0045259 | mitochondrial proton-transporting ATP synthase complex(GO:0005753) proton-transporting ATP synthase complex(GO:0045259) |
| 0.0 | 0.1 | GO:0002947 | tumor necrosis factor receptor superfamily complex(GO:0002947) |
| 0.0 | 4.2 | GO:0030315 | T-tubule(GO:0030315) |
| 0.0 | 0.2 | GO:0097543 | ciliary inversin compartment(GO:0097543) |
| 0.0 | 1.4 | GO:0005666 | DNA-directed RNA polymerase III complex(GO:0005666) |
| 0.0 | 0.5 | GO:0044294 | dendritic growth cone(GO:0044294) |
| 0.0 | 0.4 | GO:0032777 | Piccolo NuA4 histone acetyltransferase complex(GO:0032777) |
| 0.0 | 0.1 | GO:0042022 | interleukin-12 receptor complex(GO:0042022) |
| 0.0 | 0.5 | GO:0031466 | Cul5-RING ubiquitin ligase complex(GO:0031466) |
| 0.0 | 5.1 | GO:0030672 | synaptic vesicle membrane(GO:0030672) exocytic vesicle membrane(GO:0099501) |
| 0.0 | 0.5 | GO:0030914 | STAGA complex(GO:0030914) |
| 0.0 | 0.2 | GO:0097058 | CRLF-CLCF1 complex(GO:0097058) |
| 0.0 | 3.5 | GO:0005901 | caveola(GO:0005901) |
| 0.0 | 0.4 | GO:0005787 | signal peptidase complex(GO:0005787) |
| 0.0 | 0.7 | GO:0031010 | ISWI-type complex(GO:0031010) |
| 0.0 | 0.3 | GO:0009368 | endopeptidase Clp complex(GO:0009368) |
| 0.0 | 0.3 | GO:0016272 | prefoldin complex(GO:0016272) |
| 0.0 | 0.2 | GO:0071817 | MMXD complex(GO:0071817) |
| 0.0 | 0.3 | GO:1990745 | EARP complex(GO:1990745) |
| 0.0 | 2.7 | GO:0031430 | M band(GO:0031430) |
| 0.0 | 0.4 | GO:1990578 | perinuclear endoplasmic reticulum membrane(GO:1990578) |
| 0.0 | 4.6 | GO:0031463 | Cul3-RING ubiquitin ligase complex(GO:0031463) |
| 0.0 | 0.4 | GO:0097524 | sperm plasma membrane(GO:0097524) |
| 0.0 | 0.5 | GO:0072379 | BAT3 complex(GO:0071818) ER membrane insertion complex(GO:0072379) |
| 0.0 | 1.1 | GO:0000786 | nucleosome(GO:0000786) |
| 0.0 | 16.8 | GO:0099572 | postsynaptic density(GO:0014069) postsynaptic specialization(GO:0099572) |
| 0.0 | 0.6 | GO:0097433 | dense body(GO:0097433) |
| 0.0 | 0.4 | GO:0001673 | male germ cell nucleus(GO:0001673) |
| 0.0 | 1.7 | GO:0043198 | dendritic shaft(GO:0043198) |
| 0.0 | 8.3 | GO:0098793 | presynapse(GO:0098793) |
| 0.0 | 3.2 | GO:0030669 | clathrin-coated endocytic vesicle membrane(GO:0030669) |
| 0.0 | 3.9 | GO:0005746 | mitochondrial respiratory chain(GO:0005746) |
| 0.0 | 0.2 | GO:0000408 | EKC/KEOPS complex(GO:0000408) |
| 0.0 | 0.5 | GO:0072487 | MSL complex(GO:0072487) |
| 0.0 | 0.3 | GO:1903440 | calcitonin family receptor complex(GO:1903439) amylin receptor complex(GO:1903440) |
| 0.0 | 9.8 | GO:0005802 | trans-Golgi network(GO:0005802) |
| 0.0 | 0.3 | GO:0030893 | meiotic cohesin complex(GO:0030893) |
| 0.0 | 0.1 | GO:0032133 | chromosome passenger complex(GO:0032133) |
| 0.0 | 0.6 | GO:0031254 | uropod(GO:0001931) cell trailing edge(GO:0031254) |
| 0.0 | 0.3 | GO:0001940 | male pronucleus(GO:0001940) |
| 0.0 | 0.3 | GO:0034687 | integrin alphaL-beta2 complex(GO:0034687) |
| 0.0 | 0.1 | GO:0000940 | condensed chromosome outer kinetochore(GO:0000940) |
| 0.0 | 1.8 | GO:0001772 | immunological synapse(GO:0001772) |
| 0.0 | 2.3 | GO:0005762 | organellar large ribosomal subunit(GO:0000315) mitochondrial large ribosomal subunit(GO:0005762) |
| 0.0 | 3.8 | GO:0034705 | potassium channel complex(GO:0034705) |
| 0.0 | 0.1 | GO:0035189 | Rb-E2F complex(GO:0035189) |
| 0.0 | 0.2 | GO:0005968 | Rab-protein geranylgeranyltransferase complex(GO:0005968) |
| 0.0 | 0.2 | GO:0008540 | proteasome regulatory particle, base subcomplex(GO:0008540) |
| 0.0 | 0.8 | GO:0005892 | acetylcholine-gated channel complex(GO:0005892) |
| 0.0 | 0.7 | GO:0035102 | PRC1 complex(GO:0035102) |
| 0.0 | 0.3 | GO:0031595 | nuclear proteasome complex(GO:0031595) |
| 0.0 | 0.1 | GO:0071547 | piP-body(GO:0071547) |
| 0.0 | 0.1 | GO:0035354 | Toll-like receptor 1-Toll-like receptor 2 protein complex(GO:0035354) |
| 0.0 | 0.2 | GO:0042765 | GPI-anchor transamidase complex(GO:0042765) |
| 0.0 | 3.4 | GO:0031234 | extrinsic component of cytoplasmic side of plasma membrane(GO:0031234) |
| 0.0 | 0.2 | GO:0009331 | glycerol-3-phosphate dehydrogenase complex(GO:0009331) |
| 0.0 | 3.2 | GO:0070821 | tertiary granule membrane(GO:0070821) |
| 0.0 | 0.4 | GO:0070938 | contractile ring(GO:0070938) |
| 0.0 | 3.9 | GO:0031901 | early endosome membrane(GO:0031901) |
| 0.0 | 0.1 | GO:1990393 | 3M complex(GO:1990393) |
| 0.0 | 0.3 | GO:0016461 | unconventional myosin complex(GO:0016461) |
| 0.0 | 0.1 | GO:0048179 | activin receptor complex(GO:0048179) |
| 0.0 | 1.1 | GO:0034451 | centriolar satellite(GO:0034451) |
| 0.0 | 0.2 | GO:0097452 | GAIT complex(GO:0097452) |
| 0.0 | 0.1 | GO:0032044 | DSIF complex(GO:0032044) |
| 0.0 | 0.5 | GO:0000780 | condensed nuclear chromosome, centromeric region(GO:0000780) |
| 0.0 | 3.6 | GO:0031674 | I band(GO:0031674) |
| 0.0 | 1.5 | GO:0031228 | intrinsic component of Golgi membrane(GO:0031228) |
| 0.0 | 3.2 | GO:0032587 | ruffle membrane(GO:0032587) |
| 0.0 | 0.1 | GO:0097427 | microtubule bundle(GO:0097427) |
| 0.0 | 0.2 | GO:0005785 | signal recognition particle receptor complex(GO:0005785) |
| 0.0 | 0.2 | GO:0005638 | lamin filament(GO:0005638) |
| 0.0 | 0.1 | GO:0031074 | nucleocytoplasmic shuttling complex(GO:0031074) |
| 0.0 | 0.1 | GO:0033553 | rDNA heterochromatin(GO:0033553) |
| 0.0 | 2.0 | GO:0043204 | perikaryon(GO:0043204) |
| 0.0 | 0.2 | GO:0045179 | apical cortex(GO:0045179) |
| 0.0 | 0.3 | GO:0033176 | proton-transporting V-type ATPase complex(GO:0033176) |
| 0.0 | 12.9 | GO:0005874 | microtubule(GO:0005874) |
| 0.0 | 0.3 | GO:0031931 | TORC1 complex(GO:0031931) |
| 0.0 | 0.7 | GO:0016528 | sarcoplasm(GO:0016528) |
| 0.0 | 0.2 | GO:0031314 | extrinsic component of mitochondrial inner membrane(GO:0031314) |
| 0.0 | 0.1 | GO:0030897 | HOPS complex(GO:0030897) |
| 0.0 | 0.2 | GO:0030119 | AP-type membrane coat adaptor complex(GO:0030119) |
| 0.0 | 0.7 | GO:0005720 | nuclear heterochromatin(GO:0005720) |
| 0.0 | 0.3 | GO:0000177 | cytoplasmic exosome (RNase complex)(GO:0000177) |
| 0.0 | 0.2 | GO:0010369 | chromocenter(GO:0010369) |
| 0.0 | 0.2 | GO:0046581 | intercellular canaliculus(GO:0046581) |
| 0.0 | 1.3 | GO:0005637 | nuclear inner membrane(GO:0005637) |
| 0.0 | 2.0 | GO:0032580 | Golgi cisterna membrane(GO:0032580) |
| 0.0 | 1.0 | GO:0090544 | BAF-type complex(GO:0090544) |
| 0.0 | 0.1 | GO:0098845 | postsynaptic endosome(GO:0098845) |
| 0.0 | 0.6 | GO:0030660 | Golgi-associated vesicle membrane(GO:0030660) |
| 0.0 | 1.7 | GO:0043209 | myelin sheath(GO:0043209) |
| 0.0 | 2.9 | GO:0005741 | mitochondrial outer membrane(GO:0005741) |
| 0.0 | 0.1 | GO:0019907 | cyclin-dependent protein kinase activating kinase holoenzyme complex(GO:0019907) |
| 0.0 | 0.3 | GO:0000421 | autophagosome membrane(GO:0000421) |
| 0.0 | 0.1 | GO:0031417 | NatC complex(GO:0031417) |
| 0.0 | 0.1 | GO:0043219 | lateral loop(GO:0043219) |
| 0.0 | 3.0 | GO:0042579 | peroxisome(GO:0005777) microbody(GO:0042579) |
| 0.0 | 4.0 | GO:0045121 | membrane raft(GO:0045121) membrane microdomain(GO:0098857) |
| 0.0 | 0.3 | GO:0031092 | platelet alpha granule membrane(GO:0031092) |
| 0.0 | 0.3 | GO:0031201 | SNARE complex(GO:0031201) |
| 0.0 | 0.4 | GO:0030665 | clathrin-coated vesicle membrane(GO:0030665) |
| 0.0 | 0.1 | GO:0031464 | Cul4A-RING E3 ubiquitin ligase complex(GO:0031464) |
| 0.0 | 0.0 | GO:0031510 | SUMO activating enzyme complex(GO:0031510) |
| 0.0 | 0.6 | GO:0005791 | rough endoplasmic reticulum(GO:0005791) |
| 0.0 | 0.7 | GO:0008023 | transcription elongation factor complex(GO:0008023) |
| 0.0 | 0.4 | GO:0005682 | U5 snRNP(GO:0005682) |
| 0.0 | 0.0 | GO:0033011 | perinuclear theca(GO:0033011) |
| 0.0 | 0.3 | GO:0030670 | phagocytic vesicle membrane(GO:0030670) |
| 0.0 | 3.3 | GO:0043025 | neuronal cell body(GO:0043025) |
| 0.0 | 0.1 | GO:0033588 | Elongator holoenzyme complex(GO:0033588) |
| 0.0 | 0.9 | GO:0030175 | filopodium(GO:0030175) |
| 0.0 | 2.4 | GO:0030425 | dendrite(GO:0030425) |
Gene overrepresentation in molecular function category:
| Log-likelihood per target | Total log-likelihood | Term | Description |
|---|---|---|---|
| 1.3 | 8.0 | GO:0010861 | thyroid hormone receptor activator activity(GO:0010861) thyroid hormone receptor coactivator activity(GO:0030375) |
| 1.1 | 3.3 | GO:0099530 | G-protein coupled receptor activity involved in regulation of postsynaptic membrane potential(GO:0099530) |
| 1.1 | 3.2 | GO:0016534 | cyclin-dependent protein kinase 5 activator activity(GO:0016534) |
| 0.8 | 10.0 | GO:0004931 | extracellular ATP-gated cation channel activity(GO:0004931) ATP-gated ion channel activity(GO:0035381) |
| 0.7 | 2.2 | GO:0008746 | NAD(P)+ transhydrogenase activity(GO:0008746) oxidoreductase activity, acting on NAD(P)H, NAD(P) as acceptor(GO:0016652) |
| 0.6 | 1.9 | GO:0070364 | mitochondrial light strand promoter anti-sense binding(GO:0070361) mitochondrial heavy strand promoter anti-sense binding(GO:0070362) mitochondrial heavy strand promoter sense binding(GO:0070364) |
| 0.6 | 1.9 | GO:0004047 | aminomethyltransferase activity(GO:0004047) |
| 0.5 | 1.6 | GO:0034602 | oxoglutarate dehydrogenase (NAD+) activity(GO:0034602) |
| 0.5 | 10.6 | GO:0031681 | G-protein beta-subunit binding(GO:0031681) |
| 0.5 | 3.5 | GO:0030060 | L-malate dehydrogenase activity(GO:0030060) |
| 0.5 | 3.0 | GO:0004740 | pyruvate dehydrogenase (acetyl-transferring) kinase activity(GO:0004740) |
| 0.5 | 1.5 | GO:0003826 | alpha-ketoacid dehydrogenase activity(GO:0003826) 3-methyl-2-oxobutanoate dehydrogenase (2-methylpropanoyl-transferring) activity(GO:0003863) |
| 0.5 | 1.9 | GO:0031687 | A2A adenosine receptor binding(GO:0031687) |
| 0.5 | 2.4 | GO:0070326 | very-low-density lipoprotein particle receptor binding(GO:0070326) |
| 0.5 | 2.8 | GO:0004505 | phenylalanine 4-monooxygenase activity(GO:0004505) |
| 0.4 | 1.3 | GO:0004639 | phosphoribosylaminoimidazole carboxylase activity(GO:0004638) phosphoribosylaminoimidazolesuccinocarboxamide synthase activity(GO:0004639) |
| 0.4 | 10.9 | GO:0005247 | voltage-gated chloride channel activity(GO:0005247) |
| 0.4 | 1.1 | GO:0004416 | hydroxyacylglutathione hydrolase activity(GO:0004416) |
| 0.4 | 1.5 | GO:0004001 | adenosine kinase activity(GO:0004001) |
| 0.4 | 1.8 | GO:0003990 | acetylcholinesterase activity(GO:0003990) |
| 0.4 | 1.5 | GO:0008427 | calcium-dependent protein kinase inhibitor activity(GO:0008427) |
| 0.4 | 1.1 | GO:0015633 | zinc transporting ATPase activity(GO:0015633) |
| 0.4 | 1.1 | GO:0035605 | peptidyl-cysteine S-nitrosylase activity(GO:0035605) |
| 0.4 | 2.1 | GO:0005298 | proline:sodium symporter activity(GO:0005298) |
| 0.3 | 0.3 | GO:0090631 | pre-miRNA transporter activity(GO:0090631) |
| 0.3 | 1.0 | GO:0008294 | calcium- and calmodulin-responsive adenylate cyclase activity(GO:0008294) |
| 0.3 | 1.0 | GO:0036505 | prosaposin receptor activity(GO:0036505) |
| 0.3 | 10.3 | GO:0097109 | neuroligin family protein binding(GO:0097109) |
| 0.3 | 1.9 | GO:0042030 | ATPase inhibitor activity(GO:0042030) |
| 0.3 | 1.2 | GO:0001626 | nociceptin receptor activity(GO:0001626) |
| 0.3 | 1.9 | GO:0015018 | galactosylgalactosylxylosylprotein 3-beta-glucuronosyltransferase activity(GO:0015018) |
| 0.3 | 3.1 | GO:0003835 | beta-galactoside alpha-2,6-sialyltransferase activity(GO:0003835) |
| 0.3 | 1.8 | GO:0072345 | NAADP-sensitive calcium-release channel activity(GO:0072345) |
| 0.3 | 2.1 | GO:0008273 | calcium, potassium:sodium antiporter activity(GO:0008273) |
| 0.3 | 1.2 | GO:0033897 | ribonuclease T2 activity(GO:0033897) |
| 0.3 | 1.1 | GO:0004591 | oxoglutarate dehydrogenase (succinyl-transferring) activity(GO:0004591) |
| 0.3 | 2.4 | GO:1904315 | neurotransmitter receptor activity involved in regulation of postsynaptic membrane potential(GO:0099529) transmitter-gated ion channel activity involved in regulation of postsynaptic membrane potential(GO:1904315) |
| 0.3 | 2.6 | GO:0005332 | gamma-aminobutyric acid:sodium symporter activity(GO:0005332) |
| 0.3 | 18.4 | GO:0004683 | calmodulin-dependent protein kinase activity(GO:0004683) |
| 0.2 | 2.0 | GO:0031849 | olfactory receptor binding(GO:0031849) |
| 0.2 | 0.9 | GO:0004487 | methylenetetrahydrofolate dehydrogenase (NAD+) activity(GO:0004487) |
| 0.2 | 3.9 | GO:0015379 | potassium:chloride symporter activity(GO:0015379) potassium ion symporter activity(GO:0022820) |
| 0.2 | 0.7 | GO:0043739 | G/U mismatch-specific uracil-DNA glycosylase activity(GO:0043739) |
| 0.2 | 0.9 | GO:0005483 | soluble NSF attachment protein activity(GO:0005483) |
| 0.2 | 0.7 | GO:0015218 | pyrimidine nucleotide transmembrane transporter activity(GO:0015218) |
| 0.2 | 1.5 | GO:0016833 | oxo-acid-lyase activity(GO:0016833) |
| 0.2 | 2.8 | GO:0030274 | LIM domain binding(GO:0030274) |
| 0.2 | 1.2 | GO:0042954 | lipoprotein transporter activity(GO:0042954) |
| 0.2 | 1.0 | GO:0004668 | protein-arginine deiminase activity(GO:0004668) |
| 0.2 | 1.0 | GO:0004616 | phosphogluconate dehydrogenase (decarboxylating) activity(GO:0004616) |
| 0.2 | 1.5 | GO:0004485 | methylcrotonoyl-CoA carboxylase activity(GO:0004485) |
| 0.2 | 0.8 | GO:0031826 | type 2A serotonin receptor binding(GO:0031826) |
| 0.2 | 0.6 | GO:0010348 | lithium:proton antiporter activity(GO:0010348) |
| 0.2 | 1.1 | GO:0005105 | type 1 fibroblast growth factor receptor binding(GO:0005105) |
| 0.2 | 1.1 | GO:0102008 | cytosolic dipeptidase activity(GO:0102008) |
| 0.2 | 1.8 | GO:0015349 | thyroid hormone transmembrane transporter activity(GO:0015349) |
| 0.2 | 1.1 | GO:0008281 | sulfonylurea receptor activity(GO:0008281) |
| 0.2 | 1.1 | GO:0003875 | ADP-ribosylarginine hydrolase activity(GO:0003875) |
| 0.2 | 2.6 | GO:0015129 | lactate transmembrane transporter activity(GO:0015129) |
| 0.2 | 1.2 | GO:0004800 | thyroxine 5'-deiodinase activity(GO:0004800) |
| 0.2 | 0.5 | GO:0070538 | oleic acid binding(GO:0070538) |
| 0.2 | 0.7 | GO:0047192 | 1-alkylglycerophosphocholine O-acetyltransferase activity(GO:0047192) |
| 0.2 | 3.6 | GO:0001206 | transcriptional repressor activity, RNA polymerase II distal enhancer sequence-specific binding(GO:0001206) |
| 0.2 | 1.3 | GO:0004972 | NMDA glutamate receptor activity(GO:0004972) |
| 0.2 | 0.7 | GO:0051499 | D-aminoacyl-tRNA deacylase activity(GO:0051499) D-tyrosyl-tRNA(Tyr) deacylase activity(GO:0051500) |
| 0.2 | 0.8 | GO:0004370 | glycerol kinase activity(GO:0004370) |
| 0.2 | 5.3 | GO:0044769 | ATPase activity, coupled to transmembrane movement of ions, rotational mechanism(GO:0044769) proton-transporting ATPase activity, rotational mechanism(GO:0046961) |
| 0.2 | 1.1 | GO:0003987 | acetate-CoA ligase activity(GO:0003987) |
| 0.2 | 2.1 | GO:0004332 | fructose-bisphosphate aldolase activity(GO:0004332) |
| 0.2 | 2.7 | GO:0032051 | clathrin light chain binding(GO:0032051) |
| 0.2 | 0.6 | GO:0071885 | N-terminal protein N-methyltransferase activity(GO:0071885) |
| 0.2 | 0.6 | GO:0000309 | nicotinamide-nucleotide adenylyltransferase activity(GO:0000309) |
| 0.2 | 3.4 | GO:0031432 | titin binding(GO:0031432) |
| 0.2 | 0.5 | GO:0097604 | temperature-gated cation channel activity(GO:0097604) |
| 0.2 | 5.0 | GO:0051537 | 2 iron, 2 sulfur cluster binding(GO:0051537) |
| 0.1 | 0.6 | GO:0052810 | 1-phosphatidylinositol-5-kinase activity(GO:0052810) |
| 0.1 | 1.6 | GO:0071253 | connexin binding(GO:0071253) |
| 0.1 | 1.0 | GO:0000179 | rRNA (adenine-N6,N6-)-dimethyltransferase activity(GO:0000179) |
| 0.1 | 0.4 | GO:0004730 | pseudouridylate synthase activity(GO:0004730) |
| 0.1 | 1.9 | GO:0046975 | histone methyltransferase activity (H3-K36 specific)(GO:0046975) |
| 0.1 | 1.9 | GO:0102337 | fatty acid elongase activity(GO:0009922) 3-oxo-arachidoyl-CoA synthase activity(GO:0102336) 3-oxo-cerotoyl-CoA synthase activity(GO:0102337) 3-oxo-lignoceronyl-CoA synthase activity(GO:0102338) |
| 0.1 | 1.5 | GO:0005280 | hydrogen:amino acid symporter activity(GO:0005280) |
| 0.1 | 2.4 | GO:1990239 | steroid hormone binding(GO:1990239) |
| 0.1 | 0.7 | GO:0050220 | prostaglandin-E synthase activity(GO:0050220) |
| 0.1 | 0.8 | GO:0004741 | [pyruvate dehydrogenase (lipoamide)] phosphatase activity(GO:0004741) |
| 0.1 | 1.3 | GO:0047623 | AMP deaminase activity(GO:0003876) adenosine-phosphate deaminase activity(GO:0047623) |
| 0.1 | 0.5 | GO:0042134 | rRNA primary transcript binding(GO:0042134) |
| 0.1 | 0.5 | GO:0042132 | fructose 1,6-bisphosphate 1-phosphatase activity(GO:0042132) |
| 0.1 | 1.7 | GO:0047499 | calcium-independent phospholipase A2 activity(GO:0047499) |
| 0.1 | 4.9 | GO:0005184 | neuropeptide hormone activity(GO:0005184) |
| 0.1 | 0.5 | GO:0001641 | group II metabotropic glutamate receptor activity(GO:0001641) |
| 0.1 | 0.7 | GO:0047696 | beta-adrenergic receptor kinase activity(GO:0047696) |
| 0.1 | 2.3 | GO:0004017 | adenylate kinase activity(GO:0004017) |
| 0.1 | 0.9 | GO:0000155 | phosphorelay sensor kinase activity(GO:0000155) |
| 0.1 | 0.6 | GO:0030172 | troponin C binding(GO:0030172) |
| 0.1 | 3.3 | GO:0045295 | gamma-catenin binding(GO:0045295) |
| 0.1 | 0.9 | GO:1904288 | BAT3 complex binding(GO:1904288) |
| 0.1 | 1.1 | GO:0032138 | single base insertion or deletion binding(GO:0032138) |
| 0.1 | 1.4 | GO:0070087 | chromo shadow domain binding(GO:0070087) |
| 0.1 | 1.5 | GO:1903136 | cuprous ion binding(GO:1903136) |
| 0.1 | 1.1 | GO:0055131 | C3HC4-type RING finger domain binding(GO:0055131) |
| 0.1 | 0.4 | GO:0016624 | oxidoreductase activity, acting on the aldehyde or oxo group of donors, disulfide as acceptor(GO:0016624) |
| 0.1 | 0.9 | GO:0003873 | 6-phosphofructo-2-kinase activity(GO:0003873) |
| 0.1 | 0.4 | GO:1904455 | ubiquitin-specific protease activity involved in negative regulation of ERAD pathway(GO:1904455) |
| 0.1 | 1.3 | GO:0008020 | G-protein coupled photoreceptor activity(GO:0008020) |
| 0.1 | 1.2 | GO:0004523 | RNA-DNA hybrid ribonuclease activity(GO:0004523) |
| 0.1 | 0.6 | GO:0015183 | L-aspartate transmembrane transporter activity(GO:0015183) |
| 0.1 | 0.5 | GO:0086062 | voltage-gated sodium channel activity involved in Purkinje myocyte action potential(GO:0086062) |
| 0.1 | 0.4 | GO:0004513 | neolactotetraosylceramide alpha-2,3-sialyltransferase activity(GO:0004513) lactosylceramide alpha-2,3-sialyltransferase activity(GO:0047291) |
| 0.1 | 0.8 | GO:0004727 | prenylated protein tyrosine phosphatase activity(GO:0004727) |
| 0.1 | 0.9 | GO:0019784 | NEDD8-specific protease activity(GO:0019784) |
| 0.1 | 0.6 | GO:0004122 | cystathionine beta-synthase activity(GO:0004122) |
| 0.1 | 0.6 | GO:0004470 | malic enzyme activity(GO:0004470) malate dehydrogenase (decarboxylating) (NAD+) activity(GO:0004471) malate dehydrogenase (decarboxylating) (NADP+) activity(GO:0004473) |
| 0.1 | 1.0 | GO:0004634 | phosphopyruvate hydratase activity(GO:0004634) |
| 0.1 | 0.3 | GO:0051021 | GDP-dissociation inhibitor binding(GO:0051021) Rho GDP-dissociation inhibitor binding(GO:0051022) |
| 0.1 | 0.3 | GO:0015193 | L-proline transmembrane transporter activity(GO:0015193) |
| 0.1 | 0.8 | GO:0000774 | adenyl-nucleotide exchange factor activity(GO:0000774) |
| 0.1 | 0.3 | GO:0016716 | oxidoreductase activity, acting on paired donors, with incorporation or reduction of molecular oxygen, another compound as one donor, and incorporation of one atom of oxygen(GO:0016716) |
| 0.1 | 1.5 | GO:0031996 | thioesterase binding(GO:0031996) |
| 0.1 | 1.5 | GO:0097016 | L27 domain binding(GO:0097016) |
| 0.1 | 0.3 | GO:0051185 | coenzyme transporter activity(GO:0051185) |
| 0.1 | 0.5 | GO:0008518 | reduced folate carrier activity(GO:0008518) |
| 0.1 | 0.6 | GO:0005222 | intracellular cAMP activated cation channel activity(GO:0005222) |
| 0.1 | 1.2 | GO:0000182 | rDNA binding(GO:0000182) |
| 0.1 | 2.8 | GO:0004707 | MAP kinase activity(GO:0004707) |
| 0.1 | 0.9 | GO:1990226 | histone methyltransferase binding(GO:1990226) |
| 0.1 | 0.8 | GO:0005094 | Rho GDP-dissociation inhibitor activity(GO:0005094) |
| 0.1 | 0.4 | GO:0004802 | transketolase activity(GO:0004802) |
| 0.1 | 0.5 | GO:0004749 | ribose phosphate diphosphokinase activity(GO:0004749) |
| 0.1 | 0.5 | GO:0036042 | long-chain fatty acyl-CoA binding(GO:0036042) |
| 0.1 | 1.5 | GO:0004089 | carbonate dehydratase activity(GO:0004089) |
| 0.1 | 2.4 | GO:0019992 | diacylglycerol binding(GO:0019992) |
| 0.1 | 1.5 | GO:0032794 | GTPase activating protein binding(GO:0032794) |
| 0.1 | 0.9 | GO:0016813 | hydrolase activity, acting on carbon-nitrogen (but not peptide) bonds, in linear amidines(GO:0016813) |
| 0.1 | 9.7 | GO:0030276 | clathrin binding(GO:0030276) |
| 0.1 | 1.7 | GO:0005344 | oxygen transporter activity(GO:0005344) |
| 0.1 | 0.6 | GO:0001849 | complement component C1q binding(GO:0001849) |
| 0.1 | 0.3 | GO:0001588 | dopamine neurotransmitter receptor activity, coupled via Gs(GO:0001588) |
| 0.1 | 2.1 | GO:0050811 | GABA receptor binding(GO:0050811) |
| 0.1 | 1.8 | GO:0001614 | G-protein coupled nucleotide receptor activity(GO:0001608) purinergic nucleotide receptor activity(GO:0001614) nucleotide receptor activity(GO:0016502) G-protein coupled purinergic nucleotide receptor activity(GO:0045028) |
| 0.1 | 0.4 | GO:0046964 | 3'-phosphoadenosine 5'-phosphosulfate transmembrane transporter activity(GO:0046964) |
| 0.1 | 0.6 | GO:0017018 | myosin phosphatase activity(GO:0017018) |
| 0.1 | 0.4 | GO:0004489 | methylenetetrahydrofolate reductase (NAD(P)H) activity(GO:0004489) |
| 0.1 | 0.7 | GO:0001665 | alpha-N-acetylgalactosaminide alpha-2,6-sialyltransferase activity(GO:0001665) |
| 0.1 | 0.3 | GO:0035373 | chondroitin sulfate proteoglycan binding(GO:0035373) |
| 0.1 | 0.3 | GO:0031716 | calcitonin receptor activity(GO:0004948) calcitonin receptor binding(GO:0031716) |
| 0.1 | 0.2 | GO:0004766 | spermidine synthase activity(GO:0004766) |
| 0.1 | 0.2 | GO:0046715 | borate transmembrane transporter activity(GO:0046715) |
| 0.1 | 0.5 | GO:0004430 | 1-phosphatidylinositol 4-kinase activity(GO:0004430) |
| 0.1 | 1.4 | GO:0015929 | hexosaminidase activity(GO:0015929) |
| 0.1 | 1.4 | GO:0005416 | cation:amino acid symporter activity(GO:0005416) |
| 0.1 | 0.5 | GO:0097108 | smoothened binding(GO:0005119) hedgehog family protein binding(GO:0097108) |
| 0.1 | 1.6 | GO:0008195 | phosphatidate phosphatase activity(GO:0008195) |
| 0.1 | 0.3 | GO:0033829 | O-fucosylpeptide 3-beta-N-acetylglucosaminyltransferase activity(GO:0033829) |
| 0.1 | 0.6 | GO:0004075 | biotin carboxylase activity(GO:0004075) |
| 0.1 | 0.4 | GO:0008532 | N-acetyllactosaminide beta-1,3-N-acetylglucosaminyltransferase activity(GO:0008532) |
| 0.1 | 0.8 | GO:0070840 | dynein complex binding(GO:0070840) |
| 0.1 | 0.6 | GO:0015279 | store-operated calcium channel activity(GO:0015279) |
| 0.1 | 0.2 | GO:0043849 | Ras palmitoyltransferase activity(GO:0043849) |
| 0.1 | 0.6 | GO:0035612 | AP-2 adaptor complex binding(GO:0035612) |
| 0.1 | 0.2 | GO:0009383 | rRNA (cytosine-C5-)-methyltransferase activity(GO:0009383) |
| 0.1 | 2.6 | GO:0071855 | neuropeptide receptor binding(GO:0071855) |
| 0.1 | 0.3 | GO:0016509 | long-chain-3-hydroxyacyl-CoA dehydrogenase activity(GO:0016509) |
| 0.1 | 0.3 | GO:0070579 | methylcytosine dioxygenase activity(GO:0070579) |
| 0.1 | 0.3 | GO:0070051 | fibrinogen binding(GO:0070051) |
| 0.1 | 0.4 | GO:0008174 | mRNA methyltransferase activity(GO:0008174) |
| 0.1 | 0.5 | GO:0043533 | inositol 1,3,4,5 tetrakisphosphate binding(GO:0043533) |
| 0.1 | 0.2 | GO:0052811 | 1-phosphatidylinositol-3-phosphate 4-kinase activity(GO:0052811) |
| 0.1 | 0.3 | GO:0003943 | N-acetylgalactosamine-4-sulfatase activity(GO:0003943) |
| 0.1 | 1.7 | GO:0005095 | GTPase inhibitor activity(GO:0005095) |
| 0.1 | 0.8 | GO:0005021 | vascular endothelial growth factor-activated receptor activity(GO:0005021) |
| 0.1 | 0.2 | GO:0001225 | RNA polymerase II transcription coactivator binding(GO:0001225) |
| 0.1 | 0.3 | GO:0005324 | long-chain fatty acid transporter activity(GO:0005324) |
| 0.1 | 0.5 | GO:0003828 | alpha-N-acetylneuraminate alpha-2,8-sialyltransferase activity(GO:0003828) |
| 0.1 | 0.6 | GO:0008308 | voltage-gated anion channel activity(GO:0008308) |
| 0.0 | 0.9 | GO:0043024 | ribosomal small subunit binding(GO:0043024) |
| 0.0 | 0.2 | GO:0015157 | sucrose:proton symporter activity(GO:0008506) sucrose transmembrane transporter activity(GO:0008515) disaccharide transmembrane transporter activity(GO:0015154) oligosaccharide transmembrane transporter activity(GO:0015157) |
| 0.0 | 3.0 | GO:0003954 | NADH dehydrogenase activity(GO:0003954) |
| 0.0 | 1.2 | GO:0015467 | G-protein activated inward rectifier potassium channel activity(GO:0015467) |
| 0.0 | 0.9 | GO:0000062 | fatty-acyl-CoA binding(GO:0000062) |
| 0.0 | 0.0 | GO:0015350 | methotrexate transporter activity(GO:0015350) |
| 0.0 | 0.2 | GO:0034041 | sterol-transporting ATPase activity(GO:0034041) |
| 0.0 | 0.4 | GO:0015220 | choline transmembrane transporter activity(GO:0015220) |
| 0.0 | 0.1 | GO:0017116 | single-stranded DNA-dependent ATP-dependent DNA helicase activity(GO:0017116) |
| 0.0 | 2.0 | GO:0017075 | syntaxin-1 binding(GO:0017075) |
| 0.0 | 2.0 | GO:0030506 | ankyrin binding(GO:0030506) |
| 0.0 | 0.4 | GO:0019788 | NEDD8 transferase activity(GO:0019788) |
| 0.0 | 0.6 | GO:0031386 | protein tag(GO:0031386) |
| 0.0 | 0.1 | GO:0016517 | interleukin-12 receptor activity(GO:0016517) |
| 0.0 | 2.2 | GO:0005086 | ARF guanyl-nucleotide exchange factor activity(GO:0005086) |
| 0.0 | 0.1 | GO:0038100 | nodal binding(GO:0038100) |
| 0.0 | 0.9 | GO:0032036 | myosin heavy chain binding(GO:0032036) |
| 0.0 | 0.3 | GO:0044547 | DNA topoisomerase binding(GO:0044547) |
| 0.0 | 0.2 | GO:0001640 | adenylate cyclase inhibiting G-protein coupled glutamate receptor activity(GO:0001640) G-protein coupled glutamate receptor activity(GO:0098988) |
| 0.0 | 0.4 | GO:0004359 | glutaminase activity(GO:0004359) |
| 0.0 | 2.4 | GO:0004364 | glutathione transferase activity(GO:0004364) |
| 0.0 | 0.2 | GO:0071558 | histone demethylase activity (H3-K27 specific)(GO:0071558) |
| 0.0 | 0.3 | GO:0005375 | copper ion transmembrane transporter activity(GO:0005375) |
| 0.0 | 0.3 | GO:0034714 | type III transforming growth factor beta receptor binding(GO:0034714) |
| 0.0 | 10.6 | GO:0005200 | structural constituent of cytoskeleton(GO:0005200) |
| 0.0 | 0.1 | GO:0010698 | acetyltransferase activator activity(GO:0010698) |
| 0.0 | 0.3 | GO:0043208 | glycosphingolipid binding(GO:0043208) |
| 0.0 | 0.4 | GO:0016167 | glial cell-derived neurotrophic factor receptor activity(GO:0016167) |
| 0.0 | 0.2 | GO:0004703 | G-protein coupled receptor kinase activity(GO:0004703) rhodopsin kinase activity(GO:0050254) |
| 0.0 | 0.7 | GO:0005542 | folic acid binding(GO:0005542) |
| 0.0 | 0.8 | GO:0030306 | ADP-ribosylation factor binding(GO:0030306) |
| 0.0 | 0.8 | GO:0015643 | toxic substance binding(GO:0015643) |
| 0.0 | 0.6 | GO:0022821 | potassium:proton antiporter activity(GO:0015386) potassium ion antiporter activity(GO:0022821) |
| 0.0 | 1.2 | GO:0008066 | glutamate receptor activity(GO:0008066) |
| 0.0 | 1.6 | GO:0005164 | tumor necrosis factor receptor binding(GO:0005164) |
| 0.0 | 3.2 | GO:0005507 | copper ion binding(GO:0005507) |
| 0.0 | 0.1 | GO:0016503 | pheromone receptor activity(GO:0016503) |
| 0.0 | 0.4 | GO:0008821 | crossover junction endodeoxyribonuclease activity(GO:0008821) |
| 0.0 | 0.4 | GO:0022851 | GABA-gated chloride ion channel activity(GO:0022851) |
| 0.0 | 0.1 | GO:0005139 | interleukin-7 receptor binding(GO:0005139) |
| 0.0 | 0.4 | GO:0016286 | small conductance calcium-activated potassium channel activity(GO:0016286) |
| 0.0 | 0.2 | GO:0051120 | hepoxilin A3 synthase activity(GO:0051120) |
| 0.0 | 1.3 | GO:0008331 | high voltage-gated calcium channel activity(GO:0008331) |
| 0.0 | 1.5 | GO:0015248 | sterol transporter activity(GO:0015248) |
| 0.0 | 0.9 | GO:0001965 | G-protein alpha-subunit binding(GO:0001965) |
| 0.0 | 1.3 | GO:0030742 | GTP-dependent protein binding(GO:0030742) |
| 0.0 | 0.1 | GO:0008384 | IkappaB kinase activity(GO:0008384) |
| 0.0 | 0.1 | GO:0000224 | peptide-N4-(N-acetyl-beta-glucosaminyl)asparagine amidase activity(GO:0000224) |
| 0.0 | 0.1 | GO:0061649 | ubiquitinated histone binding(GO:0061649) |
| 0.0 | 0.2 | GO:0030144 | alpha-1,6-mannosylglycoprotein 6-beta-N-acetylglucosaminyltransferase activity(GO:0030144) |
| 0.0 | 1.7 | GO:0004033 | aldo-keto reductase (NADP) activity(GO:0004033) |
| 0.0 | 0.8 | GO:0004653 | polypeptide N-acetylgalactosaminyltransferase activity(GO:0004653) |
| 0.0 | 0.6 | GO:0070324 | thyroid hormone binding(GO:0070324) |
| 0.0 | 0.5 | GO:0050291 | sphingosine N-acyltransferase activity(GO:0050291) |
| 0.0 | 0.7 | GO:0042923 | neuropeptide binding(GO:0042923) |
| 0.0 | 0.9 | GO:0050321 | tau-protein kinase activity(GO:0050321) |
| 0.0 | 0.6 | GO:0008499 | UDP-galactose:beta-N-acetylglucosamine beta-1,3-galactosyltransferase activity(GO:0008499) |
| 0.0 | 0.2 | GO:0032422 | purine-rich negative regulatory element binding(GO:0032422) |
| 0.0 | 0.3 | GO:0030369 | ICAM-3 receptor activity(GO:0030369) |
| 0.0 | 0.2 | GO:1990763 | arrestin family protein binding(GO:1990763) |
| 0.0 | 0.2 | GO:0016413 | O-acetyltransferase activity(GO:0016413) |
| 0.0 | 1.0 | GO:0005388 | calcium-transporting ATPase activity(GO:0005388) |
| 0.0 | 0.3 | GO:0015187 | glycine transmembrane transporter activity(GO:0015187) |
| 0.0 | 0.8 | GO:0008190 | eukaryotic initiation factor 4E binding(GO:0008190) |
| 0.0 | 0.5 | GO:0005522 | profilin binding(GO:0005522) |
| 0.0 | 0.5 | GO:0010314 | phosphatidylinositol-5-phosphate binding(GO:0010314) |
| 0.0 | 0.4 | GO:0046935 | 1-phosphatidylinositol-3-kinase regulator activity(GO:0046935) |
| 0.0 | 0.3 | GO:0070740 | protein-glutamic acid ligase activity(GO:0070739) tubulin-glutamic acid ligase activity(GO:0070740) |
| 0.0 | 0.2 | GO:0003923 | GPI-anchor transamidase activity(GO:0003923) |
| 0.0 | 0.1 | GO:0031208 | POZ domain binding(GO:0031208) |
| 0.0 | 0.2 | GO:0004427 | inorganic diphosphatase activity(GO:0004427) |
| 0.0 | 0.3 | GO:0036402 | proteasome-activating ATPase activity(GO:0036402) |
| 0.0 | 1.0 | GO:0008239 | dipeptidyl-peptidase activity(GO:0008239) |
| 0.0 | 0.3 | GO:0035198 | miRNA binding(GO:0035198) |
| 0.0 | 0.6 | GO:0015278 | calcium-release channel activity(GO:0015278) ligand-gated calcium channel activity(GO:0099604) |
| 0.0 | 0.4 | GO:0043495 | protein anchor(GO:0043495) |
| 0.0 | 1.0 | GO:0042171 | 1-acylglycerol-3-phosphate O-acyltransferase activity(GO:0003841) lysophosphatidic acid acyltransferase activity(GO:0042171) lysophospholipid acyltransferase activity(GO:0071617) |
| 0.0 | 0.8 | GO:0003899 | DNA-directed RNA polymerase activity(GO:0003899) |
| 0.0 | 0.2 | GO:0005127 | ciliary neurotrophic factor receptor binding(GO:0005127) |
| 0.0 | 0.4 | GO:0004383 | guanylate cyclase activity(GO:0004383) |
| 0.0 | 0.6 | GO:0005326 | neurotransmitter transporter activity(GO:0005326) |
| 0.0 | 0.1 | GO:0047280 | nicotinamide phosphoribosyltransferase activity(GO:0047280) |
| 0.0 | 0.1 | GO:0035877 | death effector domain binding(GO:0035877) |
| 0.0 | 1.3 | GO:0030676 | Rac guanyl-nucleotide exchange factor activity(GO:0030676) |
| 0.0 | 1.0 | GO:0008188 | neuropeptide receptor activity(GO:0008188) |
| 0.0 | 0.6 | GO:0001056 | RNA polymerase III activity(GO:0001056) |
| 0.0 | 0.8 | GO:0034237 | protein kinase A regulatory subunit binding(GO:0034237) |
| 0.0 | 2.2 | GO:0035064 | methylated histone binding(GO:0035064) |
| 0.0 | 0.5 | GO:0008253 | 5'-nucleotidase activity(GO:0008253) |
| 0.0 | 0.5 | GO:0005092 | GDP-dissociation inhibitor activity(GO:0005092) |
| 0.0 | 0.3 | GO:0046625 | sphingolipid binding(GO:0046625) |
| 0.0 | 0.1 | GO:0004977 | melanocortin receptor activity(GO:0004977) |
| 0.0 | 0.1 | GO:0052901 | polyamine oxidase activity(GO:0046592) spermine:oxygen oxidoreductase (spermidine-forming) activity(GO:0052901) |
| 0.0 | 2.2 | GO:0004402 | histone acetyltransferase activity(GO:0004402) |
| 0.0 | 3.4 | GO:0008565 | protein transporter activity(GO:0008565) |
| 0.0 | 1.8 | GO:0042626 | primary active transmembrane transporter activity(GO:0015399) P-P-bond-hydrolysis-driven transmembrane transporter activity(GO:0015405) ATPase activity, coupled to transmembrane movement of substances(GO:0042626) |
| 0.0 | 0.4 | GO:0019957 | C-C chemokine binding(GO:0019957) |
| 0.0 | 0.1 | GO:0004347 | glucose-6-phosphate isomerase activity(GO:0004347) |
| 0.0 | 0.4 | GO:0048406 | nerve growth factor binding(GO:0048406) |
| 0.0 | 0.5 | GO:0030898 | actin-dependent ATPase activity(GO:0030898) |
| 0.0 | 0.1 | GO:0003839 | gamma-glutamylcyclotransferase activity(GO:0003839) |
| 0.0 | 0.1 | GO:0004507 | steroid 11-beta-monooxygenase activity(GO:0004507) corticosterone 18-monooxygenase activity(GO:0047783) |
| 0.0 | 0.5 | GO:0004143 | diacylglycerol kinase activity(GO:0004143) |
| 0.0 | 0.4 | GO:0034450 | ubiquitin-ubiquitin ligase activity(GO:0034450) |
| 0.0 | 0.2 | GO:0048039 | ubiquinone binding(GO:0048039) |
| 0.0 | 0.1 | GO:0071535 | RING-like zinc finger domain binding(GO:0071535) |
| 0.0 | 0.1 | GO:0008969 | phosphohistidine phosphatase activity(GO:0008969) |
| 0.0 | 0.1 | GO:0017077 | oxidative phosphorylation uncoupler activity(GO:0017077) |
| 0.0 | 0.5 | GO:0004659 | prenyltransferase activity(GO:0004659) |
| 0.0 | 0.2 | GO:0008597 | calcium-dependent protein serine/threonine phosphatase regulator activity(GO:0008597) |
| 0.0 | 0.5 | GO:0004535 | poly(A)-specific ribonuclease activity(GO:0004535) |
| 0.0 | 0.1 | GO:0004368 | glycerol-3-phosphate dehydrogenase activity(GO:0004368) oxidoreductase activity, acting on the CH-OH group of donors, quinone or similar compound as acceptor(GO:0016901) |
| 0.0 | 0.9 | GO:0008157 | protein phosphatase 1 binding(GO:0008157) |
| 0.0 | 1.2 | GO:0061631 | ubiquitin conjugating enzyme activity(GO:0061631) |
| 0.0 | 0.2 | GO:0008097 | 5S rRNA binding(GO:0008097) |
| 0.0 | 0.4 | GO:0052629 | phosphatidylinositol-3,5-bisphosphate 3-phosphatase activity(GO:0052629) |
| 0.0 | 1.2 | GO:0005546 | phosphatidylinositol-4,5-bisphosphate binding(GO:0005546) |
| 0.0 | 10.7 | GO:0015631 | tubulin binding(GO:0015631) |
| 0.0 | 0.5 | GO:0005251 | delayed rectifier potassium channel activity(GO:0005251) |
| 0.0 | 5.0 | GO:0001078 | transcriptional repressor activity, RNA polymerase II core promoter proximal region sequence-specific binding(GO:0001078) |
| 0.0 | 0.1 | GO:0044713 | GTP diphosphatase activity(GO:0036219) 2-hydroxy-adenosine triphosphate pyrophosphatase activity(GO:0044713) 2-hydroxy-(deoxy)adenosine-triphosphate pyrophosphatase activity(GO:0044714) ATP diphosphatase activity(GO:0047693) |
| 0.0 | 0.3 | GO:0009982 | pseudouridine synthase activity(GO:0009982) |
| 0.0 | 0.6 | GO:0005104 | fibroblast growth factor receptor binding(GO:0005104) |
| 0.0 | 0.2 | GO:0001042 | RNA polymerase I core binding(GO:0001042) |
| 0.0 | 0.2 | GO:0003720 | telomerase activity(GO:0003720) RNA-directed DNA polymerase activity(GO:0003964) |
| 0.0 | 0.1 | GO:0042289 | MHC class II protein binding(GO:0042289) |
| 0.0 | 0.1 | GO:0001875 | lipopolysaccharide receptor activity(GO:0001875) |
| 0.0 | 0.2 | GO:0008494 | translation activator activity(GO:0008494) |
| 0.0 | 0.2 | GO:1990247 | N6-methyladenosine-containing RNA binding(GO:1990247) |
| 0.0 | 0.1 | GO:0010997 | anaphase-promoting complex binding(GO:0010997) |
| 0.0 | 0.1 | GO:0005134 | interleukin-2 receptor binding(GO:0005134) |
| 0.0 | 0.4 | GO:0017025 | TBP-class protein binding(GO:0017025) |
| 0.0 | 1.9 | GO:0030165 | PDZ domain binding(GO:0030165) |
| 0.0 | 0.4 | GO:0008603 | cAMP-dependent protein kinase regulator activity(GO:0008603) |
| 0.0 | 0.1 | GO:0015319 | sodium:inorganic phosphate symporter activity(GO:0015319) |
| 0.0 | 3.3 | GO:0001046 | core promoter sequence-specific DNA binding(GO:0001046) |
| 0.0 | 0.2 | GO:1990381 | ubiquitin-specific protease binding(GO:1990381) |
| 0.0 | 0.1 | GO:0098770 | FBXO family protein binding(GO:0098770) |
| 0.0 | 0.7 | GO:0004115 | 3',5'-cyclic-AMP phosphodiesterase activity(GO:0004115) |
| 0.0 | 0.4 | GO:0035925 | mRNA 3'-UTR AU-rich region binding(GO:0035925) |
| 0.0 | 0.2 | GO:0070569 | uridylyltransferase activity(GO:0070569) |
| 0.0 | 0.6 | GO:0016701 | oxidoreductase activity, acting on single donors with incorporation of molecular oxygen(GO:0016701) oxidoreductase activity, acting on single donors with incorporation of molecular oxygen, incorporation of two atoms of oxygen(GO:0016702) |
| 0.0 | 1.9 | GO:0005516 | calmodulin binding(GO:0005516) |
| 0.0 | 0.4 | GO:0070064 | proline-rich region binding(GO:0070064) |
| 0.0 | 0.2 | GO:0043125 | ErbB-3 class receptor binding(GO:0043125) |
| 0.0 | 0.3 | GO:0043274 | phospholipase binding(GO:0043274) |
| 0.0 | 0.7 | GO:0042169 | SH2 domain binding(GO:0042169) |
| 0.0 | 0.1 | GO:0008269 | JAK pathway signal transduction adaptor activity(GO:0008269) |
| 0.0 | 0.2 | GO:0097371 | MDM2/MDM4 family protein binding(GO:0097371) |
| 0.0 | 0.6 | GO:0015020 | glucuronosyltransferase activity(GO:0015020) |
| 0.0 | 0.1 | GO:0008823 | cupric reductase activity(GO:0008823) ferric-chelate reductase (NADPH) activity(GO:0052851) |
| 0.0 | 0.1 | GO:0005157 | macrophage colony-stimulating factor receptor binding(GO:0005157) |
| 0.0 | 0.2 | GO:0008139 | nuclear localization sequence binding(GO:0008139) |
| 0.0 | 0.2 | GO:0016018 | cyclosporin A binding(GO:0016018) |
| 0.0 | 0.0 | GO:0019948 | SUMO activating enzyme activity(GO:0019948) |
| 0.0 | 3.8 | GO:0061630 | ubiquitin protein ligase activity(GO:0061630) |
| 0.0 | 0.4 | GO:0005003 | ephrin receptor activity(GO:0005003) |
| 0.0 | 0.7 | GO:0004712 | protein serine/threonine/tyrosine kinase activity(GO:0004712) |
| 0.0 | 0.0 | GO:0090409 | malonyl-CoA synthetase activity(GO:0090409) |
| 0.0 | 0.0 | GO:0034584 | piRNA binding(GO:0034584) |
| 0.0 | 0.8 | GO:0030145 | manganese ion binding(GO:0030145) |
| 0.0 | 8.0 | GO:0003779 | actin binding(GO:0003779) |
| 0.0 | 0.4 | GO:0032266 | phosphatidylinositol-3-phosphate binding(GO:0032266) |
| 0.0 | 3.2 | GO:0008022 | protein C-terminus binding(GO:0008022) |
| 0.0 | 1.0 | GO:0003730 | mRNA 3'-UTR binding(GO:0003730) |
| 0.0 | 0.1 | GO:0036041 | long-chain fatty acid binding(GO:0036041) |
| 0.0 | 0.1 | GO:0036132 | 13-prostaglandin reductase activity(GO:0036132) 15-oxoprostaglandin 13-oxidase activity(GO:0047522) |
| 0.0 | 0.3 | GO:0051879 | Hsp90 protein binding(GO:0051879) |
| 0.0 | 0.0 | GO:0008434 | calcitriol receptor activity(GO:0008434) lithocholic acid receptor activity(GO:0038186) calcitriol binding(GO:1902098) lithocholic acid binding(GO:1902121) D3 vitamins binding(GO:1902271) |
| 0.0 | 0.0 | GO:0008478 | pyridoxal kinase activity(GO:0008478) lithium ion binding(GO:0031403) |
| 0.0 | 0.4 | GO:0005227 | calcium activated cation channel activity(GO:0005227) |
| 0.0 | 0.2 | GO:0043531 | ADP binding(GO:0043531) |
| 0.0 | 0.1 | GO:0005124 | scavenger receptor binding(GO:0005124) |
| 0.0 | 0.1 | GO:0008853 | exodeoxyribonuclease III activity(GO:0008853) |
| 0.0 | 0.3 | GO:0008409 | 5'-3' exonuclease activity(GO:0008409) |
Gene overrepresentation in curated gene sets: canonical pathways category:
| Log-likelihood per target | Total log-likelihood | Term | Description |
|---|---|---|---|
| 0.4 | 9.9 | PID P38 GAMMA DELTA PATHWAY | Signaling mediated by p38-gamma and p38-delta |
| 0.3 | 13.6 | ST WNT CA2 CYCLIC GMP PATHWAY | Wnt/Ca2+/cyclic GMP signaling. |
| 0.1 | 1.8 | PID ATF2 PATHWAY | ATF-2 transcription factor network |
| 0.1 | 7.8 | PID REELIN PATHWAY | Reelin signaling pathway |
| 0.1 | 4.8 | ST MYOCYTE AD PATHWAY | Myocyte Adrenergic Pathway is a specific case of the generalized Adrenergic Pathway. |
| 0.1 | 3.2 | PID LPA4 PATHWAY | LPA4-mediated signaling events |
| 0.1 | 0.8 | PID FOXO PATHWAY | FoxO family signaling |
| 0.1 | 0.8 | PID THROMBIN PAR4 PATHWAY | PAR4-mediated thrombin signaling events |
| 0.1 | 5.7 | PID NETRIN PATHWAY | Netrin-mediated signaling events |
| 0.1 | 3.2 | PID P38 MK2 PATHWAY | p38 signaling mediated by MAPKAP kinases |
| 0.1 | 1.1 | PID HDAC CLASSIII PATHWAY | Signaling events mediated by HDAC Class III |
| 0.1 | 0.3 | PID WNT CANONICAL PATHWAY | Canonical Wnt signaling pathway |
| 0.0 | 1.7 | PID CONE PATHWAY | Visual signal transduction: Cones |
| 0.0 | 1.9 | PID IL8 CXCR1 PATHWAY | IL8- and CXCR1-mediated signaling events |
| 0.0 | 4.3 | PID MTOR 4PATHWAY | mTOR signaling pathway |
| 0.0 | 0.8 | PID IL2 1PATHWAY | IL2-mediated signaling events |
| 0.0 | 1.0 | PID TCR JNK PATHWAY | JNK signaling in the CD4+ TCR pathway |
| 0.0 | 0.4 | PID CXCR4 PATHWAY | CXCR4-mediated signaling events |
| 0.0 | 2.5 | PID ARF6 PATHWAY | Arf6 signaling events |
| 0.0 | 1.1 | PID PRL SIGNALING EVENTS PATHWAY | Signaling events mediated by PRL |
| 0.0 | 0.3 | PID RETINOIC ACID PATHWAY | Retinoic acid receptors-mediated signaling |
| 0.0 | 2.5 | SIG CHEMOTAXIS | Genes related to chemotaxis |
| 0.0 | 2.1 | PID AURORA A PATHWAY | Aurora A signaling |
| 0.0 | 1.4 | PID PI3KCI PATHWAY | Class I PI3K signaling events |
| 0.0 | 0.6 | PID RAC1 PATHWAY | RAC1 signaling pathway |
| 0.0 | 1.5 | PID EPHB FWD PATHWAY | EPHB forward signaling |
| 0.0 | 2.1 | PID MET PATHWAY | Signaling events mediated by Hepatocyte Growth Factor Receptor (c-Met) |
| 0.0 | 1.4 | PID ARF6 TRAFFICKING PATHWAY | Arf6 trafficking events |
| 0.0 | 0.3 | PID IL2 PI3K PATHWAY | IL2 signaling events mediated by PI3K |
| 0.0 | 1.3 | PID LKB1 PATHWAY | LKB1 signaling events |
| 0.0 | 0.2 | PID AR NONGENOMIC PATHWAY | Nongenotropic Androgen signaling |
| 0.0 | 0.7 | PID REG GR PATHWAY | Glucocorticoid receptor regulatory network |
| 0.0 | 0.8 | ST T CELL SIGNAL TRANSDUCTION | T Cell Signal Transduction |
| 0.0 | 0.2 | PID MYC PATHWAY | C-MYC pathway |
| 0.0 | 0.7 | SA MMP CYTOKINE CONNECTION | Cytokines can induce activation of matrix metalloproteinases, which degrade extracellular matrix. |
| 0.0 | 0.9 | PID ECADHERIN NASCENT AJ PATHWAY | E-cadherin signaling in the nascent adherens junction |
| 0.0 | 0.4 | SIG CD40PATHWAYMAP | Genes related to CD40 signaling |
| 0.0 | 0.3 | PID INTEGRIN CS PATHWAY | Integrin family cell surface interactions |
| 0.0 | 0.2 | SIG IL4RECEPTOR IN B LYPHOCYTES | Genes related to IL4 rceptor signaling in B lymphocytes |
| 0.0 | 0.2 | PID ECADHERIN KERATINOCYTE PATHWAY | E-cadherin signaling in keratinocytes |
| 0.0 | 1.0 | PID TRKR PATHWAY | Neurotrophic factor-mediated Trk receptor signaling |
| 0.0 | 0.2 | PID EPHA FWDPATHWAY | EPHA forward signaling |
| 0.0 | 0.4 | SIG PIP3 SIGNALING IN CARDIAC MYOCTES | Genes related to PIP3 signaling in cardiac myocytes |
| 0.0 | 0.2 | PID NFAT TFPATHWAY | Calcineurin-regulated NFAT-dependent transcription in lymphocytes |
Gene overrepresentation in curated gene sets: REACTOME pathways category:
| Log-likelihood per target | Total log-likelihood | Term | Description |
|---|---|---|---|
| 0.5 | 21.9 | REACTOME RAS ACTIVATION UOPN CA2 INFUX THROUGH NMDA RECEPTOR | Genes involved in Ras activation uopn Ca2+ infux through NMDA receptor |
| 0.2 | 6.2 | REACTOME ABCA TRANSPORTERS IN LIPID HOMEOSTASIS | Genes involved in ABCA transporters in lipid homeostasis |
| 0.2 | 6.2 | REACTOME CITRIC ACID CYCLE TCA CYCLE | Genes involved in Citric acid cycle (TCA cycle) |
| 0.2 | 4.2 | REACTOME REGULATION OF PYRUVATE DEHYDROGENASE PDH COMPLEX | Genes involved in Regulation of pyruvate dehydrogenase (PDH) complex |
| 0.2 | 3.5 | REACTOME ROLE OF DCC IN REGULATING APOPTOSIS | Genes involved in Role of DCC in regulating apoptosis |
| 0.2 | 7.2 | REACTOME TRANSFERRIN ENDOCYTOSIS AND RECYCLING | Genes involved in Transferrin endocytosis and recycling |
| 0.2 | 1.4 | REACTOME CYTOSOLIC TRNA AMINOACYLATION | Genes involved in Cytosolic tRNA aminoacylation |
| 0.2 | 5.8 | REACTOME FORMATION OF TUBULIN FOLDING INTERMEDIATES BY CCT TRIC | Genes involved in Formation of tubulin folding intermediates by CCT/TriC |
| 0.2 | 4.3 | REACTOME P38MAPK EVENTS | Genes involved in p38MAPK events |
| 0.1 | 2.7 | REACTOME PURINE RIBONUCLEOSIDE MONOPHOSPHATE BIOSYNTHESIS | Genes involved in Purine ribonucleoside monophosphate biosynthesis |
| 0.1 | 2.5 | REACTOME NEF MEDIATED DOWNREGULATION OF MHC CLASS I COMPLEX CELL SURFACE EXPRESSION | Genes involved in Nef mediated downregulation of MHC class I complex cell surface expression |
| 0.1 | 2.6 | REACTOME BILE SALT AND ORGANIC ANION SLC TRANSPORTERS | Genes involved in Bile salt and organic anion SLC transporters |
| 0.1 | 2.6 | REACTOME REGULATION OF RHEB GTPASE ACTIVITY BY AMPK | Genes involved in Regulation of Rheb GTPase activity by AMPK |
| 0.1 | 4.0 | REACTOME CTNNB1 PHOSPHORYLATION CASCADE | Genes involved in Beta-catenin phosphorylation cascade |
| 0.1 | 4.1 | REACTOME NA CL DEPENDENT NEUROTRANSMITTER TRANSPORTERS | Genes involved in Na+/Cl- dependent neurotransmitter transporters |
| 0.1 | 3.0 | REACTOME BRANCHED CHAIN AMINO ACID CATABOLISM | Genes involved in Branched-chain amino acid catabolism |
| 0.1 | 4.2 | REACTOME LYSOSOME VESICLE BIOGENESIS | Genes involved in Lysosome Vesicle Biogenesis |
| 0.1 | 2.7 | REACTOME PURINE SALVAGE | Genes involved in Purine salvage |
| 0.1 | 1.9 | REACTOME ADENYLATE CYCLASE ACTIVATING PATHWAY | Genes involved in Adenylate cyclase activating pathway |
| 0.1 | 1.5 | REACTOME UNBLOCKING OF NMDA RECEPTOR GLUTAMATE BINDING AND ACTIVATION | Genes involved in Unblocking of NMDA receptor, glutamate binding and activation |
| 0.1 | 3.5 | REACTOME CRMPS IN SEMA3A SIGNALING | Genes involved in CRMPs in Sema3A signaling |
| 0.1 | 3.7 | REACTOME TERMINATION OF O GLYCAN BIOSYNTHESIS | Genes involved in Termination of O-glycan biosynthesis |
| 0.1 | 3.0 | REACTOME THE ROLE OF NEF IN HIV1 REPLICATION AND DISEASE PATHOGENESIS | Genes involved in The role of Nef in HIV-1 replication and disease pathogenesis |
| 0.1 | 5.2 | REACTOME GLYCOLYSIS | Genes involved in Glycolysis |
| 0.1 | 1.5 | REACTOME REVERSIBLE HYDRATION OF CARBON DIOXIDE | Genes involved in Reversible Hydration of Carbon Dioxide |
| 0.1 | 1.8 | REACTOME P2Y RECEPTORS | Genes involved in P2Y receptors |
| 0.1 | 1.0 | REACTOME RAF MAP KINASE CASCADE | Genes involved in RAF/MAP kinase cascade |
| 0.1 | 1.1 | REACTOME MRNA DECAY BY 3 TO 5 EXORIBONUCLEASE | Genes involved in mRNA Decay by 3' to 5' Exoribonuclease |
| 0.1 | 4.5 | REACTOME INTERACTION BETWEEN L1 AND ANKYRINS | Genes involved in Interaction between L1 and Ankyrins |
| 0.1 | 0.9 | REACTOME DSCAM INTERACTIONS | Genes involved in DSCAM interactions |
| 0.1 | 0.9 | REACTOME MRNA CAPPING | Genes involved in mRNA Capping |
| 0.1 | 0.6 | REACTOME THROMBIN SIGNALLING THROUGH PROTEINASE ACTIVATED RECEPTORS PARS | Genes involved in Thrombin signalling through proteinase activated receptors (PARs) |
| 0.1 | 1.6 | REACTOME TRAF3 DEPENDENT IRF ACTIVATION PATHWAY | Genes involved in TRAF3-dependent IRF activation pathway |
| 0.1 | 2.5 | REACTOME SYNTHESIS OF PC | Genes involved in Synthesis of PC |
| 0.1 | 1.0 | REACTOME FORMATION OF TRANSCRIPTION COUPLED NER TC NER REPAIR COMPLEX | Genes involved in Formation of transcription-coupled NER (TC-NER) repair complex |
| 0.1 | 0.9 | REACTOME CDC6 ASSOCIATION WITH THE ORC ORIGIN COMPLEX | Genes involved in CDC6 association with the ORC:origin complex |
| 0.1 | 2.3 | REACTOME SULFUR AMINO ACID METABOLISM | Genes involved in Sulfur amino acid metabolism |
| 0.1 | 2.3 | REACTOME INWARDLY RECTIFYING K CHANNELS | Genes involved in Inwardly rectifying K+ channels |
| 0.1 | 1.8 | REACTOME IONOTROPIC ACTIVITY OF KAINATE RECEPTORS | Genes involved in Ionotropic activity of Kainate Receptors |
| 0.1 | 1.5 | REACTOME RECYCLING PATHWAY OF L1 | Genes involved in Recycling pathway of L1 |
| 0.1 | 1.2 | REACTOME TRANSPORT OF ORGANIC ANIONS | Genes involved in Transport of organic anions |
| 0.0 | 5.6 | REACTOME PEPTIDE LIGAND BINDING RECEPTORS | Genes involved in Peptide ligand-binding receptors |
| 0.0 | 0.9 | REACTOME CLASS C 3 METABOTROPIC GLUTAMATE PHEROMONE RECEPTORS | Genes involved in Class C/3 (Metabotropic glutamate/pheromone receptors) |
| 0.0 | 1.5 | REACTOME ACYL CHAIN REMODELLING OF PE | Genes involved in Acyl chain remodelling of PE |
| 0.0 | 1.1 | REACTOME TANDEM PORE DOMAIN POTASSIUM CHANNELS | Genes involved in Tandem pore domain potassium channels |
| 0.0 | 1.2 | REACTOME AMINE DERIVED HORMONES | Genes involved in Amine-derived hormones |
| 0.0 | 2.0 | REACTOME RNA POL III TRANSCRIPTION INITIATION FROM TYPE 2 PROMOTER | Genes involved in RNA Polymerase III Transcription Initiation From Type 2 Promoter |
| 0.0 | 3.5 | REACTOME VOLTAGE GATED POTASSIUM CHANNELS | Genes involved in Voltage gated Potassium channels |
| 0.0 | 13.3 | REACTOME G ALPHA I SIGNALLING EVENTS | Genes involved in G alpha (i) signalling events |
| 0.0 | 1.9 | REACTOME SYNTHESIS OF VERY LONG CHAIN FATTY ACYL COAS | Genes involved in Synthesis of very long-chain fatty acyl-CoAs |
| 0.0 | 0.1 | REACTOME ABORTIVE ELONGATION OF HIV1 TRANSCRIPT IN THE ABSENCE OF TAT | Genes involved in Abortive elongation of HIV-1 transcript in the absence of Tat |
| 0.0 | 1.2 | REACTOME SYNTHESIS OF PA | Genes involved in Synthesis of PA |
| 0.0 | 1.6 | REACTOME G0 AND EARLY G1 | Genes involved in G0 and Early G1 |
| 0.0 | 2.1 | REACTOME REGULATION OF GENE EXPRESSION IN BETA CELLS | Genes involved in Regulation of gene expression in beta cells |
| 0.0 | 1.0 | REACTOME POTASSIUM CHANNELS | Genes involved in Potassium Channels |
| 0.0 | 1.5 | REACTOME GENERATION OF SECOND MESSENGER MOLECULES | Genes involved in Generation of second messenger molecules |
| 0.0 | 2.8 | REACTOME RESPIRATORY ELECTRON TRANSPORT | Genes involved in Respiratory electron transport |
| 0.0 | 0.8 | REACTOME HIGHLY CALCIUM PERMEABLE POSTSYNAPTIC NICOTINIC ACETYLCHOLINE RECEPTORS | Genes involved in Highly calcium permeable postsynaptic nicotinic acetylcholine receptors |
| 0.0 | 0.8 | REACTOME SYNTHESIS OF GLYCOSYLPHOSPHATIDYLINOSITOL GPI | Genes involved in Synthesis of glycosylphosphatidylinositol (GPI) |
| 0.0 | 0.4 | REACTOME AKT PHOSPHORYLATES TARGETS IN THE CYTOSOL | Genes involved in AKT phosphorylates targets in the cytosol |
| 0.0 | 1.3 | REACTOME STEROID HORMONES | Genes involved in Steroid hormones |
| 0.0 | 0.7 | REACTOME MTORC1 MEDIATED SIGNALLING | Genes involved in mTORC1-mediated signalling |
| 0.0 | 1.0 | REACTOME RESOLUTION OF AP SITES VIA THE MULTIPLE NUCLEOTIDE PATCH REPLACEMENT PATHWAY | Genes involved in Resolution of AP sites via the multiple-nucleotide patch replacement pathway |
| 0.0 | 1.0 | REACTOME OTHER SEMAPHORIN INTERACTIONS | Genes involved in Other semaphorin interactions |
| 0.0 | 0.2 | REACTOME MITOTIC M M G1 PHASES | Genes involved in Mitotic M-M/G1 phases |
| 0.0 | 0.7 | REACTOME REGULATION OF BETA CELL DEVELOPMENT | Genes involved in Regulation of beta-cell development |
| 0.0 | 2.1 | REACTOME STRIATED MUSCLE CONTRACTION | Genes involved in Striated Muscle Contraction |
| 0.0 | 0.9 | REACTOME GLUCONEOGENESIS | Genes involved in Gluconeogenesis |
| 0.0 | 4.9 | REACTOME TRANSPORT OF INORGANIC CATIONS ANIONS AND AMINO ACIDS OLIGOPEPTIDES | Genes involved in Transport of inorganic cations/anions and amino acids/oligopeptides |
| 0.0 | 0.5 | REACTOME SYNTHESIS OF PIPS AT THE GOLGI MEMBRANE | Genes involved in Synthesis of PIPs at the Golgi membrane |
| 0.0 | 1.2 | REACTOME RNA POL II TRANSCRIPTION PRE INITIATION AND PROMOTER OPENING | Genes involved in RNA Polymerase II Transcription Pre-Initiation And Promoter Opening |
| 0.0 | 0.4 | REACTOME SYNTHESIS OF PIPS AT THE LATE ENDOSOME MEMBRANE | Genes involved in Synthesis of PIPs at the late endosome membrane |
| 0.0 | 1.4 | REACTOME SEMA4D IN SEMAPHORIN SIGNALING | Genes involved in Sema4D in semaphorin signaling |
| 0.0 | 0.5 | REACTOME MRNA DECAY BY 5 TO 3 EXORIBONUCLEASE | Genes involved in mRNA Decay by 5' to 3' Exoribonuclease |
| 0.0 | 1.5 | REACTOME ION TRANSPORT BY P TYPE ATPASES | Genes involved in Ion transport by P-type ATPases |
| 0.0 | 0.6 | REACTOME DCC MEDIATED ATTRACTIVE SIGNALING | Genes involved in DCC mediated attractive signaling |
| 0.0 | 0.3 | REACTOME UNWINDING OF DNA | Genes involved in Unwinding of DNA |
| 0.0 | 0.3 | REACTOME GLUCAGON SIGNALING IN METABOLIC REGULATION | Genes involved in Glucagon signaling in metabolic regulation |
| 0.0 | 0.4 | REACTOME SYNTHESIS SECRETION AND INACTIVATION OF GLP1 | Genes involved in Synthesis, Secretion, and Inactivation of Glucagon-like Peptide-1 (GLP-1) |
| 0.0 | 0.5 | REACTOME INTRINSIC PATHWAY | Genes involved in Intrinsic Pathway |
| 0.0 | 0.4 | REACTOME FGFR4 LIGAND BINDING AND ACTIVATION | Genes involved in FGFR4 ligand binding and activation |
| 0.0 | 0.1 | REACTOME RESPIRATORY ELECTRON TRANSPORT ATP SYNTHESIS BY CHEMIOSMOTIC COUPLING AND HEAT PRODUCTION BY UNCOUPLING PROTEINS | Genes involved in Respiratory electron transport, ATP synthesis by chemiosmotic coupling, and heat production by uncoupling proteins. |
| 0.0 | 1.1 | REACTOME SYNTHESIS OF PIPS AT THE PLASMA MEMBRANE | Genes involved in Synthesis of PIPs at the plasma membrane |
| 0.0 | 0.5 | REACTOME A TETRASACCHARIDE LINKER SEQUENCE IS REQUIRED FOR GAG SYNTHESIS | Genes involved in A tetrasaccharide linker sequence is required for GAG synthesis |
| 0.0 | 1.0 | REACTOME EFFECTS OF PIP2 HYDROLYSIS | Genes involved in Effects of PIP2 hydrolysis |
| 0.0 | 0.3 | REACTOME MITOCHONDRIAL FATTY ACID BETA OXIDATION | Genes involved in Mitochondrial Fatty Acid Beta-Oxidation |
| 0.0 | 0.3 | REACTOME ACTIVATION OF CHAPERONE GENES BY ATF6 ALPHA | Genes involved in Activation of Chaperone Genes by ATF6-alpha |
| 0.0 | 0.7 | REACTOME GABA A RECEPTOR ACTIVATION | Genes involved in GABA A receptor activation |
| 0.0 | 0.4 | REACTOME GPVI MEDIATED ACTIVATION CASCADE | Genes involved in GPVI-mediated activation cascade |
| 0.0 | 0.3 | REACTOME GRB2 SOS PROVIDES LINKAGE TO MAPK SIGNALING FOR INTERGRINS | Genes involved in GRB2:SOS provides linkage to MAPK signaling for Intergrins |
| 0.0 | 0.6 | REACTOME ASSOCIATION OF TRIC CCT WITH TARGET PROTEINS DURING BIOSYNTHESIS | Genes involved in Association of TriC/CCT with target proteins during biosynthesis |
| 0.0 | 0.4 | REACTOME TIE2 SIGNALING | Genes involved in Tie2 Signaling |
| 0.0 | 0.1 | REACTOME RETROGRADE NEUROTROPHIN SIGNALLING | Genes involved in Retrograde neurotrophin signalling |
| 0.0 | 0.1 | REACTOME PREFOLDIN MEDIATED TRANSFER OF SUBSTRATE TO CCT TRIC | Genes involved in Prefoldin mediated transfer of substrate to CCT/TriC |
| 0.0 | 0.2 | REACTOME RNA POL III TRANSCRIPTION INITIATION FROM TYPE 3 PROMOTER | Genes involved in RNA Polymerase III Transcription Initiation From Type 3 Promoter |
| 0.0 | 0.8 | REACTOME SIGNALING BY ROBO RECEPTOR | Genes involved in Signaling by Robo receptor |
| 0.0 | 0.2 | REACTOME POST CHAPERONIN TUBULIN FOLDING PATHWAY | Genes involved in Post-chaperonin tubulin folding pathway |
| 0.0 | 1.1 | REACTOME APOPTOTIC CLEAVAGE OF CELLULAR PROTEINS | Genes involved in Apoptotic cleavage of cellular proteins |
| 0.0 | 0.3 | REACTOME PRE NOTCH PROCESSING IN GOLGI | Genes involved in Pre-NOTCH Processing in Golgi |
| 0.0 | 0.3 | REACTOME INSULIN SYNTHESIS AND PROCESSING | Genes involved in Insulin Synthesis and Processing |
| 0.0 | 0.8 | REACTOME NCAM1 INTERACTIONS | Genes involved in NCAM1 interactions |
| 0.0 | 0.2 | REACTOME POST TRANSLATIONAL MODIFICATION SYNTHESIS OF GPI ANCHORED PROTEINS | Genes involved in Post-translational modification: synthesis of GPI-anchored proteins |
| 0.0 | 1.6 | REACTOME TRANSMISSION ACROSS CHEMICAL SYNAPSES | Genes involved in Transmission across Chemical Synapses |
| 0.0 | 0.3 | REACTOME DOWNSTREAM TCR SIGNALING | Genes involved in Downstream TCR signaling |
| 0.0 | 0.9 | REACTOME LOSS OF NLP FROM MITOTIC CENTROSOMES | Genes involved in Loss of Nlp from mitotic centrosomes |