Project
Illumina Body Map 2 (GSE30611)
Navigation
Downloads
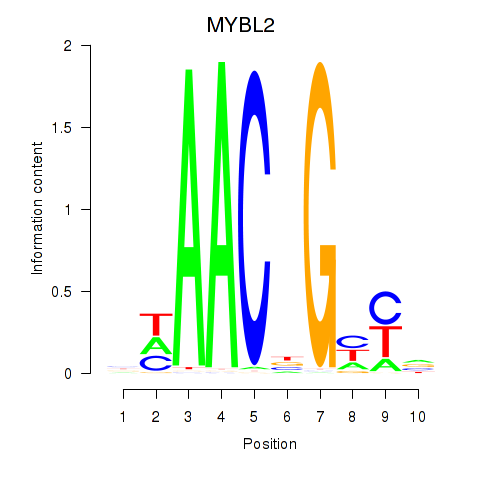
Results for MYBL2
Z-value: 3.32
Motif logo
Transcription factors associated with MYBL2
| Gene Symbol | Gene ID | Gene Info |
|---|---|---|
|
MYBL2
|
ENSG00000101057.16 | MYB proto-oncogene like 2 |
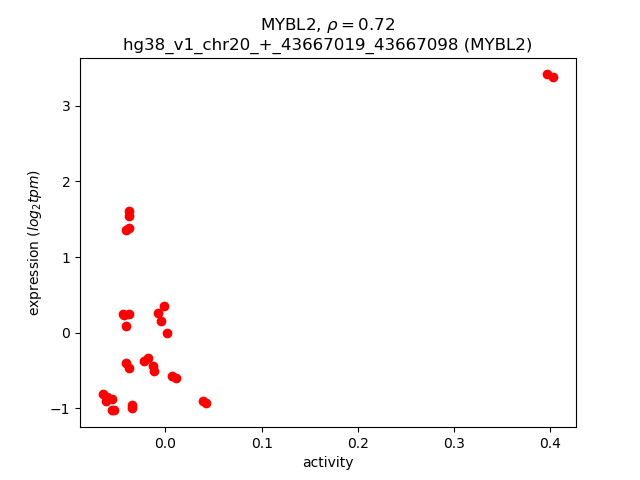
Activity-expression correlation:
| Gene | Promoter | Pearson corr. coef. | P-value | Plot |
|---|---|---|---|---|
| MYBL2 | hg38_v1_chr20_+_43667019_43667098 | 0.72 | 4.1e-06 | Click! |
Activity profile of MYBL2 motif
Sorted Z-values of MYBL2 motif
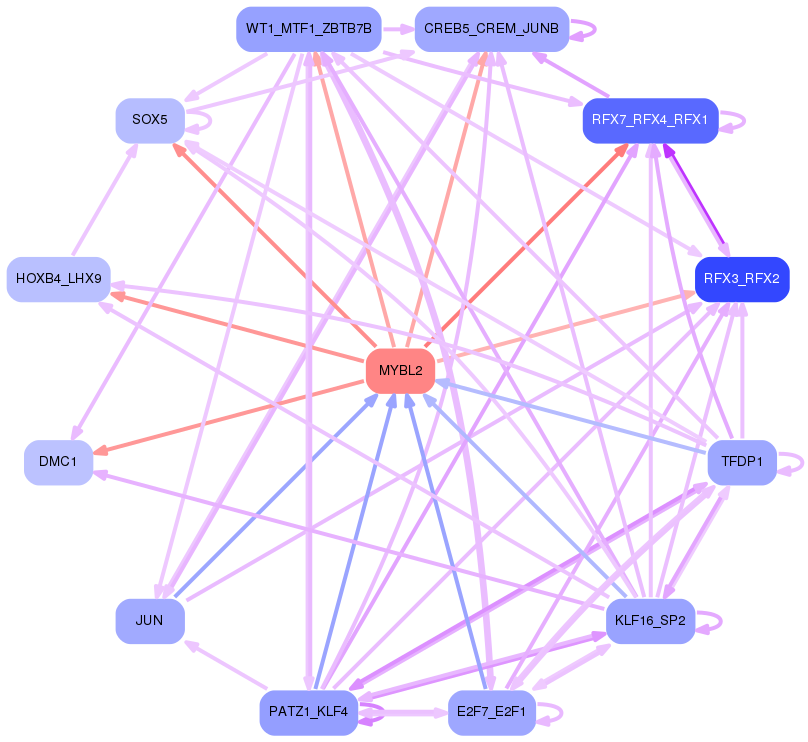
Network of associatons between targets according to the STRING database.

First level regulatory network of MYBL2
Gene Ontology Analysis
Gene overrepresentation in biological process category:
| Log-likelihood per target | Total log-likelihood | Term | Description |
|---|---|---|---|
| 5.6 | 16.7 | GO:0051039 | histone displacement(GO:0001207) positive regulation of transcription involved in meiotic cell cycle(GO:0051039) |
| 3.8 | 18.9 | GO:0046167 | glycerol-3-phosphate biosynthetic process(GO:0046167) |
| 3.7 | 18.5 | GO:0019249 | lactate biosynthetic process(GO:0019249) |
| 3.2 | 12.8 | GO:0000711 | meiotic DNA repair synthesis(GO:0000711) |
| 2.6 | 5.3 | GO:0007309 | oocyte construction(GO:0007308) oocyte axis specification(GO:0007309) oocyte anterior/posterior axis specification(GO:0007314) pole plasm assembly(GO:0007315) maternal determination of anterior/posterior axis, embryo(GO:0008358) P granule organization(GO:0030719) |
| 2.4 | 52.5 | GO:0034587 | piRNA metabolic process(GO:0034587) |
| 2.2 | 6.5 | GO:0007057 | spindle assembly involved in female meiosis I(GO:0007057) |
| 1.9 | 5.7 | GO:0003050 | regulation of systemic arterial blood pressure by atrial natriuretic peptide(GO:0003050) |
| 1.5 | 9.1 | GO:0048808 | male genitalia morphogenesis(GO:0048808) male anatomical structure morphogenesis(GO:0090598) |
| 1.4 | 7.1 | GO:0006015 | 5-phosphoribose 1-diphosphate biosynthetic process(GO:0006015) 5-phosphoribose 1-diphosphate metabolic process(GO:0046391) |
| 1.3 | 3.8 | GO:0035262 | gonad morphogenesis(GO:0035262) |
| 1.2 | 16.7 | GO:1902572 | negative regulation of serine-type endopeptidase activity(GO:1900004) negative regulation of serine-type peptidase activity(GO:1902572) |
| 1.1 | 9.1 | GO:0051754 | meiotic sister chromatid cohesion, centromeric(GO:0051754) |
| 1.1 | 6.7 | GO:0051177 | meiotic sister chromatid cohesion(GO:0051177) |
| 1.1 | 13.4 | GO:0032466 | negative regulation of cytokinesis(GO:0032466) |
| 1.1 | 13.2 | GO:0030951 | establishment or maintenance of microtubule cytoskeleton polarity(GO:0030951) |
| 1.1 | 3.3 | GO:0006532 | aspartate biosynthetic process(GO:0006532) |
| 1.1 | 6.5 | GO:0034721 | histone H3-K4 demethylation, trimethyl-H3-K4-specific(GO:0034721) |
| 1.1 | 3.2 | GO:1904158 | axonemal central apparatus assembly(GO:1904158) |
| 1.0 | 3.1 | GO:0030974 | thiamine pyrophosphate transport(GO:0030974) |
| 0.9 | 3.7 | GO:1990167 | protein K27-linked deubiquitination(GO:1990167) protein K33-linked deubiquitination(GO:1990168) |
| 0.9 | 27.5 | GO:0007342 | fusion of sperm to egg plasma membrane(GO:0007342) |
| 0.9 | 9.0 | GO:0021914 | negative regulation of smoothened signaling pathway involved in ventral spinal cord patterning(GO:0021914) |
| 0.8 | 5.9 | GO:0046601 | positive regulation of centriole replication(GO:0046601) |
| 0.8 | 18.2 | GO:0036159 | inner dynein arm assembly(GO:0036159) |
| 0.8 | 1.7 | GO:1903490 | regulation of cytokinetic process(GO:0032954) regulation of mitotic cytokinetic process(GO:1903436) positive regulation of mitotic cytokinetic process(GO:1903438) positive regulation of mitotic cytokinesis(GO:1903490) |
| 0.8 | 5.8 | GO:0000727 | double-strand break repair via break-induced replication(GO:0000727) |
| 0.8 | 7.4 | GO:0009253 | peptidoglycan metabolic process(GO:0000270) peptidoglycan catabolic process(GO:0009253) |
| 0.8 | 2.4 | GO:0070352 | positive regulation of white fat cell proliferation(GO:0070352) |
| 0.8 | 22.7 | GO:0007130 | synaptonemal complex assembly(GO:0007130) |
| 0.8 | 4.6 | GO:1903566 | positive regulation of protein localization to cilium(GO:1903566) |
| 0.7 | 14.0 | GO:0000712 | resolution of meiotic recombination intermediates(GO:0000712) |
| 0.7 | 2.9 | GO:2000681 | negative regulation of rubidium ion transport(GO:2000681) negative regulation of rubidium ion transmembrane transporter activity(GO:2000687) |
| 0.7 | 2.2 | GO:0048213 | Golgi vesicle prefusion complex stabilization(GO:0048213) |
| 0.7 | 2.8 | GO:0097156 | fasciculation of motor neuron axon(GO:0097156) |
| 0.7 | 4.1 | GO:0007341 | penetration of zona pellucida(GO:0007341) |
| 0.7 | 4.8 | GO:0032485 | Ral protein signal transduction(GO:0032484) regulation of Ral protein signal transduction(GO:0032485) |
| 0.7 | 2.6 | GO:0072299 | negative regulation of metanephric glomerulus development(GO:0072299) negative regulation of metanephric glomerular mesangial cell proliferation(GO:0072302) |
| 0.6 | 9.5 | GO:0000972 | transcription-dependent tethering of RNA polymerase II gene DNA at nuclear periphery(GO:0000972) |
| 0.6 | 1.9 | GO:1903597 | negative regulation of gap junction assembly(GO:1903597) |
| 0.6 | 2.3 | GO:0070476 | RNA (guanine-N7)-methylation(GO:0036265) rRNA (guanine-N7)-methylation(GO:0070476) |
| 0.6 | 1.7 | GO:0007525 | somatic muscle development(GO:0007525) |
| 0.6 | 1.1 | GO:0032053 | ciliary basal body organization(GO:0032053) |
| 0.6 | 2.3 | GO:0009786 | regulation of asymmetric cell division(GO:0009786) |
| 0.5 | 7.1 | GO:0043985 | histone H4-R3 methylation(GO:0043985) |
| 0.5 | 12.6 | GO:0003351 | epithelial cilium movement(GO:0003351) |
| 0.5 | 3.1 | GO:0035519 | protein K29-linked ubiquitination(GO:0035519) |
| 0.5 | 23.7 | GO:0007099 | centriole replication(GO:0007099) |
| 0.5 | 9.7 | GO:0070286 | axonemal dynein complex assembly(GO:0070286) |
| 0.5 | 4.8 | GO:0006528 | asparagine metabolic process(GO:0006528) |
| 0.5 | 1.4 | GO:0072720 | response to dithiothreitol(GO:0072720) |
| 0.5 | 2.3 | GO:0035574 | histone H4-K20 demethylation(GO:0035574) |
| 0.4 | 2.2 | GO:0071733 | transcriptional activation by promoter-enhancer looping(GO:0071733) gene looping(GO:0090202) dsDNA loop formation(GO:0090579) |
| 0.4 | 4.3 | GO:1903546 | protein localization to photoreceptor outer segment(GO:1903546) |
| 0.4 | 11.6 | GO:0001829 | trophectodermal cell differentiation(GO:0001829) |
| 0.4 | 2.9 | GO:0071477 | hypotonic salinity response(GO:0042539) cellular hypotonic salinity response(GO:0071477) |
| 0.4 | 4.7 | GO:0042148 | strand invasion(GO:0042148) |
| 0.3 | 1.0 | GO:2000525 | regulation of T cell costimulation(GO:2000523) positive regulation of T cell costimulation(GO:2000525) |
| 0.3 | 2.0 | GO:0035617 | stress granule disassembly(GO:0035617) |
| 0.3 | 1.0 | GO:0014016 | neuroblast differentiation(GO:0014016) |
| 0.3 | 1.0 | GO:0010513 | positive regulation of phosphatidylinositol biosynthetic process(GO:0010513) |
| 0.3 | 4.4 | GO:0055059 | asymmetric neuroblast division(GO:0055059) |
| 0.3 | 0.3 | GO:1904884 | telomerase catalytic core complex assembly(GO:1904868) regulation of telomerase catalytic core complex assembly(GO:1904882) positive regulation of telomerase catalytic core complex assembly(GO:1904884) |
| 0.3 | 0.9 | GO:0006597 | spermine biosynthetic process(GO:0006597) |
| 0.3 | 7.0 | GO:0051988 | regulation of attachment of spindle microtubules to kinetochore(GO:0051988) |
| 0.3 | 17.5 | GO:0035036 | sperm-egg recognition(GO:0035036) |
| 0.3 | 13.8 | GO:1904659 | hexose transmembrane transport(GO:0035428) glucose transmembrane transport(GO:1904659) |
| 0.3 | 3.0 | GO:0035092 | sperm chromatin condensation(GO:0035092) |
| 0.3 | 1.2 | GO:0010825 | positive regulation of centrosome duplication(GO:0010825) |
| 0.3 | 1.2 | GO:0006311 | meiotic gene conversion(GO:0006311) regulation of reciprocal meiotic recombination(GO:0010520) |
| 0.3 | 1.4 | GO:1904117 | response to vasopressin(GO:1904116) cellular response to vasopressin(GO:1904117) |
| 0.3 | 2.3 | GO:0032218 | riboflavin transport(GO:0032218) |
| 0.3 | 2.0 | GO:0044565 | dendritic cell proliferation(GO:0044565) |
| 0.3 | 1.4 | GO:0009139 | dUDP biosynthetic process(GO:0006227) dTDP biosynthetic process(GO:0006233) pyrimidine nucleoside diphosphate biosynthetic process(GO:0009139) pyrimidine deoxyribonucleoside diphosphate metabolic process(GO:0009196) pyrimidine deoxyribonucleoside diphosphate biosynthetic process(GO:0009197) dTDP metabolic process(GO:0046072) dUDP metabolic process(GO:0046077) |
| 0.3 | 3.1 | GO:0060285 | cilium-dependent cell motility(GO:0060285) |
| 0.3 | 2.7 | GO:0003352 | regulation of cilium movement(GO:0003352) |
| 0.3 | 1.8 | GO:2000348 | regulation of CD40 signaling pathway(GO:2000348) |
| 0.3 | 5.5 | GO:1990001 | inhibition of cysteine-type endopeptidase activity involved in apoptotic process(GO:1990001) |
| 0.3 | 35.8 | GO:0000079 | regulation of cyclin-dependent protein serine/threonine kinase activity(GO:0000079) |
| 0.3 | 0.8 | GO:0035526 | retrograde transport, plasma membrane to Golgi(GO:0035526) |
| 0.3 | 1.5 | GO:0034165 | positive regulation of toll-like receptor 9 signaling pathway(GO:0034165) |
| 0.2 | 0.7 | GO:0002465 | peripheral T cell tolerance induction(GO:0002458) peripheral tolerance induction(GO:0002465) |
| 0.2 | 8.6 | GO:0007140 | male meiosis(GO:0007140) |
| 0.2 | 0.9 | GO:1903565 | negative regulation of protein localization to cilium(GO:1903565) regulation of protein localization to ciliary membrane(GO:1903567) negative regulation of protein localization to ciliary membrane(GO:1903568) |
| 0.2 | 1.4 | GO:2000825 | positive regulation of androgen receptor activity(GO:2000825) |
| 0.2 | 0.9 | GO:0061015 | snRNA import into nucleus(GO:0061015) |
| 0.2 | 1.4 | GO:0019747 | regulation of isoprenoid metabolic process(GO:0019747) |
| 0.2 | 0.7 | GO:1901253 | negative regulation of intracellular transport of viral material(GO:1901253) |
| 0.2 | 2.3 | GO:0030472 | mitotic spindle organization in nucleus(GO:0030472) |
| 0.2 | 0.8 | GO:0000454 | snoRNA guided rRNA pseudouridine synthesis(GO:0000454) |
| 0.2 | 2.3 | GO:0034723 | DNA replication-dependent nucleosome assembly(GO:0006335) DNA replication-dependent nucleosome organization(GO:0034723) |
| 0.2 | 0.8 | GO:0060061 | Spemann organizer formation(GO:0060061) positive regulation of dermatome development(GO:0061184) |
| 0.2 | 1.8 | GO:0010265 | SCF complex assembly(GO:0010265) |
| 0.2 | 34.6 | GO:0007286 | spermatid development(GO:0007286) |
| 0.2 | 7.6 | GO:0045143 | homologous chromosome segregation(GO:0045143) |
| 0.2 | 0.2 | GO:0021691 | cerebellar Purkinje cell layer maturation(GO:0021691) |
| 0.2 | 0.8 | GO:0016240 | autophagosome docking(GO:0016240) |
| 0.2 | 4.9 | GO:0000022 | mitotic spindle elongation(GO:0000022) spindle elongation(GO:0051231) |
| 0.2 | 0.5 | GO:0035281 | pre-miRNA export from nucleus(GO:0035281) |
| 0.2 | 10.5 | GO:0042769 | DNA damage response, detection of DNA damage(GO:0042769) |
| 0.2 | 3.6 | GO:0098719 | sodium ion import across plasma membrane(GO:0098719) sodium ion import into cell(GO:1990118) |
| 0.2 | 0.7 | GO:0060298 | positive regulation of sarcomere organization(GO:0060298) |
| 0.2 | 0.7 | GO:0048073 | regulation of eye pigmentation(GO:0048073) |
| 0.2 | 0.8 | GO:0072144 | glomerular mesangial cell development(GO:0072144) |
| 0.2 | 16.4 | GO:0045600 | positive regulation of fat cell differentiation(GO:0045600) |
| 0.2 | 11.6 | GO:0042149 | cellular response to glucose starvation(GO:0042149) |
| 0.2 | 0.6 | GO:0098942 | cytoskeletal matrix organization at active zone(GO:0048789) neurexin clustering involved in presynaptic membrane assembly(GO:0097115) retrograde trans-synaptic signaling by trans-synaptic protein complex(GO:0098942) |
| 0.2 | 2.6 | GO:0061525 | hindgut development(GO:0061525) |
| 0.2 | 3.3 | GO:0007096 | regulation of exit from mitosis(GO:0007096) |
| 0.2 | 7.7 | GO:1901998 | toxin transport(GO:1901998) |
| 0.1 | 2.8 | GO:0031163 | iron-sulfur cluster assembly(GO:0016226) metallo-sulfur cluster assembly(GO:0031163) |
| 0.1 | 0.4 | GO:0044725 | chromatin reprogramming in the zygote(GO:0044725) |
| 0.1 | 1.6 | GO:0035965 | cardiolipin acyl-chain remodeling(GO:0035965) |
| 0.1 | 2.5 | GO:1902004 | positive regulation of beta-amyloid formation(GO:1902004) |
| 0.1 | 0.7 | GO:0046900 | tetrahydrofolylpolyglutamate metabolic process(GO:0046900) |
| 0.1 | 1.2 | GO:0006398 | mRNA 3'-end processing by stem-loop binding and cleavage(GO:0006398) |
| 0.1 | 1.3 | GO:0019276 | UDP-N-acetylgalactosamine metabolic process(GO:0019276) |
| 0.1 | 0.6 | GO:0070901 | mitochondrial tRNA methylation(GO:0070901) |
| 0.1 | 4.1 | GO:0040020 | regulation of meiotic nuclear division(GO:0040020) |
| 0.1 | 0.5 | GO:0051902 | negative regulation of mitochondrial depolarization(GO:0051902) |
| 0.1 | 1.1 | GO:0060770 | negative regulation of epithelial cell proliferation involved in prostate gland development(GO:0060770) |
| 0.1 | 1.3 | GO:0034501 | protein localization to kinetochore(GO:0034501) |
| 0.1 | 0.3 | GO:0000412 | histone peptidyl-prolyl isomerization(GO:0000412) |
| 0.1 | 1.9 | GO:1901748 | leukotriene D4 metabolic process(GO:1901748) leukotriene D4 biosynthetic process(GO:1901750) |
| 0.1 | 6.1 | GO:0042462 | eye photoreceptor cell development(GO:0042462) |
| 0.1 | 2.6 | GO:0035020 | regulation of Rac protein signal transduction(GO:0035020) |
| 0.1 | 0.8 | GO:0035672 | oligopeptide transmembrane transport(GO:0035672) |
| 0.1 | 0.8 | GO:0051684 | maintenance of Golgi location(GO:0051684) |
| 0.1 | 1.4 | GO:0048227 | plasma membrane to endosome transport(GO:0048227) |
| 0.1 | 0.7 | GO:0071109 | superior temporal gyrus development(GO:0071109) |
| 0.1 | 0.3 | GO:0097198 | histone H3-K36 trimethylation(GO:0097198) |
| 0.1 | 2.8 | GO:0090036 | regulation of protein kinase C signaling(GO:0090036) |
| 0.1 | 4.1 | GO:0006607 | NLS-bearing protein import into nucleus(GO:0006607) |
| 0.1 | 2.9 | GO:0030207 | chondroitin sulfate catabolic process(GO:0030207) |
| 0.1 | 5.8 | GO:0016574 | histone ubiquitination(GO:0016574) |
| 0.1 | 2.0 | GO:0016024 | CDP-diacylglycerol biosynthetic process(GO:0016024) |
| 0.1 | 0.2 | GO:0000350 | generation of catalytic spliceosome for second transesterification step(GO:0000350) |
| 0.1 | 0.5 | GO:0046103 | adenosine catabolic process(GO:0006154) inosine biosynthetic process(GO:0046103) |
| 0.1 | 3.8 | GO:0006336 | DNA replication-independent nucleosome assembly(GO:0006336) |
| 0.1 | 3.5 | GO:0045947 | negative regulation of translational initiation(GO:0045947) |
| 0.1 | 0.2 | GO:0042727 | flavin-containing compound biosynthetic process(GO:0042727) |
| 0.1 | 1.2 | GO:0035331 | negative regulation of hippo signaling(GO:0035331) |
| 0.1 | 0.2 | GO:0020012 | evasion or tolerance of host immune response(GO:0020012) evasion or tolerance of host defense response(GO:0030682) evasion or tolerance by virus of host immune response(GO:0030683) evasion or tolerance of immune response of other organism involved in symbiotic interaction(GO:0051805) evasion or tolerance of defense response of other organism involved in symbiotic interaction(GO:0051807) |
| 0.1 | 1.1 | GO:0031053 | primary miRNA processing(GO:0031053) |
| 0.1 | 0.7 | GO:0051725 | protein de-ADP-ribosylation(GO:0051725) |
| 0.1 | 1.1 | GO:0035721 | intraciliary retrograde transport(GO:0035721) |
| 0.1 | 0.8 | GO:0070995 | NADPH oxidation(GO:0070995) |
| 0.1 | 1.2 | GO:0000098 | sulfur amino acid catabolic process(GO:0000098) |
| 0.1 | 0.4 | GO:0034472 | snRNA 3'-end processing(GO:0034472) |
| 0.1 | 1.5 | GO:0031573 | intra-S DNA damage checkpoint(GO:0031573) |
| 0.1 | 1.2 | GO:0090179 | planar cell polarity pathway involved in neural tube closure(GO:0090179) |
| 0.1 | 2.5 | GO:0031114 | negative regulation of microtubule depolymerization(GO:0007026) regulation of microtubule depolymerization(GO:0031114) |
| 0.1 | 0.5 | GO:1900383 | regulation of synaptic plasticity by receptor localization to synapse(GO:1900383) |
| 0.1 | 1.3 | GO:0051292 | nuclear pore complex assembly(GO:0051292) |
| 0.1 | 0.6 | GO:0033314 | mitotic DNA replication checkpoint(GO:0033314) |
| 0.1 | 0.2 | GO:0050720 | interleukin-1 beta biosynthetic process(GO:0050720) |
| 0.1 | 2.5 | GO:0048268 | clathrin coat assembly(GO:0048268) |
| 0.1 | 0.8 | GO:0035865 | cellular response to potassium ion(GO:0035865) |
| 0.1 | 0.5 | GO:0051533 | positive regulation of NFAT protein import into nucleus(GO:0051533) |
| 0.1 | 0.8 | GO:0051612 | negative regulation of neurotransmitter uptake(GO:0051581) regulation of serotonin uptake(GO:0051611) negative regulation of serotonin uptake(GO:0051612) |
| 0.1 | 0.2 | GO:0098722 | germ-line stem cell division(GO:0042078) male germ-line stem cell asymmetric division(GO:0048133) asymmetric stem cell division(GO:0098722) germline stem cell asymmetric division(GO:0098728) |
| 0.1 | 1.0 | GO:0014877 | response to muscle inactivity involved in regulation of muscle adaptation(GO:0014877) response to denervation involved in regulation of muscle adaptation(GO:0014894) |
| 0.1 | 0.7 | GO:0016180 | snRNA processing(GO:0016180) |
| 0.1 | 0.9 | GO:0060372 | regulation of atrial cardiac muscle cell membrane repolarization(GO:0060372) |
| 0.1 | 0.8 | GO:0000717 | nucleotide-excision repair, DNA duplex unwinding(GO:0000717) |
| 0.1 | 1.2 | GO:0030502 | negative regulation of bone mineralization(GO:0030502) |
| 0.1 | 4.5 | GO:0048384 | retinoic acid receptor signaling pathway(GO:0048384) |
| 0.1 | 5.0 | GO:0099601 | regulation of neurotransmitter receptor activity(GO:0099601) |
| 0.1 | 0.6 | GO:0046959 | habituation(GO:0046959) |
| 0.1 | 0.2 | GO:2001034 | positive regulation of double-strand break repair via nonhomologous end joining(GO:2001034) |
| 0.0 | 5.7 | GO:1902600 | hydrogen ion transmembrane transport(GO:1902600) |
| 0.0 | 0.4 | GO:0035583 | sequestering of TGFbeta in extracellular matrix(GO:0035583) |
| 0.0 | 2.1 | GO:0006298 | mismatch repair(GO:0006298) |
| 0.0 | 0.5 | GO:0001672 | regulation of chromatin assembly or disassembly(GO:0001672) |
| 0.0 | 4.9 | GO:0016266 | O-glycan processing(GO:0016266) |
| 0.0 | 1.0 | GO:0016254 | preassembly of GPI anchor in ER membrane(GO:0016254) |
| 0.0 | 4.1 | GO:0035307 | positive regulation of dephosphorylation(GO:0035306) positive regulation of protein dephosphorylation(GO:0035307) |
| 0.0 | 0.5 | GO:0015793 | glycerol transport(GO:0015793) |
| 0.0 | 14.9 | GO:0090305 | nucleic acid phosphodiester bond hydrolysis(GO:0090305) |
| 0.0 | 0.3 | GO:0070942 | neutrophil mediated cytotoxicity(GO:0070942) neutrophil mediated killing of symbiont cell(GO:0070943) neutrophil mediated killing of bacterium(GO:0070944) |
| 0.0 | 1.1 | GO:0098828 | positive regulation of inhibitory postsynaptic potential(GO:0097151) modulation of inhibitory postsynaptic potential(GO:0098828) |
| 0.0 | 0.2 | GO:1900226 | negative regulation of NLRP3 inflammasome complex assembly(GO:1900226) |
| 0.0 | 5.1 | GO:0010923 | negative regulation of phosphatase activity(GO:0010923) |
| 0.0 | 0.6 | GO:0015871 | choline transport(GO:0015871) |
| 0.0 | 0.1 | GO:0019046 | release from viral latency(GO:0019046) |
| 0.0 | 0.4 | GO:0035360 | positive regulation of peroxisome proliferator activated receptor signaling pathway(GO:0035360) |
| 0.0 | 0.5 | GO:0030046 | parallel actin filament bundle assembly(GO:0030046) |
| 0.0 | 0.1 | GO:0031393 | negative regulation of prostaglandin biosynthetic process(GO:0031393) |
| 0.0 | 1.4 | GO:0022400 | regulation of rhodopsin mediated signaling pathway(GO:0022400) |
| 0.0 | 1.8 | GO:0090162 | establishment of epithelial cell polarity(GO:0090162) |
| 0.0 | 2.2 | GO:0001578 | microtubule bundle formation(GO:0001578) |
| 0.0 | 1.3 | GO:0035735 | intraciliary transport involved in cilium morphogenesis(GO:0035735) |
| 0.0 | 1.1 | GO:1903204 | negative regulation of oxidative stress-induced neuron death(GO:1903204) |
| 0.0 | 13.1 | GO:0007283 | spermatogenesis(GO:0007283) |
| 0.0 | 0.7 | GO:0010991 | regulation of SMAD protein complex assembly(GO:0010990) negative regulation of SMAD protein complex assembly(GO:0010991) |
| 0.0 | 0.6 | GO:0034384 | high-density lipoprotein particle clearance(GO:0034384) |
| 0.0 | 0.5 | GO:1904778 | protein localization to cell cortex(GO:0072697) regulation of protein localization to cell cortex(GO:1904776) positive regulation of protein localization to cell cortex(GO:1904778) |
| 0.0 | 1.2 | GO:0002026 | regulation of the force of heart contraction(GO:0002026) |
| 0.0 | 0.3 | GO:0042407 | cristae formation(GO:0042407) |
| 0.0 | 0.3 | GO:0039536 | negative regulation of RIG-I signaling pathway(GO:0039536) |
| 0.0 | 0.1 | GO:2000015 | regulation of determination of dorsal identity(GO:2000015) |
| 0.0 | 0.0 | GO:0001560 | regulation of cell growth by extracellular stimulus(GO:0001560) |
| 0.0 | 0.5 | GO:0043968 | histone H2A acetylation(GO:0043968) |
| 0.0 | 0.1 | GO:0006682 | galactosylceramide biosynthetic process(GO:0006682) galactolipid biosynthetic process(GO:0019375) |
| 0.0 | 1.8 | GO:0045540 | regulation of cholesterol biosynthetic process(GO:0045540) |
| 0.0 | 0.2 | GO:0007412 | axon target recognition(GO:0007412) |
| 0.0 | 4.9 | GO:0006310 | DNA recombination(GO:0006310) |
| 0.0 | 0.8 | GO:0021522 | spinal cord motor neuron differentiation(GO:0021522) |
| 0.0 | 0.3 | GO:0043248 | proteasome assembly(GO:0043248) |
| 0.0 | 0.2 | GO:0086073 | bundle of His cell-Purkinje myocyte adhesion involved in cell communication(GO:0086073) |
| 0.0 | 0.5 | GO:0072189 | ureter development(GO:0072189) |
| 0.0 | 0.3 | GO:1902748 | mammillary body development(GO:0021767) mammillary axonal complex development(GO:0061373) melanocyte migration(GO:0097324) positive regulation of lens fiber cell differentiation(GO:1902748) |
| 0.0 | 1.3 | GO:0031110 | regulation of microtubule polymerization or depolymerization(GO:0031110) |
| 0.0 | 0.3 | GO:0000715 | nucleotide-excision repair, DNA damage recognition(GO:0000715) |
| 0.0 | 0.2 | GO:0007185 | transmembrane receptor protein tyrosine phosphatase signaling pathway(GO:0007185) |
| 0.0 | 0.4 | GO:0051290 | protein heterotetramerization(GO:0051290) |
| 0.0 | 0.7 | GO:0071108 | protein K48-linked deubiquitination(GO:0071108) |
| 0.0 | 0.8 | GO:2000114 | regulation of establishment of cell polarity(GO:2000114) |
| 0.0 | 0.2 | GO:1904879 | positive regulation of calcium ion transmembrane transport via high voltage-gated calcium channel(GO:1904879) |
| 0.0 | 0.5 | GO:0007080 | mitotic metaphase plate congression(GO:0007080) |
| 0.0 | 0.3 | GO:0035970 | peptidyl-threonine dephosphorylation(GO:0035970) |
| 0.0 | 0.8 | GO:1904837 | beta-catenin-TCF complex assembly(GO:1904837) |
| 0.0 | 0.1 | GO:0090669 | telomerase RNA stabilization(GO:0090669) |
| 0.0 | 0.3 | GO:0070208 | protein heterotrimerization(GO:0070208) |
| 0.0 | 0.2 | GO:0070307 | lens fiber cell development(GO:0070307) |
| 0.0 | 0.1 | GO:0033629 | negative regulation of cell adhesion mediated by integrin(GO:0033629) |
| 0.0 | 1.1 | GO:0043507 | positive regulation of JUN kinase activity(GO:0043507) |
| 0.0 | 0.3 | GO:0007016 | cytoskeletal anchoring at plasma membrane(GO:0007016) |
| 0.0 | 0.5 | GO:0006622 | protein targeting to lysosome(GO:0006622) |
| 0.0 | 1.2 | GO:0006195 | purine nucleotide catabolic process(GO:0006195) |
| 0.0 | 0.3 | GO:0035196 | dsRNA fragmentation(GO:0031050) production of miRNAs involved in gene silencing by miRNA(GO:0035196) production of small RNA involved in gene silencing by RNA(GO:0070918) |
Gene overrepresentation in cellular component category:
| Log-likelihood per target | Total log-likelihood | Term | Description |
|---|---|---|---|
| 2.3 | 16.2 | GO:0000801 | central element(GO:0000801) |
| 2.2 | 6.5 | GO:0001674 | female germ cell nucleus(GO:0001674) |
| 1.6 | 43.7 | GO:0045495 | P granule(GO:0043186) pole plasm(GO:0045495) germ plasm(GO:0060293) |
| 1.4 | 5.7 | GO:0030892 | mitotic cohesin complex(GO:0030892) |
| 1.4 | 4.1 | GO:0043159 | acrosomal matrix(GO:0043159) |
| 1.3 | 13.0 | GO:0072687 | meiotic spindle(GO:0072687) |
| 1.1 | 4.4 | GO:0097123 | cyclin A1-CDK2 complex(GO:0097123) |
| 1.1 | 10.6 | GO:0033391 | chromatoid body(GO:0033391) |
| 1.1 | 3.2 | GO:1990716 | axonemal central apparatus(GO:1990716) |
| 1.0 | 9.7 | GO:0030915 | Smc5-Smc6 complex(GO:0030915) |
| 0.8 | 3.3 | GO:1990423 | RZZ complex(GO:1990423) |
| 0.7 | 22.2 | GO:0005682 | U5 snRNP(GO:0005682) |
| 0.7 | 6.2 | GO:0098536 | deuterosome(GO:0098536) |
| 0.7 | 5.5 | GO:0032133 | chromosome passenger complex(GO:0032133) |
| 0.7 | 3.4 | GO:0000942 | condensed nuclear chromosome outer kinetochore(GO:0000942) |
| 0.7 | 2.6 | GO:0097598 | sperm cytoplasmic droplet(GO:0097598) |
| 0.6 | 5.4 | GO:0033503 | HULC complex(GO:0033503) |
| 0.6 | 2.4 | GO:0071821 | FANCM-MHF complex(GO:0071821) |
| 0.6 | 6.8 | GO:0036128 | CatSper complex(GO:0036128) |
| 0.6 | 7.9 | GO:0031465 | Cul4B-RING E3 ubiquitin ligase complex(GO:0031465) |
| 0.5 | 32.4 | GO:0000795 | synaptonemal complex(GO:0000795) |
| 0.5 | 11.1 | GO:0097431 | mitotic spindle pole(GO:0097431) |
| 0.5 | 2.5 | GO:0036156 | inner dynein arm(GO:0036156) |
| 0.4 | 1.7 | GO:0097180 | protein C inhibitor-TMPRSS7 complex(GO:0036024) protein C inhibitor-TMPRSS11E complex(GO:0036025) protein C inhibitor-PLAT complex(GO:0036026) protein C inhibitor-PLAU complex(GO:0036027) protein C inhibitor-thrombin complex(GO:0036028) protein C inhibitor-KLK3 complex(GO:0036029) protein C inhibitor-plasma kallikrein complex(GO:0036030) serine protease inhibitor complex(GO:0097180) protein C inhibitor-coagulation factor V complex(GO:0097181) protein C inhibitor-coagulation factor Xa complex(GO:0097182) protein C inhibitor-coagulation factor XI complex(GO:0097183) |
| 0.4 | 2.4 | GO:0032389 | MutLalpha complex(GO:0032389) |
| 0.4 | 21.6 | GO:0035371 | microtubule plus-end(GO:0035371) |
| 0.4 | 3.7 | GO:0000835 | ER ubiquitin ligase complex(GO:0000835) Hrd1p ubiquitin ligase complex(GO:0000836) |
| 0.4 | 1.4 | GO:1990723 | cytoplasmic periphery of the nuclear pore complex(GO:1990723) |
| 0.4 | 3.5 | GO:0005828 | kinetochore microtubule(GO:0005828) |
| 0.3 | 17.3 | GO:0034451 | centriolar satellite(GO:0034451) |
| 0.3 | 1.6 | GO:0032301 | MutSalpha complex(GO:0032301) |
| 0.3 | 1.0 | GO:0009346 | citrate lyase complex(GO:0009346) |
| 0.3 | 13.3 | GO:0002080 | acrosomal membrane(GO:0002080) |
| 0.3 | 12.7 | GO:0032391 | photoreceptor connecting cilium(GO:0032391) |
| 0.3 | 19.2 | GO:0045171 | intercellular bridge(GO:0045171) |
| 0.3 | 0.5 | GO:0042565 | RNA nuclear export complex(GO:0042565) |
| 0.3 | 3.3 | GO:0097539 | ciliary transition fiber(GO:0097539) |
| 0.3 | 50.0 | GO:0031514 | motile cilium(GO:0031514) |
| 0.2 | 5.4 | GO:0045277 | respiratory chain complex IV(GO:0045277) |
| 0.2 | 1.8 | GO:0033063 | Rad51B-Rad51C-Rad51D-XRCC2 complex(GO:0033063) |
| 0.2 | 0.7 | GO:0031085 | BLOC-3 complex(GO:0031085) |
| 0.2 | 4.9 | GO:0070938 | contractile ring(GO:0070938) |
| 0.2 | 2.2 | GO:0097255 | R2TP complex(GO:0097255) |
| 0.2 | 23.8 | GO:0005814 | centriole(GO:0005814) |
| 0.2 | 5.4 | GO:0070822 | Sin3-type complex(GO:0070822) |
| 0.2 | 1.0 | GO:0031501 | mannosyltransferase complex(GO:0031501) |
| 0.2 | 2.2 | GO:0033588 | Elongator holoenzyme complex(GO:0033588) |
| 0.2 | 1.0 | GO:0014802 | terminal cisterna(GO:0014802) |
| 0.1 | 2.1 | GO:0031080 | nuclear pore outer ring(GO:0031080) |
| 0.1 | 3.1 | GO:0005832 | chaperonin-containing T-complex(GO:0005832) |
| 0.1 | 3.0 | GO:0061700 | GATOR2 complex(GO:0061700) |
| 0.1 | 14.3 | GO:0001669 | acrosomal vesicle(GO:0001669) |
| 0.1 | 0.8 | GO:0036398 | TCR signalosome(GO:0036398) |
| 0.1 | 4.4 | GO:0032585 | multivesicular body membrane(GO:0032585) |
| 0.1 | 0.8 | GO:0072589 | box H/ACA scaRNP complex(GO:0072589) box H/ACA telomerase RNP complex(GO:0090661) |
| 0.1 | 0.8 | GO:0030485 | smooth muscle contractile fiber(GO:0030485) |
| 0.1 | 0.8 | GO:0020016 | ciliary pocket(GO:0020016) ciliary pocket membrane(GO:0020018) |
| 0.1 | 0.6 | GO:0031232 | extrinsic component of external side of plasma membrane(GO:0031232) |
| 0.1 | 0.5 | GO:0071458 | integral component of cytoplasmic side of endoplasmic reticulum membrane(GO:0071458) |
| 0.1 | 1.8 | GO:0030992 | intraciliary transport particle B(GO:0030992) |
| 0.1 | 0.7 | GO:1990452 | Parkin-FBXW7-Cul1 ubiquitin ligase complex(GO:1990452) |
| 0.1 | 1.8 | GO:0044615 | nuclear pore nuclear basket(GO:0044615) |
| 0.1 | 3.4 | GO:0031304 | intrinsic component of mitochondrial inner membrane(GO:0031304) integral component of mitochondrial inner membrane(GO:0031305) |
| 0.1 | 4.4 | GO:0005876 | spindle microtubule(GO:0005876) |
| 0.1 | 2.4 | GO:0005838 | proteasome regulatory particle(GO:0005838) |
| 0.1 | 0.4 | GO:0005971 | ribonucleoside-diphosphate reductase complex(GO:0005971) |
| 0.1 | 2.3 | GO:0005680 | anaphase-promoting complex(GO:0005680) |
| 0.1 | 2.7 | GO:0044295 | axonal growth cone(GO:0044295) |
| 0.1 | 0.5 | GO:0030121 | AP-1 adaptor complex(GO:0030121) |
| 0.1 | 0.8 | GO:0044666 | MLL3/4 complex(GO:0044666) |
| 0.1 | 0.3 | GO:0036501 | UFD1-NPL4 complex(GO:0036501) |
| 0.1 | 2.4 | GO:0005921 | gap junction(GO:0005921) |
| 0.0 | 0.6 | GO:0001940 | male pronucleus(GO:0001940) |
| 0.0 | 0.2 | GO:0005726 | perichromatin fibrils(GO:0005726) |
| 0.0 | 7.3 | GO:0005796 | Golgi lumen(GO:0005796) |
| 0.0 | 0.5 | GO:0031313 | extrinsic component of endosome membrane(GO:0031313) |
| 0.0 | 2.3 | GO:0000159 | protein phosphatase type 2A complex(GO:0000159) |
| 0.0 | 3.2 | GO:0019005 | SCF ubiquitin ligase complex(GO:0019005) |
| 0.0 | 0.7 | GO:0033010 | paranodal junction(GO:0033010) |
| 0.0 | 1.0 | GO:1990454 | L-type voltage-gated calcium channel complex(GO:1990454) |
| 0.0 | 1.4 | GO:0097381 | photoreceptor disc membrane(GO:0097381) |
| 0.0 | 0.6 | GO:0044754 | autolysosome(GO:0044754) |
| 0.0 | 0.5 | GO:0072487 | MSL complex(GO:0072487) |
| 0.0 | 0.2 | GO:0000799 | nuclear condensin complex(GO:0000799) |
| 0.0 | 0.9 | GO:0043205 | microfibril(GO:0001527) fibril(GO:0043205) |
| 0.0 | 0.3 | GO:0070852 | cell body fiber(GO:0070852) |
| 0.0 | 0.8 | GO:0032982 | myosin filament(GO:0032982) |
| 0.0 | 4.4 | GO:0000922 | spindle pole(GO:0000922) |
| 0.0 | 0.6 | GO:0032433 | filopodium tip(GO:0032433) |
| 0.0 | 0.5 | GO:0008091 | spectrin(GO:0008091) |
| 0.0 | 0.5 | GO:0032426 | stereocilium tip(GO:0032426) |
| 0.0 | 1.1 | GO:0032809 | neuronal cell body membrane(GO:0032809) cell body membrane(GO:0044298) |
| 0.0 | 0.9 | GO:0071564 | npBAF complex(GO:0071564) |
| 0.0 | 0.4 | GO:0032039 | integrator complex(GO:0032039) |
| 0.0 | 6.5 | GO:0005741 | mitochondrial outer membrane(GO:0005741) |
| 0.0 | 2.1 | GO:0031463 | Cul3-RING ubiquitin ligase complex(GO:0031463) |
| 0.0 | 1.7 | GO:0031672 | A band(GO:0031672) |
| 0.0 | 0.3 | GO:0005686 | U2 snRNP(GO:0005686) |
| 0.0 | 1.1 | GO:0048786 | presynaptic active zone(GO:0048786) |
| 0.0 | 0.8 | GO:0071437 | invadopodium(GO:0071437) |
| 0.0 | 0.1 | GO:0016012 | dystroglycan complex(GO:0016011) sarcoglycan complex(GO:0016012) |
| 0.0 | 1.1 | GO:0018995 | host(GO:0018995) host cell(GO:0043657) |
| 0.0 | 1.0 | GO:0016235 | aggresome(GO:0016235) |
| 0.0 | 0.2 | GO:0030126 | COPI vesicle coat(GO:0030126) |
| 0.0 | 0.2 | GO:0017119 | Golgi transport complex(GO:0017119) |
| 0.0 | 0.4 | GO:0030286 | dynein complex(GO:0030286) |
Gene overrepresentation in molecular function category:
| Log-likelihood per target | Total log-likelihood | Term | Description |
|---|---|---|---|
| 3.8 | 18.9 | GO:0004370 | glycerol kinase activity(GO:0004370) |
| 2.1 | 6.2 | GO:0061505 | DNA topoisomerase type II (ATP-hydrolyzing) activity(GO:0003918) DNA topoisomerase II activity(GO:0061505) |
| 1.9 | 7.6 | GO:0034584 | piRNA binding(GO:0034584) |
| 1.6 | 16.0 | GO:0019237 | centromeric DNA binding(GO:0019237) |
| 1.4 | 15.7 | GO:0004459 | L-lactate dehydrogenase activity(GO:0004459) |
| 1.2 | 7.1 | GO:0004749 | ribose phosphate diphosphokinase activity(GO:0004749) |
| 1.2 | 4.8 | GO:0008798 | beta-aspartyl-peptidase activity(GO:0008798) |
| 1.1 | 3.3 | GO:0004069 | L-aspartate:2-oxoglutarate aminotransferase activity(GO:0004069) |
| 1.1 | 6.5 | GO:0034647 | histone demethylase activity (H3-trimethyl-K4 specific)(GO:0034647) |
| 1.0 | 3.1 | GO:0090422 | thiamine pyrophosphate transporter activity(GO:0090422) |
| 1.0 | 4.1 | GO:0004040 | amidase activity(GO:0004040) |
| 0.8 | 2.3 | GO:0016435 | rRNA (guanine) methyltransferase activity(GO:0016435) |
| 0.7 | 6.5 | GO:0035174 | histone serine kinase activity(GO:0035174) |
| 0.7 | 4.1 | GO:0061575 | cyclin-dependent protein serine/threonine kinase activator activity(GO:0061575) |
| 0.6 | 13.8 | GO:0055056 | D-glucose transmembrane transporter activity(GO:0055056) |
| 0.5 | 5.4 | GO:0008310 | single-stranded DNA 3'-5' exodeoxyribonuclease activity(GO:0008310) |
| 0.5 | 1.5 | GO:0070975 | FHA domain binding(GO:0070975) |
| 0.5 | 1.4 | GO:0033862 | UMP kinase activity(GO:0033862) |
| 0.5 | 12.2 | GO:0004000 | adenosine deaminase activity(GO:0004000) |
| 0.5 | 2.3 | GO:0035575 | histone demethylase activity (H4-K20 specific)(GO:0035575) |
| 0.4 | 7.4 | GO:0003796 | lysozyme activity(GO:0003796) |
| 0.4 | 6.4 | GO:0030548 | acetylcholine receptor regulator activity(GO:0030548) neurotransmitter receptor regulator activity(GO:0099602) |
| 0.4 | 2.6 | GO:0044729 | hemi-methylated DNA-binding(GO:0044729) |
| 0.4 | 11.9 | GO:0005528 | macrolide binding(GO:0005527) FK506 binding(GO:0005528) |
| 0.4 | 2.2 | GO:0072345 | NAADP-sensitive calcium-release channel activity(GO:0072345) |
| 0.4 | 13.1 | GO:0008171 | O-methyltransferase activity(GO:0008171) |
| 0.3 | 16.7 | GO:0070577 | lysine-acetylated histone binding(GO:0070577) |
| 0.3 | 1.3 | GO:0035248 | alpha-1,4-N-acetylgalactosaminyltransferase activity(GO:0035248) |
| 0.3 | 1.0 | GO:0004584 | dolichyl-phosphate-mannose-glycolipid alpha-mannosyltransferase activity(GO:0004584) |
| 0.3 | 1.0 | GO:0003878 | ATP citrate synthase activity(GO:0003878) |
| 0.3 | 2.2 | GO:0043141 | ATP-dependent 5'-3' DNA helicase activity(GO:0043141) |
| 0.3 | 15.6 | GO:0044183 | protein binding involved in protein folding(GO:0044183) |
| 0.3 | 1.9 | GO:0008241 | tripeptidyl-peptidase activity(GO:0008240) peptidyl-dipeptidase activity(GO:0008241) bradykinin receptor binding(GO:0031711) |
| 0.3 | 5.2 | GO:0032051 | clathrin light chain binding(GO:0032051) |
| 0.3 | 2.3 | GO:0032217 | riboflavin transporter activity(GO:0032217) |
| 0.3 | 1.7 | GO:0032038 | myosin II heavy chain binding(GO:0032038) |
| 0.3 | 0.9 | GO:0086059 | voltage-gated calcium channel activity involved SA node cell action potential(GO:0086059) |
| 0.3 | 2.5 | GO:0010997 | anaphase-promoting complex binding(GO:0010997) |
| 0.3 | 2.7 | GO:0070740 | tubulin-glutamic acid ligase activity(GO:0070740) |
| 0.3 | 23.9 | GO:0008138 | protein tyrosine/serine/threonine phosphatase activity(GO:0008138) |
| 0.3 | 1.1 | GO:0030379 | neurotensin receptor activity, non-G-protein coupled(GO:0030379) |
| 0.3 | 3.3 | GO:0042731 | PH domain binding(GO:0042731) |
| 0.2 | 1.0 | GO:0033265 | choline binding(GO:0033265) |
| 0.2 | 5.1 | GO:0008253 | 5'-nucleotidase activity(GO:0008253) |
| 0.2 | 5.2 | GO:0000150 | recombinase activity(GO:0000150) |
| 0.2 | 3.6 | GO:0015386 | potassium:proton antiporter activity(GO:0015386) |
| 0.2 | 4.3 | GO:0008140 | cAMP response element binding protein binding(GO:0008140) |
| 0.2 | 14.3 | GO:0050699 | WW domain binding(GO:0050699) |
| 0.2 | 6.4 | GO:0045503 | dynein light chain binding(GO:0045503) |
| 0.2 | 6.5 | GO:0004129 | cytochrome-c oxidase activity(GO:0004129) heme-copper terminal oxidase activity(GO:0015002) oxidoreductase activity, acting on a heme group of donors, oxygen as acceptor(GO:0016676) |
| 0.2 | 0.5 | GO:0090631 | pre-miRNA transporter activity(GO:0090631) |
| 0.2 | 2.3 | GO:0008160 | protein tyrosine phosphatase activator activity(GO:0008160) |
| 0.2 | 23.8 | GO:0004527 | exonuclease activity(GO:0004527) |
| 0.2 | 2.9 | GO:0015379 | potassium:chloride symporter activity(GO:0015379) potassium ion symporter activity(GO:0022820) |
| 0.2 | 2.0 | GO:1904264 | ubiquitin protein ligase activity involved in ERAD pathway(GO:1904264) |
| 0.2 | 1.7 | GO:0032190 | acrosin binding(GO:0032190) |
| 0.2 | 26.0 | GO:0051087 | chaperone binding(GO:0051087) |
| 0.2 | 0.5 | GO:0032143 | single thymine insertion binding(GO:0032143) |
| 0.2 | 2.9 | GO:0005049 | nuclear export signal receptor activity(GO:0005049) |
| 0.1 | 3.0 | GO:0030983 | mismatched DNA binding(GO:0030983) |
| 0.1 | 9.8 | GO:0031369 | translation initiation factor binding(GO:0031369) |
| 0.1 | 3.5 | GO:0008574 | ATP-dependent microtubule motor activity, plus-end-directed(GO:0008574) |
| 0.1 | 5.1 | GO:0004181 | metallocarboxypeptidase activity(GO:0004181) |
| 0.1 | 1.2 | GO:0005134 | interleukin-2 receptor binding(GO:0005134) |
| 0.1 | 5.9 | GO:0008139 | nuclear localization sequence binding(GO:0008139) |
| 0.1 | 4.1 | GO:0004012 | phospholipid-translocating ATPase activity(GO:0004012) |
| 0.1 | 3.7 | GO:0004190 | aspartic-type endopeptidase activity(GO:0004190) |
| 0.1 | 1.0 | GO:0016724 | ferroxidase activity(GO:0004322) oxidoreductase activity, oxidizing metal ions, oxygen as acceptor(GO:0016724) |
| 0.1 | 0.3 | GO:0070984 | SET domain binding(GO:0070984) |
| 0.1 | 0.8 | GO:0035673 | oligopeptide transmembrane transporter activity(GO:0035673) |
| 0.1 | 1.9 | GO:0036374 | glutathione hydrolase activity(GO:0036374) |
| 0.1 | 0.8 | GO:0017018 | myosin phosphatase activity(GO:0017018) |
| 0.1 | 0.8 | GO:0034513 | box H/ACA snoRNA binding(GO:0034513) |
| 0.1 | 3.8 | GO:0004550 | nucleoside diphosphate kinase activity(GO:0004550) |
| 0.1 | 0.8 | GO:0032184 | SUMO polymer binding(GO:0032184) |
| 0.1 | 15.7 | GO:0004867 | serine-type endopeptidase inhibitor activity(GO:0004867) |
| 0.1 | 2.7 | GO:0043422 | protein kinase B binding(GO:0043422) |
| 0.1 | 0.6 | GO:0015220 | choline transmembrane transporter activity(GO:0015220) |
| 0.1 | 2.8 | GO:0051537 | 2 iron, 2 sulfur cluster binding(GO:0051537) |
| 0.1 | 6.8 | GO:0004864 | protein phosphatase inhibitor activity(GO:0004864) |
| 0.1 | 0.2 | GO:0000386 | second spliceosomal transesterification activity(GO:0000386) |
| 0.1 | 1.4 | GO:0003688 | DNA replication origin binding(GO:0003688) |
| 0.1 | 3.4 | GO:0003841 | 1-acylglycerol-3-phosphate O-acyltransferase activity(GO:0003841) |
| 0.1 | 1.0 | GO:0051378 | amine binding(GO:0043176) serotonin binding(GO:0051378) |
| 0.1 | 0.6 | GO:0009019 | tRNA (guanine-N1-)-methyltransferase activity(GO:0009019) |
| 0.1 | 14.4 | GO:0004222 | metalloendopeptidase activity(GO:0004222) |
| 0.1 | 0.8 | GO:0003689 | DNA clamp loader activity(GO:0003689) protein-DNA loading ATPase activity(GO:0033170) |
| 0.1 | 2.5 | GO:0019789 | SUMO transferase activity(GO:0019789) |
| 0.1 | 0.8 | GO:0042975 | peroxisome proliferator activated receptor binding(GO:0042975) |
| 0.1 | 3.6 | GO:0001106 | RNA polymerase II transcription corepressor activity(GO:0001106) |
| 0.1 | 0.5 | GO:0015254 | glycerol channel activity(GO:0015254) |
| 0.1 | 0.3 | GO:0030620 | U2 snRNA binding(GO:0030620) |
| 0.1 | 0.7 | GO:0004687 | myosin light chain kinase activity(GO:0004687) |
| 0.1 | 0.4 | GO:0061731 | ribonucleoside-diphosphate reductase activity, thioredoxin disulfide as acceptor(GO:0004748) oxidoreductase activity, acting on CH or CH2 groups, disulfide as acceptor(GO:0016728) ribonucleoside-diphosphate reductase activity(GO:0061731) |
| 0.1 | 0.8 | GO:0016015 | morphogen activity(GO:0016015) |
| 0.1 | 0.3 | GO:0032407 | MutSalpha complex binding(GO:0032407) |
| 0.1 | 4.9 | GO:0019894 | kinesin binding(GO:0019894) |
| 0.1 | 0.7 | GO:0051525 | NFAT protein binding(GO:0051525) |
| 0.1 | 0.7 | GO:0008568 | microtubule-severing ATPase activity(GO:0008568) |
| 0.1 | 2.0 | GO:0016814 | hydrolase activity, acting on carbon-nitrogen (but not peptide) bonds, in cyclic amidines(GO:0016814) |
| 0.0 | 0.4 | GO:0030023 | extracellular matrix constituent conferring elasticity(GO:0030023) |
| 0.0 | 8.1 | GO:0043130 | ubiquitin binding(GO:0043130) |
| 0.0 | 1.4 | GO:0008536 | Ran GTPase binding(GO:0008536) |
| 0.0 | 0.5 | GO:0030280 | structural constituent of epidermis(GO:0030280) |
| 0.0 | 3.0 | GO:0005246 | calcium channel regulator activity(GO:0005246) |
| 0.0 | 5.5 | GO:0004843 | thiol-dependent ubiquitin-specific protease activity(GO:0004843) |
| 0.0 | 1.4 | GO:0047555 | 3',5'-cyclic-GMP phosphodiesterase activity(GO:0047555) |
| 0.0 | 3.0 | GO:0008186 | ATP-dependent RNA helicase activity(GO:0004004) RNA-dependent ATPase activity(GO:0008186) |
| 0.0 | 0.9 | GO:0000339 | RNA cap binding(GO:0000339) |
| 0.0 | 0.2 | GO:0032795 | heterotrimeric G-protein binding(GO:0032795) |
| 0.0 | 0.2 | GO:0004694 | eukaryotic translation initiation factor 2alpha kinase activity(GO:0004694) |
| 0.0 | 1.3 | GO:0005540 | hyaluronic acid binding(GO:0005540) |
| 0.0 | 0.6 | GO:0042577 | lipid phosphatase activity(GO:0042577) |
| 0.0 | 1.0 | GO:0017025 | TBP-class protein binding(GO:0017025) |
| 0.0 | 2.1 | GO:0001102 | RNA polymerase II activating transcription factor binding(GO:0001102) |
| 0.0 | 0.2 | GO:0003960 | NADPH:quinone reductase activity(GO:0003960) |
| 0.0 | 0.1 | GO:0019784 | NEDD8-specific protease activity(GO:0019784) |
| 0.0 | 1.8 | GO:0005549 | odorant binding(GO:0005549) |
| 0.0 | 1.1 | GO:0070035 | ATP-dependent helicase activity(GO:0008026) purine NTP-dependent helicase activity(GO:0070035) |
| 0.0 | 0.1 | GO:0005136 | interleukin-4 receptor binding(GO:0005136) |
| 0.0 | 0.4 | GO:0097602 | cullin family protein binding(GO:0097602) |
| 0.0 | 15.5 | GO:0004842 | ubiquitin-protein transferase activity(GO:0004842) |
| 0.0 | 4.5 | GO:0001078 | transcriptional repressor activity, RNA polymerase II core promoter proximal region sequence-specific binding(GO:0001078) |
| 0.0 | 0.2 | GO:1990254 | keratin filament binding(GO:1990254) |
| 0.0 | 4.3 | GO:0042393 | histone binding(GO:0042393) |
| 0.0 | 0.2 | GO:0086083 | cell adhesive protein binding involved in bundle of His cell-Purkinje myocyte communication(GO:0086083) |
| 0.0 | 0.4 | GO:0042800 | histone methyltransferase activity (H3-K4 specific)(GO:0042800) |
| 0.0 | 0.9 | GO:0070412 | R-SMAD binding(GO:0070412) |
| 0.0 | 0.5 | GO:0070064 | proline-rich region binding(GO:0070064) |
| 0.0 | 0.1 | GO:0036122 | BMP binding(GO:0036122) |
| 0.0 | 0.5 | GO:0016805 | dipeptidase activity(GO:0016805) |
| 0.0 | 4.4 | GO:0017124 | SH3 domain binding(GO:0017124) |
| 0.0 | 0.2 | GO:0015643 | toxic substance binding(GO:0015643) |
| 0.0 | 1.2 | GO:0004712 | protein serine/threonine/tyrosine kinase activity(GO:0004712) |
| 0.0 | 0.2 | GO:0086056 | voltage-gated calcium channel activity involved in AV node cell action potential(GO:0086056) |
| 0.0 | 0.8 | GO:0005484 | SNAP receptor activity(GO:0005484) |
| 0.0 | 0.1 | GO:0016721 | superoxide dismutase activity(GO:0004784) oxidoreductase activity, acting on superoxide radicals as acceptor(GO:0016721) |
| 0.0 | 1.0 | GO:0002039 | p53 binding(GO:0002039) |
| 0.0 | 0.0 | GO:0004376 | glycolipid mannosyltransferase activity(GO:0004376) |
| 0.0 | 0.9 | GO:0003777 | microtubule motor activity(GO:0003777) |
| 0.0 | 4.0 | GO:0003714 | transcription corepressor activity(GO:0003714) |
| 0.0 | 0.1 | GO:0070736 | protein-glycine ligase activity, initiating(GO:0070736) |
| 0.0 | 0.3 | GO:0003756 | protein disulfide isomerase activity(GO:0003756) intramolecular oxidoreductase activity, transposing S-S bonds(GO:0016864) |
| 0.0 | 0.1 | GO:0043995 | histone acetyltransferase activity (H4-K5 specific)(GO:0043995) histone acetyltransferase activity (H4-K8 specific)(GO:0043996) histone acetyltransferase activity (H4-K16 specific)(GO:0046972) |
| 0.0 | 0.6 | GO:0030676 | Rac guanyl-nucleotide exchange factor activity(GO:0030676) |
| 0.0 | 0.3 | GO:0001965 | G-protein alpha-subunit binding(GO:0001965) |
Gene overrepresentation in curated gene sets: canonical pathways category:
| Log-likelihood per target | Total log-likelihood | Term | Description |
|---|---|---|---|
| 0.4 | 29.4 | PID AURORA B PATHWAY | Aurora B signaling |
| 0.2 | 14.3 | PID PLK1 PATHWAY | PLK1 signaling events |
| 0.2 | 3.5 | SA REG CASCADE OF CYCLIN EXPR | Expression of cyclins regulates progression through the cell cycle by activating cyclin-dependent kinases. |
| 0.1 | 7.6 | PID INTEGRIN A9B1 PATHWAY | Alpha9 beta1 integrin signaling events |
| 0.1 | 3.1 | PID SMAD2 3PATHWAY | Regulation of cytoplasmic and nuclear SMAD2/3 signaling |
| 0.1 | 2.8 | PID EPHA FWDPATHWAY | EPHA forward signaling |
| 0.0 | 4.5 | PID INTEGRIN A4B1 PATHWAY | Alpha4 beta1 integrin signaling events |
| 0.0 | 1.6 | PID SYNDECAN 3 PATHWAY | Syndecan-3-mediated signaling events |
| 0.0 | 2.9 | PID FANCONI PATHWAY | Fanconi anemia pathway |
| 0.0 | 2.6 | PID TCR CALCIUM PATHWAY | Calcium signaling in the CD4+ TCR pathway |
| 0.0 | 1.6 | PID MYC PATHWAY | C-MYC pathway |
| 0.0 | 5.6 | PID AR PATHWAY | Coregulation of Androgen receptor activity |
| 0.0 | 2.8 | PID DELTA NP63 PATHWAY | Validated transcriptional targets of deltaNp63 isoforms |
| 0.0 | 0.7 | PID RANBP2 PATHWAY | Sumoylation by RanBP2 regulates transcriptional repression |
| 0.0 | 1.4 | PID RHODOPSIN PATHWAY | Visual signal transduction: Rods |
| 0.0 | 2.4 | PID AR TF PATHWAY | Regulation of Androgen receptor activity |
| 0.0 | 0.4 | PID BETA CATENIN DEG PATHWAY | Degradation of beta catenin |
| 0.0 | 0.8 | PID WNT SIGNALING PATHWAY | Wnt signaling network |
| 0.0 | 0.6 | PID ARF6 DOWNSTREAM PATHWAY | Arf6 downstream pathway |
| 0.0 | 1.6 | PID HEDGEHOG GLI PATHWAY | Hedgehog signaling events mediated by Gli proteins |
| 0.0 | 2.2 | PID P75 NTR PATHWAY | p75(NTR)-mediated signaling |
Gene overrepresentation in curated gene sets: REACTOME pathways category:
| Log-likelihood per target | Total log-likelihood | Term | Description |
|---|---|---|---|
| 0.4 | 18.8 | REACTOME KINESINS | Genes involved in Kinesins |
| 0.4 | 12.1 | REACTOME CYCLIN A B1 ASSOCIATED EVENTS DURING G2 M TRANSITION | Genes involved in Cyclin A/B1 associated events during G2/M transition |
| 0.4 | 5.2 | REACTOME REGULATION OF THE FANCONI ANEMIA PATHWAY | Genes involved in Regulation of the Fanconi anemia pathway |
| 0.3 | 10.7 | REACTOME POST CHAPERONIN TUBULIN FOLDING PATHWAY | Genes involved in Post-chaperonin tubulin folding pathway |
| 0.3 | 5.1 | REACTOME PURINE CATABOLISM | Genes involved in Purine catabolism |
| 0.2 | 18.6 | REACTOME MEIOTIC SYNAPSIS | Genes involved in Meiotic Synapsis |
| 0.2 | 9.3 | REACTOME NEP NS2 INTERACTS WITH THE CELLULAR EXPORT MACHINERY | Genes involved in NEP/NS2 Interacts with the Cellular Export Machinery |
| 0.1 | 5.2 | REACTOME MEIOTIC RECOMBINATION | Genes involved in Meiotic Recombination |
| 0.1 | 16.7 | REACTOME MITOTIC PROMETAPHASE | Genes involved in Mitotic Prometaphase |
| 0.1 | 5.8 | REACTOME ACTIVATION OF THE PRE REPLICATIVE COMPLEX | Genes involved in Activation of the pre-replicative complex |
| 0.1 | 4.9 | REACTOME TERMINATION OF O GLYCAN BIOSYNTHESIS | Genes involved in Termination of O-glycan biosynthesis |
| 0.1 | 1.5 | REACTOME HOMOLOGOUS RECOMBINATION REPAIR OF REPLICATION INDEPENDENT DOUBLE STRAND BREAKS | Genes involved in Homologous recombination repair of replication-independent double-strand breaks |
| 0.1 | 2.9 | REACTOME CS DS DEGRADATION | Genes involved in CS/DS degradation |
| 0.1 | 3.5 | REACTOME SYNTHESIS OF PA | Genes involved in Synthesis of PA |
| 0.1 | 0.7 | REACTOME SCF BETA TRCP MEDIATED DEGRADATION OF EMI1 | Genes involved in SCF-beta-TrCP mediated degradation of Emi1 |
| 0.1 | 2.7 | REACTOME REGULATION OF AMPK ACTIVITY VIA LKB1 | Genes involved in Regulation of AMPK activity via LKB1 |
| 0.1 | 2.2 | REACTOME EXTENSION OF TELOMERES | Genes involved in Extension of Telomeres |
| 0.1 | 7.9 | REACTOME APC C CDH1 MEDIATED DEGRADATION OF CDC20 AND OTHER APC C CDH1 TARGETED PROTEINS IN LATE MITOSIS EARLY G1 | Genes involved in APC/C:Cdh1 mediated degradation of Cdc20 and other APC/C:Cdh1 targeted proteins in late mitosis/early G1 |
| 0.1 | 1.2 | REACTOME SLBP DEPENDENT PROCESSING OF REPLICATION DEPENDENT HISTONE PRE MRNAS | Genes involved in SLBP Dependent Processing of Replication-Dependent Histone Pre-mRNAs |
| 0.1 | 1.0 | REACTOME SEROTONIN RECEPTORS | Genes involved in Serotonin receptors |
| 0.1 | 0.8 | REACTOME ACTIVATION OF ATR IN RESPONSE TO REPLICATION STRESS | Genes involved in Activation of ATR in response to replication stress |
| 0.1 | 0.5 | REACTOME ABACAVIR TRANSPORT AND METABOLISM | Genes involved in Abacavir transport and metabolism |
| 0.1 | 3.7 | REACTOME ION TRANSPORT BY P TYPE ATPASES | Genes involved in Ion transport by P-type ATPases |
| 0.0 | 0.9 | REACTOME SYNTHESIS OF PIPS AT THE LATE ENDOSOME MEMBRANE | Genes involved in Synthesis of PIPs at the late endosome membrane |
| 0.0 | 1.8 | REACTOME BETA DEFENSINS | Genes involved in Beta defensins |
| 0.0 | 3.4 | REACTOME STRIATED MUSCLE CONTRACTION | Genes involved in Striated Muscle Contraction |
| 0.0 | 0.9 | REACTOME METABOLISM OF POLYAMINES | Genes involved in Metabolism of polyamines |
| 0.0 | 1.0 | REACTOME SYNTHESIS SECRETION AND DEACYLATION OF GHRELIN | Genes involved in Synthesis, Secretion, and Deacylation of Ghrelin |
| 0.0 | 0.9 | REACTOME METABOLISM OF NON CODING RNA | Genes involved in Metabolism of non-coding RNA |
| 0.0 | 1.0 | REACTOME SYNTHESIS OF GLYCOSYLPHOSPHATIDYLINOSITOL GPI | Genes involved in Synthesis of glycosylphosphatidylinositol (GPI) |
| 0.0 | 0.8 | REACTOME MUSCLE CONTRACTION | Genes involved in Muscle contraction |
| 0.0 | 0.8 | REACTOME SIGNALING BY PDGF | Genes involved in Signaling by PDGF |
| 0.0 | 0.5 | REACTOME PASSIVE TRANSPORT BY AQUAPORINS | Genes involved in Passive Transport by Aquaporins |
| 0.0 | 0.9 | REACTOME ACTIVATION OF RAC | Genes involved in Activation of Rac |
| 0.0 | 1.1 | REACTOME GLUTAMATE NEUROTRANSMITTER RELEASE CYCLE | Genes involved in Glutamate Neurotransmitter Release Cycle |
| 0.0 | 0.6 | REACTOME HDL MEDIATED LIPID TRANSPORT | Genes involved in HDL-mediated lipid transport |
| 0.0 | 0.9 | REACTOME SYNTHESIS AND INTERCONVERSION OF NUCLEOTIDE DI AND TRIPHOSPHATES | Genes involved in Synthesis and interconversion of nucleotide di- and triphosphates |
| 0.0 | 5.7 | REACTOME ANTIGEN PROCESSING UBIQUITINATION PROTEASOME DEGRADATION | Genes involved in Antigen processing: Ubiquitination & Proteasome degradation |
| 0.0 | 1.5 | REACTOME ANTIVIRAL MECHANISM BY IFN STIMULATED GENES | Genes involved in Antiviral mechanism by IFN-stimulated genes |
| 0.0 | 1.0 | REACTOME CGMP EFFECTS | Genes involved in cGMP effects |
| 0.0 | 2.0 | REACTOME NRAGE SIGNALS DEATH THROUGH JNK | Genes involved in NRAGE signals death through JNK |
| 0.0 | 0.2 | REACTOME RECYCLING OF BILE ACIDS AND SALTS | Genes involved in Recycling of bile acids and salts |
| 0.0 | 0.6 | REACTOME CHOLESTEROL BIOSYNTHESIS | Genes involved in Cholesterol biosynthesis |
| 0.0 | 0.2 | REACTOME COPI MEDIATED TRANSPORT | Genes involved in COPI Mediated Transport |
| 0.0 | 0.2 | REACTOME MICRORNA MIRNA BIOGENESIS | Genes involved in MicroRNA (miRNA) Biogenesis |
| 0.0 | 0.2 | REACTOME SIGNALING BY FGFR1 FUSION MUTANTS | Genes involved in Signaling by FGFR1 fusion mutants |
| 0.0 | 0.3 | REACTOME REGULATION OF INSULIN LIKE GROWTH FACTOR IGF ACTIVITY BY INSULIN LIKE GROWTH FACTOR BINDING PROTEINS IGFBPS | Genes involved in Regulation of Insulin-like Growth Factor (IGF) Activity by Insulin-like Growth Factor Binding Proteins (IGFBPs) |
| 0.0 | 1.0 | REACTOME LOSS OF NLP FROM MITOTIC CENTROSOMES | Genes involved in Loss of Nlp from mitotic centrosomes |
| 0.0 | 0.2 | REACTOME THE NLRP3 INFLAMMASOME | Genes involved in The NLRP3 inflammasome |