Project
Illumina Body Map 2 (GSE30611)
Navigation
Downloads
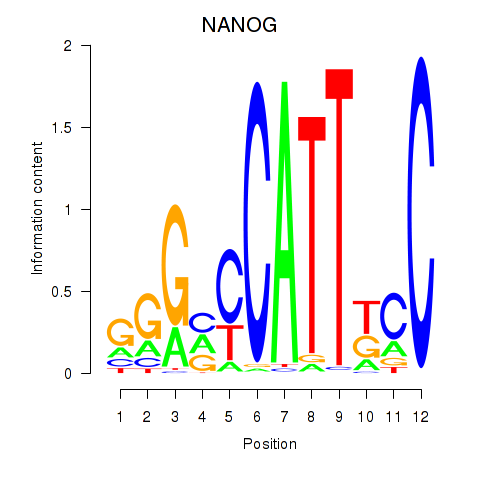
Results for NANOG
Z-value: 0.97
Motif logo
Transcription factors associated with NANOG
| Gene Symbol | Gene ID | Gene Info |
|---|---|---|
|
NANOG
|
ENSG00000111704.11 | Nanog homeobox |
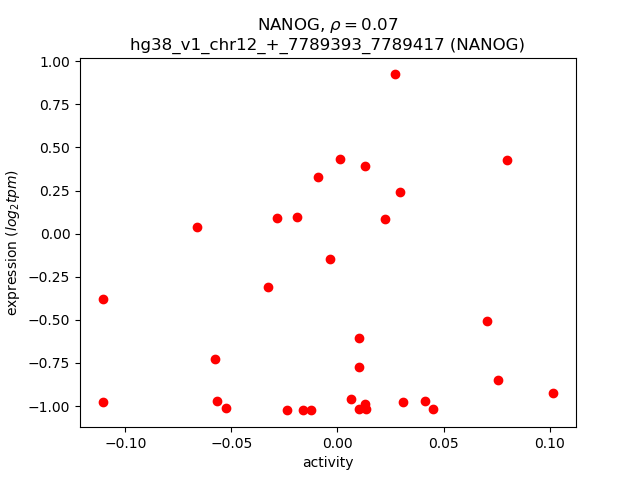
Activity-expression correlation:
| Gene | Promoter | Pearson corr. coef. | P-value | Plot |
|---|---|---|---|---|
| NANOG | hg38_v1_chr12_+_7789393_7789417 | 0.07 | 7.1e-01 | Click! |
Activity profile of NANOG motif
Sorted Z-values of NANOG motif
| Promoter | Log-likelihood | Transcript | Gene | Gene Info |
|---|---|---|---|---|
| chr17_-_36090133 | 2.83 |
ENST00000613922.2
|
CCL3
|
C-C motif chemokine ligand 3 |
| chr5_+_157266079 | 2.76 |
ENST00000616178.4
ENST00000522463.5 ENST00000435847.6 ENST00000620254.5 ENST00000521420.5 ENST00000617629.4 |
CYFIP2
|
cytoplasmic FMR1 interacting protein 2 |
| chr11_-_67437670 | 2.04 |
ENST00000326294.4
|
PTPRCAP
|
protein tyrosine phosphatase receptor type C associated protein |
| chrX_-_119693370 | 1.98 |
ENST00000360156.11
ENST00000354228.8 ENST00000489216.5 ENST00000354416.7 ENST00000343984.5 |
SEPTIN6
|
septin 6 |
| chr3_-_56775506 | 1.67 |
ENST00000497267.5
|
ARHGEF3
|
Rho guanine nucleotide exchange factor 3 |
| chr17_+_29043124 | 1.57 |
ENST00000323372.9
|
PIPOX
|
pipecolic acid and sarcosine oxidase |
| chr22_+_26169474 | 1.56 |
ENST00000404234.7
ENST00000529632.6 ENST00000360929.7 ENST00000629590.2 ENST00000343706.8 |
SEZ6L
|
seizure related 6 homolog like |
| chr7_-_78771265 | 1.55 |
ENST00000630991.2
ENST00000629359.2 |
MAGI2
|
membrane associated guanylate kinase, WW and PDZ domain containing 2 |
| chr2_+_170816562 | 1.53 |
ENST00000625689.2
ENST00000375272.5 |
GAD1
|
glutamate decarboxylase 1 |
| chr5_+_157266148 | 1.52 |
ENST00000611075.4
|
CYFIP2
|
cytoplasmic FMR1 interacting protein 2 |
| chr13_+_108269629 | 1.45 |
ENST00000430559.5
ENST00000375887.9 |
TNFSF13B
|
TNF superfamily member 13b |
| chr5_-_116536458 | 1.43 |
ENST00000510263.5
|
SEMA6A
|
semaphorin 6A |
| chr6_+_155216637 | 1.38 |
ENST00000275246.11
|
TIAM2
|
TIAM Rac1 associated GEF 2 |
| chr1_-_28193873 | 1.37 |
ENST00000305392.3
ENST00000539896.1 |
PTAFR
|
platelet activating factor receptor |
| chr10_+_62374361 | 1.37 |
ENST00000395254.8
|
ZNF365
|
zinc finger protein 365 |
| chr7_-_78771058 | 1.36 |
ENST00000628781.1
|
MAGI2
|
membrane associated guanylate kinase, WW and PDZ domain containing 2 |
| chr4_-_46124046 | 1.36 |
ENST00000295452.5
|
GABRG1
|
gamma-aminobutyric acid type A receptor subunit gamma1 |
| chr6_-_32192630 | 1.33 |
ENST00000375040.8
|
GPSM3
|
G protein signaling modulator 3 |
| chrX_-_119693150 | 1.33 |
ENST00000394610.7
|
SEPTIN6
|
septin 6 |
| chr10_+_128047559 | 1.31 |
ENST00000306042.9
|
PTPRE
|
protein tyrosine phosphatase receptor type E |
| chr6_-_161274010 | 1.29 |
ENST00000366911.9
ENST00000366905.3 |
AGPAT4
|
1-acylglycerol-3-phosphate O-acyltransferase 4 |
| chr7_-_78771108 | 1.28 |
ENST00000626691.2
|
MAGI2
|
membrane associated guanylate kinase, WW and PDZ domain containing 2 |
| chr4_+_165327659 | 1.28 |
ENST00000507013.5
ENST00000261507.11 ENST00000393766.6 ENST00000504317.1 |
MSMO1
|
methylsterol monooxygenase 1 |
| chr22_-_30266839 | 1.27 |
ENST00000403463.1
ENST00000215781.3 |
OSM
|
oncostatin M |
| chr11_-_57237183 | 1.26 |
ENST00000606794.1
|
APLNR
|
apelin receptor |
| chr5_-_116536428 | 1.26 |
ENST00000515009.5
|
SEMA6A
|
semaphorin 6A |
| chr8_-_27611325 | 1.23 |
ENST00000523500.5
|
CLU
|
clusterin |
| chr7_+_142352802 | 1.21 |
ENST00000634605.1
|
TRBV7-2
|
T cell receptor beta variable 7-2 |
| chrX_+_104112511 | 1.20 |
ENST00000537356.3
ENST00000650639.1 |
ZCCHC18
|
zinc finger CCHC-type containing 18 |
| chr1_+_159302321 | 1.20 |
ENST00000368114.1
|
FCER1A
|
Fc fragment of IgE receptor Ia |
| chr11_-_35360050 | 1.18 |
ENST00000644868.1
ENST00000643454.1 ENST00000646080.1 |
SLC1A2
|
solute carrier family 1 member 2 |
| chr8_-_27611424 | 1.17 |
ENST00000405140.7
|
CLU
|
clusterin |
| chr3_-_98522514 | 1.17 |
ENST00000503004.5
ENST00000506575.1 ENST00000513452.5 ENST00000515620.5 |
CLDND1
|
claudin domain containing 1 |
| chr22_+_37051731 | 1.16 |
ENST00000610767.4
ENST00000402077.7 ENST00000403888.7 |
KCTD17
|
potassium channel tetramerization domain containing 17 |
| chr7_-_78770859 | 1.16 |
ENST00000636717.1
|
MAGI2
|
membrane associated guanylate kinase, WW and PDZ domain containing 2 |
| chr19_-_42302766 | 1.15 |
ENST00000595530.5
ENST00000538771.5 ENST00000601865.5 |
PAFAH1B3
|
platelet activating factor acetylhydrolase 1b catalytic subunit 3 |
| chr17_+_77376083 | 1.13 |
ENST00000427674.6
|
SEPTIN9
|
septin 9 |
| chr3_-_98522754 | 1.11 |
ENST00000513287.5
ENST00000514537.5 ENST00000508071.1 ENST00000507944.5 |
CLDND1
|
claudin domain containing 1 |
| chr22_+_26169454 | 1.10 |
ENST00000248933.11
|
SEZ6L
|
seizure related 6 homolog like |
| chr7_-_26995237 | 1.10 |
ENST00000432747.1
|
SKAP2
|
src kinase associated phosphoprotein 2 |
| chr12_-_89708816 | 1.10 |
ENST00000428670.8
|
ATP2B1
|
ATPase plasma membrane Ca2+ transporting 1 |
| chr11_-_84923162 | 1.09 |
ENST00000524982.5
|
DLG2
|
discs large MAGUK scaffold protein 2 |
| chr16_+_68539213 | 1.08 |
ENST00000570495.5
ENST00000564323.5 ENST00000562156.5 ENST00000573685.5 ENST00000563169.7 ENST00000611381.4 |
ZFP90
|
ZFP90 zinc finger protein |
| chr1_-_202160577 | 1.08 |
ENST00000629151.2
ENST00000476061.5 ENST00000464870.5 ENST00000467283.5 ENST00000435759.6 ENST00000486116.5 ENST00000477625.5 |
PTPN7
|
protein tyrosine phosphatase non-receptor type 7 |
| chr6_-_161274042 | 1.06 |
ENST00000320285.9
|
AGPAT4
|
1-acylglycerol-3-phosphate O-acyltransferase 4 |
| chr1_-_155990062 | 1.04 |
ENST00000462460.6
|
ARHGEF2
|
Rho/Rac guanine nucleotide exchange factor 2 |
| chr8_-_27611200 | 1.03 |
ENST00000520796.5
ENST00000520491.5 |
CLU
|
clusterin |
| chr8_-_27611866 | 0.98 |
ENST00000519742.5
|
CLU
|
clusterin |
| chr8_-_27611679 | 0.98 |
ENST00000560566.5
|
CLU
|
clusterin |
| chr20_-_21514046 | 0.97 |
ENST00000377142.5
|
NKX2-2
|
NK2 homeobox 2 |
| chr10_+_10798570 | 0.96 |
ENST00000638035.1
ENST00000636488.1 |
CELF2
|
CUGBP Elav-like family member 2 |
| chr22_+_41699492 | 0.96 |
ENST00000401548.8
ENST00000540833.1 |
MEI1
|
meiotic double-stranded break formation protein 1 |
| chrX_-_19747574 | 0.96 |
ENST00000432234.5
|
SH3KBP1
|
SH3 domain containing kinase binding protein 1 |
| chr14_+_22052503 | 0.95 |
ENST00000390449.3
|
TRAV21
|
T cell receptor alpha variable 21 |
| chr12_-_122716790 | 0.95 |
ENST00000528880.3
|
HCAR3
|
hydroxycarboxylic acid receptor 3 |
| chr10_+_62374175 | 0.91 |
ENST00000395255.7
ENST00000647733.1 |
ZNF365
ENSG00000285837.1
|
zinc finger protein 365 novel protein |
| chr1_-_202159977 | 0.90 |
ENST00000367279.8
|
PTPN7
|
protein tyrosine phosphatase non-receptor type 7 |
| chr3_+_122055355 | 0.90 |
ENST00000330540.7
ENST00000469710.5 ENST00000493101.5 |
CD86
|
CD86 molecule |
| chr11_-_84923403 | 0.89 |
ENST00000532653.5
|
DLG2
|
discs large MAGUK scaffold protein 2 |
| chr2_-_96870752 | 0.88 |
ENST00000449330.1
|
SEMA4C
|
semaphorin 4C |
| chr19_-_42302576 | 0.87 |
ENST00000262890.8
|
PAFAH1B3
|
platelet activating factor acetylhydrolase 1b catalytic subunit 3 |
| chr5_-_95284535 | 0.87 |
ENST00000515393.5
|
MCTP1
|
multiple C2 and transmembrane domain containing 1 |
| chr10_+_70815889 | 0.87 |
ENST00000373202.8
|
SGPL1
|
sphingosine-1-phosphate lyase 1 |
| chr7_+_150685693 | 0.81 |
ENST00000223293.10
ENST00000474605.1 |
GIMAP2
|
GTPase, IMAP family member 2 |
| chr8_-_90082871 | 0.81 |
ENST00000265431.7
|
CALB1
|
calbindin 1 |
| chr6_+_30557274 | 0.80 |
ENST00000376557.3
|
PRR3
|
proline rich 3 |
| chr6_-_119078642 | 0.80 |
ENST00000621231.4
ENST00000338891.12 |
FAM184A
|
family with sequence similarity 184 member A |
| chr19_-_36379185 | 0.79 |
ENST00000270001.12
|
ZFP14
|
ZFP14 zinc finger protein |
| chr7_+_142492121 | 0.78 |
ENST00000390374.3
|
TRBV7-6
|
T cell receptor beta variable 7-6 |
| chrX_-_134797134 | 0.77 |
ENST00000370790.5
ENST00000493333.5 ENST00000611027.2 ENST00000343004.10 ENST00000298090.10 |
PABIR2
|
PABIR family member 2 |
| chr12_-_57016517 | 0.77 |
ENST00000441881.5
ENST00000458521.7 |
TAC3
|
tachykinin precursor 3 |
| chr16_+_68539737 | 0.77 |
ENST00000398253.6
ENST00000573161.1 |
ZFP90
|
ZFP90 zinc finger protein |
| chr13_+_108269880 | 0.76 |
ENST00000542136.1
|
TNFSF13B
|
TNF superfamily member 13b |
| chr19_-_53824288 | 0.75 |
ENST00000324134.11
ENST00000391773.6 ENST00000391775.7 ENST00000345770.9 ENST00000391772.1 |
NLRP12
|
NLR family pyrin domain containing 12 |
| chr1_+_203128279 | 0.74 |
ENST00000367235.1
ENST00000618295.1 |
ADORA1
|
adenosine A1 receptor |
| chr19_-_13102848 | 0.74 |
ENST00000264824.5
|
LYL1
|
LYL1 basic helix-loop-helix family member |
| chr4_+_56216101 | 0.74 |
ENST00000504228.6
|
CRACD
|
capping protein inhibiting regulator of actin dynamics |
| chr4_+_153152163 | 0.73 |
ENST00000676423.1
ENST00000675745.1 ENST00000676348.1 ENST00000676408.1 ENST00000674874.1 ENST00000675315.1 ENST00000675518.1 |
TRIM2
ENSG00000288637.1
|
tripartite motif containing 2 novel protein |
| chr6_-_24719146 | 0.73 |
ENST00000378119.9
|
C6orf62
|
chromosome 6 open reading frame 62 |
| chr5_-_170389349 | 0.72 |
ENST00000274629.9
|
KCNMB1
|
potassium calcium-activated channel subfamily M regulatory beta subunit 1 |
| chr1_+_161581339 | 0.72 |
ENST00000543859.5
ENST00000611236.1 |
FCGR2C
|
Fc fragment of IgG receptor IIc (gene/pseudogene) |
| chr11_-_72793592 | 0.71 |
ENST00000536377.5
ENST00000359373.9 |
STARD10
ARAP1
|
StAR related lipid transfer domain containing 10 ArfGAP with RhoGAP domain, ankyrin repeat and PH domain 1 |
| chr6_+_30557287 | 0.67 |
ENST00000376560.8
|
PRR3
|
proline rich 3 |
| chr22_+_37051787 | 0.67 |
ENST00000456470.1
|
KCTD17
|
potassium channel tetramerization domain containing 17 |
| chr19_-_42302292 | 0.66 |
ENST00000594989.5
|
PAFAH1B3
|
platelet activating factor acetylhydrolase 1b catalytic subunit 3 |
| chr4_-_13627647 | 0.65 |
ENST00000040738.10
|
BOD1L1
|
biorientation of chromosomes in cell division 1 like 1 |
| chr9_+_109780179 | 0.64 |
ENST00000314527.9
|
PALM2AKAP2
|
PALM2 and AKAP2 fusion |
| chr12_-_84912783 | 0.64 |
ENST00000680892.1
ENST00000266682.10 ENST00000680714.1 ENST00000552192.5 |
SLC6A15
|
solute carrier family 6 member 15 |
| chr18_-_49487216 | 0.63 |
ENST00000318240.8
ENST00000613385.4 |
C18orf32
|
chromosome 18 open reading frame 32 |
| chr12_-_84912816 | 0.63 |
ENST00000680469.1
ENST00000450363.4 ENST00000681106.1 |
SLC6A15
|
solute carrier family 6 member 15 |
| chr12_-_53507482 | 0.61 |
ENST00000267017.4
ENST00000448979.4 |
NPFF
|
neuropeptide FF-amide peptide precursor |
| chr12_+_118981531 | 0.60 |
ENST00000267260.5
|
SRRM4
|
serine/arginine repetitive matrix 4 |
| chr1_+_44405247 | 0.60 |
ENST00000361799.7
ENST00000372247.6 |
RNF220
|
ring finger protein 220 |
| chr17_+_7484357 | 0.60 |
ENST00000674977.2
|
POLR2A
|
RNA polymerase II subunit A |
| chr19_-_42302690 | 0.59 |
ENST00000596265.5
|
PAFAH1B3
|
platelet activating factor acetylhydrolase 1b catalytic subunit 3 |
| chr12_+_57434778 | 0.58 |
ENST00000309668.3
|
INHBC
|
inhibin subunit beta C |
| chr10_+_96129707 | 0.58 |
ENST00000316045.9
|
ZNF518A
|
zinc finger protein 518A |
| chr6_+_31572279 | 0.58 |
ENST00000418386.3
|
LTA
|
lymphotoxin alpha |
| chr1_+_44405164 | 0.57 |
ENST00000355387.6
|
RNF220
|
ring finger protein 220 |
| chr1_+_62436297 | 0.57 |
ENST00000452143.5
ENST00000442679.5 ENST00000371146.5 |
USP1
|
ubiquitin specific peptidase 1 |
| chr12_-_122703346 | 0.55 |
ENST00000328880.6
|
HCAR2
|
hydroxycarboxylic acid receptor 2 |
| chr10_+_96130027 | 0.54 |
ENST00000478086.5
ENST00000624776.3 |
ZNF518A
|
zinc finger protein 518A |
| chr15_+_44288701 | 0.53 |
ENST00000299957.11
ENST00000559222.5 ENST00000650436.1 |
GOLM2
|
golgi membrane protein 2 |
| chr7_-_77199808 | 0.52 |
ENST00000248598.6
|
FGL2
|
fibrinogen like 2 |
| chrX_+_86148441 | 0.52 |
ENST00000373125.9
ENST00000373131.5 |
DACH2
|
dachshund family transcription factor 2 |
| chr3_+_15427551 | 0.50 |
ENST00000396842.7
|
EAF1
|
ELL associated factor 1 |
| chr15_+_44288757 | 0.50 |
ENST00000345795.6
|
GOLM2
|
golgi membrane protein 2 |
| chr6_+_155216959 | 0.49 |
ENST00000462408.2
|
TIAM2
|
TIAM Rac1 associated GEF 2 |
| chr12_-_24902243 | 0.48 |
ENST00000538118.5
|
BCAT1
|
branched chain amino acid transaminase 1 |
| chr12_+_119989869 | 0.48 |
ENST00000397558.6
|
BICDL1
|
BICD family like cargo adaptor 1 |
| chr19_+_7069679 | 0.48 |
ENST00000252840.11
ENST00000414706.2 |
ZNF557
|
zinc finger protein 557 |
| chrX_-_48971829 | 0.46 |
ENST00000218176.4
|
KCND1
|
potassium voltage-gated channel subfamily D member 1 |
| chr2_+_45651650 | 0.45 |
ENST00000306156.8
|
PRKCE
|
protein kinase C epsilon |
| chr4_+_153153023 | 0.44 |
ENST00000676458.1
ENST00000675782.1 |
TRIM2
|
tripartite motif containing 2 |
| chr1_+_27392612 | 0.43 |
ENST00000374024.4
|
GPR3
|
G protein-coupled receptor 3 |
| chr3_-_15427497 | 0.42 |
ENST00000443029.5
ENST00000383789.9 ENST00000450816.6 ENST00000383790.8 |
METTL6
|
methyltransferase like 6 |
| chr18_-_26091175 | 0.42 |
ENST00000579061.5
ENST00000542420.6 |
SS18
|
SS18 subunit of BAF chromatin remodeling complex |
| chr16_+_30748378 | 0.42 |
ENST00000563588.6
ENST00000328273.11 |
PHKG2
|
phosphorylase kinase catalytic subunit gamma 2 |
| chr7_+_98211431 | 0.41 |
ENST00000609256.2
|
BHLHA15
|
basic helix-loop-helix family member a15 |
| chr6_+_31571957 | 0.41 |
ENST00000454783.5
|
LTA
|
lymphotoxin alpha |
| chr18_-_26090584 | 0.41 |
ENST00000415083.7
|
SS18
|
SS18 subunit of BAF chromatin remodeling complex |
| chr12_-_51083582 | 0.40 |
ENST00000548206.1
ENST00000546935.5 ENST00000228515.6 ENST00000548981.5 |
CSRNP2
|
cysteine and serine rich nuclear protein 2 |
| chr3_-_49813880 | 0.39 |
ENST00000333486.4
|
UBA7
|
ubiquitin like modifier activating enzyme 7 |
| chr3_+_75906666 | 0.38 |
ENST00000487694.7
ENST00000602589.5 |
ROBO2
|
roundabout guidance receptor 2 |
| chr1_+_40983148 | 0.37 |
ENST00000372616.1
|
CTPS1
|
CTP synthase 1 |
| chr3_+_38346760 | 0.36 |
ENST00000427323.5
ENST00000207870.8 ENST00000650590.1 |
XYLB
|
xylulokinase |
| chr6_+_30717433 | 0.36 |
ENST00000681435.1
|
TUBB
|
tubulin beta class I |
| chr12_-_42484298 | 0.36 |
ENST00000640055.1
ENST00000639566.1 ENST00000455697.6 ENST00000639589.1 |
PRICKLE1
|
prickle planar cell polarity protein 1 |
| chr14_+_23322019 | 0.36 |
ENST00000557702.5
|
PABPN1
|
poly(A) binding protein nuclear 1 |
| chr10_-_71737824 | 0.36 |
ENST00000398786.2
|
C10orf105
|
chromosome 10 open reading frame 105 |
| chr6_-_136289824 | 0.36 |
ENST00000527536.5
ENST00000529826.5 ENST00000531224.6 ENST00000353331.8 ENST00000628517.2 |
BCLAF1
|
BCL2 associated transcription factor 1 |
| chr12_+_53954870 | 0.35 |
ENST00000243103.4
|
HOXC12
|
homeobox C12 |
| chr21_-_33588624 | 0.35 |
ENST00000437395.5
ENST00000453626.5 ENST00000303113.10 ENST00000303071.10 ENST00000432378.5 |
DONSON
|
DNA replication fork stabilization factor DONSON |
| chr3_-_120742506 | 0.35 |
ENST00000273375.8
ENST00000483733.1 |
RABL3
|
RAB, member of RAS oncogene family like 3 |
| chr6_-_130956371 | 0.34 |
ENST00000639623.1
ENST00000525193.5 ENST00000527659.5 |
EPB41L2
|
erythrocyte membrane protein band 4.1 like 2 |
| chr19_-_13103151 | 0.33 |
ENST00000590974.1
|
LYL1
|
LYL1 basic helix-loop-helix family member |
| chr16_+_30748241 | 0.33 |
ENST00000565924.5
ENST00000424889.7 |
PHKG2
|
phosphorylase kinase catalytic subunit gamma 2 |
| chr10_+_8045345 | 0.32 |
ENST00000643001.1
|
GATA3
|
GATA binding protein 3 |
| chr3_+_44874606 | 0.32 |
ENST00000296125.9
|
TGM4
|
transglutaminase 4 |
| chr12_-_121793668 | 0.31 |
ENST00000267205.7
|
RHOF
|
ras homolog family member F, filopodia associated |
| chr19_-_39435910 | 0.31 |
ENST00000599539.5
|
RPS16
|
ribosomal protein S16 |
| chr4_-_107283746 | 0.31 |
ENST00000510463.1
|
DKK2
|
dickkopf WNT signaling pathway inhibitor 2 |
| chr2_+_48314637 | 0.29 |
ENST00000413569.5
ENST00000340553.8 |
FOXN2
|
forkhead box N2 |
| chr8_-_142777174 | 0.29 |
ENST00000652477.1
ENST00000614491.1 ENST00000613110.4 |
LYNX1
|
Ly6/neurotoxin 1 |
| chr6_-_136289778 | 0.29 |
ENST00000530767.5
ENST00000527759.5 |
BCLAF1
|
BCL2 associated transcription factor 1 |
| chr1_-_115841116 | 0.29 |
ENST00000320238.3
|
NHLH2
|
nescient helix-loop-helix 2 |
| chr14_+_23321543 | 0.29 |
ENST00000556821.5
|
PABPN1
|
poly(A) binding protein nuclear 1 |
| chr2_-_213151590 | 0.27 |
ENST00000374319.8
ENST00000457361.5 ENST00000451136.6 ENST00000434687.6 |
IKZF2
|
IKAROS family zinc finger 2 |
| chr10_-_68332914 | 0.27 |
ENST00000358769.7
ENST00000495025.2 |
PBLD
|
phenazine biosynthesis like protein domain containing |
| chr6_-_20212403 | 0.27 |
ENST00000324607.8
|
MBOAT1
|
membrane bound O-acyltransferase domain containing 1 |
| chr1_-_47190013 | 0.26 |
ENST00000294338.7
|
PDZK1IP1
|
PDZK1 interacting protein 1 |
| chr1_-_150268941 | 0.25 |
ENST00000369109.8
ENST00000236017.5 |
APH1A
|
aph-1 homolog A, gamma-secretase subunit |
| chr14_+_20688756 | 0.25 |
ENST00000397990.5
ENST00000555597.1 |
ANG
RNASE4
|
angiogenin ribonuclease A family member 4 |
| chr5_-_170389634 | 0.25 |
ENST00000521859.1
|
KCNMB1
|
potassium calcium-activated channel subfamily M regulatory beta subunit 1 |
| chr17_-_45051575 | 0.25 |
ENST00000588499.5
ENST00000593094.1 ENST00000651974.1 |
DCAKD
|
dephospho-CoA kinase domain containing |
| chr3_+_129249594 | 0.24 |
ENST00000314797.10
|
COPG1
|
COPI coat complex subunit gamma 1 |
| chr19_-_38852321 | 0.24 |
ENST00000600873.5
|
HNRNPL
|
heterogeneous nuclear ribonucleoprotein L |
| chr10_+_128047406 | 0.24 |
ENST00000467366.1
|
PTPRE
|
protein tyrosine phosphatase receptor type E |
| chr4_-_107283689 | 0.24 |
ENST00000513208.5
|
DKK2
|
dickkopf WNT signaling pathway inhibitor 2 |
| chr15_+_77420957 | 0.24 |
ENST00000559099.5
|
HMG20A
|
high mobility group 20A |
| chr5_-_55994945 | 0.23 |
ENST00000381298.7
ENST00000502326.7 |
IL6ST
|
interleukin 6 signal transducer |
| chr4_+_39698156 | 0.23 |
ENST00000503368.5
ENST00000445950.2 |
UBE2K
|
ubiquitin conjugating enzyme E2 K |
| chrX_+_14529516 | 0.23 |
ENST00000218075.9
|
GLRA2
|
glycine receptor alpha 2 |
| chr4_+_39698109 | 0.22 |
ENST00000510934.5
ENST00000261427.10 |
UBE2K
|
ubiquitin conjugating enzyme E2 K |
| chr14_-_56805648 | 0.22 |
ENST00000554788.5
ENST00000554845.1 ENST00000408990.8 |
OTX2
|
orthodenticle homeobox 2 |
| chr19_+_926001 | 0.22 |
ENST00000263620.8
|
ARID3A
|
AT-rich interaction domain 3A |
| chr7_+_142455120 | 0.21 |
ENST00000390369.2
|
TRBV7-4
|
T cell receptor beta variable 7-4 |
| chr9_-_123268538 | 0.21 |
ENST00000360998.3
ENST00000348403.10 |
STRBP
|
spermatid perinuclear RNA binding protein |
| chr16_+_28974764 | 0.20 |
ENST00000565975.5
ENST00000311008.16 ENST00000323081.12 ENST00000334536.12 |
SPNS1
|
sphingolipid transporter 1 (putative) |
| chr22_-_41688859 | 0.19 |
ENST00000401959.6
ENST00000648674.1 |
SNU13
|
small nuclear ribonucleoprotein 13 |
| chr11_+_26332117 | 0.18 |
ENST00000531646.1
ENST00000256737.8 |
ANO3
|
anoctamin 3 |
| chr19_-_39435627 | 0.18 |
ENST00000599705.1
|
RPS16
|
ribosomal protein S16 |
| chr17_-_45051517 | 0.18 |
ENST00000614054.4
|
DCAKD
|
dephospho-CoA kinase domain containing |
| chr15_+_41256907 | 0.18 |
ENST00000560965.1
|
CHP1
|
calcineurin like EF-hand protein 1 |
| chr1_-_145859043 | 0.18 |
ENST00000369298.5
|
PIAS3
|
protein inhibitor of activated STAT 3 |
| chr6_+_87322581 | 0.18 |
ENST00000608353.5
ENST00000392863.6 ENST00000229570.9 ENST00000608525.5 ENST00000608868.2 |
SMIM8
|
small integral membrane protein 8 |
| chr7_+_48924559 | 0.17 |
ENST00000650262.1
|
CDC14C
|
cell division cycle 14C |
| chr1_-_145859061 | 0.17 |
ENST00000393045.7
|
PIAS3
|
protein inhibitor of activated STAT 3 |
| chr11_+_34051722 | 0.17 |
ENST00000341394.9
ENST00000389645.7 |
CAPRIN1
|
cell cycle associated protein 1 |
| chr17_-_75270999 | 0.17 |
ENST00000579194.6
ENST00000580717.5 ENST00000577542.5 ENST00000579612.5 ENST00000245551.9 ENST00000578305.5 |
MIF4GD
|
MIF4G domain containing |
| chr15_+_78540405 | 0.17 |
ENST00000560217.5
ENST00000559082.5 ENST00000559948.5 ENST00000413382.6 ENST00000559146.5 ENST00000044462.12 ENST00000558281.5 |
PSMA4
|
proteasome 20S subunit alpha 4 |
| chr19_-_39435936 | 0.17 |
ENST00000339471.8
ENST00000601655.5 ENST00000251453.8 |
RPS16
|
ribosomal protein S16 |
| chr6_+_151239951 | 0.17 |
ENST00000402676.7
|
AKAP12
|
A-kinase anchoring protein 12 |
| chr10_-_48605032 | 0.16 |
ENST00000249601.9
|
ARHGAP22
|
Rho GTPase activating protein 22 |
| chr6_+_26087281 | 0.15 |
ENST00000353147.9
ENST00000397022.7 ENST00000352392.8 ENST00000349999.8 ENST00000317896.11 ENST00000470149.5 ENST00000336625.12 ENST00000461397.5 ENST00000488199.5 |
HFE
|
homeostatic iron regulator |
| chr1_+_161663147 | 0.15 |
ENST00000236937.13
ENST00000367961.8 ENST00000358671.9 |
FCGR2B
|
Fc fragment of IgG receptor IIb |
| chr6_+_106629560 | 0.15 |
ENST00000369046.8
|
QRSL1
|
glutaminyl-tRNA amidotransferase subunit QRSL1 |
| chr6_+_116529013 | 0.15 |
ENST00000628083.1
ENST00000368597.6 ENST00000452373.5 ENST00000405399.5 |
CALHM4
|
calcium homeostasis modulator family member 4 |
| chr4_+_88592426 | 0.15 |
ENST00000431413.5
ENST00000402738.6 ENST00000422770.5 ENST00000407637.5 |
HERC3
|
HECT and RLD domain containing E3 ubiquitin protein ligase 3 |
| chr10_-_68332878 | 0.15 |
ENST00000309049.8
|
PBLD
|
phenazine biosynthesis like protein domain containing |
| chr20_-_3781440 | 0.15 |
ENST00000379756.3
|
SPEF1
|
sperm flagellar 1 |
| chr6_-_30717437 | 0.14 |
ENST00000425072.5
|
MDC1
|
mediator of DNA damage checkpoint 1 |
| chr19_+_41310148 | 0.13 |
ENST00000269967.4
|
CCDC97
|
coiled-coil domain containing 97 |
| chr7_-_144259722 | 0.13 |
ENST00000493325.1
|
OR2A7
|
olfactory receptor family 2 subfamily A member 7 |
| chr17_-_75270710 | 0.13 |
ENST00000581777.2
|
MIF4GD
|
MIF4G domain containing |
| chr20_-_62926469 | 0.11 |
ENST00000354665.8
ENST00000370368.5 ENST00000395340.5 ENST00000395343.6 |
DIDO1
|
death inducer-obliterator 1 |
| chr8_+_28701487 | 0.11 |
ENST00000220562.9
|
EXTL3
|
exostosin like glycosyltransferase 3 |
| chr18_+_13218769 | 0.11 |
ENST00000677055.1
ENST00000399848.7 |
LDLRAD4
|
low density lipoprotein receptor class A domain containing 4 |
| chrX_+_103918872 | 0.10 |
ENST00000419165.5
|
TMSB15B
|
thymosin beta 15B |
| chr17_+_7573722 | 0.10 |
ENST00000581384.5
ENST00000577929.1 |
EIF4A1
|
eukaryotic translation initiation factor 4A1 |
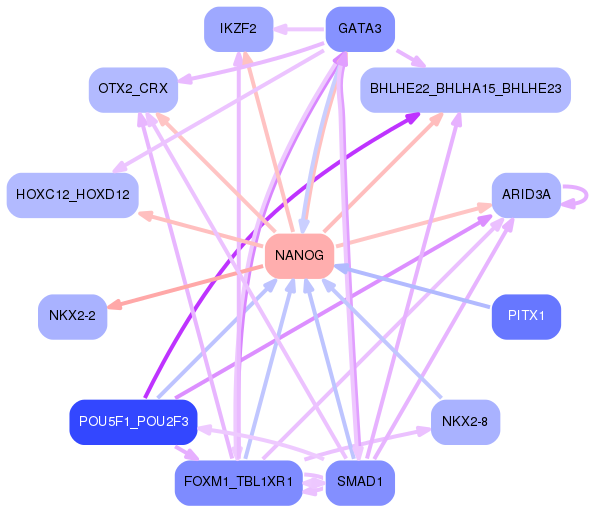
Network of associatons between targets according to the STRING database.

First level regulatory network of NANOG
Gene Ontology Analysis
Gene overrepresentation in biological process category:
| Log-likelihood per target | Total log-likelihood | Term | Description |
|---|---|---|---|
| 0.7 | 5.4 | GO:1902847 | regulation of neuronal signal transduction(GO:1902847) positive regulation of neurofibrillary tangle assembly(GO:1902998) |
| 0.6 | 2.2 | GO:0002636 | positive regulation of germinal center formation(GO:0002636) |
| 0.5 | 2.8 | GO:2000503 | positive regulation of natural killer cell chemotaxis(GO:2000503) |
| 0.4 | 1.2 | GO:0001812 | positive regulation of type I hypersensitivity(GO:0001812) |
| 0.3 | 1.0 | GO:0002876 | positive regulation of chronic inflammatory response to antigenic stimulus(GO:0002876) |
| 0.3 | 0.7 | GO:0070256 | negative regulation of circadian sleep/wake cycle, non-REM sleep(GO:0042323) negative regulation of mucus secretion(GO:0070256) |
| 0.3 | 4.3 | GO:0051388 | positive regulation of neurotrophin TRK receptor signaling pathway(GO:0051388) |
| 0.3 | 1.0 | GO:0021529 | spinal cord oligodendrocyte cell differentiation(GO:0021529) spinal cord oligodendrocyte cell fate specification(GO:0021530) |
| 0.3 | 1.5 | GO:0018352 | protein-pyridoxal-5-phosphate linkage(GO:0018352) |
| 0.3 | 0.9 | GO:0002668 | negative regulation of T cell tolerance induction(GO:0002665) negative regulation of T cell anergy(GO:0002668) negative regulation of lymphocyte anergy(GO:0002912) regulation of lymphotoxin A production(GO:0032681) positive regulation of lymphotoxin A production(GO:0032761) regulation of lymphotoxin A biosynthetic process(GO:0043016) positive regulation of lymphotoxin A biosynthetic process(GO:0043017) |
| 0.3 | 5.4 | GO:0003402 | planar cell polarity pathway involved in axis elongation(GO:0003402) |
| 0.3 | 1.4 | GO:0009609 | response to symbiont(GO:0009608) response to symbiotic bacterium(GO:0009609) |
| 0.3 | 1.6 | GO:0019477 | L-lysine catabolic process to acetyl-CoA(GO:0019474) L-lysine catabolic process(GO:0019477) L-lysine metabolic process(GO:0046440) |
| 0.2 | 0.6 | GO:1904247 | positive regulation of polynucleotide adenylyltransferase activity(GO:1904247) |
| 0.2 | 1.0 | GO:1903413 | cellular response to bile acid(GO:1903413) |
| 0.2 | 1.5 | GO:0038165 | oncostatin-M-mediated signaling pathway(GO:0038165) |
| 0.2 | 0.5 | GO:0035669 | TRAM-dependent toll-like receptor signaling pathway(GO:0035668) TRAM-dependent toll-like receptor 4 signaling pathway(GO:0035669) |
| 0.2 | 0.2 | GO:0016068 | regulation of type I hypersensitivity(GO:0001810) type I hypersensitivity(GO:0016068) |
| 0.1 | 0.7 | GO:0008588 | release of cytoplasmic sequestered NF-kappaB(GO:0008588) |
| 0.1 | 0.4 | GO:0060392 | negative regulation of SMAD protein import into nucleus(GO:0060392) |
| 0.1 | 1.0 | GO:0071802 | negative regulation of podosome assembly(GO:0071802) |
| 0.1 | 0.6 | GO:0070253 | somatostatin secretion(GO:0070253) |
| 0.1 | 1.1 | GO:0071386 | cellular response to corticosterone stimulus(GO:0071386) |
| 0.1 | 0.4 | GO:0042732 | D-xylose metabolic process(GO:0042732) |
| 0.1 | 0.8 | GO:0045819 | positive regulation of glycogen catabolic process(GO:0045819) |
| 0.1 | 0.7 | GO:0030037 | actin filament reorganization involved in cell cycle(GO:0030037) |
| 0.1 | 0.5 | GO:0033031 | positive regulation of neutrophil apoptotic process(GO:0033031) |
| 0.1 | 1.3 | GO:0043951 | negative regulation of cAMP-mediated signaling(GO:0043951) |
| 0.1 | 1.3 | GO:0015820 | leucine transport(GO:0015820) |
| 0.1 | 0.5 | GO:0009098 | branched-chain amino acid biosynthetic process(GO:0009082) leucine biosynthetic process(GO:0009098) valine biosynthetic process(GO:0009099) |
| 0.1 | 0.8 | GO:0035502 | metanephric part of ureteric bud development(GO:0035502) |
| 0.1 | 2.8 | GO:0090036 | regulation of protein kinase C signaling(GO:0090036) |
| 0.1 | 2.4 | GO:0016024 | CDP-diacylglycerol biosynthetic process(GO:0016024) |
| 0.1 | 0.3 | GO:2000701 | regulation of cell proliferation involved in mesonephros development(GO:2000606) negative regulation of cell proliferation involved in mesonephros development(GO:2000607) fibroblast growth factor receptor signaling pathway involved in ureteric bud formation(GO:2000699) glial cell-derived neurotrophic factor receptor signaling pathway involved in ureteric bud formation(GO:2000701) regulation of fibroblast growth factor receptor signaling pathway involved in ureteric bud formation(GO:2000702) negative regulation of fibroblast growth factor receptor signaling pathway involved in ureteric bud formation(GO:2000703) regulation of glial cell-derived neurotrophic factor receptor signaling pathway involved in ureteric bud formation(GO:2000733) negative regulation of glial cell-derived neurotrophic factor receptor signaling pathway involved in ureteric bud formation(GO:2000734) |
| 0.1 | 0.8 | GO:0007217 | tachykinin receptor signaling pathway(GO:0007217) |
| 0.1 | 1.2 | GO:0070777 | D-aspartate transport(GO:0070777) D-aspartate import(GO:0070779) |
| 0.1 | 2.7 | GO:2001224 | positive regulation of neuron migration(GO:2001224) |
| 0.1 | 0.4 | GO:2000691 | regulation of cardiac muscle cell myoblast differentiation(GO:2000690) negative regulation of cardiac muscle cell myoblast differentiation(GO:2000691) |
| 0.1 | 1.3 | GO:1900017 | positive regulation of cytokine production involved in inflammatory response(GO:1900017) |
| 0.1 | 0.4 | GO:0050925 | negative regulation of negative chemotaxis(GO:0050925) |
| 0.1 | 1.1 | GO:0001955 | blood vessel maturation(GO:0001955) |
| 0.1 | 0.4 | GO:0044210 | 'de novo' CTP biosynthetic process(GO:0044210) |
| 0.0 | 1.8 | GO:0045724 | positive regulation of cilium assembly(GO:0045724) |
| 0.0 | 0.9 | GO:0033327 | Leydig cell differentiation(GO:0033327) |
| 0.0 | 1.0 | GO:0090220 | meiotic telomere clustering(GO:0045141) chromosome localization to nuclear envelope involved in homologous chromosome segregation(GO:0090220) |
| 0.0 | 0.2 | GO:0006651 | diacylglycerol biosynthetic process(GO:0006651) |
| 0.0 | 0.5 | GO:0010994 | regulation of ubiquitin homeostasis(GO:0010993) free ubiquitin chain polymerization(GO:0010994) |
| 0.0 | 0.6 | GO:0035520 | monoubiquitinated protein deubiquitination(GO:0035520) |
| 0.0 | 0.4 | GO:0032020 | ISG15-protein conjugation(GO:0032020) |
| 0.0 | 2.0 | GO:0097120 | receptor localization to synapse(GO:0097120) |
| 0.0 | 0.2 | GO:0032417 | positive regulation of sodium:proton antiporter activity(GO:0032417) |
| 0.0 | 0.2 | GO:0060012 | synaptic transmission, glycinergic(GO:0060012) |
| 0.0 | 0.9 | GO:0021535 | cell migration in hindbrain(GO:0021535) |
| 0.0 | 0.4 | GO:0048312 | intracellular distribution of mitochondria(GO:0048312) |
| 0.0 | 1.4 | GO:0007214 | gamma-aminobutyric acid signaling pathway(GO:0007214) |
| 0.0 | 1.8 | GO:0043392 | negative regulation of DNA binding(GO:0043392) |
| 0.0 | 0.6 | GO:0033234 | negative regulation of protein sumoylation(GO:0033234) |
| 0.0 | 1.0 | GO:0006376 | mRNA splice site selection(GO:0006376) |
| 0.0 | 1.2 | GO:0046627 | negative regulation of insulin receptor signaling pathway(GO:0046627) |
| 0.0 | 0.2 | GO:0061591 | calcium activated phospholipid scrambling(GO:0061588) calcium activated phosphatidylcholine scrambling(GO:0061590) calcium activated galactosylceramide scrambling(GO:0061591) |
| 0.0 | 0.5 | GO:0051123 | RNA polymerase II transcriptional preinitiation complex assembly(GO:0051123) |
| 0.0 | 0.6 | GO:0031297 | replication fork processing(GO:0031297) |
| 0.0 | 0.4 | GO:0015937 | coenzyme A biosynthetic process(GO:0015937) |
| 0.0 | 0.0 | GO:0032707 | negative regulation of interleukin-23 production(GO:0032707) |
| 0.0 | 0.7 | GO:0000462 | maturation of SSU-rRNA from tricistronic rRNA transcript (SSU-rRNA, 5.8S rRNA, LSU-rRNA)(GO:0000462) |
| 0.0 | 1.2 | GO:0051865 | protein autoubiquitination(GO:0051865) |
| 0.0 | 0.2 | GO:2000543 | positive regulation of gastrulation(GO:2000543) |
| 0.0 | 0.6 | GO:2000144 | positive regulation of DNA-templated transcription, initiation(GO:2000144) |
| 0.0 | 0.3 | GO:1904778 | regulation of protein localization to cell cortex(GO:1904776) positive regulation of protein localization to cell cortex(GO:1904778) |
| 0.0 | 0.3 | GO:0003376 | sphingosine-1-phosphate signaling pathway(GO:0003376) |
| 0.0 | 0.4 | GO:0040020 | regulation of meiotic nuclear division(GO:0040020) |
| 0.0 | 0.6 | GO:0033120 | positive regulation of RNA splicing(GO:0033120) |
Gene overrepresentation in cellular component category:
| Log-likelihood per target | Total log-likelihood | Term | Description |
|---|---|---|---|
| 0.3 | 5.4 | GO:0097418 | neurofibrillary tangle(GO:0097418) |
| 0.3 | 5.4 | GO:0036057 | filtration diaphragm(GO:0036056) slit diaphragm(GO:0036057) |
| 0.1 | 0.2 | GO:0005900 | oncostatin-M receptor complex(GO:0005900) |
| 0.1 | 0.8 | GO:0005964 | phosphorylase kinase complex(GO:0005964) |
| 0.1 | 1.5 | GO:0061202 | clathrin-sculpted gamma-aminobutyric acid transport vesicle(GO:0061200) clathrin-sculpted gamma-aminobutyric acid transport vesicle membrane(GO:0061202) |
| 0.0 | 1.1 | GO:0032591 | dendritic spine membrane(GO:0032591) |
| 0.0 | 0.5 | GO:0005577 | fibrinogen complex(GO:0005577) |
| 0.0 | 2.0 | GO:0044224 | juxtaparanode region of axon(GO:0044224) |
| 0.0 | 0.2 | GO:0032311 | angiogenin-PRI complex(GO:0032311) |
| 0.0 | 0.6 | GO:0000974 | Prp19 complex(GO:0000974) |
| 0.0 | 2.2 | GO:0030673 | axolemma(GO:0030673) |
| 0.0 | 0.6 | GO:0042405 | nuclear inclusion body(GO:0042405) |
| 0.0 | 1.6 | GO:0005782 | peroxisomal matrix(GO:0005782) microbody lumen(GO:0031907) |
| 0.0 | 0.8 | GO:0071564 | npBAF complex(GO:0071564) |
| 0.0 | 0.3 | GO:0008091 | spectrin(GO:0008091) |
| 0.0 | 0.4 | GO:0005641 | nuclear envelope lumen(GO:0005641) |
| 0.0 | 0.5 | GO:0032433 | filopodium tip(GO:0032433) |
| 0.0 | 0.2 | GO:0030126 | COPI vesicle coat(GO:0030126) |
| 0.0 | 0.2 | GO:0019773 | proteasome core complex, alpha-subunit complex(GO:0019773) |
| 0.0 | 1.6 | GO:0034707 | chloride channel complex(GO:0034707) |
| 0.0 | 1.4 | GO:0031463 | Cul3-RING ubiquitin ligase complex(GO:0031463) |
| 0.0 | 1.0 | GO:0043198 | dendritic shaft(GO:0043198) |
Gene overrepresentation in molecular function category:
| Log-likelihood per target | Total log-likelihood | Term | Description |
|---|---|---|---|
| 0.7 | 2.8 | GO:0004698 | calcium-dependent protein kinase C activity(GO:0004698) |
| 0.7 | 3.3 | GO:0047179 | platelet-activating factor acetyltransferase activity(GO:0047179) |
| 0.4 | 5.4 | GO:0070699 | type II activin receptor binding(GO:0070699) |
| 0.3 | 1.6 | GO:0016647 | oxidoreductase activity, acting on the CH-NH group of donors, oxygen as acceptor(GO:0016647) |
| 0.2 | 1.4 | GO:0004992 | platelet activating factor receptor activity(GO:0004992) |
| 0.2 | 1.3 | GO:0005298 | proline:sodium symporter activity(GO:0005298) |
| 0.2 | 1.5 | GO:0004351 | glutamate decarboxylase activity(GO:0004351) |
| 0.2 | 1.4 | GO:0019763 | immunoglobulin receptor activity(GO:0019763) |
| 0.1 | 5.4 | GO:0051787 | misfolded protein binding(GO:0051787) |
| 0.1 | 0.7 | GO:0032795 | heterotrimeric G-protein binding(GO:0032795) |
| 0.1 | 0.8 | GO:0005499 | vitamin D binding(GO:0005499) |
| 0.1 | 0.5 | GO:0004084 | branched-chain-amino-acid transaminase activity(GO:0004084) L-leucine transaminase activity(GO:0052654) L-valine transaminase activity(GO:0052655) L-isoleucine transaminase activity(GO:0052656) |
| 0.1 | 0.4 | GO:0004140 | dephospho-CoA kinase activity(GO:0004140) |
| 0.1 | 0.5 | GO:0035276 | ethanol binding(GO:0035276) |
| 0.1 | 1.2 | GO:0015501 | glutamate:sodium symporter activity(GO:0015501) |
| 0.1 | 0.8 | GO:0004689 | phosphorylase kinase activity(GO:0004689) |
| 0.1 | 2.6 | GO:0003841 | 1-acylglycerol-3-phosphate O-acyltransferase activity(GO:0003841) |
| 0.1 | 1.8 | GO:0097602 | cullin family protein binding(GO:0097602) |
| 0.1 | 0.7 | GO:0019864 | IgG binding(GO:0019864) |
| 0.1 | 3.2 | GO:0005164 | tumor necrosis factor receptor binding(GO:0005164) |
| 0.1 | 0.2 | GO:0004923 | leukemia inhibitory factor receptor activity(GO:0004923) |
| 0.1 | 0.5 | GO:0005250 | A-type (transient outward) potassium channel activity(GO:0005250) |
| 0.1 | 0.4 | GO:0003883 | CTP synthase activity(GO:0003883) |
| 0.0 | 0.1 | GO:0070975 | FHA domain binding(GO:0070975) |
| 0.0 | 0.2 | GO:0016933 | extracellular-glycine-gated ion channel activity(GO:0016933) extracellular-glycine-gated chloride channel activity(GO:0016934) |
| 0.0 | 1.4 | GO:0050811 | GABA receptor binding(GO:0050811) |
| 0.0 | 0.2 | GO:0004522 | ribonuclease A activity(GO:0004522) |
| 0.0 | 0.4 | GO:0004839 | ubiquitin activating enzyme activity(GO:0004839) |
| 0.0 | 0.3 | GO:0046624 | sphingolipid transporter activity(GO:0046624) |
| 0.0 | 0.3 | GO:0005134 | interleukin-2 receptor binding(GO:0005134) |
| 0.0 | 1.5 | GO:0005001 | transmembrane receptor protein tyrosine phosphatase activity(GO:0005001) transmembrane receptor protein phosphatase activity(GO:0019198) |
| 0.0 | 1.3 | GO:0005092 | GDP-dissociation inhibitor activity(GO:0005092) |
| 0.0 | 0.5 | GO:0001075 | transcription factor activity, RNA polymerase II core promoter sequence-specific binding involved in preinitiation complex assembly(GO:0001075) |
| 0.0 | 0.4 | GO:0008046 | axon guidance receptor activity(GO:0008046) |
| 0.0 | 0.6 | GO:0001055 | RNA polymerase II activity(GO:0001055) |
| 0.0 | 0.9 | GO:0016832 | aldehyde-lyase activity(GO:0016832) |
| 0.0 | 0.7 | GO:0031702 | type 1 angiotensin receptor binding(GO:0031702) |
| 0.0 | 1.1 | GO:0005388 | calcium-transporting ATPase activity(GO:0005388) |
| 0.0 | 0.5 | GO:0034450 | ubiquitin-ubiquitin ligase activity(GO:0034450) |
| 0.0 | 1.9 | GO:0004385 | guanylate kinase activity(GO:0004385) |
| 0.0 | 0.3 | GO:0042731 | PH domain binding(GO:0042731) |
| 0.0 | 0.3 | GO:0003810 | protein-glutamine gamma-glutamyltransferase activity(GO:0003810) |
| 0.0 | 1.3 | GO:0016709 | oxidoreductase activity, acting on paired donors, with incorporation or reduction of molecular oxygen, NAD(P)H as one donor, and incorporation of one atom of oxygen(GO:0016709) |
| 0.0 | 0.5 | GO:0039706 | co-receptor binding(GO:0039706) |
| 0.0 | 0.5 | GO:0034452 | dynactin binding(GO:0034452) |
| 0.0 | 1.0 | GO:0015269 | calcium-activated potassium channel activity(GO:0015269) |
| 0.0 | 0.9 | GO:0038191 | neuropilin binding(GO:0038191) |
| 0.0 | 0.1 | GO:0071566 | UFM1 activating enzyme activity(GO:0071566) |
| 0.0 | 0.7 | GO:0008656 | cysteine-type endopeptidase activator activity involved in apoptotic process(GO:0008656) |
| 0.0 | 1.0 | GO:0030676 | Rac guanyl-nucleotide exchange factor activity(GO:0030676) |
| 0.0 | 0.2 | GO:0097157 | pre-mRNA intronic binding(GO:0097157) |
| 0.0 | 0.3 | GO:0099602 | acetylcholine receptor regulator activity(GO:0030548) neurotransmitter receptor regulator activity(GO:0099602) |
| 0.0 | 0.1 | GO:0001888 | glucuronyl-galactosyl-proteoglycan 4-alpha-N-acetylglucosaminyltransferase activity(GO:0001888) |
| 0.0 | 1.0 | GO:0036002 | pre-mRNA binding(GO:0036002) |
| 0.0 | 2.8 | GO:0005089 | Rho guanyl-nucleotide exchange factor activity(GO:0005089) |
| 0.0 | 0.6 | GO:0005184 | neuropeptide hormone activity(GO:0005184) |
| 0.0 | 1.2 | GO:0030374 | ligand-dependent nuclear receptor transcription coactivator activity(GO:0030374) |
| 0.0 | 0.4 | GO:0032794 | GTPase activating protein binding(GO:0032794) |
Gene overrepresentation in curated gene sets: canonical pathways category:
| Log-likelihood per target | Total log-likelihood | Term | Description |
|---|---|---|---|
| 0.1 | 2.0 | PID TCR RAS PATHWAY | Ras signaling in the CD4+ TCR pathway |
| 0.1 | 3.3 | PID LIS1 PATHWAY | Lissencephaly gene (LIS1) in neuronal migration and development |
| 0.0 | 0.6 | PID IL27 PATHWAY | IL27-mediated signaling events |
| 0.0 | 3.5 | PID ECADHERIN NASCENT AJ PATHWAY | E-cadherin signaling in the nascent adherens junction |
| 0.0 | 0.9 | PID IL12 STAT4 PATHWAY | IL12 signaling mediated by STAT4 |
| 0.0 | 1.3 | PID IL3 PATHWAY | IL3-mediated signaling events |
| 0.0 | 5.3 | PID MYC REPRESS PATHWAY | Validated targets of C-MYC transcriptional repression |
| 0.0 | 1.0 | PID REELIN PATHWAY | Reelin signaling pathway |
| 0.0 | 0.3 | ST JAK STAT PATHWAY | Jak-STAT Pathway |
| 0.0 | 1.0 | PID IL2 STAT5 PATHWAY | IL2 signaling events mediated by STAT5 |
| 0.0 | 0.9 | PID S1P META PATHWAY | Sphingosine 1-phosphate (S1P) pathway |
| 0.0 | 0.5 | PID LPA4 PATHWAY | LPA4-mediated signaling events |
| 0.0 | 2.5 | PID IL12 2PATHWAY | IL12-mediated signaling events |
| 0.0 | 1.9 | PID RHOA REG PATHWAY | Regulation of RhoA activity |
| 0.0 | 1.4 | PID FCER1 PATHWAY | Fc-epsilon receptor I signaling in mast cells |
| 0.0 | 1.9 | PID RAC1 REG PATHWAY | Regulation of RAC1 activity |
| 0.0 | 0.6 | PID IL6 7 PATHWAY | IL6-mediated signaling events |
Gene overrepresentation in curated gene sets: REACTOME pathways category:
| Log-likelihood per target | Total log-likelihood | Term | Description |
|---|---|---|---|
| 0.1 | 5.4 | REACTOME NEPHRIN INTERACTIONS | Genes involved in Nephrin interactions |
| 0.1 | 0.3 | REACTOME ACYL CHAIN REMODELLING OF PS | Genes involved in Acyl chain remodelling of PS |
| 0.1 | 2.7 | REACTOME OTHER SEMAPHORIN INTERACTIONS | Genes involved in Other semaphorin interactions |
| 0.1 | 2.3 | REACTOME SYNTHESIS OF PA | Genes involved in Synthesis of PA |
| 0.0 | 0.6 | REACTOME GLYCOPROTEIN HORMONES | Genes involved in Glycoprotein hormones |
| 0.0 | 0.6 | REACTOME REGULATION OF THE FANCONI ANEMIA PATHWAY | Genes involved in Regulation of the Fanconi anemia pathway |
| 0.0 | 2.8 | REACTOME CHEMOKINE RECEPTORS BIND CHEMOKINES | Genes involved in Chemokine receptors bind chemokines |
| 0.0 | 0.9 | REACTOME CD28 DEPENDENT VAV1 PATHWAY | Genes involved in CD28 dependent Vav1 pathway |
| 0.0 | 4.6 | REACTOME NRAGE SIGNALS DEATH THROUGH JNK | Genes involved in NRAGE signals death through JNK |
| 0.0 | 1.3 | REACTOME NA CL DEPENDENT NEUROTRANSMITTER TRANSPORTERS | Genes involved in Na+/Cl- dependent neurotransmitter transporters |
| 0.0 | 1.5 | REACTOME GABA SYNTHESIS RELEASE REUPTAKE AND DEGRADATION | Genes involved in GABA synthesis, release, reuptake and degradation |
| 0.0 | 1.1 | REACTOME SIGNAL REGULATORY PROTEIN SIRP FAMILY INTERACTIONS | Genes involved in Signal regulatory protein (SIRP) family interactions |
| 0.0 | 1.3 | REACTOME CHOLESTEROL BIOSYNTHESIS | Genes involved in Cholesterol biosynthesis |
| 0.0 | 0.8 | REACTOME GLYCOGEN BREAKDOWN GLYCOGENOLYSIS | Genes involved in Glycogen breakdown (glycogenolysis) |
| 0.0 | 0.6 | REACTOME VIRAL MESSENGER RNA SYNTHESIS | Genes involved in Viral Messenger RNA Synthesis |
| 0.0 | 4.1 | REACTOME RESPONSE TO ELEVATED PLATELET CYTOSOLIC CA2 | Genes involved in Response to elevated platelet cytosolic Ca2+ |
| 0.0 | 0.6 | REACTOME PROCESSING OF INTRONLESS PRE MRNAS | Genes involved in Processing of Intronless Pre-mRNAs |
| 0.0 | 0.7 | REACTOME NUCLEOTIDE LIKE PURINERGIC RECEPTORS | Genes involved in Nucleotide-like (purinergic) receptors |
| 0.0 | 1.0 | REACTOME CGMP EFFECTS | Genes involved in cGMP effects |
| 0.0 | 0.7 | REACTOME ANTIGEN ACTIVATES B CELL RECEPTOR LEADING TO GENERATION OF SECOND MESSENGERS | Genes involved in Antigen Activates B Cell Receptor Leading to Generation of Second Messengers |
| 0.0 | 5.5 | REACTOME CLASS A1 RHODOPSIN LIKE RECEPTORS | Genes involved in Class A/1 (Rhodopsin-like receptors) |
| 0.0 | 0.9 | REACTOME SPHINGOLIPID DE NOVO BIOSYNTHESIS | Genes involved in Sphingolipid de novo biosynthesis |
| 0.0 | 0.5 | REACTOME BRANCHED CHAIN AMINO ACID CATABOLISM | Genes involved in Branched-chain amino acid catabolism |
| 0.0 | 0.9 | REACTOME REGULATION OF GENE EXPRESSION IN BETA CELLS | Genes involved in Regulation of gene expression in beta cells |
| 0.0 | 0.2 | REACTOME IL 6 SIGNALING | Genes involved in Interleukin-6 signaling |
| 0.0 | 0.8 | REACTOME NEGATIVE REGULATORS OF RIG I MDA5 SIGNALING | Genes involved in Negative regulators of RIG-I/MDA5 signaling |