Project
Illumina Body Map 2 (GSE30611)
Navigation
Downloads
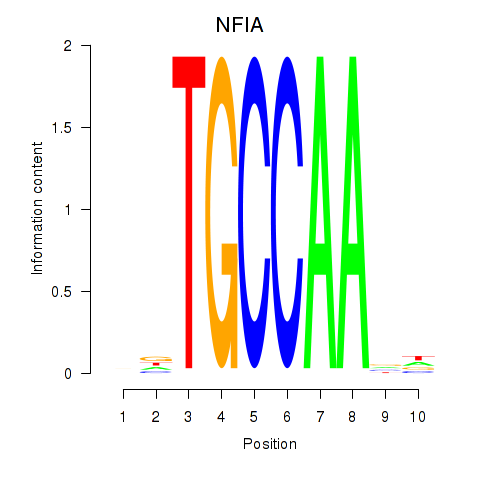
Results for NFIA
Z-value: 1.54
Motif logo
Transcription factors associated with NFIA
| Gene Symbol | Gene ID | Gene Info |
|---|---|---|
|
NFIA
|
ENSG00000162599.17 | nuclear factor I A |
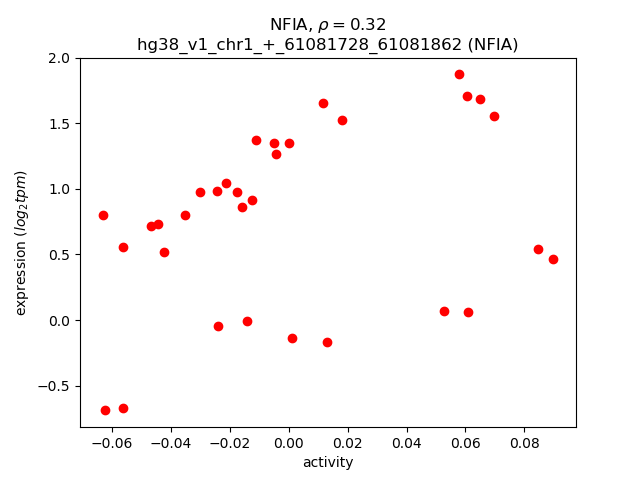
Activity-expression correlation:
| Gene | Promoter | Pearson corr. coef. | P-value | Plot |
|---|---|---|---|---|
| NFIA | hg38_v1_chr1_+_61081728_61081862 | 0.32 | 7.6e-02 | Click! |
Activity profile of NFIA motif
Sorted Z-values of NFIA motif
| Promoter | Log-likelihood | Transcript | Gene | Gene Info |
|---|---|---|---|---|
| chr17_-_10518536 | 13.10 |
ENST00000226207.6
|
MYH1
|
myosin heavy chain 1 |
| chr17_-_10549612 | 6.51 |
ENST00000532183.6
ENST00000397183.6 ENST00000420805.1 |
MYH2
|
myosin heavy chain 2 |
| chr17_-_10549652 | 6.17 |
ENST00000245503.10
|
MYH2
|
myosin heavy chain 2 |
| chr1_-_26067622 | 5.85 |
ENST00000374272.4
|
TRIM63
|
tripartite motif containing 63 |
| chr11_+_78063851 | 5.49 |
ENST00000281030.2
|
THRSP
|
thyroid hormone responsive |
| chr1_-_146021724 | 5.42 |
ENST00000475797.1
ENST00000497365.5 ENST00000336751.11 ENST00000634927.1 ENST00000421822.2 |
HJV
|
hemojuvelin BMP co-receptor |
| chr3_-_155293665 | 5.30 |
ENST00000489090.2
|
STRIT1
|
small transmembrane regulator of ion transport 1 |
| chr10_+_24239181 | 4.92 |
ENST00000438429.5
|
KIAA1217
|
KIAA1217 |
| chr17_-_10549694 | 4.33 |
ENST00000622564.4
|
MYH2
|
myosin heavy chain 2 |
| chr13_+_23180960 | 3.26 |
ENST00000218867.4
|
SGCG
|
sarcoglycan gamma |
| chr20_+_31819302 | 3.18 |
ENST00000375994.6
|
MYLK2
|
myosin light chain kinase 2 |
| chr20_+_31819348 | 3.16 |
ENST00000375985.5
|
MYLK2
|
myosin light chain kinase 2 |
| chr1_+_160190567 | 3.06 |
ENST00000368078.8
|
CASQ1
|
calsequestrin 1 |
| chr16_+_30372291 | 3.06 |
ENST00000568749.5
|
MYLPF
|
myosin light chain, phosphorylatable, fast skeletal muscle |
| chr9_+_114323098 | 3.06 |
ENST00000259396.9
|
ORM1
|
orosomucoid 1 |
| chr12_+_57434778 | 2.96 |
ENST00000309668.3
|
INHBC
|
inhibin subunit beta C |
| chr4_-_44651619 | 2.88 |
ENST00000415895.9
ENST00000332990.6 |
YIPF7
|
Yip1 domain family member 7 |
| chr10_+_5196831 | 2.82 |
ENST00000263126.3
|
AKR1C4
|
aldo-keto reductase family 1 member C4 |
| chr10_+_24466487 | 2.51 |
ENST00000396446.5
ENST00000396445.5 ENST00000376451.4 |
KIAA1217
|
KIAA1217 |
| chr6_-_123636979 | 2.50 |
ENST00000662930.1
|
TRDN
|
triadin |
| chr8_+_66432475 | 2.46 |
ENST00000415254.5
ENST00000396623.8 |
ADHFE1
|
alcohol dehydrogenase iron containing 1 |
| chr3_-_52826834 | 2.44 |
ENST00000441637.2
|
ITIH4
|
inter-alpha-trypsin inhibitor heavy chain 4 |
| chrX_+_106201724 | 2.28 |
ENST00000372552.1
|
PWWP3B
|
PWWP domain containing 3B |
| chrX_+_136169891 | 2.27 |
ENST00000449474.5
|
FHL1
|
four and a half LIM domains 1 |
| chr12_-_110920568 | 2.26 |
ENST00000548438.1
ENST00000228841.15 |
MYL2
|
myosin light chain 2 |
| chrX_+_136169833 | 2.25 |
ENST00000628032.2
|
FHL1
|
four and a half LIM domains 1 |
| chr11_-_13496018 | 2.22 |
ENST00000529816.1
|
PTH
|
parathyroid hormone |
| chr10_+_113553039 | 2.19 |
ENST00000351270.4
|
HABP2
|
hyaluronan binding protein 2 |
| chr1_-_201112420 | 2.18 |
ENST00000362061.4
ENST00000681874.1 |
CACNA1S
|
calcium voltage-gated channel subunit alpha1 S |
| chr11_-_13495984 | 2.18 |
ENST00000282091.6
|
PTH
|
parathyroid hormone |
| chrX_+_136169624 | 2.18 |
ENST00000394153.6
|
FHL1
|
four and a half LIM domains 1 |
| chr4_+_73404255 | 2.17 |
ENST00000621628.4
ENST00000621085.4 ENST00000415165.6 ENST00000295897.9 ENST00000503124.5 ENST00000509063.5 ENST00000401494.7 |
ALB
|
albumin |
| chr10_+_100347225 | 2.15 |
ENST00000370355.3
|
SCD
|
stearoyl-CoA desaturase |
| chr16_+_55324191 | 2.15 |
ENST00000290552.8
|
IRX6
|
iroquois homeobox 6 |
| chr4_-_110636963 | 2.15 |
ENST00000394595.8
|
PITX2
|
paired like homeodomain 2 |
| chr16_+_82056423 | 2.12 |
ENST00000568090.5
|
HSD17B2
|
hydroxysteroid 17-beta dehydrogenase 2 |
| chrX_+_136169664 | 2.09 |
ENST00000456445.5
|
FHL1
|
four and a half LIM domains 1 |
| chr6_-_123636997 | 2.09 |
ENST00000546248.5
|
TRDN
|
triadin |
| chr6_-_123636923 | 2.07 |
ENST00000334268.9
|
TRDN
|
triadin |
| chr17_-_10469558 | 2.06 |
ENST00000255381.2
|
MYH4
|
myosin heavy chain 4 |
| chr5_-_151347552 | 2.04 |
ENST00000335244.9
ENST00000521967.1 |
SLC36A2
|
solute carrier family 36 member 2 |
| chr10_+_4963406 | 2.01 |
ENST00000380872.9
ENST00000442997.5 |
AKR1C1
|
aldo-keto reductase family 1 member C1 |
| chr12_+_55720367 | 2.00 |
ENST00000547072.5
ENST00000552930.5 ENST00000257895.10 |
RDH5
|
retinol dehydrogenase 5 |
| chr10_+_133527355 | 1.95 |
ENST00000252945.8
ENST00000421586.5 ENST00000418356.1 |
CYP2E1
|
cytochrome P450 family 2 subfamily E member 1 |
| chr8_+_96493803 | 1.95 |
ENST00000518385.5
ENST00000302190.9 |
SDC2
|
syndecan 2 |
| chr3_-_69122588 | 1.94 |
ENST00000420581.7
ENST00000489031.5 |
LMOD3
|
leiomodin 3 |
| chr1_+_201190786 | 1.88 |
ENST00000335211.9
ENST00000295591.12 |
IGFN1
|
immunoglobulin like and fibronectin type III domain containing 1 |
| chrX_-_15314543 | 1.87 |
ENST00000344384.8
|
ASB11
|
ankyrin repeat and SOCS box containing 11 |
| chr19_-_49155130 | 1.83 |
ENST00000595625.1
|
HRC
|
histidine rich calcium binding protein |
| chr16_-_55833186 | 1.82 |
ENST00000361503.8
ENST00000422046.6 |
CES1
|
carboxylesterase 1 |
| chr1_-_201112451 | 1.82 |
ENST00000367338.7
|
CACNA1S
|
calcium voltage-gated channel subunit alpha1 S |
| chr4_+_39406917 | 1.79 |
ENST00000257408.5
|
KLB
|
klotho beta |
| chr11_-_16356538 | 1.78 |
ENST00000683767.1
|
SOX6
|
SRY-box transcription factor 6 |
| chr12_+_55720405 | 1.77 |
ENST00000548082.1
|
RDH5
|
retinol dehydrogenase 5 |
| chr1_-_203175783 | 1.77 |
ENST00000621380.1
ENST00000255416.9 |
MYBPH
|
myosin binding protein H |
| chr5_+_42423433 | 1.76 |
ENST00000230882.9
|
GHR
|
growth hormone receptor |
| chr18_+_31591869 | 1.72 |
ENST00000237014.8
|
TTR
|
transthyretin |
| chr2_+_173090598 | 1.71 |
ENST00000422149.1
|
MAP3K20
|
mitogen-activated protein kinase kinase kinase 20 |
| chr11_+_10305065 | 1.70 |
ENST00000534464.1
ENST00000278175.10 ENST00000530439.1 ENST00000524948.5 ENST00000528655.5 ENST00000526492.4 ENST00000525063.2 |
ADM
|
adrenomedullin |
| chr19_-_49155384 | 1.70 |
ENST00000252825.9
|
HRC
|
histidine rich calcium binding protein |
| chr16_-_10559135 | 1.69 |
ENST00000536829.1
|
EMP2
|
epithelial membrane protein 2 |
| chr11_-_2137277 | 1.69 |
ENST00000381392.5
ENST00000381395.5 ENST00000418738.2 |
IGF2
|
insulin like growth factor 2 |
| chr19_-_39833615 | 1.65 |
ENST00000593685.5
ENST00000600611.5 |
DYRK1B
|
dual specificity tyrosine phosphorylation regulated kinase 1B |
| chr3_+_184315131 | 1.62 |
ENST00000427845.5
ENST00000342981.8 |
EIF4G1
|
eukaryotic translation initiation factor 4 gamma 1 |
| chr4_+_41360759 | 1.62 |
ENST00000508501.5
ENST00000512946.5 ENST00000313860.11 ENST00000512632.5 ENST00000512820.5 |
LIMCH1
|
LIM and calponin homology domains 1 |
| chr4_-_53652453 | 1.58 |
ENST00000507168.5
ENST00000510143.1 |
LNX1
|
ligand of numb-protein X 1 |
| chr12_-_69699285 | 1.58 |
ENST00000553096.5
ENST00000330891.10 |
BEST3
|
bestrophin 3 |
| chr2_-_31414694 | 1.58 |
ENST00000379416.4
|
XDH
|
xanthine dehydrogenase |
| chr7_-_44325421 | 1.55 |
ENST00000395747.6
ENST00000347193.8 ENST00000346990.8 ENST00000258682.10 ENST00000353625.8 ENST00000421607.1 ENST00000424197.5 |
CAMK2B
|
calcium/calmodulin dependent protein kinase II beta |
| chr9_-_34589701 | 1.54 |
ENST00000351266.8
|
CNTFR
|
ciliary neurotrophic factor receptor |
| chr17_-_15265230 | 1.54 |
ENST00000676161.1
ENST00000646419.2 ENST00000312280.9 ENST00000494511.7 ENST00000580584.3 ENST00000676221.1 |
PMP22
|
peripheral myelin protein 22 |
| chr1_-_13513988 | 1.54 |
ENST00000376085.4
|
LRRC38
|
leucine rich repeat containing 38 |
| chr9_-_34590123 | 1.53 |
ENST00000417345.2
ENST00000610543.4 |
CNTFR
|
ciliary neurotrophic factor receptor |
| chr6_+_122779707 | 1.51 |
ENST00000368444.8
ENST00000356535.4 |
FABP7
|
fatty acid binding protein 7 |
| chr8_+_40153475 | 1.49 |
ENST00000315792.5
|
TCIM
|
transcriptional and immune response regulator |
| chr9_-_34589716 | 1.48 |
ENST00000378980.8
|
CNTFR
|
ciliary neurotrophic factor receptor |
| chr13_-_35476682 | 1.45 |
ENST00000379919.6
|
MAB21L1
|
mab-21 like 1 |
| chr3_+_184315347 | 1.45 |
ENST00000424196.5
|
EIF4G1
|
eukaryotic translation initiation factor 4 gamma 1 |
| chr9_-_127122623 | 1.43 |
ENST00000373417.1
ENST00000373425.8 |
ANGPTL2
|
angiopoietin like 2 |
| chr16_+_6483728 | 1.42 |
ENST00000675459.1
ENST00000551752.5 |
RBFOX1
|
RNA binding fox-1 homolog 1 |
| chr6_-_123636906 | 1.41 |
ENST00000628709.2
|
TRDN
|
triadin |
| chr12_-_52517929 | 1.39 |
ENST00000548409.5
|
KRT5
|
keratin 5 |
| chr7_+_95485934 | 1.37 |
ENST00000325885.6
|
ASB4
|
ankyrin repeat and SOCS box containing 4 |
| chr3_+_119294337 | 1.36 |
ENST00000264245.9
|
ARHGAP31
|
Rho GTPase activating protein 31 |
| chr15_+_86079863 | 1.36 |
ENST00000614907.3
ENST00000441037.7 |
AGBL1
|
ATP/GTP binding protein like 1 |
| chr12_-_46832370 | 1.36 |
ENST00000546940.1
|
SLC38A4
|
solute carrier family 38 member 4 |
| chr9_-_19149278 | 1.35 |
ENST00000434144.5
|
PLIN2
|
perilipin 2 |
| chr1_+_67685342 | 1.34 |
ENST00000617962.2
|
GADD45A
|
growth arrest and DNA damage inducible alpha |
| chr12_-_48999363 | 1.34 |
ENST00000421952.3
|
DDN
|
dendrin |
| chr10_+_72893734 | 1.34 |
ENST00000334011.10
|
OIT3
|
oncoprotein induced transcript 3 |
| chr3_+_148791058 | 1.33 |
ENST00000491148.5
|
CPB1
|
carboxypeptidase B1 |
| chr8_-_42501224 | 1.32 |
ENST00000520262.6
ENST00000517366.1 |
SLC20A2
|
solute carrier family 20 member 2 |
| chr8_+_132919403 | 1.32 |
ENST00000519178.5
|
TG
|
thyroglobulin |
| chr4_+_94489030 | 1.31 |
ENST00000510099.5
|
PDLIM5
|
PDZ and LIM domain 5 |
| chr1_-_209618766 | 1.30 |
ENST00000455193.1
|
LAMB3
|
laminin subunit beta 3 |
| chr1_+_67685170 | 1.29 |
ENST00000370985.4
ENST00000370986.9 ENST00000650283.1 ENST00000648742.1 |
GADD45A
|
growth arrest and DNA damage inducible alpha |
| chr10_-_80289647 | 1.28 |
ENST00000372213.8
|
MAT1A
|
methionine adenosyltransferase 1A |
| chr5_+_54455661 | 1.27 |
ENST00000302005.3
|
HSPB3
|
heat shock protein family B (small) member 3 |
| chr1_-_114670018 | 1.26 |
ENST00000393274.6
ENST00000393276.7 |
DENND2C
|
DENN domain containing 2C |
| chr20_+_44714835 | 1.26 |
ENST00000372868.6
|
CCN5
|
cellular communication network factor 5 |
| chr12_+_110280602 | 1.23 |
ENST00000552636.2
|
ATP2A2
|
ATPase sarcoplasmic/endoplasmic reticulum Ca2+ transporting 2 |
| chr8_-_17895487 | 1.23 |
ENST00000427924.5
ENST00000381841.4 |
FGL1
|
fibrinogen like 1 |
| chr1_+_209704836 | 1.23 |
ENST00000367027.5
|
HSD11B1
|
hydroxysteroid 11-beta dehydrogenase 1 |
| chr3_+_16174628 | 1.23 |
ENST00000339732.10
|
GALNT15
|
polypeptide N-acetylgalactosaminyltransferase 15 |
| chr3_+_148730100 | 1.22 |
ENST00000474935.5
ENST00000475347.5 ENST00000461609.1 |
AGTR1
|
angiotensin II receptor type 1 |
| chr11_-_2149603 | 1.22 |
ENST00000643349.1
|
ENSG00000284779.2
|
novel protein |
| chr5_+_36606355 | 1.21 |
ENST00000681909.1
ENST00000513903.5 ENST00000681795.1 ENST00000680125.1 ENST00000612708.5 ENST00000680232.1 ENST00000681776.1 ENST00000681926.1 ENST00000679958.1 ENST00000265113.9 ENST00000504121.5 ENST00000512374.1 ENST00000613445.5 ENST00000679983.1 |
SLC1A3
|
solute carrier family 1 member 3 |
| chr11_-_61580826 | 1.20 |
ENST00000540677.5
ENST00000542836.5 ENST00000542670.5 ENST00000535826.5 ENST00000545053.1 ENST00000539008.6 |
SYT7
|
synaptotagmin 7 |
| chr20_+_44714853 | 1.17 |
ENST00000372865.4
|
CCN5
|
cellular communication network factor 5 |
| chr5_-_180591488 | 1.16 |
ENST00000292641.4
|
SCGB3A1
|
secretoglobin family 3A member 1 |
| chr11_+_111602380 | 1.16 |
ENST00000304987.4
|
SIK2
|
salt inducible kinase 2 |
| chr1_+_15659869 | 1.16 |
ENST00000345034.1
|
RSC1A1
|
regulator of solute carriers 1 |
| chr18_+_63476927 | 1.15 |
ENST00000489441.5
ENST00000382771.9 ENST00000424602.1 |
SERPINB5
|
serpin family B member 5 |
| chr3_-_194351290 | 1.15 |
ENST00000429275.1
ENST00000323830.4 |
CPN2
|
carboxypeptidase N subunit 2 |
| chr6_+_63571702 | 1.15 |
ENST00000672924.1
|
PTP4A1
|
protein tyrosine phosphatase 4A1 |
| chr16_+_6483813 | 1.15 |
ENST00000675653.1
|
RBFOX1
|
RNA binding fox-1 homolog 1 |
| chr19_+_41003946 | 1.14 |
ENST00000593831.1
|
CYP2B6
|
cytochrome P450 family 2 subfamily B member 6 |
| chr9_+_470291 | 1.13 |
ENST00000382303.5
|
KANK1
|
KN motif and ankyrin repeat domains 1 |
| chr2_+_233681877 | 1.12 |
ENST00000373426.4
|
UGT1A7
|
UDP glucuronosyltransferase family 1 member A7 |
| chr12_-_110920710 | 1.10 |
ENST00000546404.1
|
MYL2
|
myosin light chain 2 |
| chr1_-_151805419 | 1.10 |
ENST00000368820.4
|
LINGO4
|
leucine rich repeat and Ig domain containing 4 |
| chr10_-_102837406 | 1.10 |
ENST00000369887.4
ENST00000638272.1 ENST00000639393.1 ENST00000638971.1 ENST00000638190.1 |
CYP17A1
|
cytochrome P450 family 17 subfamily A member 1 |
| chr15_+_62758585 | 1.08 |
ENST00000472902.1
|
TLN2
|
talin 2 |
| chr12_-_52520371 | 1.07 |
ENST00000549420.1
ENST00000252242.9 ENST00000551275.1 ENST00000546577.1 |
KRT5
|
keratin 5 |
| chr19_-_39834127 | 1.07 |
ENST00000601972.1
ENST00000430012.6 ENST00000323039.10 ENST00000348817.7 |
DYRK1B
|
dual specificity tyrosine phosphorylation regulated kinase 1B |
| chr6_-_75363003 | 1.06 |
ENST00000370020.1
|
FILIP1
|
filamin A interacting protein 1 |
| chr10_+_72893572 | 1.06 |
ENST00000622652.1
|
OIT3
|
oncoprotein induced transcript 3 |
| chr11_-_64245816 | 1.06 |
ENST00000542235.1
|
PPP1R14B
|
protein phosphatase 1 regulatory inhibitor subunit 14B |
| chr7_-_56092932 | 1.05 |
ENST00000446428.5
ENST00000432123.5 ENST00000297373.7 |
PHKG1
|
phosphorylase kinase catalytic subunit gamma 1 |
| chr16_+_58249910 | 1.05 |
ENST00000219299.8
ENST00000443128.6 ENST00000616795.1 |
CCDC113
|
coiled-coil domain containing 113 |
| chr10_+_5048748 | 1.05 |
ENST00000602997.5
ENST00000439082.7 |
AKR1C3
|
aldo-keto reductase family 1 member C3 |
| chr5_+_43602648 | 1.05 |
ENST00000505678.6
ENST00000512422.5 ENST00000264663.9 ENST00000670904.1 ENST00000653251.1 |
NNT
|
nicotinamide nucleotide transhydrogenase |
| chr16_-_69356306 | 1.04 |
ENST00000563634.1
|
ENSG00000260371.1
|
novel protein |
| chr21_-_30216047 | 1.04 |
ENST00000399899.2
|
CLDN8
|
claudin 8 |
| chr6_-_123636966 | 1.04 |
ENST00000542443.5
|
TRDN
|
triadin |
| chr17_-_64230727 | 1.03 |
ENST00000583097.5
ENST00000615733.4 |
TEX2
|
testis expressed 2 |
| chr2_+_134838610 | 1.03 |
ENST00000356140.10
ENST00000392928.5 |
ACMSD
|
aminocarboxymuconate semialdehyde decarboxylase |
| chr2_-_227714589 | 1.03 |
ENST00000258403.8
|
SLC19A3
|
solute carrier family 19 member 3 |
| chr7_-_44325490 | 1.02 |
ENST00000350811.7
|
CAMK2B
|
calcium/calmodulin dependent protein kinase II beta |
| chr8_+_96584920 | 1.02 |
ENST00000521590.5
|
SDC2
|
syndecan 2 |
| chr4_-_100190782 | 1.02 |
ENST00000513992.1
|
DDIT4L
|
DNA damage inducible transcript 4 like |
| chrX_+_22032427 | 1.00 |
ENST00000684143.1
|
PHEX
|
phosphate regulating endopeptidase homolog X-linked |
| chr14_-_74612021 | 1.00 |
ENST00000556690.5
|
LTBP2
|
latent transforming growth factor beta binding protein 2 |
| chr15_+_67166019 | 1.00 |
ENST00000537194.6
|
SMAD3
|
SMAD family member 3 |
| chr19_-_42442938 | 1.00 |
ENST00000601181.6
|
CXCL17
|
C-X-C motif chemokine ligand 17 |
| chr11_-_61333784 | 0.98 |
ENST00000680367.1
ENST00000681803.1 |
DDB1
|
damage specific DNA binding protein 1 |
| chr17_-_41612757 | 0.98 |
ENST00000301653.9
ENST00000593067.1 |
KRT16
|
keratin 16 |
| chr17_-_55732074 | 0.98 |
ENST00000575734.5
|
TMEM100
|
transmembrane protein 100 |
| chr11_-_26572254 | 0.97 |
ENST00000529533.6
|
MUC15
|
mucin 15, cell surface associated |
| chr8_-_120811988 | 0.97 |
ENST00000517992.2
|
SNTB1
|
syntrophin beta 1 |
| chrX_+_13569593 | 0.96 |
ENST00000361306.6
ENST00000380602.3 |
EGFL6
|
EGF like domain multiple 6 |
| chr2_+_233636445 | 0.95 |
ENST00000344644.9
|
UGT1A10
|
UDP glucuronosyltransferase family 1 member A10 |
| chr11_-_113773668 | 0.94 |
ENST00000200135.8
|
ZW10
|
zw10 kinetochore protein |
| chr7_-_56092974 | 0.94 |
ENST00000452681.6
ENST00000537360.5 |
PHKG1
|
phosphorylase kinase catalytic subunit gamma 1 |
| chr19_+_41219235 | 0.93 |
ENST00000359092.7
|
AXL
|
AXL receptor tyrosine kinase |
| chr1_+_170663134 | 0.93 |
ENST00000367760.7
|
PRRX1
|
paired related homeobox 1 |
| chr17_+_70104848 | 0.93 |
ENST00000392670.5
|
KCNJ16
|
potassium inwardly rectifying channel subfamily J member 16 |
| chr10_-_99430617 | 0.92 |
ENST00000370508.7
|
GOT1
|
glutamic-oxaloacetic transaminase 1 |
| chr11_+_27041313 | 0.92 |
ENST00000528583.5
|
BBOX1
|
gamma-butyrobetaine hydroxylase 1 |
| chr3_+_184315763 | 0.92 |
ENST00000456033.5
|
EIF4G1
|
eukaryotic translation initiation factor 4 gamma 1 |
| chr2_+_233636502 | 0.92 |
ENST00000373445.1
|
UGT1A10
|
UDP glucuronosyltransferase family 1 member A10 |
| chr20_+_6767678 | 0.90 |
ENST00000378827.5
|
BMP2
|
bone morphogenetic protein 2 |
| chr7_-_99735093 | 0.89 |
ENST00000611620.4
ENST00000620220.6 ENST00000336374.4 |
CYP3A7-CYP3A51P
CYP3A7
|
CYP3A7-CYP3A51P readthrough cytochrome P450 family 3 subfamily A member 7 |
| chr18_+_61333424 | 0.88 |
ENST00000262717.9
|
CDH20
|
cadherin 20 |
| chr13_-_28495079 | 0.88 |
ENST00000615840.4
ENST00000282397.9 ENST00000541932.5 ENST00000539099.1 ENST00000639477.1 |
FLT1
|
fms related receptor tyrosine kinase 1 |
| chr1_+_207104226 | 0.88 |
ENST00000367070.8
|
C4BPA
|
complement component 4 binding protein alpha |
| chr12_-_69699331 | 0.87 |
ENST00000548658.1
ENST00000476098.5 |
BEST3
|
bestrophin 3 |
| chr3_-_15797930 | 0.87 |
ENST00000683139.1
|
ANKRD28
|
ankyrin repeat domain 28 |
| chr2_+_26244894 | 0.87 |
ENST00000405867.7
ENST00000317799.10 |
HADHB
|
hydroxyacyl-CoA dehydrogenase trifunctional multienzyme complex subunit beta |
| chr22_+_44031345 | 0.87 |
ENST00000444029.5
|
PARVB
|
parvin beta |
| chr2_-_110534010 | 0.87 |
ENST00000437167.1
|
RGPD6
|
RANBP2 like and GRIP domain containing 6 |
| chr4_-_186596770 | 0.86 |
ENST00000512772.5
|
FAT1
|
FAT atypical cadherin 1 |
| chr12_-_69699353 | 0.86 |
ENST00000331471.8
|
BEST3
|
bestrophin 3 |
| chr14_-_74612226 | 0.86 |
ENST00000261978.9
|
LTBP2
|
latent transforming growth factor beta binding protein 2 |
| chr3_+_69763549 | 0.85 |
ENST00000472437.5
|
MITF
|
melanocyte inducing transcription factor |
| chr19_+_41219177 | 0.84 |
ENST00000301178.9
|
AXL
|
AXL receptor tyrosine kinase |
| chr2_+_188974364 | 0.83 |
ENST00000304636.9
ENST00000317840.9 |
COL3A1
|
collagen type III alpha 1 chain |
| chr4_+_186227501 | 0.83 |
ENST00000446598.6
ENST00000264690.11 ENST00000513864.2 |
KLKB1
|
kallikrein B1 |
| chrX_-_30889394 | 0.82 |
ENST00000288422.3
|
TAB3
|
TGF-beta activated kinase 1 (MAP3K7) binding protein 3 |
| chr12_+_52056514 | 0.82 |
ENST00000550582.2
|
NR4A1
|
nuclear receptor subfamily 4 group A member 1 |
| chr1_+_45913583 | 0.81 |
ENST00000372008.6
|
MAST2
|
microtubule associated serine/threonine kinase 2 |
| chr6_+_30983710 | 0.81 |
ENST00000486149.2
ENST00000376296.3 |
MUC21
|
mucin 21, cell surface associated |
| chr11_+_10305370 | 0.81 |
ENST00000528544.1
|
ADM
|
adrenomedullin |
| chr3_+_51977833 | 0.81 |
ENST00000637978.1
|
ABHD14A-ACY1
|
ABHD14A-ACY1 readthrough |
| chr12_+_7062583 | 0.81 |
ENST00000542978.1
|
C1S
|
complement C1s |
| chr3_+_189171948 | 0.80 |
ENST00000345063.8
|
TPRG1
|
tumor protein p63 regulated 1 |
| chr1_+_61081728 | 0.80 |
ENST00000371189.8
|
NFIA
|
nuclear factor I A |
| chrX_+_131083706 | 0.79 |
ENST00000370921.1
|
ARHGAP36
|
Rho GTPase activating protein 36 |
| chr14_+_91114667 | 0.79 |
ENST00000523894.5
ENST00000522322.5 ENST00000523771.5 |
DGLUCY
|
D-glutamate cyclase |
| chr1_+_207104287 | 0.79 |
ENST00000421786.5
|
C4BPA
|
complement component 4 binding protein alpha |
| chr10_+_102776237 | 0.79 |
ENST00000369889.5
|
WBP1L
|
WW domain binding protein 1 like |
| chr9_+_128149447 | 0.78 |
ENST00000277480.7
ENST00000372998.1 |
LCN2
|
lipocalin 2 |
| chr2_+_26244731 | 0.78 |
ENST00000537713.5
|
HADHB
|
hydroxyacyl-CoA dehydrogenase trifunctional multienzyme complex subunit beta |
| chr3_-_47892743 | 0.78 |
ENST00000420772.6
|
MAP4
|
microtubule associated protein 4 |
| chr11_-_26572102 | 0.77 |
ENST00000455601.6
|
MUC15
|
mucin 15, cell surface associated |
| chr2_-_162243375 | 0.77 |
ENST00000188790.9
ENST00000443424.5 |
FAP
|
fibroblast activation protein alpha |
| chr2_-_241271943 | 0.76 |
ENST00000444092.5
|
HDLBP
|
high density lipoprotein binding protein |
| chr1_-_160284205 | 0.76 |
ENST00000392220.2
|
PEX19
|
peroxisomal biogenesis factor 19 |
| chr20_+_33007695 | 0.76 |
ENST00000170150.4
|
BPIFB2
|
BPI fold containing family B member 2 |
| chr12_-_69699382 | 0.75 |
ENST00000551160.5
|
BEST3
|
bestrophin 3 |
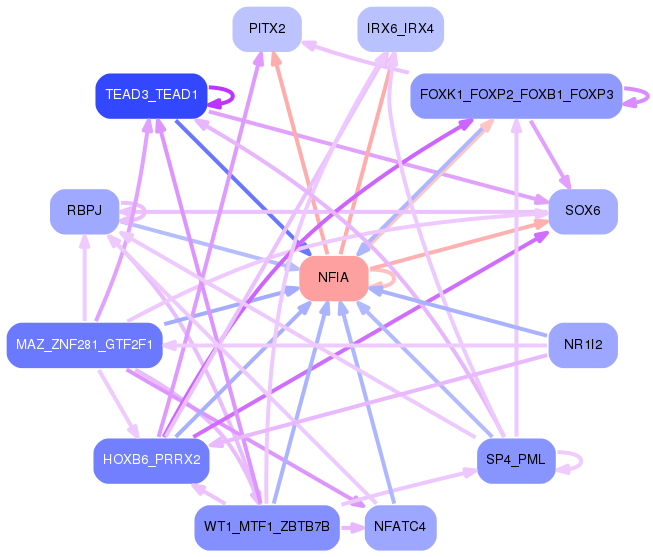
Network of associatons between targets according to the STRING database.

First level regulatory network of NFIA
Gene Ontology Analysis
Gene overrepresentation in biological process category:
| Log-likelihood per target | Total log-likelihood | Term | Description |
|---|---|---|---|
| 1.8 | 9.1 | GO:1901846 | positive regulation of cell communication by electrical coupling involved in cardiac conduction(GO:1901846) |
| 1.2 | 3.5 | GO:1901899 | positive regulation of relaxation of cardiac muscle(GO:1901899) |
| 1.0 | 5.9 | GO:0009753 | response to jasmonic acid(GO:0009753) cellular response to jasmonic acid stimulus(GO:0071395) |
| 1.0 | 5.9 | GO:0014878 | response to electrical stimulus involved in regulation of muscle adaptation(GO:0014878) |
| 1.0 | 18.2 | GO:0001778 | plasma membrane repair(GO:0001778) |
| 0.9 | 1.8 | GO:0090119 | vesicle-mediated cholesterol transport(GO:0090119) |
| 0.9 | 6.3 | GO:0032971 | regulation of muscle filament sliding(GO:0032971) |
| 0.9 | 4.4 | GO:0090290 | positive regulation of osteoclast proliferation(GO:0090290) |
| 0.8 | 2.5 | GO:0015993 | molecular hydrogen transport(GO:0015993) |
| 0.7 | 2.2 | GO:0019836 | hemolysis by symbiont of host erythrocytes(GO:0019836) hemolysis in other organism(GO:0044179) hemolysis in other organism involved in symbiotic interaction(GO:0052331) |
| 0.7 | 2.1 | GO:0021763 | subthalamic nucleus development(GO:0021763) prolactin secreting cell differentiation(GO:0060127) superior vena cava morphogenesis(GO:0060578) |
| 0.6 | 3.5 | GO:0051552 | flavone metabolic process(GO:0051552) |
| 0.5 | 1.6 | GO:0046110 | xanthine metabolic process(GO:0046110) |
| 0.5 | 3.0 | GO:0008218 | bioluminescence(GO:0008218) |
| 0.4 | 1.2 | GO:1903515 | calcium ion transport from cytosol to endoplasmic reticulum(GO:1903515) |
| 0.4 | 1.2 | GO:1904640 | response to methionine(GO:1904640) |
| 0.4 | 2.0 | GO:0010193 | response to ozone(GO:0010193) |
| 0.4 | 4.6 | GO:0070120 | ciliary neurotrophic factor-mediated signaling pathway(GO:0070120) |
| 0.4 | 2.5 | GO:0046092 | deoxycytidine metabolic process(GO:0046092) |
| 0.4 | 2.5 | GO:0021780 | oligodendrocyte cell fate specification(GO:0021778) oligodendrocyte cell fate commitment(GO:0021779) glial cell fate specification(GO:0021780) |
| 0.3 | 1.0 | GO:1902688 | regulation of NAD metabolic process(GO:1902688) |
| 0.3 | 1.0 | GO:1902173 | negative regulation of keratinocyte apoptotic process(GO:1902173) |
| 0.3 | 1.3 | GO:0006556 | S-adenosylmethionine biosynthetic process(GO:0006556) |
| 0.3 | 2.5 | GO:0006701 | progesterone biosynthetic process(GO:0006701) |
| 0.3 | 0.9 | GO:0006532 | fumarate metabolic process(GO:0006106) glycerol biosynthetic process(GO:0006114) aspartate biosynthetic process(GO:0006532) aspartate catabolic process(GO:0006533) |
| 0.3 | 1.2 | GO:0086097 | phospholipase C-activating angiotensin-activated signaling pathway(GO:0086097) |
| 0.3 | 0.9 | GO:0060128 | corticotropin hormone secreting cell differentiation(GO:0060128) |
| 0.3 | 1.8 | GO:0090080 | positive regulation of MAPKKK cascade by fibroblast growth factor receptor signaling pathway(GO:0090080) |
| 0.3 | 0.9 | GO:0036323 | vascular endothelial growth factor receptor-1 signaling pathway(GO:0036323) |
| 0.3 | 1.4 | GO:1904383 | response to sodium phosphate(GO:1904383) |
| 0.3 | 1.1 | GO:2000393 | negative regulation of lamellipodium morphogenesis(GO:2000393) |
| 0.3 | 1.7 | GO:0006740 | NADPH regeneration(GO:0006740) |
| 0.3 | 4.0 | GO:0002191 | cap-dependent translational initiation(GO:0002191) |
| 0.3 | 1.8 | GO:2000669 | negative regulation of dendritic cell apoptotic process(GO:2000669) |
| 0.2 | 0.7 | GO:0016094 | polyprenol biosynthetic process(GO:0016094) |
| 0.2 | 0.7 | GO:0060152 | peroxisome localization(GO:0060151) microtubule-based peroxisome localization(GO:0060152) |
| 0.2 | 2.5 | GO:0035965 | cardiolipin acyl-chain remodeling(GO:0035965) |
| 0.2 | 1.4 | GO:0097325 | melanocyte proliferation(GO:0097325) |
| 0.2 | 3.1 | GO:1904469 | positive regulation of tumor necrosis factor secretion(GO:1904469) |
| 0.2 | 0.8 | GO:0051919 | activation of plasma proteins involved in acute inflammatory response(GO:0002541) positive regulation of fibrinolysis(GO:0051919) |
| 0.2 | 1.0 | GO:0071934 | thiamine transmembrane transport(GO:0071934) |
| 0.2 | 0.6 | GO:0001544 | initiation of primordial ovarian follicle growth(GO:0001544) |
| 0.2 | 1.2 | GO:0010868 | negative regulation of triglyceride biosynthetic process(GO:0010868) |
| 0.2 | 1.4 | GO:0035610 | protein side chain deglutamylation(GO:0035610) |
| 0.2 | 1.9 | GO:0051694 | pointed-end actin filament capping(GO:0051694) |
| 0.2 | 3.1 | GO:0014809 | regulation of skeletal muscle contraction by regulation of release of sequestered calcium ion(GO:0014809) |
| 0.2 | 0.6 | GO:0035048 | splicing factor protein import into nucleus(GO:0035048) |
| 0.2 | 1.7 | GO:0030450 | regulation of complement activation, classical pathway(GO:0030450) negative regulation of complement activation, classical pathway(GO:0045959) |
| 0.2 | 1.6 | GO:0000255 | allantoin metabolic process(GO:0000255) |
| 0.2 | 1.8 | GO:0038028 | insulin receptor signaling pathway via phosphatidylinositol 3-kinase(GO:0038028) |
| 0.2 | 1.4 | GO:0061767 | negative regulation of lung blood pressure(GO:0061767) |
| 0.2 | 0.7 | GO:0072334 | UDP-galactose transport(GO:0015785) UDP-galactose transmembrane transport(GO:0072334) |
| 0.2 | 2.1 | GO:0006537 | glutamate biosynthetic process(GO:0006537) |
| 0.2 | 4.2 | GO:2001212 | regulation of vasculogenesis(GO:2001212) |
| 0.2 | 0.8 | GO:0001757 | somite specification(GO:0001757) |
| 0.2 | 0.5 | GO:0021758 | caudate nucleus development(GO:0021757) putamen development(GO:0021758) |
| 0.2 | 1.1 | GO:0006651 | diacylglycerol biosynthetic process(GO:0006651) |
| 0.2 | 5.7 | GO:0010866 | regulation of triglyceride biosynthetic process(GO:0010866) |
| 0.2 | 0.6 | GO:0048631 | regulation of skeletal muscle tissue growth(GO:0048631) |
| 0.2 | 0.8 | GO:0015891 | iron chelate transport(GO:0015688) siderophore transport(GO:0015891) |
| 0.2 | 1.1 | GO:0042448 | progesterone metabolic process(GO:0042448) |
| 0.2 | 0.6 | GO:0021849 | neuroblast division in subventricular zone(GO:0021849) |
| 0.1 | 0.4 | GO:0046416 | D-amino acid metabolic process(GO:0046416) |
| 0.1 | 0.4 | GO:0002940 | tRNA N2-guanine methylation(GO:0002940) |
| 0.1 | 1.6 | GO:0015808 | L-alanine transport(GO:0015808) |
| 0.1 | 0.7 | GO:0007181 | transforming growth factor beta receptor complex assembly(GO:0007181) |
| 0.1 | 1.8 | GO:0071688 | striated muscle myosin thick filament assembly(GO:0071688) |
| 0.1 | 0.4 | GO:0014034 | neural crest cell fate commitment(GO:0014034) |
| 0.1 | 0.5 | GO:2000196 | positive regulation of female gonad development(GO:2000196) negative regulation of binding of sperm to zona pellucida(GO:2000360) |
| 0.1 | 0.5 | GO:0032474 | otolith morphogenesis(GO:0032474) |
| 0.1 | 1.4 | GO:0097398 | response to interleukin-17(GO:0097396) cellular response to interleukin-17(GO:0097398) |
| 0.1 | 0.9 | GO:0002933 | lipid hydroxylation(GO:0002933) |
| 0.1 | 0.5 | GO:0001994 | norepinephrine-epinephrine vasoconstriction involved in regulation of systemic arterial blood pressure(GO:0001994) |
| 0.1 | 0.5 | GO:0021913 | regulation of transcription from RNA polymerase II promoter involved in ventral spinal cord interneuron specification(GO:0021913) |
| 0.1 | 0.4 | GO:0003099 | positive regulation of the force of heart contraction by chemical signal(GO:0003099) regulation of prostaglandin-endoperoxide synthase activity(GO:0060584) positive regulation of prostaglandin-endoperoxide synthase activity(GO:0060585) |
| 0.1 | 0.3 | GO:0003032 | detection of oxygen(GO:0003032) |
| 0.1 | 1.1 | GO:1901341 | activation of store-operated calcium channel activity(GO:0032237) positive regulation of store-operated calcium channel activity(GO:1901341) |
| 0.1 | 4.2 | GO:0031581 | hemidesmosome assembly(GO:0031581) |
| 0.1 | 0.8 | GO:0051012 | microtubule sliding(GO:0051012) |
| 0.1 | 0.4 | GO:2000490 | negative regulation of hepatic stellate cell activation(GO:2000490) |
| 0.1 | 1.0 | GO:0046726 | positive regulation by virus of viral protein levels in host cell(GO:0046726) |
| 0.1 | 0.7 | GO:1901339 | regulation of store-operated calcium channel activity(GO:1901339) |
| 0.1 | 0.5 | GO:0060174 | limb bud formation(GO:0060174) |
| 0.1 | 0.3 | GO:0031587 | positive regulation of inositol 1,4,5-trisphosphate-sensitive calcium-release channel activity(GO:0031587) |
| 0.1 | 1.5 | GO:0070327 | thyroid hormone transport(GO:0070327) |
| 0.1 | 2.8 | GO:0051823 | regulation of synapse structural plasticity(GO:0051823) |
| 0.1 | 0.5 | GO:0061056 | sclerotome development(GO:0061056) |
| 0.1 | 1.3 | GO:0015705 | iodide transport(GO:0015705) |
| 0.1 | 0.7 | GO:0003221 | right ventricular cardiac muscle tissue morphogenesis(GO:0003221) |
| 0.1 | 2.1 | GO:0006703 | estrogen biosynthetic process(GO:0006703) |
| 0.1 | 3.4 | GO:0055003 | cardiac myofibril assembly(GO:0055003) |
| 0.1 | 0.3 | GO:0060957 | endocardial cell fate commitment(GO:0060957) endocardial cushion cell fate commitment(GO:0061445) |
| 0.1 | 0.7 | GO:0045200 | establishment or maintenance of neuroblast polarity(GO:0045196) establishment of neuroblast polarity(GO:0045200) |
| 0.1 | 1.4 | GO:0071372 | cellular response to follicle-stimulating hormone stimulus(GO:0071372) |
| 0.1 | 1.2 | GO:2001288 | positive regulation of caveolin-mediated endocytosis(GO:2001288) |
| 0.1 | 1.1 | GO:0042738 | exogenous drug catabolic process(GO:0042738) |
| 0.1 | 0.7 | GO:0003025 | regulation of systemic arterial blood pressure by baroreceptor feedback(GO:0003025) |
| 0.1 | 1.5 | GO:0045075 | interleukin-12 biosynthetic process(GO:0042090) regulation of interleukin-12 biosynthetic process(GO:0045075) |
| 0.1 | 0.7 | GO:0019236 | response to pheromone(GO:0019236) |
| 0.1 | 0.9 | GO:0010756 | positive regulation of plasminogen activation(GO:0010756) |
| 0.1 | 9.4 | GO:0043268 | positive regulation of potassium ion transport(GO:0043268) |
| 0.1 | 0.5 | GO:1904219 | regulation of CDP-diacylglycerol-serine O-phosphatidyltransferase activity(GO:1904217) positive regulation of CDP-diacylglycerol-serine O-phosphatidyltransferase activity(GO:1904219) positive regulation of serine C-palmitoyltransferase activity(GO:1904222) |
| 0.1 | 0.4 | GO:0072365 | regulation of cellular ketone metabolic process by negative regulation of transcription from RNA polymerase II promoter(GO:0072365) |
| 0.1 | 0.7 | GO:0033353 | S-adenosylmethionine cycle(GO:0033353) |
| 0.1 | 0.3 | GO:0016259 | selenocysteine metabolic process(GO:0016259) |
| 0.1 | 0.5 | GO:2001248 | nitrogen catabolite regulation of transcription from RNA polymerase II promoter(GO:0001079) nitrogen catabolite activation of transcription from RNA polymerase II promoter(GO:0001080) regulation of urea metabolic process(GO:0034255) intracellular bile acid receptor signaling pathway(GO:0038185) interleukin-17 secretion(GO:0072615) nitrogen catabolite regulation of transcription(GO:0090293) nitrogen catabolite activation of transcription(GO:0090294) regulation of nitrogen cycle metabolic process(GO:1903314) positive regulation of glutamate metabolic process(GO:2000213) regulation of ammonia assimilation cycle(GO:2001248) positive regulation of ammonia assimilation cycle(GO:2001250) |
| 0.1 | 0.9 | GO:0048664 | neuron fate determination(GO:0048664) |
| 0.1 | 0.4 | GO:1902896 | terminal web assembly(GO:1902896) |
| 0.1 | 0.5 | GO:0044334 | canonical Wnt signaling pathway involved in positive regulation of epithelial to mesenchymal transition(GO:0044334) |
| 0.1 | 0.4 | GO:0072180 | mesonephric duct morphogenesis(GO:0072180) |
| 0.1 | 0.9 | GO:0045329 | carnitine biosynthetic process(GO:0045329) |
| 0.1 | 0.4 | GO:0002309 | T cell proliferation involved in immune response(GO:0002309) |
| 0.1 | 1.5 | GO:0032060 | bleb assembly(GO:0032060) |
| 0.1 | 1.2 | GO:0044341 | sodium-dependent phosphate transport(GO:0044341) |
| 0.1 | 2.9 | GO:0042572 | retinol metabolic process(GO:0042572) |
| 0.1 | 0.4 | GO:0060414 | aorta smooth muscle tissue morphogenesis(GO:0060414) |
| 0.1 | 1.6 | GO:1900745 | positive regulation of p38MAPK cascade(GO:1900745) |
| 0.1 | 0.6 | GO:0061624 | fructose catabolic process(GO:0006001) fructose catabolic process to hydroxyacetone phosphate and glyceraldehyde-3-phosphate(GO:0061624) |
| 0.1 | 0.8 | GO:0071376 | response to corticotropin-releasing hormone(GO:0043435) cellular response to corticotropin-releasing hormone stimulus(GO:0071376) |
| 0.1 | 1.4 | GO:0016559 | peroxisome fission(GO:0016559) |
| 0.1 | 0.4 | GO:2000189 | positive regulation of cholesterol homeostasis(GO:2000189) |
| 0.1 | 0.4 | GO:0034164 | negative regulation of toll-like receptor 9 signaling pathway(GO:0034164) |
| 0.1 | 0.4 | GO:0032417 | positive regulation of sodium:proton antiporter activity(GO:0032417) negative regulation of calcineurin-NFAT signaling cascade(GO:0070885) |
| 0.1 | 0.3 | GO:0072161 | mesenchymal cell differentiation involved in kidney development(GO:0072161) mesenchymal cell differentiation involved in renal system development(GO:2001012) |
| 0.1 | 3.5 | GO:0033275 | muscle filament sliding(GO:0030049) actin-myosin filament sliding(GO:0033275) |
| 0.1 | 0.2 | GO:0005988 | lactose metabolic process(GO:0005988) lactose biosynthetic process(GO:0005989) |
| 0.1 | 0.4 | GO:0018032 | protein amidation(GO:0018032) |
| 0.1 | 0.2 | GO:0098923 | cytoskeletal matrix organization at active zone(GO:0048789) neurexin clustering involved in presynaptic membrane assembly(GO:0097115) retrograde trans-synaptic signaling by soluble gas(GO:0098923) retrograde trans-synaptic signaling by trans-synaptic protein complex(GO:0098942) trans-synaptic signaling by soluble gas(GO:0099543) |
| 0.1 | 0.4 | GO:0033504 | floor plate development(GO:0033504) |
| 0.1 | 0.3 | GO:1900042 | positive regulation of interleukin-2 secretion(GO:1900042) |
| 0.1 | 0.6 | GO:2000795 | negative regulation of epithelial cell proliferation involved in lung morphogenesis(GO:2000795) |
| 0.1 | 0.5 | GO:0003344 | pericardium morphogenesis(GO:0003344) |
| 0.1 | 0.9 | GO:0043587 | tongue morphogenesis(GO:0043587) |
| 0.1 | 1.2 | GO:0006704 | glucocorticoid biosynthetic process(GO:0006704) |
| 0.0 | 1.0 | GO:0034501 | protein localization to kinetochore(GO:0034501) |
| 0.0 | 0.4 | GO:1900748 | positive regulation of vascular endothelial growth factor signaling pathway(GO:1900748) |
| 0.0 | 0.6 | GO:0034638 | phosphatidylcholine catabolic process(GO:0034638) |
| 0.0 | 0.6 | GO:0006384 | transcription initiation from RNA polymerase III promoter(GO:0006384) |
| 0.0 | 1.1 | GO:0060134 | prepulse inhibition(GO:0060134) |
| 0.0 | 0.7 | GO:0046951 | ketone body biosynthetic process(GO:0046951) |
| 0.0 | 0.5 | GO:0008063 | Toll signaling pathway(GO:0008063) |
| 0.0 | 2.9 | GO:0010862 | positive regulation of pathway-restricted SMAD protein phosphorylation(GO:0010862) |
| 0.0 | 0.8 | GO:0001867 | complement activation, lectin pathway(GO:0001867) |
| 0.0 | 2.0 | GO:0005980 | glycogen catabolic process(GO:0005980) |
| 0.0 | 0.4 | GO:0072553 | terminal button organization(GO:0072553) |
| 0.0 | 1.0 | GO:0090026 | positive regulation of monocyte chemotaxis(GO:0090026) |
| 0.0 | 0.6 | GO:0072498 | embryonic skeletal joint development(GO:0072498) |
| 0.0 | 0.4 | GO:0099566 | regulation of postsynaptic cytosolic calcium ion concentration(GO:0099566) |
| 0.0 | 0.7 | GO:0051546 | keratinocyte migration(GO:0051546) |
| 0.0 | 0.9 | GO:0008090 | retrograde axonal transport(GO:0008090) |
| 0.0 | 0.3 | GO:2001205 | negative regulation of osteoclast development(GO:2001205) |
| 0.0 | 0.5 | GO:2000427 | positive regulation of apoptotic cell clearance(GO:2000427) |
| 0.0 | 0.6 | GO:0010579 | regulation of adenylate cyclase activity involved in G-protein coupled receptor signaling pathway(GO:0010578) positive regulation of adenylate cyclase activity involved in G-protein coupled receptor signaling pathway(GO:0010579) |
| 0.0 | 0.3 | GO:0050916 | sensory perception of sweet taste(GO:0050916) |
| 0.0 | 0.4 | GO:0008050 | female courtship behavior(GO:0008050) |
| 0.0 | 2.0 | GO:2000144 | positive regulation of DNA-templated transcription, initiation(GO:2000144) |
| 0.0 | 0.4 | GO:0007549 | dosage compensation(GO:0007549) dosage compensation by inactivation of X chromosome(GO:0009048) |
| 0.0 | 0.7 | GO:0060307 | regulation of ventricular cardiac muscle cell membrane repolarization(GO:0060307) |
| 0.0 | 0.3 | GO:1902231 | positive regulation of intrinsic apoptotic signaling pathway in response to DNA damage(GO:1902231) |
| 0.0 | 0.8 | GO:0034384 | high-density lipoprotein particle clearance(GO:0034384) |
| 0.0 | 0.4 | GO:0006013 | mannose metabolic process(GO:0006013) |
| 0.0 | 2.4 | GO:0030212 | hyaluronan metabolic process(GO:0030212) |
| 0.0 | 7.4 | GO:0048706 | embryonic skeletal system development(GO:0048706) |
| 0.0 | 0.5 | GO:0032780 | negative regulation of ATPase activity(GO:0032780) |
| 0.0 | 0.6 | GO:0070389 | chaperone cofactor-dependent protein refolding(GO:0070389) |
| 0.0 | 0.8 | GO:0006089 | lactate metabolic process(GO:0006089) |
| 0.0 | 0.7 | GO:1904261 | regulation of basement membrane assembly involved in embryonic body morphogenesis(GO:1904259) positive regulation of basement membrane assembly involved in embryonic body morphogenesis(GO:1904261) basement membrane assembly involved in embryonic body morphogenesis(GO:2001197) |
| 0.0 | 1.0 | GO:0010801 | negative regulation of peptidyl-threonine phosphorylation(GO:0010801) |
| 0.0 | 0.4 | GO:0006621 | protein retention in ER lumen(GO:0006621) |
| 0.0 | 1.6 | GO:0010107 | potassium ion import(GO:0010107) |
| 0.0 | 0.1 | GO:0061386 | closure of optic fissure(GO:0061386) |
| 0.0 | 0.2 | GO:1903527 | positive regulation of membrane tubulation(GO:1903527) |
| 0.0 | 1.9 | GO:0007520 | myoblast fusion(GO:0007520) |
| 0.0 | 0.1 | GO:0036292 | DNA rewinding(GO:0036292) |
| 0.0 | 0.2 | GO:0046440 | L-lysine catabolic process to acetyl-CoA(GO:0019474) L-lysine catabolic process(GO:0019477) L-lysine metabolic process(GO:0046440) |
| 0.0 | 2.1 | GO:0046949 | fatty-acyl-CoA biosynthetic process(GO:0046949) |
| 0.0 | 0.2 | GO:0051792 | medium-chain fatty acid biosynthetic process(GO:0051792) |
| 0.0 | 0.5 | GO:0021842 | directional guidance of interneurons involved in migration from the subpallium to the cortex(GO:0021840) chemorepulsion involved in interneuron migration from the subpallium to the cortex(GO:0021842) ERBB3 signaling pathway(GO:0038129) |
| 0.0 | 3.1 | GO:0016266 | O-glycan processing(GO:0016266) |
| 0.0 | 0.3 | GO:0010571 | positive regulation of nuclear cell cycle DNA replication(GO:0010571) |
| 0.0 | 1.7 | GO:0042733 | embryonic digit morphogenesis(GO:0042733) |
| 0.0 | 1.3 | GO:0003298 | physiological muscle hypertrophy(GO:0003298) physiological cardiac muscle hypertrophy(GO:0003301) cell growth involved in cardiac muscle cell development(GO:0061049) |
| 0.0 | 0.4 | GO:1905232 | cellular response to L-glutamate(GO:1905232) |
| 0.0 | 1.1 | GO:0016338 | calcium-independent cell-cell adhesion via plasma membrane cell-adhesion molecules(GO:0016338) |
| 0.0 | 0.5 | GO:0030046 | parallel actin filament bundle assembly(GO:0030046) |
| 0.0 | 0.1 | GO:0046532 | regulation of photoreceptor cell differentiation(GO:0046532) |
| 0.0 | 0.7 | GO:0060512 | prostate gland morphogenesis(GO:0060512) |
| 0.0 | 0.4 | GO:0060287 | epithelial cilium movement involved in determination of left/right asymmetry(GO:0060287) |
| 0.0 | 0.1 | GO:0046716 | muscle cell cellular homeostasis(GO:0046716) |
| 0.0 | 0.2 | GO:0060012 | synaptic transmission, glycinergic(GO:0060012) |
| 0.0 | 2.3 | GO:0000381 | regulation of alternative mRNA splicing, via spliceosome(GO:0000381) |
| 0.0 | 0.4 | GO:0015937 | coenzyme A biosynthetic process(GO:0015937) |
| 0.0 | 0.2 | GO:0043589 | skin morphogenesis(GO:0043589) |
| 0.0 | 0.8 | GO:0043968 | histone H2A acetylation(GO:0043968) |
| 0.0 | 0.2 | GO:0043402 | glucocorticoid mediated signaling pathway(GO:0043402) |
| 0.0 | 0.4 | GO:0048733 | sebaceous gland development(GO:0048733) |
| 0.0 | 0.3 | GO:0030321 | transepithelial chloride transport(GO:0030321) |
| 0.0 | 0.4 | GO:1904424 | regulation of GTP binding(GO:1904424) |
| 0.0 | 0.4 | GO:0019532 | oxalate transport(GO:0019532) |
| 0.0 | 0.2 | GO:0018344 | protein geranylgeranylation(GO:0018344) |
| 0.0 | 0.3 | GO:0070934 | CRD-mediated mRNA stabilization(GO:0070934) |
| 0.0 | 0.3 | GO:0007171 | activation of transmembrane receptor protein tyrosine kinase activity(GO:0007171) |
| 0.0 | 0.8 | GO:0034755 | iron ion transmembrane transport(GO:0034755) |
| 0.0 | 0.4 | GO:0072189 | ureter development(GO:0072189) |
| 0.0 | 0.7 | GO:1900363 | regulation of mRNA polyadenylation(GO:1900363) |
| 0.0 | 0.3 | GO:0010832 | negative regulation of myotube differentiation(GO:0010832) |
| 0.0 | 0.6 | GO:0010039 | response to iron ion(GO:0010039) |
| 0.0 | 0.4 | GO:0045176 | apical protein localization(GO:0045176) |
| 0.0 | 0.3 | GO:0021794 | thalamus development(GO:0021794) |
| 0.0 | 0.1 | GO:0038016 | insulin receptor internalization(GO:0038016) |
| 0.0 | 0.0 | GO:0043932 | ossification involved in bone remodeling(GO:0043932) |
| 0.0 | 0.2 | GO:0031119 | tRNA pseudouridine synthesis(GO:0031119) |
| 0.0 | 2.7 | GO:0055001 | muscle cell development(GO:0055001) |
| 0.0 | 8.2 | GO:0006936 | muscle contraction(GO:0006936) |
| 0.0 | 0.6 | GO:0030513 | positive regulation of BMP signaling pathway(GO:0030513) |
| 0.0 | 0.1 | GO:0019442 | tryptophan catabolic process to acetyl-CoA(GO:0019442) |
| 0.0 | 0.6 | GO:0051931 | regulation of sensory perception of pain(GO:0051930) regulation of sensory perception(GO:0051931) |
| 0.0 | 0.1 | GO:0071043 | CUT catabolic process(GO:0071034) CUT metabolic process(GO:0071043) |
| 0.0 | 0.4 | GO:0033173 | calcineurin-NFAT signaling cascade(GO:0033173) |
| 0.0 | 0.2 | GO:1903025 | regulation of RNA polymerase II regulatory region sequence-specific DNA binding(GO:1903025) |
| 0.0 | 1.6 | GO:0048207 | vesicle targeting, rough ER to cis-Golgi(GO:0048207) COPII vesicle coating(GO:0048208) |
| 0.0 | 0.1 | GO:0090190 | positive regulation of branching involved in ureteric bud morphogenesis(GO:0090190) |
| 0.0 | 0.4 | GO:0000469 | cleavage involved in rRNA processing(GO:0000469) |
| 0.0 | 0.1 | GO:0003222 | ventricular trabecula myocardium morphogenesis(GO:0003222) |
| 0.0 | 0.3 | GO:0001502 | cartilage condensation(GO:0001502) |
| 0.0 | 0.3 | GO:0044126 | regulation of growth of symbiont in host(GO:0044126) |
| 0.0 | 1.5 | GO:0003333 | amino acid transmembrane transport(GO:0003333) |
| 0.0 | 0.3 | GO:2000811 | negative regulation of anoikis(GO:2000811) |
| 0.0 | 0.4 | GO:0086010 | membrane depolarization during action potential(GO:0086010) |
| 0.0 | 0.6 | GO:0050982 | detection of mechanical stimulus(GO:0050982) |
| 0.0 | 0.1 | GO:1902306 | negative regulation of sodium ion transmembrane transport(GO:1902306) |
| 0.0 | 0.7 | GO:0006198 | cAMP catabolic process(GO:0006198) |
| 0.0 | 0.3 | GO:0007016 | cytoskeletal anchoring at plasma membrane(GO:0007016) |
| 0.0 | 0.2 | GO:0010457 | centriole-centriole cohesion(GO:0010457) |
| 0.0 | 0.1 | GO:1902530 | regulation of protein linear polyubiquitination(GO:1902528) positive regulation of protein linear polyubiquitination(GO:1902530) |
| 0.0 | 0.3 | GO:0033169 | histone H3-K9 demethylation(GO:0033169) |
| 0.0 | 0.2 | GO:1904321 | response to forskolin(GO:1904321) cellular response to forskolin(GO:1904322) |
| 0.0 | 0.4 | GO:0090005 | negative regulation of establishment of protein localization to plasma membrane(GO:0090005) |
| 0.0 | 0.1 | GO:0002826 | negative regulation of T-helper 1 type immune response(GO:0002826) interleukin-33-mediated signaling pathway(GO:0038172) |
| 0.0 | 0.7 | GO:0070423 | nucleotide-binding oligomerization domain containing signaling pathway(GO:0070423) |
Gene overrepresentation in cellular component category:
| Log-likelihood per target | Total log-likelihood | Term | Description |
|---|---|---|---|
| 1.7 | 17.0 | GO:0005826 | actomyosin contractile ring(GO:0005826) |
| 1.1 | 15.7 | GO:0033018 | sarcoplasmic reticulum lumen(GO:0033018) |
| 0.9 | 4.6 | GO:0097059 | CNTFR-CLCF1 complex(GO:0097059) |
| 0.7 | 17.8 | GO:0032982 | myosin filament(GO:0032982) |
| 0.6 | 1.8 | GO:0070195 | growth hormone receptor complex(GO:0070195) |
| 0.4 | 3.3 | GO:0016012 | sarcoglycan complex(GO:0016012) |
| 0.3 | 0.9 | GO:0070939 | Dsl1p complex(GO:0070939) |
| 0.2 | 3.4 | GO:0097512 | cardiac myofibril(GO:0097512) |
| 0.2 | 2.0 | GO:0005964 | phosphorylase kinase complex(GO:0005964) |
| 0.2 | 3.1 | GO:0005859 | muscle myosin complex(GO:0005859) |
| 0.2 | 3.9 | GO:0016281 | eukaryotic translation initiation factor 4F complex(GO:0016281) |
| 0.1 | 3.2 | GO:0031089 | platelet dense granule lumen(GO:0031089) |
| 0.1 | 0.6 | GO:0005602 | complement component C1 complex(GO:0005602) |
| 0.1 | 1.6 | GO:0031466 | Cul5-RING ubiquitin ligase complex(GO:0031466) |
| 0.1 | 1.3 | GO:0005610 | laminin-5 complex(GO:0005610) |
| 0.1 | 3.2 | GO:1990454 | L-type voltage-gated calcium channel complex(GO:1990454) |
| 0.1 | 7.1 | GO:0031430 | M band(GO:0031430) |
| 0.1 | 1.4 | GO:0071144 | SMAD2-SMAD3 protein complex(GO:0071144) |
| 0.1 | 0.9 | GO:0031673 | H zone(GO:0031673) |
| 0.1 | 0.5 | GO:0001405 | presequence translocase-associated import motor(GO:0001405) |
| 0.1 | 0.3 | GO:0070931 | Golgi-associated vesicle lumen(GO:0070931) |
| 0.1 | 0.5 | GO:0002081 | outer acrosomal membrane(GO:0002081) |
| 0.1 | 0.4 | GO:0045160 | myosin I complex(GO:0045160) |
| 0.1 | 1.1 | GO:0032009 | early phagosome(GO:0032009) |
| 0.1 | 0.2 | GO:0036457 | keratohyalin granule(GO:0036457) |
| 0.1 | 1.2 | GO:0097470 | ribbon synapse(GO:0097470) |
| 0.1 | 1.0 | GO:0031464 | Cul4A-RING E3 ubiquitin ligase complex(GO:0031464) |
| 0.1 | 0.2 | GO:0005584 | collagen type I trimer(GO:0005584) |
| 0.1 | 1.1 | GO:0032541 | cortical endoplasmic reticulum(GO:0032541) |
| 0.1 | 0.4 | GO:0044308 | axonal spine(GO:0044308) |
| 0.1 | 1.4 | GO:0071438 | invadopodium membrane(GO:0071438) |
| 0.1 | 0.4 | GO:1990357 | terminal web(GO:1990357) |
| 0.1 | 0.8 | GO:0005583 | fibrillar collagen trimer(GO:0005583) banded collagen fibril(GO:0098643) |
| 0.1 | 0.2 | GO:1990696 | stereocilia ankle link(GO:0002141) USH2 complex(GO:1990696) |
| 0.1 | 1.3 | GO:0032591 | dendritic spine membrane(GO:0032591) |
| 0.1 | 4.8 | GO:0045095 | keratin filament(GO:0045095) |
| 0.0 | 0.3 | GO:0048179 | activin receptor complex(GO:0048179) |
| 0.0 | 0.6 | GO:0005577 | fibrinogen complex(GO:0005577) |
| 0.0 | 0.5 | GO:0072669 | tRNA-splicing ligase complex(GO:0072669) |
| 0.0 | 1.2 | GO:0033643 | host cell part(GO:0033643) |
| 0.0 | 0.2 | GO:0005899 | insulin receptor complex(GO:0005899) |
| 0.0 | 1.3 | GO:0005666 | DNA-directed RNA polymerase III complex(GO:0005666) |
| 0.0 | 0.1 | GO:0043511 | inhibin complex(GO:0043511) inhibin A complex(GO:0043512) |
| 0.0 | 6.1 | GO:0005796 | Golgi lumen(GO:0005796) |
| 0.0 | 0.7 | GO:0005862 | muscle thin filament tropomyosin(GO:0005862) |
| 0.0 | 0.6 | GO:0002116 | semaphorin receptor complex(GO:0002116) |
| 0.0 | 0.2 | GO:0005968 | Rab-protein geranylgeranyltransferase complex(GO:0005968) |
| 0.0 | 2.8 | GO:0042645 | nucleoid(GO:0009295) mitochondrial nucleoid(GO:0042645) |
| 0.0 | 0.3 | GO:1990761 | growth cone lamellipodium(GO:1990761) |
| 0.0 | 4.5 | GO:0031093 | platelet alpha granule lumen(GO:0031093) |
| 0.0 | 2.6 | GO:0033017 | sarcoplasmic reticulum membrane(GO:0033017) |
| 0.0 | 0.5 | GO:0070369 | beta-catenin-TCF7L2 complex(GO:0070369) |
| 0.0 | 1.0 | GO:0016327 | apicolateral plasma membrane(GO:0016327) |
| 0.0 | 0.3 | GO:0030896 | checkpoint clamp complex(GO:0030896) |
| 0.0 | 0.3 | GO:0097452 | GAIT complex(GO:0097452) |
| 0.0 | 0.7 | GO:0045180 | basal cortex(GO:0045180) |
| 0.0 | 1.5 | GO:0043218 | compact myelin(GO:0043218) |
| 0.0 | 1.0 | GO:0001518 | voltage-gated sodium channel complex(GO:0001518) |
| 0.0 | 1.3 | GO:0034364 | high-density lipoprotein particle(GO:0034364) |
| 0.0 | 1.0 | GO:0016010 | dystrophin-associated glycoprotein complex(GO:0016010) glycoprotein complex(GO:0090665) |
| 0.0 | 0.2 | GO:0071595 | Nem1-Spo7 phosphatase complex(GO:0071595) |
| 0.0 | 1.3 | GO:0034451 | centriolar satellite(GO:0034451) |
| 0.0 | 0.5 | GO:0032426 | stereocilium tip(GO:0032426) |
| 0.0 | 0.1 | GO:0016035 | zeta DNA polymerase complex(GO:0016035) |
| 0.0 | 2.6 | GO:0034707 | chloride channel complex(GO:0034707) |
| 0.0 | 0.8 | GO:0005614 | interstitial matrix(GO:0005614) |
| 0.0 | 0.7 | GO:0031231 | integral component of peroxisomal membrane(GO:0005779) intrinsic component of peroxisomal membrane(GO:0031231) |
| 0.0 | 0.8 | GO:0035267 | NuA4 histone acetyltransferase complex(GO:0035267) H4/H2A histone acetyltransferase complex(GO:0043189) H4 histone acetyltransferase complex(GO:1902562) |
| 0.0 | 0.5 | GO:0005662 | DNA replication factor A complex(GO:0005662) |
| 0.0 | 0.4 | GO:0030056 | hemidesmosome(GO:0030056) |
| 0.0 | 0.1 | GO:0031462 | Cul2-RING ubiquitin ligase complex(GO:0031462) |
| 0.0 | 6.3 | GO:0005788 | endoplasmic reticulum lumen(GO:0005788) |
| 0.0 | 3.2 | GO:0042579 | peroxisome(GO:0005777) microbody(GO:0042579) |
| 0.0 | 0.2 | GO:0071986 | Ragulator complex(GO:0071986) |
| 0.0 | 0.5 | GO:0005685 | U1 snRNP(GO:0005685) |
| 0.0 | 0.4 | GO:0098563 | integral component of synaptic vesicle membrane(GO:0030285) intrinsic component of synaptic vesicle membrane(GO:0098563) |
| 0.0 | 1.7 | GO:0005746 | mitochondrial respiratory chain(GO:0005746) |
| 0.0 | 1.7 | GO:0044216 | other organism(GO:0044215) other organism cell(GO:0044216) other organism part(GO:0044217) |
| 0.0 | 0.2 | GO:0005677 | chromatin silencing complex(GO:0005677) |
| 0.0 | 1.3 | GO:0005811 | lipid particle(GO:0005811) |
| 0.0 | 0.0 | GO:0044614 | nuclear pore cytoplasmic filaments(GO:0044614) |
| 0.0 | 0.7 | GO:0001533 | cornified envelope(GO:0001533) |
Gene overrepresentation in molecular function category:
| Log-likelihood per target | Total log-likelihood | Term | Description |
|---|---|---|---|
| 1.5 | 5.9 | GO:0047023 | androsterone dehydrogenase activity(GO:0047023) |
| 0.6 | 1.9 | GO:0004421 | hydroxymethylglutaryl-CoA synthase activity(GO:0004421) |
| 0.6 | 5.9 | GO:0004687 | myosin light chain kinase activity(GO:0004687) |
| 0.6 | 1.7 | GO:0016652 | NAD(P)+ transhydrogenase activity(GO:0008746) oxidoreductase activity, acting on NAD(P)H, NAD(P) as acceptor(GO:0016652) |
| 0.5 | 2.1 | GO:0047006 | 17-alpha,20-alpha-dihydroxypregn-4-en-3-one dehydrogenase activity(GO:0047006) |
| 0.5 | 2.8 | GO:0016509 | long-chain-3-hydroxyacyl-CoA dehydrogenase activity(GO:0016509) |
| 0.4 | 4.6 | GO:0004897 | ciliary neurotrophic factor receptor activity(GO:0004897) |
| 0.4 | 1.2 | GO:0086039 | lutropin-choriogonadotropic hormone receptor binding(GO:0031775) calcium-transporting ATPase activity involved in regulation of cardiac muscle cell membrane potential(GO:0086039) |
| 0.4 | 1.2 | GO:0003845 | 11-beta-hydroxysteroid dehydrogenase [NAD(P)] activity(GO:0003845) |
| 0.4 | 1.2 | GO:0001596 | angiotensin type I receptor activity(GO:0001596) |
| 0.4 | 20.4 | GO:0000146 | microfilament motor activity(GO:0000146) |
| 0.4 | 1.8 | GO:0047374 | methylumbelliferyl-acetate deacetylase activity(GO:0047374) |
| 0.3 | 1.0 | GO:0015403 | thiamine uptake transmembrane transporter activity(GO:0015403) |
| 0.3 | 1.9 | GO:0008422 | beta-glucosidase activity(GO:0008422) |
| 0.3 | 2.5 | GO:0004797 | deoxycytidine kinase activity(GO:0004137) thymidine kinase activity(GO:0004797) |
| 0.3 | 0.9 | GO:0004069 | L-aspartate:2-oxoglutarate aminotransferase activity(GO:0004069) L-phenylalanine:2-oxoglutarate aminotransferase activity(GO:0080130) |
| 0.3 | 2.1 | GO:0004768 | stearoyl-CoA 9-desaturase activity(GO:0004768) acyl-CoA desaturase activity(GO:0016215) |
| 0.3 | 0.9 | GO:0036327 | VEGF-A-activated receptor activity(GO:0036326) VEGF-B-activated receptor activity(GO:0036327) placental growth factor-activated receptor activity(GO:0036332) |
| 0.3 | 0.3 | GO:1904713 | beta-catenin destruction complex binding(GO:1904713) |
| 0.3 | 1.6 | GO:0043546 | molybdopterin cofactor binding(GO:0043546) |
| 0.3 | 4.7 | GO:0004745 | retinol dehydrogenase activity(GO:0004745) |
| 0.2 | 0.7 | GO:0002094 | polyprenyltransferase activity(GO:0002094) |
| 0.2 | 0.9 | GO:0008336 | gamma-butyrobetaine dioxygenase activity(GO:0008336) |
| 0.2 | 5.1 | GO:0032036 | myosin heavy chain binding(GO:0032036) |
| 0.2 | 5.9 | GO:0031432 | titin binding(GO:0031432) |
| 0.2 | 2.5 | GO:0004022 | alcohol dehydrogenase (NAD) activity(GO:0004022) |
| 0.2 | 2.0 | GO:0005280 | hydrogen:amino acid symporter activity(GO:0005280) |
| 0.2 | 0.6 | GO:0030305 | heparanase activity(GO:0030305) |
| 0.2 | 2.0 | GO:0004689 | phosphorylase kinase activity(GO:0004689) |
| 0.2 | 1.4 | GO:0031962 | mineralocorticoid receptor binding(GO:0031962) |
| 0.2 | 0.7 | GO:0005459 | UDP-galactose transmembrane transporter activity(GO:0005459) |
| 0.2 | 0.6 | GO:0061609 | fructose-1-phosphate aldolase activity(GO:0061609) |
| 0.1 | 3.1 | GO:0008392 | arachidonic acid monooxygenase activity(GO:0008391) arachidonic acid epoxygenase activity(GO:0008392) |
| 0.1 | 1.3 | GO:0015319 | sodium:inorganic phosphate symporter activity(GO:0015319) |
| 0.1 | 0.4 | GO:0060422 | peptidyl-dipeptidase inhibitor activity(GO:0060422) |
| 0.1 | 2.1 | GO:0015501 | glutamate:sodium symporter activity(GO:0015501) |
| 0.1 | 0.7 | GO:0005173 | stem cell factor receptor binding(GO:0005173) |
| 0.1 | 4.4 | GO:0048018 | receptor agonist activity(GO:0048018) |
| 0.1 | 0.8 | GO:0031708 | endothelin B receptor binding(GO:0031708) |
| 0.1 | 1.1 | GO:0030368 | interleukin-17 receptor activity(GO:0030368) |
| 0.1 | 0.5 | GO:0004937 | alpha1-adrenergic receptor activity(GO:0004937) |
| 0.1 | 4.0 | GO:0008190 | eukaryotic initiation factor 4E binding(GO:0008190) |
| 0.1 | 0.7 | GO:0035614 | snRNA stem-loop binding(GO:0035614) |
| 0.1 | 4.5 | GO:0004181 | metallocarboxypeptidase activity(GO:0004181) |
| 0.1 | 0.4 | GO:0047888 | fatty acid peroxidase activity(GO:0047888) |
| 0.1 | 0.5 | GO:0042015 | interleukin-20 binding(GO:0042015) |
| 0.1 | 0.8 | GO:0004046 | aminoacylase activity(GO:0004046) |
| 0.1 | 2.1 | GO:0070324 | thyroid hormone binding(GO:0070324) |
| 0.1 | 1.0 | GO:0050682 | AF-2 domain binding(GO:0050682) |
| 0.1 | 0.3 | GO:0070984 | SET domain binding(GO:0070984) |
| 0.1 | 0.9 | GO:0019237 | centromeric DNA binding(GO:0019237) |
| 0.1 | 0.7 | GO:0016802 | adenosylhomocysteinase activity(GO:0004013) trialkylsulfonium hydrolase activity(GO:0016802) |
| 0.1 | 2.2 | GO:0015643 | toxic substance binding(GO:0015643) |
| 0.1 | 0.5 | GO:0032190 | acrosin binding(GO:0032190) |
| 0.1 | 3.3 | GO:0008331 | high voltage-gated calcium channel activity(GO:0008331) |
| 0.1 | 2.4 | GO:0001087 | transcription factor activity, sequence-specific DNA binding, RNA polymerase recruiting(GO:0001011) transcription factor activity, TFIIB-class binding(GO:0001087) |
| 0.1 | 0.5 | GO:1902122 | chenodeoxycholic acid binding(GO:1902122) |
| 0.1 | 0.5 | GO:0008508 | bile acid:sodium symporter activity(GO:0008508) |
| 0.1 | 0.8 | GO:0004459 | L-lactate dehydrogenase activity(GO:0004459) |
| 0.1 | 0.3 | GO:0008798 | beta-aspartyl-peptidase activity(GO:0008798) |
| 0.1 | 2.0 | GO:0008395 | steroid hydroxylase activity(GO:0008395) |
| 0.1 | 3.5 | GO:0001972 | retinoic acid binding(GO:0001972) |
| 0.1 | 0.4 | GO:0004809 | tRNA (guanine-N2-)-methyltransferase activity(GO:0004809) |
| 0.1 | 2.2 | GO:0005523 | tropomyosin binding(GO:0005523) |
| 0.1 | 1.2 | GO:0019871 | sodium channel inhibitor activity(GO:0019871) |
| 0.1 | 0.7 | GO:0086006 | voltage-gated sodium channel activity involved in cardiac muscle cell action potential(GO:0086006) |
| 0.1 | 12.1 | GO:0003774 | motor activity(GO:0003774) |
| 0.1 | 1.6 | GO:0015467 | G-protein activated inward rectifier potassium channel activity(GO:0015467) |
| 0.1 | 0.3 | GO:0016520 | growth hormone-releasing hormone receptor activity(GO:0016520) |
| 0.1 | 1.8 | GO:0004653 | polypeptide N-acetylgalactosaminyltransferase activity(GO:0004653) |
| 0.1 | 1.1 | GO:0048407 | platelet-derived growth factor binding(GO:0048407) |
| 0.1 | 0.4 | GO:0004598 | peptidylglycine monooxygenase activity(GO:0004504) peptidylamidoglycolate lyase activity(GO:0004598) |
| 0.1 | 1.8 | GO:0097493 | structural molecule activity conferring elasticity(GO:0097493) |
| 0.1 | 1.2 | GO:0008140 | cAMP response element binding protein binding(GO:0008140) |
| 0.1 | 0.2 | GO:0004615 | phosphomannomutase activity(GO:0004615) |
| 0.1 | 0.3 | GO:0034714 | type III transforming growth factor beta receptor binding(GO:0034714) |
| 0.1 | 0.4 | GO:0004594 | pantothenate kinase activity(GO:0004594) |
| 0.1 | 0.8 | GO:0000268 | peroxisome targeting sequence binding(GO:0000268) |
| 0.1 | 2.1 | GO:0070064 | proline-rich region binding(GO:0070064) |
| 0.1 | 0.3 | GO:0045505 | dynein intermediate chain binding(GO:0045505) |
| 0.1 | 0.3 | GO:0004572 | mannosyl-oligosaccharide 1,3-1,6-alpha-mannosidase activity(GO:0004572) |
| 0.1 | 8.0 | GO:0005179 | hormone activity(GO:0005179) |
| 0.1 | 2.6 | GO:0004683 | calmodulin-dependent protein kinase activity(GO:0004683) |
| 0.0 | 0.4 | GO:0001225 | RNA polymerase II transcription coactivator binding(GO:0001225) |
| 0.0 | 0.2 | GO:0004461 | lactose synthase activity(GO:0004461) |
| 0.0 | 0.4 | GO:1904315 | neurotransmitter receptor activity involved in regulation of postsynaptic membrane potential(GO:0099529) transmitter-gated ion channel activity involved in regulation of postsynaptic membrane potential(GO:1904315) |
| 0.0 | 0.7 | GO:0047499 | calcium-independent phospholipase A2 activity(GO:0047499) |
| 0.0 | 1.2 | GO:0001056 | RNA polymerase III activity(GO:0001056) |
| 0.0 | 0.2 | GO:0004315 | 3-oxoacyl-[acyl-carrier-protein] synthase activity(GO:0004315) |
| 0.0 | 0.2 | GO:0016933 | extracellular-glycine-gated ion channel activity(GO:0016933) extracellular-glycine-gated chloride channel activity(GO:0016934) |
| 0.0 | 4.2 | GO:0008307 | structural constituent of muscle(GO:0008307) |
| 0.0 | 0.1 | GO:0000224 | peptide-N4-(N-acetyl-beta-glucosaminyl)asparagine amidase activity(GO:0000224) |
| 0.0 | 0.3 | GO:0008853 | exodeoxyribonuclease III activity(GO:0008853) |
| 0.0 | 0.2 | GO:0004663 | Rab geranylgeranyltransferase activity(GO:0004663) |
| 0.0 | 0.4 | GO:0046923 | ER retention sequence binding(GO:0046923) |
| 0.0 | 1.6 | GO:0051010 | microtubule plus-end binding(GO:0051010) |
| 0.0 | 1.5 | GO:0008239 | dipeptidyl-peptidase activity(GO:0008239) |
| 0.0 | 0.7 | GO:0005161 | platelet-derived growth factor receptor binding(GO:0005161) |
| 0.0 | 11.1 | GO:0044325 | ion channel binding(GO:0044325) |
| 0.0 | 0.2 | GO:0016647 | oxidoreductase activity, acting on the CH-NH group of donors, oxygen as acceptor(GO:0016647) |
| 0.0 | 0.3 | GO:0018479 | benzaldehyde dehydrogenase (NAD+) activity(GO:0018479) |
| 0.0 | 2.3 | GO:0097110 | scaffold protein binding(GO:0097110) |
| 0.0 | 0.3 | GO:0016361 | activin receptor activity, type I(GO:0016361) |
| 0.0 | 0.3 | GO:0001025 | RNA polymerase III transcription factor binding(GO:0001025) |
| 0.0 | 1.0 | GO:0097602 | cullin family protein binding(GO:0097602) |
| 0.0 | 0.1 | GO:0002113 | interleukin-33 binding(GO:0002113) |
| 0.0 | 0.5 | GO:0015194 | L-serine transmembrane transporter activity(GO:0015194) serine transmembrane transporter activity(GO:0022889) |
| 0.0 | 0.6 | GO:1990459 | transferrin receptor binding(GO:1990459) |
| 0.0 | 0.1 | GO:0017153 | sodium:dicarboxylate symporter activity(GO:0017153) |
| 0.0 | 0.2 | GO:0004883 | glucocorticoid receptor activity(GO:0004883) glucocorticoid-activated RNA polymerase II transcription factor binding transcription factor activity(GO:0038051) |
| 0.0 | 0.3 | GO:0015065 | uridine nucleotide receptor activity(GO:0015065) G-protein coupled pyrimidinergic nucleotide receptor activity(GO:0071553) |
| 0.0 | 0.1 | GO:0004963 | follicle-stimulating hormone receptor activity(GO:0004963) |
| 0.0 | 0.3 | GO:0008142 | oxysterol binding(GO:0008142) |
| 0.0 | 1.4 | GO:0004177 | aminopeptidase activity(GO:0004177) |
| 0.0 | 1.2 | GO:0071837 | HMG box domain binding(GO:0071837) |
| 0.0 | 0.6 | GO:0017154 | semaphorin receptor activity(GO:0017154) |
| 0.0 | 0.9 | GO:0005104 | fibroblast growth factor receptor binding(GO:0005104) |
| 0.0 | 0.4 | GO:0035374 | chondroitin sulfate binding(GO:0035374) |
| 0.0 | 2.3 | GO:0004712 | protein serine/threonine/tyrosine kinase activity(GO:0004712) |
| 0.0 | 1.1 | GO:0004435 | phosphatidylinositol phospholipase C activity(GO:0004435) |
| 0.0 | 1.4 | GO:0070888 | E-box binding(GO:0070888) |
| 0.0 | 0.8 | GO:0098641 | cadherin binding involved in cell-cell adhesion(GO:0098641) |
| 0.0 | 0.2 | GO:0016712 | oxidoreductase activity, acting on paired donors, with incorporation or reduction of molecular oxygen, reduced flavin or flavoprotein as one donor, and incorporation of one atom of oxygen(GO:0016712) aromatase activity(GO:0070330) |
| 0.0 | 0.5 | GO:0030297 | transmembrane receptor protein tyrosine kinase activator activity(GO:0030297) |
| 0.0 | 0.4 | GO:0019531 | oxalate transmembrane transporter activity(GO:0019531) |
| 0.0 | 0.6 | GO:0034185 | apolipoprotein binding(GO:0034185) |
| 0.0 | 3.8 | GO:0030165 | PDZ domain binding(GO:0030165) |
| 0.0 | 0.5 | GO:0098505 | G-rich strand telomeric DNA binding(GO:0098505) |
| 0.0 | 0.2 | GO:0042285 | UDP-xylosyltransferase activity(GO:0035252) xylosyltransferase activity(GO:0042285) |
| 0.0 | 0.6 | GO:0008527 | taste receptor activity(GO:0008527) |
| 0.0 | 0.5 | GO:0045295 | gamma-catenin binding(GO:0045295) |
| 0.0 | 0.6 | GO:0030275 | LRR domain binding(GO:0030275) |
| 0.0 | 0.3 | GO:0016494 | C-X-C chemokine receptor activity(GO:0016494) C-X-C chemokine binding(GO:0019958) |
| 0.0 | 0.1 | GO:0030617 | transforming growth factor beta receptor, inhibitory cytoplasmic mediator activity(GO:0030617) |
| 0.0 | 2.5 | GO:0031490 | chromatin DNA binding(GO:0031490) |
| 0.0 | 0.7 | GO:0004115 | 3',5'-cyclic-AMP phosphodiesterase activity(GO:0004115) |
| 0.0 | 0.2 | GO:0070181 | small ribosomal subunit rRNA binding(GO:0070181) |
| 0.0 | 0.4 | GO:0005112 | Notch binding(GO:0005112) |
| 0.0 | 0.5 | GO:0005109 | frizzled binding(GO:0005109) |
| 0.0 | 1.5 | GO:0016765 | transferase activity, transferring alkyl or aryl (other than methyl) groups(GO:0016765) |
| 0.0 | 0.1 | GO:0072345 | NAADP-sensitive calcium-release channel activity(GO:0072345) |
| 0.0 | 3.6 | GO:0001078 | transcriptional repressor activity, RNA polymerase II core promoter proximal region sequence-specific binding(GO:0001078) |
| 0.0 | 0.2 | GO:0015037 | peptide disulfide oxidoreductase activity(GO:0015037) |
| 0.0 | 1.0 | GO:0016831 | carboxy-lyase activity(GO:0016831) |
| 0.0 | 0.4 | GO:0016641 | oxidoreductase activity, acting on the CH-NH2 group of donors, oxygen as acceptor(GO:0016641) |
| 0.0 | 0.7 | GO:0043236 | laminin binding(GO:0043236) |
| 0.0 | 0.3 | GO:0030506 | ankyrin binding(GO:0030506) |
| 0.0 | 0.2 | GO:0097371 | MDM2/MDM4 family protein binding(GO:0097371) |
| 0.0 | 0.6 | GO:0001671 | ATPase activator activity(GO:0001671) |
| 0.0 | 0.2 | GO:0034450 | ubiquitin-ubiquitin ligase activity(GO:0034450) |
| 0.0 | 2.1 | GO:0047485 | protein N-terminus binding(GO:0047485) |
| 0.0 | 1.1 | GO:0004869 | cysteine-type endopeptidase inhibitor activity(GO:0004869) |
| 0.0 | 0.1 | GO:0015235 | cobalamin transporter activity(GO:0015235) |
| 0.0 | 0.3 | GO:0070628 | proteasome binding(GO:0070628) |
| 0.0 | 0.3 | GO:1905030 | voltage-gated sodium channel activity(GO:0005248) voltage-gated ion channel activity involved in regulation of postsynaptic membrane potential(GO:1905030) |
| 0.0 | 0.3 | GO:0097200 | cysteine-type endopeptidase activity involved in execution phase of apoptosis(GO:0097200) |
| 0.0 | 0.6 | GO:0008139 | nuclear localization sequence binding(GO:0008139) |
| 0.0 | 0.2 | GO:0009982 | pseudouridine synthase activity(GO:0009982) |
| 0.0 | 0.9 | GO:0005044 | scavenger receptor activity(GO:0005044) |
| 0.0 | 0.2 | GO:0031821 | G-protein coupled serotonin receptor binding(GO:0031821) |
| 0.0 | 1.5 | GO:0016779 | nucleotidyltransferase activity(GO:0016779) |
| 0.0 | 0.2 | GO:0005344 | oxygen transporter activity(GO:0005344) |
Gene overrepresentation in curated gene sets: canonical pathways category:
| Log-likelihood per target | Total log-likelihood | Term | Description |
|---|---|---|---|
| 0.3 | 23.4 | SIG REGULATION OF THE ACTIN CYTOSKELETON BY RHO GTPASES | Genes related to regulation of the actin cytoskeleton |
| 0.1 | 3.9 | PID P38 MKK3 6PATHWAY | p38 MAPK signaling pathway |
| 0.1 | 2.6 | PID CONE PATHWAY | Visual signal transduction: Cones |
| 0.1 | 6.4 | PID HNF3B PATHWAY | FOXA2 and FOXA3 transcription factor networks |
| 0.1 | 1.3 | PID INTEGRIN4 PATHWAY | Alpha6 beta4 integrin-ligand interactions |
| 0.1 | 5.0 | PID DELTA NP63 PATHWAY | Validated transcriptional targets of deltaNp63 isoforms |
| 0.1 | 0.9 | PID THROMBIN PAR4 PATHWAY | PAR4-mediated thrombin signaling events |
| 0.1 | 3.0 | PID SYNDECAN 2 PATHWAY | Syndecan-2-mediated signaling events |
| 0.0 | 0.2 | PID LYMPH ANGIOGENESIS PATHWAY | VEGFR3 signaling in lymphatic endothelium |
| 0.0 | 0.7 | PID VEGF VEGFR PATHWAY | VEGF and VEGFR signaling network |
| 0.0 | 5.8 | PID MYC ACTIV PATHWAY | Validated targets of C-MYC transcriptional activation |
| 0.0 | 1.6 | PID ENDOTHELIN PATHWAY | Endothelins |
| 0.0 | 1.8 | PID FGF PATHWAY | FGF signaling pathway |
| 0.0 | 0.3 | PID ALK2 PATHWAY | ALK2 signaling events |
| 0.0 | 2.1 | PID TAP63 PATHWAY | Validated transcriptional targets of TAp63 isoforms |
| 0.0 | 1.2 | PID PRL SIGNALING EVENTS PATHWAY | Signaling events mediated by PRL |
| 0.0 | 2.3 | PID LKB1 PATHWAY | LKB1 signaling events |
| 0.0 | 2.4 | PID HES HEY PATHWAY | Notch-mediated HES/HEY network |
| 0.0 | 2.1 | PID P38 ALPHA BETA DOWNSTREAM PATHWAY | Signaling mediated by p38-alpha and p38-beta |
| 0.0 | 1.6 | PID NOTCH PATHWAY | Notch signaling pathway |
| 0.0 | 1.7 | PID BMP PATHWAY | BMP receptor signaling |
| 0.0 | 1.2 | PID CD40 PATHWAY | CD40/CD40L signaling |
| 0.0 | 0.5 | PID ALK1 PATHWAY | ALK1 signaling events |
| 0.0 | 1.7 | PID NFAT 3PATHWAY | Role of Calcineurin-dependent NFAT signaling in lymphocytes |
| 0.0 | 0.5 | SA PROGRAMMED CELL DEATH | Programmed cell death, or apoptosis, eliminates damaged or unneeded cells. |
| 0.0 | 2.0 | PID P73PATHWAY | p73 transcription factor network |
| 0.0 | 1.4 | PID HNF3A PATHWAY | FOXA1 transcription factor network |
| 0.0 | 0.5 | PID HEDGEHOG 2PATHWAY | Signaling events mediated by the Hedgehog family |
| 0.0 | 1.5 | PID AJDISS 2PATHWAY | Posttranslational regulation of adherens junction stability and dissassembly |
| 0.0 | 1.2 | PID ARF6 PATHWAY | Arf6 signaling events |
| 0.0 | 6.0 | NABA ECM REGULATORS | Genes encoding enzymes and their regulators involved in the remodeling of the extracellular matrix |
| 0.0 | 0.8 | PID FANCONI PATHWAY | Fanconi anemia pathway |
| 0.0 | 0.6 | PID ECADHERIN STABILIZATION PATHWAY | Stabilization and expansion of the E-cadherin adherens junction |
| 0.0 | 1.2 | ST INTEGRIN SIGNALING PATHWAY | Integrin Signaling Pathway |
| 0.0 | 1.1 | PID ILK PATHWAY | Integrin-linked kinase signaling |
| 0.0 | 0.5 | PID A6B1 A6B4 INTEGRIN PATHWAY | a6b1 and a6b4 Integrin signaling |
| 0.0 | 0.4 | PID EPHB FWD PATHWAY | EPHB forward signaling |
| 0.0 | 0.3 | PID TGFBR PATHWAY | TGF-beta receptor signaling |
Gene overrepresentation in curated gene sets: REACTOME pathways category:
| Log-likelihood per target | Total log-likelihood | Term | Description |
|---|---|---|---|
| 0.2 | 3.1 | REACTOME GLYCOPROTEIN HORMONES | Genes involved in Glycoprotein hormones |
| 0.2 | 4.0 | REACTOME XENOBIOTICS | Genes involved in Xenobiotics |
| 0.2 | 2.8 | REACTOME SYNTHESIS OF BILE ACIDS AND BILE SALTS VIA 24 HYDROXYCHOLESTEROL | Genes involved in Synthesis of bile acids and bile salts via 24-hydroxycholesterol |
| 0.2 | 4.0 | REACTOME MTORC1 MEDIATED SIGNALLING | Genes involved in mTORC1-mediated signalling |
| 0.1 | 2.8 | REACTOME MITOCHONDRIAL FATTY ACID BETA OXIDATION | Genes involved in Mitochondrial Fatty Acid Beta-Oxidation |
| 0.1 | 2.2 | REACTOME RECYCLING OF BILE ACIDS AND SALTS | Genes involved in Recycling of bile acids and salts |
| 0.1 | 3.9 | REACTOME HS GAG DEGRADATION | Genes involved in HS-GAG degradation |
| 0.1 | 1.4 | REACTOME CREATION OF C4 AND C2 ACTIVATORS | Genes involved in Creation of C4 and C2 activators |
| 0.1 | 1.6 | REACTOME PURINE CATABOLISM | Genes involved in Purine catabolism |
| 0.1 | 2.2 | REACTOME REGULATION OF COMPLEMENT CASCADE | Genes involved in Regulation of Complement cascade |
| 0.1 | 1.1 | REACTOME TRYPTOPHAN CATABOLISM | Genes involved in Tryptophan catabolism |
| 0.1 | 2.5 | REACTOME RAS ACTIVATION UOPN CA2 INFUX THROUGH NMDA RECEPTOR | Genes involved in Ras activation uopn Ca2+ infux through NMDA receptor |
| 0.1 | 0.9 | REACTOME ELEVATION OF CYTOSOLIC CA2 LEVELS | Genes involved in Elevation of cytosolic Ca2+ levels |
| 0.1 | 1.4 | REACTOME VEGF LIGAND RECEPTOR INTERACTIONS | Genes involved in VEGF ligand-receptor interactions |
| 0.1 | 4.9 | REACTOME PYRUVATE METABOLISM AND CITRIC ACID TCA CYCLE | Genes involved in Pyruvate metabolism and Citric Acid (TCA) cycle |
| 0.1 | 4.8 | REACTOME STRIATED MUSCLE CONTRACTION | Genes involved in Striated Muscle Contraction |
| 0.1 | 2.5 | REACTOME PYRIMIDINE METABOLISM | Genes involved in Pyrimidine metabolism |
| 0.1 | 2.0 | REACTOME GLYCOGEN BREAKDOWN GLYCOGENOLYSIS | Genes involved in Glycogen breakdown (glycogenolysis) |
| 0.1 | 0.8 | REACTOME IRAK2 MEDIATED ACTIVATION OF TAK1 COMPLEX UPON TLR7 8 OR 9 STIMULATION | Genes involved in IRAK2 mediated activation of TAK1 complex upon TLR7/8 or 9 stimulation |
| 0.1 | 2.5 | REACTOME TERMINATION OF O GLYCAN BIOSYNTHESIS | Genes involved in Termination of O-glycan biosynthesis |
| 0.1 | 1.7 | REACTOME REGULATION OF INSULIN LIKE GROWTH FACTOR IGF ACTIVITY BY INSULIN LIKE GROWTH FACTOR BINDING PROTEINS IGFBPS | Genes involved in Regulation of Insulin-like Growth Factor (IGF) Activity by Insulin-like Growth Factor Binding Proteins (IGFBPs) |
| 0.1 | 1.1 | REACTOME ENDOGENOUS STEROLS | Genes involved in Endogenous sterols |
| 0.1 | 1.6 | REACTOME GLUCURONIDATION | Genes involved in Glucuronidation |
| 0.1 | 2.2 | REACTOME SULFUR AMINO ACID METABOLISM | Genes involved in Sulfur amino acid metabolism |
| 0.1 | 1.6 | REACTOME INHIBITION OF VOLTAGE GATED CA2 CHANNELS VIA GBETA GAMMA SUBUNITS | Genes involved in Inhibition of voltage gated Ca2+ channels via Gbeta/gamma subunits |
| 0.0 | 0.7 | REACTOME BILE SALT AND ORGANIC ANION SLC TRANSPORTERS | Genes involved in Bile salt and organic anion SLC transporters |
| 0.0 | 1.8 | REACTOME PROLACTIN RECEPTOR SIGNALING | Genes involved in Prolactin receptor signaling |
| 0.0 | 2.1 | REACTOME SIGNALING BY NODAL | Genes involved in Signaling by NODAL |
| 0.0 | 1.3 | REACTOME ABCA TRANSPORTERS IN LIPID HOMEOSTASIS | Genes involved in ABCA transporters in lipid homeostasis |
| 0.0 | 0.7 | REACTOME KERATAN SULFATE DEGRADATION | Genes involved in Keratan sulfate degradation |
| 0.0 | 1.8 | REACTOME RNA POL III TRANSCRIPTION TERMINATION | Genes involved in RNA Polymerase III Transcription Termination |
| 0.0 | 3.4 | REACTOME AMINO ACID TRANSPORT ACROSS THE PLASMA MEMBRANE | Genes involved in Amino acid transport across the plasma membrane |
| 0.0 | 1.2 | REACTOME PRE NOTCH PROCESSING IN GOLGI | Genes involved in Pre-NOTCH Processing in Golgi |
| 0.0 | 1.0 | REACTOME SIGNALING BY BMP | Genes involved in Signaling by BMP |
| 0.0 | 1.4 | REACTOME FORMATION OF INCISION COMPLEX IN GG NER | Genes involved in Formation of incision complex in GG-NER |
| 0.0 | 3.6 | REACTOME NCAM1 INTERACTIONS | Genes involved in NCAM1 interactions |
| 0.0 | 1.2 | REACTOME CHOLESTEROL BIOSYNTHESIS | Genes involved in Cholesterol biosynthesis |
| 0.0 | 10.1 | REACTOME ANTIGEN PROCESSING UBIQUITINATION PROTEASOME DEGRADATION | Genes involved in Antigen processing: Ubiquitination & Proteasome degradation |
| 0.0 | 0.6 | REACTOME CHYLOMICRON MEDIATED LIPID TRANSPORT | Genes involved in Chylomicron-mediated lipid transport |
| 0.0 | 0.2 | REACTOME ION CHANNEL TRANSPORT | Genes involved in Ion channel transport |
| 0.0 | 0.4 | REACTOME UNBLOCKING OF NMDA RECEPTOR GLUTAMATE BINDING AND ACTIVATION | Genes involved in Unblocking of NMDA receptor, glutamate binding and activation |
| 0.0 | 1.0 | REACTOME AMINO ACID AND OLIGOPEPTIDE SLC TRANSPORTERS | Genes involved in Amino acid and oligopeptide SLC transporters |
| 0.0 | 0.8 | REACTOME DEGRADATION OF THE EXTRACELLULAR MATRIX | Genes involved in Degradation of the extracellular matrix |
| 0.0 | 1.0 | REACTOME FGFR LIGAND BINDING AND ACTIVATION | Genes involved in FGFR ligand binding and activation |
| 0.0 | 2.5 | REACTOME MYOGENESIS | Genes involved in Myogenesis |
| 0.0 | 1.1 | REACTOME TIGHT JUNCTION INTERACTIONS | Genes involved in Tight junction interactions |
| 0.0 | 3.2 | REACTOME CLASS B 2 SECRETIN FAMILY RECEPTORS | Genes involved in Class B/2 (Secretin family receptors) |
| 0.0 | 0.2 | REACTOME ADP SIGNALLING THROUGH P2RY12 | Genes involved in ADP signalling through P2Y purinoceptor 12 |
| 0.0 | 0.7 | REACTOME ACYL CHAIN REMODELLING OF PE | Genes involved in Acyl chain remodelling of PE |
| 0.0 | 0.4 | REACTOME VITAMIN B5 PANTOTHENATE METABOLISM | Genes involved in Vitamin B5 (pantothenate) metabolism |
| 0.0 | 0.3 | REACTOME APOPTOTIC CLEAVAGE OF CELL ADHESION PROTEINS | Genes involved in Apoptotic cleavage of cell adhesion proteins |
| 0.0 | 2.1 | REACTOME NUCLEAR RECEPTOR TRANSCRIPTION PATHWAY | Genes involved in Nuclear Receptor transcription pathway |
| 0.0 | 0.4 | REACTOME DOWNREGULATION OF SMAD2 3 SMAD4 TRANSCRIPTIONAL ACTIVITY | Genes involved in Downregulation of SMAD2/3:SMAD4 transcriptional activity |
| 0.0 | 0.3 | REACTOME CLASS C 3 METABOTROPIC GLUTAMATE PHEROMONE RECEPTORS | Genes involved in Class C/3 (Metabotropic glutamate/pheromone receptors) |
| 0.0 | 0.4 | REACTOME CASPASE MEDIATED CLEAVAGE OF CYTOSKELETAL PROTEINS | Genes involved in Caspase-mediated cleavage of cytoskeletal proteins |
| 0.0 | 0.5 | REACTOME DOWNREGULATION OF ERBB2 ERBB3 SIGNALING | Genes involved in Downregulation of ERBB2:ERBB3 signaling |
| 0.0 | 0.4 | REACTOME AMYLOIDS | Genes involved in Amyloids |
| 0.0 | 0.6 | REACTOME INTERACTION BETWEEN L1 AND ANKYRINS | Genes involved in Interaction between L1 and Ankyrins |
| 0.0 | 0.4 | REACTOME PLATELET SENSITIZATION BY LDL | Genes involved in Platelet sensitization by LDL |
| 0.0 | 0.2 | REACTOME SYNTHESIS OF SUBSTRATES IN N GLYCAN BIOSYTHESIS | Genes involved in Synthesis of substrates in N-glycan biosythesis |
| 0.0 | 0.8 | REACTOME METABOLISM OF VITAMINS AND COFACTORS | Genes involved in Metabolism of vitamins and cofactors |
| 0.0 | 0.1 | REACTOME HORMONE LIGAND BINDING RECEPTORS | Genes involved in Hormone ligand-binding receptors |