Project
Illumina Body Map 2 (GSE30611)
Navigation
Downloads
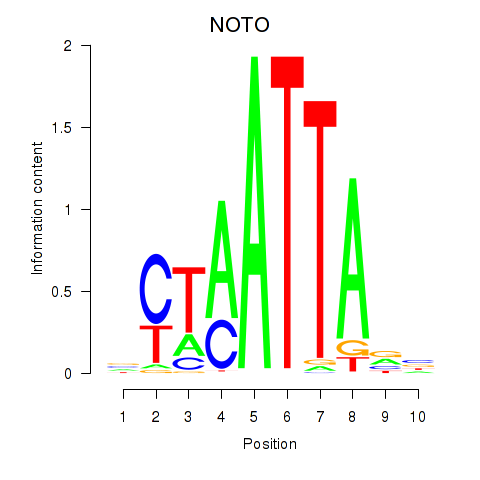
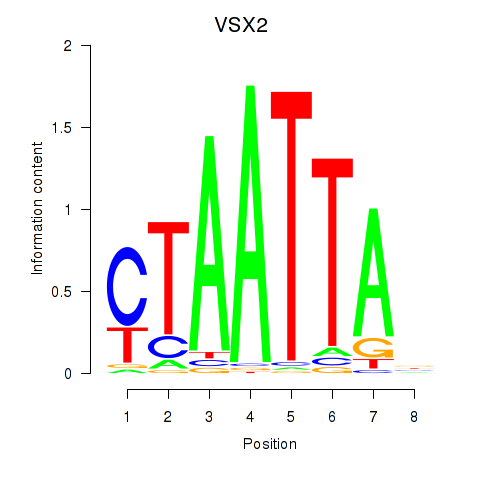
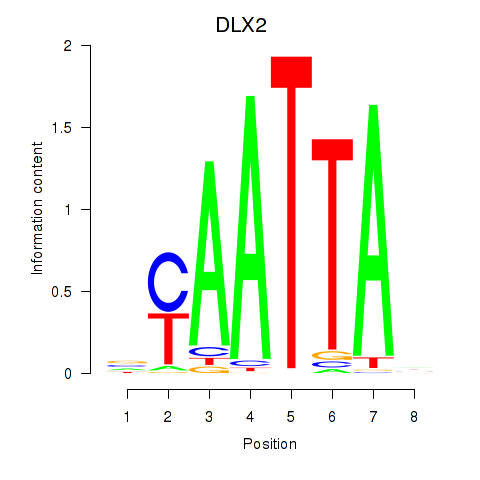
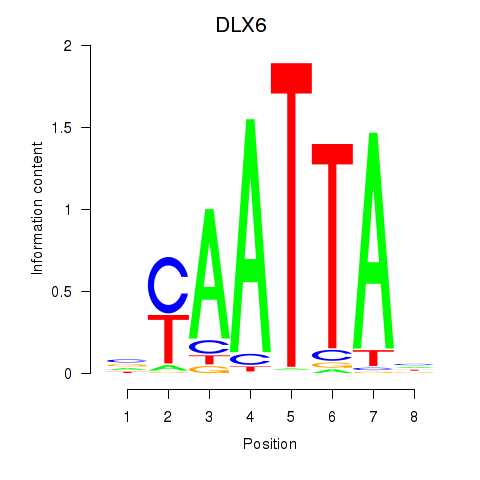
Results for NOTO_VSX2_DLX2_DLX6_NKX6-1
Z-value: 0.74
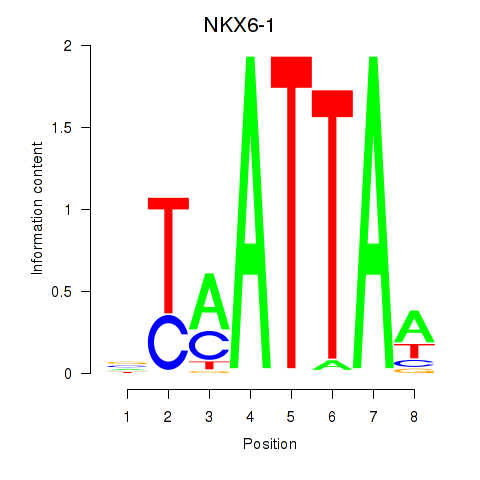
Motif logo
Transcription factors associated with NOTO_VSX2_DLX2_DLX6_NKX6-1
| Gene Symbol | Gene ID | Gene Info |
|---|---|---|
|
NOTO
|
ENSG00000214513.4 | notochord homeobox |
|
VSX2
|
ENSG00000119614.3 | visual system homeobox 2 |
|
DLX2
|
ENSG00000115844.11 | distal-less homeobox 2 |
|
DLX6
|
ENSG00000006377.11 | distal-less homeobox 6 |
|
NKX6-1
|
ENSG00000163623.10 | NK6 homeobox 1 |
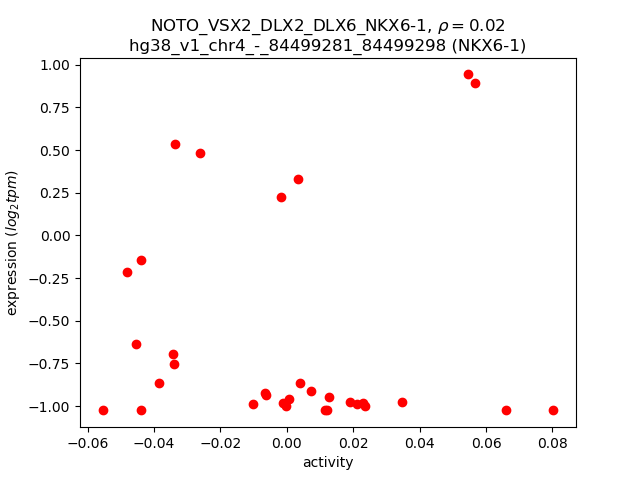
Activity-expression correlation:
| Gene | Promoter | Pearson corr. coef. | P-value | Plot |
|---|---|---|---|---|
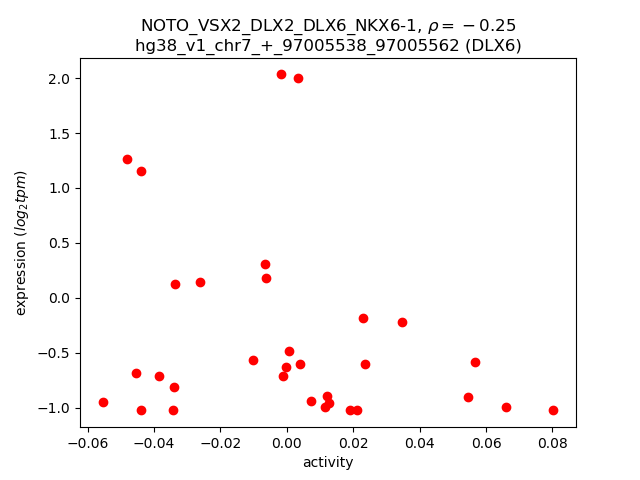
| DLX6 | hg38_v1_chr7_+_97005538_97005562 | -0.25 | 1.6e-01 | Click! |
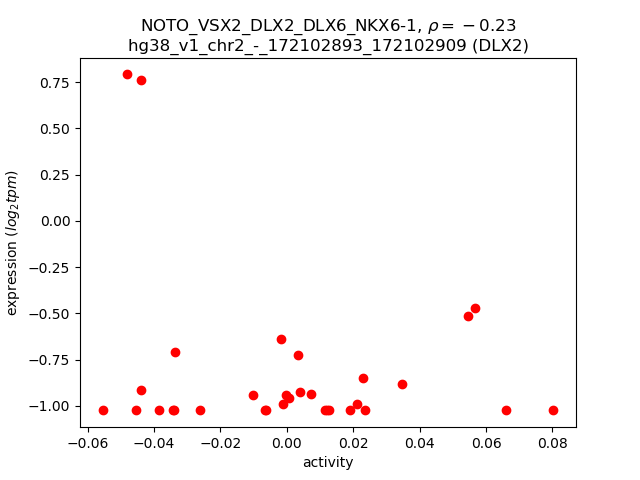
| DLX2 | hg38_v1_chr2_-_172102893_172102909 | -0.23 | 2.0e-01 | Click! |
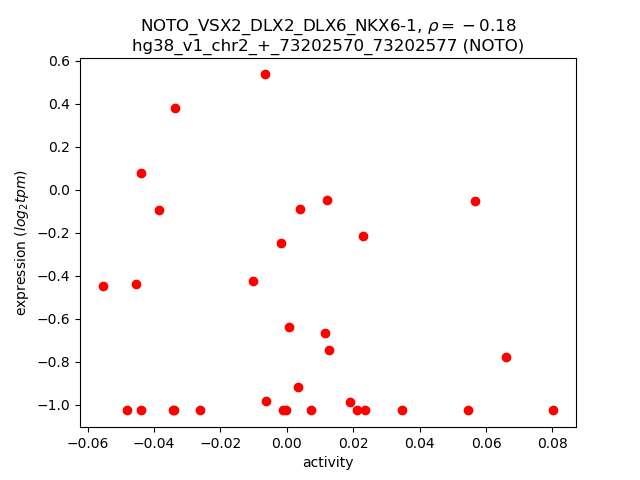
| NOTO | hg38_v1_chr2_+_73202570_73202577 | -0.18 | 3.1e-01 | Click! |
| VSX2 | hg38_v1_chr14_+_74239447_74239452 | -0.13 | 4.9e-01 | Click! |
| NKX6-1 | hg38_v1_chr4_-_84499281_84499298 | 0.02 | 9.4e-01 | Click! |
Activity profile of NOTO_VSX2_DLX2_DLX6_NKX6-1 motif
Sorted Z-values of NOTO_VSX2_DLX2_DLX6_NKX6-1 motif
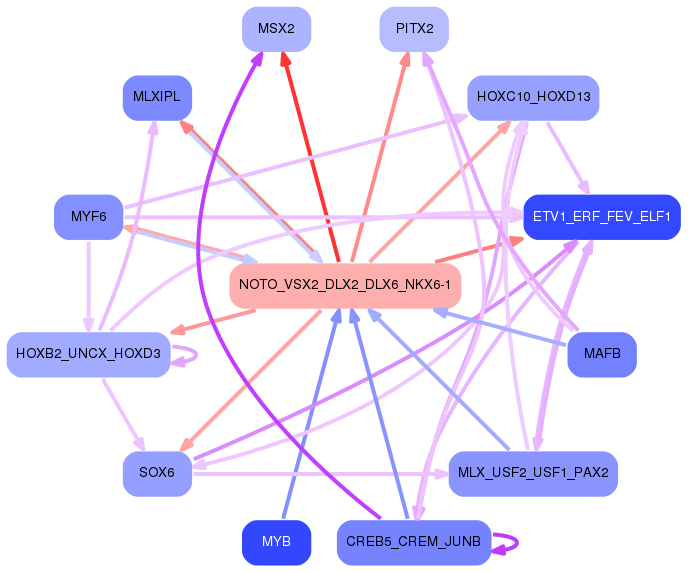
Network of associatons between targets according to the STRING database.

First level regulatory network of NOTO_VSX2_DLX2_DLX6_NKX6-1
Gene Ontology Analysis
Gene overrepresentation in biological process category:
| Log-likelihood per target | Total log-likelihood | Term | Description |
|---|---|---|---|
| 1.7 | 8.5 | GO:1901846 | positive regulation of cell communication by electrical coupling involved in cardiac conduction(GO:1901846) |
| 0.8 | 3.4 | GO:0051795 | embryonic nail plate morphogenesis(GO:0035880) positive regulation of catagen(GO:0051795) |
| 0.7 | 3.6 | GO:0090290 | positive regulation of osteoclast proliferation(GO:0090290) |
| 0.6 | 1.9 | GO:0061402 | positive regulation of transcription from RNA polymerase II promoter in response to acidic pH(GO:0061402) |
| 0.6 | 1.9 | GO:0042309 | octopamine biosynthetic process(GO:0006589) homoiothermy(GO:0042309) octopamine metabolic process(GO:0046333) |
| 0.5 | 1.5 | GO:0060127 | subthalamic nucleus development(GO:0021763) prolactin secreting cell differentiation(GO:0060127) superior vena cava morphogenesis(GO:0060578) |
| 0.4 | 4.5 | GO:0034392 | negative regulation of smooth muscle cell apoptotic process(GO:0034392) |
| 0.3 | 3.8 | GO:2000324 | positive regulation of glucocorticoid receptor signaling pathway(GO:2000324) |
| 0.3 | 2.5 | GO:0050955 | thermoception(GO:0050955) |
| 0.3 | 0.9 | GO:0009441 | glycolate metabolic process(GO:0009441) |
| 0.3 | 0.9 | GO:0002194 | hepatocyte cell migration(GO:0002194) otic placode formation(GO:0043049) branching involved in pancreas morphogenesis(GO:0061114) acinar cell differentiation(GO:0090425) positive regulation of forebrain neuron differentiation(GO:2000979) |
| 0.3 | 0.8 | GO:0048561 | establishment of organ orientation(GO:0048561) |
| 0.3 | 4.8 | GO:0019532 | oxalate transport(GO:0019532) |
| 0.3 | 1.0 | GO:0032903 | viral protein processing(GO:0019082) regulation of nerve growth factor production(GO:0032903) negative regulation of nerve growth factor production(GO:0032904) dibasic protein processing(GO:0090472) |
| 0.2 | 3.2 | GO:0048743 | positive regulation of skeletal muscle fiber development(GO:0048743) |
| 0.2 | 0.7 | GO:1903718 | carbamoyl phosphate metabolic process(GO:0070408) carbamoyl phosphate biosynthetic process(GO:0070409) response to ammonia(GO:1903717) cellular response to ammonia(GO:1903718) |
| 0.2 | 0.7 | GO:0061011 | hepatic duct development(GO:0061011) |
| 0.2 | 3.6 | GO:0014809 | regulation of skeletal muscle contraction by regulation of release of sequestered calcium ion(GO:0014809) |
| 0.2 | 0.9 | GO:0086097 | phospholipase C-activating angiotensin-activated signaling pathway(GO:0086097) |
| 0.2 | 0.8 | GO:0052047 | positive regulation of fibrinolysis(GO:0051919) interaction with other organism via secreted substance involved in symbiotic interaction(GO:0052047) |
| 0.2 | 0.6 | GO:0097187 | dentinogenesis(GO:0097187) regulation of sodium-dependent phosphate transport(GO:2000118) |
| 0.2 | 1.2 | GO:0042776 | mitochondrial ATP synthesis coupled proton transport(GO:0042776) |
| 0.2 | 1.9 | GO:0006572 | tyrosine catabolic process(GO:0006572) |
| 0.2 | 0.7 | GO:1903045 | neural crest cell migration involved in sympathetic nervous system development(GO:1903045) |
| 0.2 | 0.7 | GO:2000393 | negative regulation of lamellipodium morphogenesis(GO:2000393) |
| 0.2 | 0.3 | GO:0021913 | regulation of transcription from RNA polymerase II promoter involved in ventral spinal cord interneuron specification(GO:0021913) |
| 0.2 | 0.5 | GO:1901876 | regulation of the force of heart contraction by cardiac conduction(GO:0086092) regulation of calcium ion binding(GO:1901876) negative regulation of calcium ion binding(GO:1901877) |
| 0.2 | 0.9 | GO:0061551 | trigeminal ganglion development(GO:0061551) |
| 0.1 | 0.7 | GO:0070173 | regulation of enamel mineralization(GO:0070173) |
| 0.1 | 0.6 | GO:0002501 | peptide antigen assembly with MHC protein complex(GO:0002501) |
| 0.1 | 0.4 | GO:0060573 | ventral spinal cord interneuron specification(GO:0021521) cell fate specification involved in pattern specification(GO:0060573) |
| 0.1 | 0.4 | GO:0098583 | mastication(GO:0071626) learned vocalization behavior(GO:0098583) |
| 0.1 | 0.4 | GO:0021758 | caudate nucleus development(GO:0021757) putamen development(GO:0021758) |
| 0.1 | 0.5 | GO:0002326 | B cell lineage commitment(GO:0002326) |
| 0.1 | 2.5 | GO:0001833 | inner cell mass cell proliferation(GO:0001833) |
| 0.1 | 1.6 | GO:0090324 | negative regulation of oxidative phosphorylation(GO:0090324) |
| 0.1 | 1.8 | GO:0044341 | sodium-dependent phosphate transport(GO:0044341) |
| 0.1 | 1.4 | GO:1902221 | L-phenylalanine metabolic process(GO:0006558) L-phenylalanine catabolic process(GO:0006559) erythrose 4-phosphate/phosphoenolpyruvate family amino acid metabolic process(GO:1902221) erythrose 4-phosphate/phosphoenolpyruvate family amino acid catabolic process(GO:1902222) |
| 0.1 | 0.6 | GO:1990523 | bone regeneration(GO:1990523) |
| 0.1 | 1.3 | GO:0051005 | negative regulation of lipoprotein lipase activity(GO:0051005) |
| 0.1 | 0.4 | GO:1903173 | phytol metabolic process(GO:0033306) fatty alcohol metabolic process(GO:1903173) |
| 0.1 | 2.1 | GO:0001778 | plasma membrane repair(GO:0001778) |
| 0.1 | 0.5 | GO:1901994 | negative regulation of meiotic cell cycle phase transition(GO:1901994) |
| 0.1 | 1.2 | GO:0035726 | common myeloid progenitor cell proliferation(GO:0035726) |
| 0.1 | 1.4 | GO:1904352 | positive regulation of protein catabolic process in the vacuole(GO:1904352) |
| 0.1 | 0.3 | GO:0034761 | regulation of antigen processing and presentation of peptide antigen via MHC class I(GO:0002589) negative regulation of antigen processing and presentation of peptide antigen via MHC class I(GO:0002590) positive regulation of iron ion transport(GO:0034758) positive regulation of iron ion transmembrane transport(GO:0034761) regulation of iron ion import(GO:1900390) regulation of ferrous iron import into cell(GO:1903989) positive regulation of ferrous iron import into cell(GO:1903991) regulation of ferrous iron binding(GO:1904432) positive regulation of ferrous iron binding(GO:1904434) regulation of transferrin receptor binding(GO:1904435) positive regulation of transferrin receptor binding(GO:1904437) regulation of ferrous iron import across plasma membrane(GO:1904438) positive regulation of ferrous iron import across plasma membrane(GO:1904440) response to iron ion starvation(GO:1990641) |
| 0.1 | 0.3 | GO:0014034 | neural crest cell fate commitment(GO:0014034) |
| 0.1 | 0.6 | GO:0033615 | mitochondrial proton-transporting ATP synthase complex assembly(GO:0033615) |
| 0.1 | 0.3 | GO:0050883 | musculoskeletal movement, spinal reflex action(GO:0050883) |
| 0.1 | 1.1 | GO:0034638 | phosphatidylcholine catabolic process(GO:0034638) |
| 0.1 | 0.5 | GO:0061032 | cardiac right ventricle formation(GO:0003219) visceral serous pericardium development(GO:0061032) |
| 0.1 | 4.7 | GO:0003298 | physiological muscle hypertrophy(GO:0003298) physiological cardiac muscle hypertrophy(GO:0003301) cell growth involved in cardiac muscle cell development(GO:0061049) |
| 0.1 | 0.5 | GO:0002074 | extraocular skeletal muscle development(GO:0002074) |
| 0.1 | 1.6 | GO:0021520 | spinal cord motor neuron cell fate specification(GO:0021520) |
| 0.1 | 0.2 | GO:0014016 | neuroblast differentiation(GO:0014016) |
| 0.1 | 1.1 | GO:0048251 | elastic fiber assembly(GO:0048251) |
| 0.1 | 0.3 | GO:1902725 | negative regulation of satellite cell differentiation(GO:1902725) |
| 0.1 | 1.2 | GO:0043152 | induction of bacterial agglutination(GO:0043152) |
| 0.1 | 0.3 | GO:0098957 | anterograde axonal transport of mitochondrion(GO:0098957) |
| 0.1 | 0.6 | GO:0021780 | oligodendrocyte cell fate specification(GO:0021778) oligodendrocyte cell fate commitment(GO:0021779) glial cell fate specification(GO:0021780) |
| 0.1 | 0.4 | GO:0036233 | glycine import(GO:0036233) |
| 0.1 | 0.5 | GO:0015842 | aminergic neurotransmitter loading into synaptic vesicle(GO:0015842) |
| 0.1 | 0.3 | GO:0010133 | proline catabolic process to glutamate(GO:0010133) |
| 0.1 | 1.4 | GO:0071688 | striated muscle myosin thick filament assembly(GO:0071688) |
| 0.1 | 0.4 | GO:0035553 | oxidative RNA demethylation(GO:0035513) oxidative single-stranded RNA demethylation(GO:0035553) |
| 0.1 | 2.6 | GO:0045603 | positive regulation of endothelial cell differentiation(GO:0045603) |
| 0.1 | 0.3 | GO:0002426 | immunoglobulin production in mucosal tissue(GO:0002426) |
| 0.1 | 0.6 | GO:0072513 | positive regulation of secondary heart field cardioblast proliferation(GO:0072513) |
| 0.1 | 0.2 | GO:0043438 | acetoacetic acid metabolic process(GO:0043438) |
| 0.1 | 0.2 | GO:0042668 | auditory receptor cell fate determination(GO:0042668) |
| 0.1 | 0.2 | GO:0035990 | tendon cell differentiation(GO:0035990) tendon formation(GO:0035992) |
| 0.1 | 0.4 | GO:0010760 | negative regulation of macrophage chemotaxis(GO:0010760) |
| 0.1 | 0.9 | GO:0070166 | enamel mineralization(GO:0070166) |
| 0.1 | 0.1 | GO:0003358 | noradrenergic neuron development(GO:0003358) |
| 0.1 | 0.6 | GO:0097068 | response to thyroxine(GO:0097068) response to L-phenylalanine derivative(GO:1904386) |
| 0.1 | 0.4 | GO:1904450 | negative regulation of gamma-aminobutyric acid secretion(GO:0014053) aspartate secretion(GO:0061528) regulation of aspartate secretion(GO:1904448) positive regulation of aspartate secretion(GO:1904450) |
| 0.1 | 0.5 | GO:0060005 | vestibular reflex(GO:0060005) |
| 0.1 | 0.2 | GO:0031456 | glycine betaine biosynthetic process from choline(GO:0019285) glycine betaine metabolic process(GO:0031455) glycine betaine biosynthetic process(GO:0031456) |
| 0.1 | 0.2 | GO:0045715 | negative regulation of low-density lipoprotein particle receptor biosynthetic process(GO:0045715) |
| 0.1 | 0.5 | GO:0061767 | negative regulation of lung blood pressure(GO:0061767) |
| 0.1 | 0.8 | GO:0042420 | dopamine catabolic process(GO:0042420) |
| 0.1 | 1.5 | GO:0006123 | mitochondrial electron transport, cytochrome c to oxygen(GO:0006123) |
| 0.1 | 0.3 | GO:0003199 | endocardial cushion to mesenchymal transition involved in heart valve formation(GO:0003199) |
| 0.1 | 0.2 | GO:0006480 | N-terminal protein amino acid methylation(GO:0006480) |
| 0.1 | 0.1 | GO:1902358 | sulfate transmembrane transport(GO:1902358) |
| 0.1 | 0.4 | GO:0070940 | dephosphorylation of RNA polymerase II C-terminal domain(GO:0070940) |
| 0.1 | 0.5 | GO:0042271 | susceptibility to natural killer cell mediated cytotoxicity(GO:0042271) |
| 0.1 | 1.3 | GO:0048934 | peripheral nervous system neuron differentiation(GO:0048934) peripheral nervous system neuron development(GO:0048935) |
| 0.1 | 1.3 | GO:0021516 | dorsal spinal cord development(GO:0021516) |
| 0.1 | 0.3 | GO:0046013 | regulation of T cell homeostatic proliferation(GO:0046013) |
| 0.1 | 0.4 | GO:0061152 | trachea submucosa development(GO:0061152) trachea gland development(GO:0061153) |
| 0.1 | 0.5 | GO:0048739 | cardiac muscle fiber development(GO:0048739) |
| 0.1 | 1.0 | GO:0045176 | apical protein localization(GO:0045176) |
| 0.1 | 0.8 | GO:0070327 | thyroid hormone transport(GO:0070327) |
| 0.1 | 0.7 | GO:0031339 | negative regulation of vesicle fusion(GO:0031339) |
| 0.1 | 0.2 | GO:1903259 | exon-exon junction complex disassembly(GO:1903259) |
| 0.1 | 0.4 | GO:1903758 | positive regulation of dendritic spine maintenance(GO:1902952) regulation of transcription from RNA polymerase II promoter by histone modification(GO:1903756) negative regulation of transcription from RNA polymerase II promoter by histone modification(GO:1903758) |
| 0.0 | 0.2 | GO:2000851 | positive regulation of saliva secretion(GO:0046878) positive regulation of glucocorticoid secretion(GO:2000851) |
| 0.0 | 0.1 | GO:0061300 | cerebellum vasculature development(GO:0061300) |
| 0.0 | 0.3 | GO:0051970 | negative regulation of transmission of nerve impulse(GO:0051970) |
| 0.0 | 0.2 | GO:0099545 | cytoskeletal matrix organization at active zone(GO:0048789) neurexin clustering involved in presynaptic membrane assembly(GO:0097115) retrograde trans-synaptic signaling by trans-synaptic protein complex(GO:0098942) trans-synaptic signaling by trans-synaptic complex(GO:0099545) |
| 0.0 | 0.1 | GO:0071676 | negative regulation of mononuclear cell migration(GO:0071676) |
| 0.0 | 0.4 | GO:0010724 | regulation of definitive erythrocyte differentiation(GO:0010724) |
| 0.0 | 0.4 | GO:0021759 | globus pallidus development(GO:0021759) |
| 0.0 | 0.2 | GO:1990168 | protein K33-linked deubiquitination(GO:1990168) |
| 0.0 | 0.7 | GO:0035372 | protein localization to microtubule(GO:0035372) |
| 0.0 | 0.4 | GO:0097475 | motor neuron migration(GO:0097475) |
| 0.0 | 0.9 | GO:0021891 | olfactory bulb interneuron development(GO:0021891) |
| 0.0 | 0.6 | GO:0014877 | response to muscle inactivity involved in regulation of muscle adaptation(GO:0014877) response to denervation involved in regulation of muscle adaptation(GO:0014894) |
| 0.0 | 0.8 | GO:0006069 | ethanol oxidation(GO:0006069) |
| 0.0 | 0.1 | GO:1903774 | positive regulation of viral budding via host ESCRT complex(GO:1903774) |
| 0.0 | 0.6 | GO:0034214 | protein hexamerization(GO:0034214) |
| 0.0 | 1.6 | GO:0070884 | regulation of calcineurin-NFAT signaling cascade(GO:0070884) |
| 0.0 | 0.2 | GO:0010159 | specification of organ position(GO:0010159) |
| 0.0 | 0.9 | GO:0002089 | lens morphogenesis in camera-type eye(GO:0002089) |
| 0.0 | 0.9 | GO:1900745 | positive regulation of p38MAPK cascade(GO:1900745) |
| 0.0 | 1.1 | GO:0002076 | osteoblast development(GO:0002076) |
| 0.0 | 2.1 | GO:0016486 | peptide hormone processing(GO:0016486) |
| 0.0 | 0.4 | GO:0008354 | germ cell migration(GO:0008354) |
| 0.0 | 0.4 | GO:1901419 | regulation of response to alcohol(GO:1901419) |
| 0.0 | 0.2 | GO:0042264 | peptidyl-aspartic acid hydroxylation(GO:0042264) |
| 0.0 | 0.6 | GO:0030210 | heparin metabolic process(GO:0030202) heparin biosynthetic process(GO:0030210) |
| 0.0 | 0.5 | GO:0034390 | smooth muscle cell apoptotic process(GO:0034390) regulation of smooth muscle cell apoptotic process(GO:0034391) |
| 0.0 | 0.3 | GO:0030242 | pexophagy(GO:0030242) |
| 0.0 | 0.1 | GO:0036269 | swimming behavior(GO:0036269) |
| 0.0 | 0.2 | GO:0070358 | actin polymerization-dependent cell motility(GO:0070358) |
| 0.0 | 0.1 | GO:0060345 | spleen trabecula formation(GO:0060345) iron cation export(GO:1903414) ferrous iron export(GO:1903988) |
| 0.0 | 1.3 | GO:0007413 | axonal fasciculation(GO:0007413) |
| 0.0 | 0.3 | GO:0010746 | regulation of plasma membrane long-chain fatty acid transport(GO:0010746) negative regulation of plasma membrane long-chain fatty acid transport(GO:0010748) |
| 0.0 | 2.0 | GO:0006120 | mitochondrial electron transport, NADH to ubiquinone(GO:0006120) |
| 0.0 | 0.8 | GO:0072189 | ureter development(GO:0072189) |
| 0.0 | 0.4 | GO:0030091 | protein repair(GO:0030091) |
| 0.0 | 1.6 | GO:0032467 | positive regulation of cytokinesis(GO:0032467) |
| 0.0 | 0.3 | GO:2000795 | negative regulation of epithelial cell proliferation involved in lung morphogenesis(GO:2000795) |
| 0.0 | 1.1 | GO:0001580 | detection of chemical stimulus involved in sensory perception of bitter taste(GO:0001580) |
| 0.0 | 0.2 | GO:0036324 | vascular endothelial growth factor receptor-2 signaling pathway(GO:0036324) |
| 0.0 | 0.7 | GO:0035589 | G-protein coupled purinergic nucleotide receptor signaling pathway(GO:0035589) |
| 0.0 | 0.3 | GO:2000741 | positive regulation of mesenchymal stem cell differentiation(GO:2000741) |
| 0.0 | 0.7 | GO:0010172 | embryonic body morphogenesis(GO:0010172) |
| 0.0 | 0.2 | GO:0008050 | female courtship behavior(GO:0008050) |
| 0.0 | 0.3 | GO:1990573 | potassium ion import across plasma membrane(GO:1990573) |
| 0.0 | 0.2 | GO:0070973 | protein localization to endoplasmic reticulum exit site(GO:0070973) |
| 0.0 | 0.1 | GO:0046005 | positive regulation of circadian sleep/wake cycle, REM sleep(GO:0046005) |
| 0.0 | 0.4 | GO:0072257 | metanephric nephron tubule epithelial cell differentiation(GO:0072257) regulation of metanephric nephron tubule epithelial cell differentiation(GO:0072307) |
| 0.0 | 0.6 | GO:0097264 | self proteolysis(GO:0097264) |
| 0.0 | 0.3 | GO:0090336 | positive regulation of brown fat cell differentiation(GO:0090336) |
| 0.0 | 0.3 | GO:0034374 | low-density lipoprotein particle remodeling(GO:0034374) |
| 0.0 | 0.1 | GO:0046379 | extracellular polysaccharide biosynthetic process(GO:0045226) extracellular polysaccharide metabolic process(GO:0046379) |
| 0.0 | 0.5 | GO:0030299 | intestinal cholesterol absorption(GO:0030299) intestinal lipid absorption(GO:0098856) |
| 0.0 | 0.2 | GO:0010890 | positive regulation of sequestering of triglyceride(GO:0010890) |
| 0.0 | 1.2 | GO:0010880 | regulation of release of sequestered calcium ion into cytosol by sarcoplasmic reticulum(GO:0010880) |
| 0.0 | 0.3 | GO:0006122 | mitochondrial electron transport, ubiquinol to cytochrome c(GO:0006122) |
| 0.0 | 0.3 | GO:0030916 | otic vesicle formation(GO:0030916) |
| 0.0 | 0.5 | GO:0034356 | NAD biosynthesis via nicotinamide riboside salvage pathway(GO:0034356) |
| 0.0 | 0.1 | GO:0019276 | UDP-N-acetylgalactosamine metabolic process(GO:0019276) |
| 0.0 | 0.2 | GO:0032525 | somite rostral/caudal axis specification(GO:0032525) |
| 0.0 | 0.2 | GO:0018095 | protein polyglutamylation(GO:0018095) |
| 0.0 | 1.7 | GO:1901016 | regulation of potassium ion transmembrane transporter activity(GO:1901016) |
| 0.0 | 0.2 | GO:0016554 | cytidine to uridine editing(GO:0016554) |
| 0.0 | 1.0 | GO:0032728 | positive regulation of interferon-beta production(GO:0032728) |
| 0.0 | 0.2 | GO:0048742 | regulation of skeletal muscle fiber development(GO:0048742) |
| 0.0 | 0.2 | GO:0006268 | DNA unwinding involved in DNA replication(GO:0006268) |
| 0.0 | 0.2 | GO:0071847 | TNFSF11-mediated signaling pathway(GO:0071847) |
| 0.0 | 0.6 | GO:0016338 | calcium-independent cell-cell adhesion via plasma membrane cell-adhesion molecules(GO:0016338) |
| 0.0 | 0.1 | GO:1903527 | positive regulation of membrane tubulation(GO:1903527) |
| 0.0 | 0.0 | GO:0035038 | female pronucleus assembly(GO:0035038) |
| 0.0 | 0.2 | GO:2000074 | regulation of type B pancreatic cell development(GO:2000074) |
| 0.0 | 0.2 | GO:0060158 | phospholipase C-activating dopamine receptor signaling pathway(GO:0060158) |
| 0.0 | 0.1 | GO:2000342 | negative regulation of chemokine (C-X-C motif) ligand 2 production(GO:2000342) |
| 0.0 | 0.0 | GO:2001015 | negative regulation of skeletal muscle cell differentiation(GO:2001015) |
| 0.0 | 1.7 | GO:1902017 | regulation of cilium assembly(GO:1902017) |
| 0.0 | 0.2 | GO:0036342 | post-anal tail morphogenesis(GO:0036342) |
| 0.0 | 0.2 | GO:0097094 | craniofacial suture morphogenesis(GO:0097094) |
| 0.0 | 0.7 | GO:0090162 | establishment of epithelial cell polarity(GO:0090162) |
| 0.0 | 3.0 | GO:0031424 | keratinization(GO:0031424) |
| 0.0 | 0.5 | GO:0072662 | protein targeting to peroxisome(GO:0006625) protein localization to peroxisome(GO:0072662) establishment of protein localization to peroxisome(GO:0072663) |
| 0.0 | 0.1 | GO:0072092 | ureteric bud invasion(GO:0072092) |
| 0.0 | 0.7 | GO:2000144 | positive regulation of DNA-templated transcription, initiation(GO:2000144) |
| 0.0 | 1.3 | GO:0019730 | antimicrobial humoral response(GO:0019730) |
| 0.0 | 0.0 | GO:0071109 | superior temporal gyrus development(GO:0071109) |
| 0.0 | 0.1 | GO:0035022 | positive regulation of Rac protein signal transduction(GO:0035022) |
| 0.0 | 1.0 | GO:0007585 | respiratory gaseous exchange(GO:0007585) |
| 0.0 | 0.6 | GO:0018345 | protein palmitoylation(GO:0018345) |
| 0.0 | 0.3 | GO:0097062 | dendritic spine maintenance(GO:0097062) |
| 0.0 | 0.9 | GO:0042475 | odontogenesis of dentin-containing tooth(GO:0042475) |
| 0.0 | 0.1 | GO:0021615 | glossopharyngeal nerve morphogenesis(GO:0021615) |
| 0.0 | 0.1 | GO:0015692 | lead ion transport(GO:0015692) |
| 0.0 | 0.1 | GO:0046604 | positive regulation of mitotic centrosome separation(GO:0046604) |
| 0.0 | 3.7 | GO:0050911 | detection of chemical stimulus involved in sensory perception of smell(GO:0050911) |
| 0.0 | 0.1 | GO:0007352 | zygotic specification of dorsal/ventral axis(GO:0007352) |
| 0.0 | 0.3 | GO:0045736 | negative regulation of cyclin-dependent protein serine/threonine kinase activity(GO:0045736) |
| 0.0 | 0.7 | GO:0003281 | ventricular septum development(GO:0003281) |
Gene overrepresentation in cellular component category:
| Log-likelihood per target | Total log-likelihood | Term | Description |
|---|---|---|---|
| 0.9 | 12.1 | GO:0033018 | sarcoplasmic reticulum lumen(GO:0033018) |
| 0.3 | 3.1 | GO:0071953 | elastic fiber(GO:0071953) |
| 0.3 | 1.2 | GO:0005753 | mitochondrial proton-transporting ATP synthase complex(GO:0005753) proton-transporting ATP synthase complex(GO:0045259) |
| 0.2 | 7.4 | GO:0032982 | myosin filament(GO:0032982) |
| 0.2 | 3.8 | GO:0031089 | platelet dense granule lumen(GO:0031089) |
| 0.2 | 1.7 | GO:0019907 | cyclin-dependent protein kinase activating kinase holoenzyme complex(GO:0019907) |
| 0.1 | 1.7 | GO:0005577 | fibrinogen complex(GO:0005577) |
| 0.1 | 1.9 | GO:0042584 | chromaffin granule membrane(GO:0042584) |
| 0.1 | 0.8 | GO:0044279 | extrinsic component of external side of plasma membrane(GO:0031232) other organism cell membrane(GO:0044218) other organism membrane(GO:0044279) |
| 0.1 | 1.2 | GO:0035867 | alphav-beta3 integrin-IGF-1-IGF1R complex(GO:0035867) |
| 0.1 | 1.6 | GO:0036449 | microtubule minus-end(GO:0036449) |
| 0.1 | 0.5 | GO:0030934 | anchoring collagen complex(GO:0030934) |
| 0.1 | 0.5 | GO:0070083 | clathrin-sculpted monoamine transport vesicle(GO:0070081) clathrin-sculpted monoamine transport vesicle membrane(GO:0070083) |
| 0.1 | 1.5 | GO:0045277 | respiratory chain complex IV(GO:0045277) |
| 0.1 | 0.4 | GO:0032144 | 4-aminobutyrate transaminase complex(GO:0032144) |
| 0.1 | 0.3 | GO:1990357 | terminal web(GO:1990357) |
| 0.1 | 0.4 | GO:0070695 | FHF complex(GO:0070695) |
| 0.0 | 0.4 | GO:0016012 | sarcoglycan complex(GO:0016012) |
| 0.0 | 0.8 | GO:0005883 | neurofilament(GO:0005883) |
| 0.0 | 0.4 | GO:0005579 | membrane attack complex(GO:0005579) |
| 0.0 | 0.2 | GO:0005602 | complement component C1 complex(GO:0005602) |
| 0.0 | 3.9 | GO:0055038 | recycling endosome membrane(GO:0055038) |
| 0.0 | 0.5 | GO:0071144 | SMAD2-SMAD3 protein complex(GO:0071144) |
| 0.0 | 0.2 | GO:0005726 | perichromatin fibrils(GO:0005726) |
| 0.0 | 0.2 | GO:1990032 | parallel fiber(GO:1990032) |
| 0.0 | 0.3 | GO:0008282 | ATP-sensitive potassium channel complex(GO:0008282) |
| 0.0 | 1.5 | GO:0030140 | trans-Golgi network transport vesicle(GO:0030140) |
| 0.0 | 0.2 | GO:0030906 | retromer, cargo-selective complex(GO:0030906) |
| 0.0 | 0.4 | GO:0033588 | Elongator holoenzyme complex(GO:0033588) |
| 0.0 | 0.1 | GO:0035838 | growing cell tip(GO:0035838) new growing cell tip(GO:0035841) |
| 0.0 | 0.1 | GO:0036117 | hyaluranon cable(GO:0036117) |
| 0.0 | 0.2 | GO:1990635 | proximal dendrite(GO:1990635) |
| 0.0 | 0.1 | GO:0071148 | TEAD-1-YAP complex(GO:0071148) TEAD-2-YAP complex(GO:0071149) |
| 0.0 | 0.1 | GO:0060187 | cell pole(GO:0060187) |
| 0.0 | 0.6 | GO:0097225 | sperm midpiece(GO:0097225) |
| 0.0 | 1.6 | GO:0033017 | sarcoplasmic reticulum membrane(GO:0033017) |
| 0.0 | 1.8 | GO:0045271 | mitochondrial respiratory chain complex I(GO:0005747) NADH dehydrogenase complex(GO:0030964) respiratory chain complex I(GO:0045271) |
| 0.0 | 8.0 | GO:0030018 | Z disc(GO:0030018) |
| 0.0 | 0.3 | GO:0005750 | mitochondrial respiratory chain complex III(GO:0005750) respiratory chain complex III(GO:0045275) |
| 0.0 | 1.1 | GO:0034364 | high-density lipoprotein particle(GO:0034364) |
| 0.0 | 0.1 | GO:0071821 | FANCM-MHF complex(GO:0071821) |
| 0.0 | 3.4 | GO:0005796 | Golgi lumen(GO:0005796) |
| 0.0 | 0.9 | GO:0005640 | nuclear outer membrane(GO:0005640) |
| 0.0 | 0.1 | GO:0005846 | nuclear cap binding complex(GO:0005846) |
| 0.0 | 0.4 | GO:0097433 | dense body(GO:0097433) |
| 0.0 | 0.8 | GO:0000421 | autophagosome membrane(GO:0000421) |
| 0.0 | 0.4 | GO:0017146 | NMDA selective glutamate receptor complex(GO:0017146) |
| 0.0 | 0.1 | GO:0097524 | sperm plasma membrane(GO:0097524) |
| 0.0 | 2.6 | GO:0005882 | intermediate filament(GO:0005882) |
| 0.0 | 0.1 | GO:0071942 | XPC complex(GO:0071942) |
| 0.0 | 0.9 | GO:0005782 | peroxisomal matrix(GO:0005782) microbody lumen(GO:0031907) |
| 0.0 | 1.4 | GO:0031463 | Cul3-RING ubiquitin ligase complex(GO:0031463) |
| 0.0 | 0.3 | GO:0044300 | cerebellar mossy fiber(GO:0044300) |
| 0.0 | 0.2 | GO:0005587 | collagen type IV trimer(GO:0005587) |
| 0.0 | 0.1 | GO:0070826 | paraferritin complex(GO:0070826) |
| 0.0 | 1.0 | GO:0031526 | brush border membrane(GO:0031526) |
| 0.0 | 0.7 | GO:0009295 | nucleoid(GO:0009295) mitochondrial nucleoid(GO:0042645) |
| 0.0 | 0.9 | GO:0008023 | transcription elongation factor complex(GO:0008023) |
Gene overrepresentation in molecular function category:
| Log-likelihood per target | Total log-likelihood | Term | Description |
|---|---|---|---|
| 0.6 | 1.9 | GO:0004613 | phosphoenolpyruvate carboxykinase activity(GO:0004611) phosphoenolpyruvate carboxykinase (GTP) activity(GO:0004613) |
| 0.6 | 1.9 | GO:0004411 | homogentisate 1,2-dioxygenase activity(GO:0004411) |
| 0.6 | 1.9 | GO:0004500 | dopamine beta-monooxygenase activity(GO:0004500) |
| 0.6 | 3.5 | GO:0060230 | lipoprotein lipase activator activity(GO:0060230) |
| 0.3 | 0.9 | GO:0003973 | (S)-2-hydroxy-acid oxidase activity(GO:0003973) very-long-chain-(S)-2-hydroxy-acid oxidase activity(GO:0052852) long-chain-(S)-2-hydroxy-long-chain-acid oxidase activity(GO:0052853) medium-chain-(S)-2-hydroxy-acid oxidase activity(GO:0052854) |
| 0.3 | 0.9 | GO:0001596 | angiotensin type I receptor activity(GO:0001596) |
| 0.3 | 0.8 | GO:1904854 | proteasome core complex binding(GO:1904854) |
| 0.3 | 4.8 | GO:0019531 | oxalate transmembrane transporter activity(GO:0019531) |
| 0.2 | 1.4 | GO:0004505 | phenylalanine 4-monooxygenase activity(GO:0004505) |
| 0.2 | 1.8 | GO:0015319 | sodium:inorganic phosphate symporter activity(GO:0015319) |
| 0.2 | 1.5 | GO:0008454 | alpha-1,3-mannosylglycoprotein 4-beta-N-acetylglucosaminyltransferase activity(GO:0008454) |
| 0.2 | 1.6 | GO:0008597 | calcium-dependent protein serine/threonine phosphatase regulator activity(GO:0008597) |
| 0.2 | 0.7 | GO:0004087 | carbamoyl-phosphate synthase (ammonia) activity(GO:0004087) carbamoyl-phosphate synthase (glutamine-hydrolyzing) activity(GO:0004088) |
| 0.2 | 1.4 | GO:0030021 | extracellular matrix structural constituent conferring compression resistance(GO:0030021) structural constituent of tooth enamel(GO:0030345) |
| 0.1 | 0.4 | GO:0019166 | 2,4-dienoyl-CoA reductase (NADPH) activity(GO:0008670) trans-2-enoyl-CoA reductase (NADPH) activity(GO:0019166) |
| 0.1 | 0.4 | GO:0008511 | sodium:potassium:chloride symporter activity(GO:0008511) |
| 0.1 | 0.8 | GO:0035276 | ethanol binding(GO:0035276) |
| 0.1 | 0.5 | GO:0030379 | neurotensin receptor activity, non-G-protein coupled(GO:0030379) |
| 0.1 | 0.6 | GO:0055077 | gap junction hemi-channel activity(GO:0055077) |
| 0.1 | 0.5 | GO:0015222 | serotonin transmembrane transporter activity(GO:0015222) |
| 0.1 | 3.6 | GO:0048018 | receptor agonist activity(GO:0048018) |
| 0.1 | 0.4 | GO:0015375 | glycine:sodium symporter activity(GO:0015375) |
| 0.1 | 4.3 | GO:0008093 | cytoskeletal adaptor activity(GO:0008093) |
| 0.1 | 0.3 | GO:0047225 | acetylgalactosaminyl-O-glycosyl-glycoprotein beta-1,6-N-acetylglucosaminyltransferase activity(GO:0047225) |
| 0.1 | 0.5 | GO:0048101 | calcium- and calmodulin-regulated 3',5'-cyclic-GMP phosphodiesterase activity(GO:0048101) |
| 0.1 | 0.3 | GO:0004108 | citrate (Si)-synthase activity(GO:0004108) citrate synthase activity(GO:0036440) |
| 0.1 | 0.6 | GO:0015321 | sodium-dependent phosphate transmembrane transporter activity(GO:0015321) |
| 0.1 | 3.2 | GO:0051371 | muscle alpha-actinin binding(GO:0051371) |
| 0.1 | 0.5 | GO:0042030 | ATPase inhibitor activity(GO:0042030) |
| 0.1 | 1.0 | GO:0048406 | nerve growth factor binding(GO:0048406) |
| 0.1 | 0.8 | GO:0008131 | primary amine oxidase activity(GO:0008131) |
| 0.1 | 0.7 | GO:0001849 | complement component C1q binding(GO:0001849) |
| 0.1 | 0.4 | GO:0035515 | oxidative RNA demethylase activity(GO:0035515) |
| 0.1 | 0.2 | GO:0008502 | melatonin receptor activity(GO:0008502) |
| 0.1 | 0.4 | GO:0042392 | sphingosine-1-phosphate phosphatase activity(GO:0042392) |
| 0.1 | 0.9 | GO:0050692 | DBD domain binding(GO:0050692) |
| 0.1 | 0.6 | GO:0015016 | [heparan sulfate]-glucosamine N-sulfotransferase activity(GO:0015016) |
| 0.1 | 0.4 | GO:0008113 | peptide-methionine (S)-S-oxide reductase activity(GO:0008113) |
| 0.1 | 0.4 | GO:0047298 | 4-aminobutyrate transaminase activity(GO:0003867) succinate-semialdehyde dehydrogenase binding(GO:0032145) (S)-3-amino-2-methylpropionate transaminase activity(GO:0047298) |
| 0.1 | 0.3 | GO:0017098 | sulfonylurea receptor binding(GO:0017098) |
| 0.1 | 0.5 | GO:0031962 | mineralocorticoid receptor binding(GO:0031962) |
| 0.1 | 0.4 | GO:0004301 | epoxide hydrolase activity(GO:0004301) |
| 0.1 | 1.5 | GO:0034185 | apolipoprotein binding(GO:0034185) |
| 0.1 | 0.2 | GO:0071885 | N-terminal protein N-methyltransferase activity(GO:0071885) |
| 0.1 | 0.1 | GO:0008271 | secondary active sulfate transmembrane transporter activity(GO:0008271) |
| 0.1 | 0.2 | GO:0016716 | oxidoreductase activity, acting on paired donors, with incorporation or reduction of molecular oxygen, another compound as one donor, and incorporation of one atom of oxygen(GO:0016716) |
| 0.0 | 1.1 | GO:0033038 | bitter taste receptor activity(GO:0033038) |
| 0.0 | 2.3 | GO:0000146 | microfilament motor activity(GO:0000146) |
| 0.0 | 0.2 | GO:1990430 | extracellular matrix protein binding(GO:1990430) |
| 0.0 | 0.5 | GO:0038085 | vascular endothelial growth factor binding(GO:0038085) |
| 0.0 | 1.5 | GO:0016676 | cytochrome-c oxidase activity(GO:0004129) heme-copper terminal oxidase activity(GO:0015002) oxidoreductase activity, acting on a heme group of donors, oxygen as acceptor(GO:0016676) |
| 0.0 | 3.0 | GO:0005160 | transforming growth factor beta receptor binding(GO:0005160) |
| 0.0 | 0.9 | GO:0004745 | retinol dehydrogenase activity(GO:0004745) |
| 0.0 | 0.2 | GO:0004597 | peptide-aspartate beta-dioxygenase activity(GO:0004597) |
| 0.0 | 0.6 | GO:0047144 | 2-acylglycerol-3-phosphate O-acyltransferase activity(GO:0047144) |
| 0.0 | 0.2 | GO:0004991 | parathyroid hormone receptor activity(GO:0004991) |
| 0.0 | 0.3 | GO:0030160 | GKAP/Homer scaffold activity(GO:0030160) |
| 0.0 | 0.2 | GO:0032422 | purine-rich negative regulatory element binding(GO:0032422) |
| 0.0 | 0.5 | GO:0001591 | dopamine neurotransmitter receptor activity, coupled via Gi/Go(GO:0001591) |
| 0.0 | 1.2 | GO:0017166 | vinculin binding(GO:0017166) |
| 0.0 | 0.1 | GO:0031780 | corticotropin hormone receptor binding(GO:0031780) type 5 melanocortin receptor binding(GO:0031783) |
| 0.0 | 2.0 | GO:0008137 | NADH dehydrogenase (ubiquinone) activity(GO:0008137) NADH dehydrogenase (quinone) activity(GO:0050136) |
| 0.0 | 0.3 | GO:0016681 | ubiquinol-cytochrome-c reductase activity(GO:0008121) oxidoreductase activity, acting on diphenols and related substances as donors, cytochrome as acceptor(GO:0016681) |
| 0.0 | 10.2 | GO:0044325 | ion channel binding(GO:0044325) |
| 0.0 | 0.1 | GO:0097689 | iron channel activity(GO:0097689) |
| 0.0 | 0.2 | GO:0004652 | polynucleotide adenylyltransferase activity(GO:0004652) |
| 0.0 | 0.9 | GO:0008190 | eukaryotic initiation factor 4E binding(GO:0008190) |
| 0.0 | 0.3 | GO:0039706 | co-receptor binding(GO:0039706) |
| 0.0 | 0.9 | GO:0004859 | phospholipase inhibitor activity(GO:0004859) |
| 0.0 | 0.3 | GO:0097322 | 7SK snRNA binding(GO:0097322) |
| 0.0 | 0.4 | GO:0035005 | 1-phosphatidylinositol-4-phosphate 3-kinase activity(GO:0035005) |
| 0.0 | 0.7 | GO:0001608 | G-protein coupled nucleotide receptor activity(GO:0001608) G-protein coupled purinergic nucleotide receptor activity(GO:0045028) |
| 0.0 | 0.5 | GO:0010314 | phosphatidylinositol-5-phosphate binding(GO:0010314) |
| 0.0 | 0.1 | GO:0035248 | alpha-1,4-N-acetylgalactosaminyltransferase activity(GO:0035248) |
| 0.0 | 0.5 | GO:0042975 | peroxisome proliferator activated receptor binding(GO:0042975) |
| 0.0 | 0.2 | GO:0035662 | Toll-like receptor 4 binding(GO:0035662) |
| 0.0 | 0.7 | GO:0045499 | chemorepellent activity(GO:0045499) |
| 0.0 | 0.1 | GO:0016608 | growth hormone-releasing hormone activity(GO:0016608) |
| 0.0 | 0.1 | GO:0000035 | acyl binding(GO:0000035) |
| 0.0 | 0.5 | GO:0015125 | bile acid transmembrane transporter activity(GO:0015125) |
| 0.0 | 0.4 | GO:0005149 | interleukin-1 receptor binding(GO:0005149) |
| 0.0 | 0.5 | GO:0071855 | neuropeptide receptor binding(GO:0071855) |
| 0.0 | 1.1 | GO:0042805 | actinin binding(GO:0042805) |
| 0.0 | 2.6 | GO:0005201 | extracellular matrix structural constituent(GO:0005201) |
| 0.0 | 0.9 | GO:0051428 | peptide hormone receptor binding(GO:0051428) |
| 0.0 | 0.2 | GO:0034056 | estrogen response element binding(GO:0034056) |
| 0.0 | 0.1 | GO:0016524 | latrotoxin receptor activity(GO:0016524) |
| 0.0 | 0.2 | GO:0047961 | glycine N-acyltransferase activity(GO:0047961) |
| 0.0 | 0.8 | GO:0000993 | RNA polymerase II core binding(GO:0000993) |
| 0.0 | 0.5 | GO:0034237 | protein kinase A regulatory subunit binding(GO:0034237) |
| 0.0 | 0.4 | GO:0044213 | intronic transcription regulatory region sequence-specific DNA binding(GO:0001161) intronic transcription regulatory region DNA binding(GO:0044213) |
| 0.0 | 0.5 | GO:0080025 | phosphatidylinositol-3,5-bisphosphate binding(GO:0080025) |
| 0.0 | 0.2 | GO:0004977 | melanocortin receptor activity(GO:0004977) |
| 0.0 | 0.1 | GO:0050501 | hyaluronan synthase activity(GO:0050501) |
| 0.0 | 0.5 | GO:0030247 | pattern binding(GO:0001871) polysaccharide binding(GO:0030247) |
| 0.0 | 0.6 | GO:0017081 | chloride channel regulator activity(GO:0017081) |
| 0.0 | 0.6 | GO:0005159 | insulin-like growth factor receptor binding(GO:0005159) |
| 0.0 | 1.3 | GO:0015078 | hydrogen ion transmembrane transporter activity(GO:0015078) |
| 0.0 | 0.1 | GO:0004802 | transketolase activity(GO:0004802) |
| 0.0 | 0.1 | GO:0004800 | thyroxine 5'-deiodinase activity(GO:0004800) |
| 0.0 | 0.1 | GO:0004704 | NF-kappaB-inducing kinase activity(GO:0004704) |
| 0.0 | 0.2 | GO:0003688 | DNA replication origin binding(GO:0003688) |
| 0.0 | 0.1 | GO:0005173 | stem cell factor receptor binding(GO:0005173) |
| 0.0 | 0.4 | GO:0001223 | transcription coactivator binding(GO:0001223) |
| 0.0 | 0.6 | GO:0019198 | transmembrane receptor protein tyrosine phosphatase activity(GO:0005001) transmembrane receptor protein phosphatase activity(GO:0019198) |
| 0.0 | 0.6 | GO:0019706 | protein-cysteine S-palmitoyltransferase activity(GO:0019706) protein-cysteine S-acyltransferase activity(GO:0019707) |
| 0.0 | 3.4 | GO:0001078 | transcriptional repressor activity, RNA polymerase II core promoter proximal region sequence-specific binding(GO:0001078) |
| 0.0 | 0.3 | GO:0050811 | GABA receptor binding(GO:0050811) |
| 0.0 | 0.2 | GO:0070324 | thyroid hormone binding(GO:0070324) |
| 0.0 | 3.7 | GO:0004984 | olfactory receptor activity(GO:0004984) |
| 0.0 | 1.9 | GO:0016779 | nucleotidyltransferase activity(GO:0016779) |
| 0.0 | 0.3 | GO:0043548 | phosphatidylinositol 3-kinase binding(GO:0043548) |
| 0.0 | 0.3 | GO:0004115 | 3',5'-cyclic-AMP phosphodiesterase activity(GO:0004115) |
Gene overrepresentation in curated gene sets: canonical pathways category:
| Log-likelihood per target | Total log-likelihood | Term | Description |
|---|---|---|---|
| 0.1 | 2.7 | PID ALK1 PATHWAY | ALK1 signaling events |
| 0.0 | 3.1 | PID AMB2 NEUTROPHILS PATHWAY | amb2 Integrin signaling |
| 0.0 | 1.6 | PID P38 MK2 PATHWAY | p38 signaling mediated by MAPKAP kinases |
| 0.0 | 1.5 | ST MYOCYTE AD PATHWAY | Myocyte Adrenergic Pathway is a specific case of the generalized Adrenergic Pathway. |
| 0.0 | 1.6 | PID UPA UPAR PATHWAY | Urokinase-type plasminogen activator (uPA) and uPAR-mediated signaling |
| 0.0 | 0.5 | PID VEGF VEGFR PATHWAY | VEGF and VEGFR signaling network |
| 0.0 | 0.4 | ST INTERFERON GAMMA PATHWAY | Interferon gamma pathway. |
| 0.0 | 1.3 | PID TCR CALCIUM PATHWAY | Calcium signaling in the CD4+ TCR pathway |
| 0.0 | 1.6 | PID HNF3B PATHWAY | FOXA2 and FOXA3 transcription factor networks |
| 0.0 | 0.7 | PID INSULIN GLUCOSE PATHWAY | Insulin-mediated glucose transport |
| 0.0 | 0.3 | PID ERB GENOMIC PATHWAY | Validated nuclear estrogen receptor beta network |
| 0.0 | 2.1 | PID REG GR PATHWAY | Glucocorticoid receptor regulatory network |
| 0.0 | 2.1 | SIG PIP3 SIGNALING IN CARDIAC MYOCTES | Genes related to PIP3 signaling in cardiac myocytes |
| 0.0 | 1.5 | PID P75 NTR PATHWAY | p75(NTR)-mediated signaling |
| 0.0 | 0.9 | NABA PROTEOGLYCANS | Genes encoding proteoglycans |
| 0.0 | 0.6 | PID HEDGEHOG 2PATHWAY | Signaling events mediated by the Hedgehog family |
| 0.0 | 0.5 | PID SMAD2 3PATHWAY | Regulation of cytoplasmic and nuclear SMAD2/3 signaling |
| 0.0 | 0.2 | NABA BASEMENT MEMBRANES | Genes encoding structural components of basement membranes |
| 0.0 | 1.6 | PID AR PATHWAY | Coregulation of Androgen receptor activity |
| 0.0 | 2.1 | PID BETA CATENIN NUC PATHWAY | Regulation of nuclear beta catenin signaling and target gene transcription |
| 0.0 | 0.3 | PID CIRCADIAN PATHWAY | Circadian rhythm pathway |
| 0.0 | 1.1 | PID AVB3 INTEGRIN PATHWAY | Integrins in angiogenesis |
| 0.0 | 0.4 | ST DIFFERENTIATION PATHWAY IN PC12 CELLS | Differentiation Pathway in PC12 Cells; this is a specific case of PAC1 Receptor Pathway. |
| 0.0 | 0.9 | PID ARF6 TRAFFICKING PATHWAY | Arf6 trafficking events |
| 0.0 | 1.0 | PID CDC42 REG PATHWAY | Regulation of CDC42 activity |
| 0.0 | 3.4 | NABA ECM GLYCOPROTEINS | Genes encoding structural ECM glycoproteins |
Gene overrepresentation in curated gene sets: REACTOME pathways category:
| Log-likelihood per target | Total log-likelihood | Term | Description |
|---|---|---|---|
| 0.2 | 2.2 | REACTOME GLYCOPROTEIN HORMONES | Genes involved in Glycoprotein hormones |
| 0.1 | 1.8 | REACTOME ABACAVIR TRANSPORT AND METABOLISM | Genes involved in Abacavir transport and metabolism |
| 0.1 | 1.7 | REACTOME COMMON PATHWAY | Genes involved in Common Pathway |
| 0.1 | 1.9 | REACTOME AMINE DERIVED HORMONES | Genes involved in Amine-derived hormones |
| 0.1 | 1.0 | REACTOME GAMMA CARBOXYLATION TRANSPORT AND AMINO TERMINAL CLEAVAGE OF PROTEINS | Genes involved in Gamma-carboxylation, transport, and amino-terminal cleavage of proteins |
| 0.0 | 0.8 | REACTOME ACTIVATION OF CHAPERONE GENES BY ATF6 ALPHA | Genes involved in Activation of Chaperone Genes by ATF6-alpha |
| 0.0 | 0.9 | REACTOME NA CL DEPENDENT NEUROTRANSMITTER TRANSPORTERS | Genes involved in Na+/Cl- dependent neurotransmitter transporters |
| 0.0 | 0.8 | REACTOME ETHANOL OXIDATION | Genes involved in Ethanol oxidation |
| 0.0 | 1.1 | REACTOME CHYLOMICRON MEDIATED LIPID TRANSPORT | Genes involved in Chylomicron-mediated lipid transport |
| 0.0 | 1.2 | REACTOME SEMA3A PLEXIN REPULSION SIGNALING BY INHIBITING INTEGRIN ADHESION | Genes involved in SEMA3A-Plexin repulsion signaling by inhibiting Integrin adhesion |
| 0.0 | 1.3 | REACTOME N GLYCAN ANTENNAE ELONGATION | Genes involved in N-Glycan antennae elongation |
| 0.0 | 0.8 | REACTOME TRANSPORT OF ORGANIC ANIONS | Genes involved in Transport of organic anions |
| 0.0 | 1.1 | REACTOME TERMINATION OF O GLYCAN BIOSYNTHESIS | Genes involved in Termination of O-glycan biosynthesis |
| 0.0 | 6.5 | REACTOME TRANSPORT OF INORGANIC CATIONS ANIONS AND AMINO ACIDS OLIGOPEPTIDES | Genes involved in Transport of inorganic cations/anions and amino acids/oligopeptides |
| 0.0 | 0.8 | REACTOME REGULATION OF INSULIN LIKE GROWTH FACTOR IGF ACTIVITY BY INSULIN LIKE GROWTH FACTOR BINDING PROTEINS IGFBPS | Genes involved in Regulation of Insulin-like Growth Factor (IGF) Activity by Insulin-like Growth Factor Binding Proteins (IGFBPs) |
| 0.0 | 4.3 | REACTOME CLASS B 2 SECRETIN FAMILY RECEPTORS | Genes involved in Class B/2 (Secretin family receptors) |
| 0.0 | 0.6 | REACTOME ACYL CHAIN REMODELLING OF PG | Genes involved in Acyl chain remodelling of PG |
| 0.0 | 0.7 | REACTOME NOREPINEPHRINE NEUROTRANSMITTER RELEASE CYCLE | Genes involved in Norepinephrine Neurotransmitter Release Cycle |
| 0.0 | 0.4 | REACTOME GABA SYNTHESIS RELEASE REUPTAKE AND DEGRADATION | Genes involved in GABA synthesis, release, reuptake and degradation |
| 0.0 | 1.4 | REACTOME STRIATED MUSCLE CONTRACTION | Genes involved in Striated Muscle Contraction |
| 0.0 | 0.8 | REACTOME HORMONE SENSITIVE LIPASE HSL MEDIATED TRIACYLGLYCEROL HYDROLYSIS | Genes involved in Hormone-sensitive lipase (HSL)-mediated triacylglycerol hydrolysis |
| 0.0 | 0.3 | REACTOME LIPOPROTEIN METABOLISM | Genes involved in Lipoprotein metabolism |
| 0.0 | 4.9 | REACTOME METABOLISM OF AMINO ACIDS AND DERIVATIVES | Genes involved in Metabolism of amino acids and derivatives |
| 0.0 | 0.8 | REACTOME CGMP EFFECTS | Genes involved in cGMP effects |
| 0.0 | 0.6 | REACTOME HS GAG BIOSYNTHESIS | Genes involved in HS-GAG biosynthesis |
| 0.0 | 0.3 | REACTOME SOS MEDIATED SIGNALLING | Genes involved in SOS-mediated signalling |
| 0.0 | 0.5 | REACTOME SIGNALING BY HIPPO | Genes involved in Signaling by Hippo |
| 0.0 | 0.2 | REACTOME CREATION OF C4 AND C2 ACTIVATORS | Genes involved in Creation of C4 and C2 activators |
| 0.0 | 0.6 | REACTOME TIGHT JUNCTION INTERACTIONS | Genes involved in Tight junction interactions |
| 0.0 | 0.4 | REACTOME COMPLEMENT CASCADE | Genes involved in Complement cascade |
| 0.0 | 0.4 | REACTOME SYNTHESIS OF PIPS AT THE GOLGI MEMBRANE | Genes involved in Synthesis of PIPs at the Golgi membrane |
| 0.0 | 0.5 | REACTOME SIGNALING BY NODAL | Genes involved in Signaling by NODAL |
| 0.0 | 0.3 | REACTOME REGULATION OF RHEB GTPASE ACTIVITY BY AMPK | Genes involved in Regulation of Rheb GTPase activity by AMPK |
| 0.0 | 0.3 | REACTOME CITRIC ACID CYCLE TCA CYCLE | Genes involved in Citric acid cycle (TCA cycle) |