Project
Illumina Body Map 2 (GSE30611)
Navigation
Downloads
Results for OLIG1
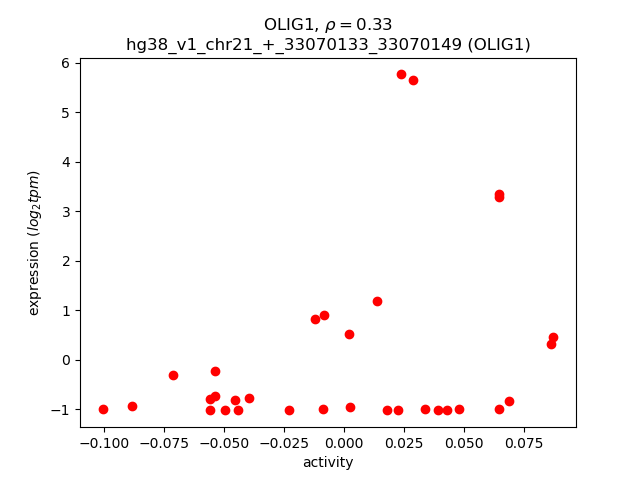
Z-value: 1.22
Motif logo
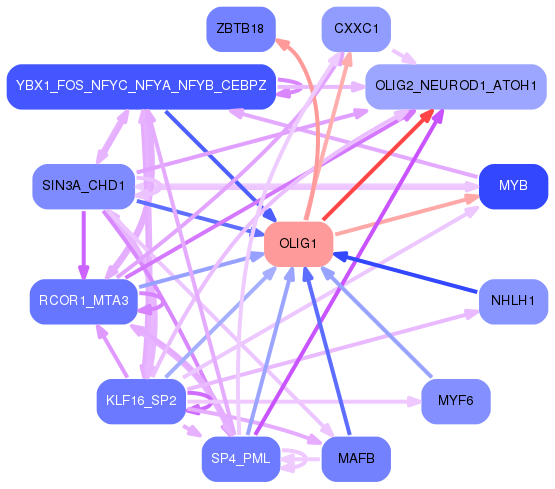
Transcription factors associated with OLIG1
| Gene Symbol | Gene ID | Gene Info |
|---|---|---|
|
OLIG1
|
ENSG00000184221.13 | oligodendrocyte transcription factor 1 |
Activity-expression correlation:
| Gene | Promoter | Pearson corr. coef. | P-value | Plot |
|---|---|---|---|---|
| OLIG1 | hg38_v1_chr21_+_33070133_33070149 | 0.33 | 6.2e-02 | Click! |
Activity profile of OLIG1 motif
Sorted Z-values of OLIG1 motif
| Promoter | Log-likelihood | Transcript | Gene | Gene Info |
|---|---|---|---|---|
| chr2_-_157439403 | 4.95 |
ENST00000418920.5
|
CYTIP
|
cytohesin 1 interacting protein |
| chr14_-_106038355 | 4.20 |
ENST00000390597.3
|
IGHV2-5
|
immunoglobulin heavy variable 2-5 |
| chr14_-_106803221 | 3.78 |
ENST00000390636.2
|
IGHV3-73
|
immunoglobulin heavy variable 3-73 |
| chr2_-_181680490 | 3.52 |
ENST00000684145.1
ENST00000295108.4 ENST00000684079.1 ENST00000683430.1 |
CERKL
NEUROD1
|
ceramide kinase like neuronal differentiation 1 |
| chr2_-_157488829 | 3.52 |
ENST00000435117.1
ENST00000439355.5 |
CYTIP
|
cytohesin 1 interacting protein |
| chr19_-_11339573 | 3.23 |
ENST00000222120.8
|
RAB3D
|
RAB3D, member RAS oncogene family |
| chr11_+_65638085 | 3.05 |
ENST00000534313.6
ENST00000533361.1 ENST00000526137.1 |
SIPA1
|
signal-induced proliferation-associated 1 |
| chr11_+_118304721 | 2.89 |
ENST00000361763.9
|
CD3E
|
CD3e molecule |
| chr11_+_118304881 | 2.85 |
ENST00000528600.1
|
CD3E
|
CD3e molecule |
| chr5_-_170297746 | 2.82 |
ENST00000046794.10
|
LCP2
|
lymphocyte cytosolic protein 2 |
| chr2_+_89947508 | 2.77 |
ENST00000491977.1
|
IGKV2D-29
|
immunoglobulin kappa variable 2D-29 |
| chr4_-_38782970 | 2.73 |
ENST00000502321.5
ENST00000308973.9 ENST00000613579.4 ENST00000361424.6 ENST00000622002.4 |
TLR10
|
toll like receptor 10 |
| chr11_+_60396451 | 2.70 |
ENST00000300187.11
ENST00000526375.5 ENST00000531783.5 |
MS4A14
|
membrane spanning 4-domains A14 |
| chr12_+_6789508 | 2.70 |
ENST00000011653.9
ENST00000541982.5 ENST00000539492.1 |
CD4
|
CD4 molecule |
| chr7_+_142618821 | 2.63 |
ENST00000390393.3
|
TRBV19
|
T cell receptor beta variable 19 |
| chr7_-_38363476 | 2.54 |
ENST00000426402.2
|
TRGV2
|
T cell receptor gamma variable 2 |
| chr19_+_18097763 | 2.51 |
ENST00000262811.10
|
MAST3
|
microtubule associated serine/threonine kinase 3 |
| chr19_-_54364983 | 2.43 |
ENST00000434277.6
|
LAIR1
|
leukocyte associated immunoglobulin like receptor 1 |
| chr5_+_157180816 | 2.42 |
ENST00000422843.8
|
ITK
|
IL2 inducible T cell kinase |
| chr12_-_7936177 | 2.39 |
ENST00000544291.1
ENST00000075120.12 |
SLC2A3
|
solute carrier family 2 member 3 |
| chr2_+_190927649 | 2.34 |
ENST00000409428.5
ENST00000409215.5 |
GLS
|
glutaminase |
| chr11_+_60396435 | 2.18 |
ENST00000395005.6
|
MS4A14
|
membrane spanning 4-domains A14 |
| chr1_+_9651723 | 2.15 |
ENST00000377346.9
ENST00000536656.5 ENST00000628140.2 |
PIK3CD
|
phosphatidylinositol-4,5-bisphosphate 3-kinase catalytic subunit delta |
| chr22_+_37282464 | 2.12 |
ENST00000402997.5
ENST00000405206.3 ENST00000248901.11 |
CYTH4
|
cytohesin 4 |
| chr1_-_160579439 | 2.11 |
ENST00000368054.8
ENST00000368048.7 ENST00000311224.8 ENST00000368051.3 ENST00000534968.5 |
CD84
|
CD84 molecule |
| chr14_-_106025628 | 2.11 |
ENST00000631943.1
|
IGHV7-4-1
|
immunoglobulin heavy variable 7-4-1 |
| chr6_+_31586124 | 2.10 |
ENST00000418507.6
ENST00000376096.5 ENST00000376099.5 ENST00000376110.7 |
LST1
|
leukocyte specific transcript 1 |
| chr16_+_11965193 | 2.10 |
ENST00000053243.6
ENST00000396495.3 |
TNFRSF17
|
TNF receptor superfamily member 17 |
| chr15_+_88635626 | 2.06 |
ENST00000379224.10
|
ISG20
|
interferon stimulated exonuclease gene 20 |
| chr8_-_100712761 | 2.06 |
ENST00000517403.5
|
PABPC1
|
poly(A) binding protein cytoplasmic 1 |
| chr2_-_174598206 | 2.06 |
ENST00000392546.6
ENST00000436221.1 |
WIPF1
|
WAS/WASL interacting protein family member 1 |
| chr2_-_32265732 | 2.04 |
ENST00000360906.9
ENST00000342905.10 |
NLRC4
|
NLR family CARD domain containing 4 |
| chr5_+_147878703 | 2.00 |
ENST00000296694.5
|
SCGB3A2
|
secretoglobin family 3A member 2 |
| chr13_-_99258366 | 1.98 |
ENST00000397470.5
ENST00000397473.7 |
GPR18
|
G protein-coupled receptor 18 |
| chr7_-_26995237 | 1.98 |
ENST00000432747.1
|
SKAP2
|
src kinase associated phosphoprotein 2 |
| chr20_-_64079906 | 1.96 |
ENST00000332298.9
|
RGS19
|
regulator of G protein signaling 19 |
| chr14_+_22207502 | 1.95 |
ENST00000390461.2
|
TRAV34
|
T cell receptor alpha variable 34 |
| chrX_-_19799751 | 1.89 |
ENST00000379698.8
|
SH3KBP1
|
SH3 domain containing kinase binding protein 1 |
| chr6_-_111793871 | 1.88 |
ENST00000368667.6
|
FYN
|
FYN proto-oncogene, Src family tyrosine kinase |
| chr3_-_121660892 | 1.84 |
ENST00000428394.6
ENST00000314583.8 |
HCLS1
|
hematopoietic cell-specific Lyn substrate 1 |
| chr3_+_137998735 | 1.79 |
ENST00000343735.8
|
CLDN18
|
claudin 18 |
| chr10_+_26438317 | 1.73 |
ENST00000376236.9
|
APBB1IP
|
amyloid beta precursor protein binding family B member 1 interacting protein |
| chr3_+_113532508 | 1.68 |
ENST00000264852.9
|
SIDT1
|
SID1 transmembrane family member 1 |
| chrX_+_135520616 | 1.67 |
ENST00000370752.4
ENST00000639893.2 |
INTS6L
|
integrator complex subunit 6 like |
| chr19_-_54281145 | 1.66 |
ENST00000434421.5
ENST00000391749.4 |
LILRB2
|
leukocyte immunoglobulin like receptor B2 |
| chr7_+_114922854 | 1.64 |
ENST00000423503.1
ENST00000427207.5 |
MDFIC
|
MyoD family inhibitor domain containing |
| chr1_+_91501097 | 1.63 |
ENST00000428239.5
ENST00000426137.1 |
CDC7
|
cell division cycle 7 |
| chr6_+_31586269 | 1.60 |
ENST00000438075.7
|
LST1
|
leukocyte specific transcript 1 |
| chr12_+_9971402 | 1.56 |
ENST00000304361.9
ENST00000396507.7 ENST00000434319.6 |
CLEC12A
|
C-type lectin domain family 12 member A |
| chr22_+_22747383 | 1.56 |
ENST00000390311.3
|
IGLV3-16
|
immunoglobulin lambda variable 3-16 |
| chr19_-_38878247 | 1.55 |
ENST00000591812.2
|
RINL
|
Ras and Rab interactor like |
| chr12_-_39619782 | 1.55 |
ENST00000308666.4
|
ABCD2
|
ATP binding cassette subfamily D member 2 |
| chr4_+_73853290 | 1.55 |
ENST00000226524.4
|
PF4V1
|
platelet factor 4 variant 1 |
| chr4_-_158173004 | 1.54 |
ENST00000585682.6
|
GASK1B
|
golgi associated kinase 1B |
| chrX_+_65667645 | 1.52 |
ENST00000360270.7
|
MSN
|
moesin |
| chr17_-_49209367 | 1.51 |
ENST00000300406.6
ENST00000511277.5 ENST00000511673.1 |
GNGT2
|
G protein subunit gamma transducin 2 |
| chr14_+_88005128 | 1.49 |
ENST00000267549.5
|
GPR65
|
G protein-coupled receptor 65 |
| chr13_+_49628489 | 1.48 |
ENST00000282026.2
|
ARL11
|
ADP ribosylation factor like GTPase 11 |
| chr11_+_60056587 | 1.48 |
ENST00000395032.6
ENST00000358152.6 |
MS4A3
|
membrane spanning 4-domains A3 |
| chr19_-_54281082 | 1.46 |
ENST00000314446.10
|
LILRB2
|
leukocyte immunoglobulin like receptor B2 |
| chr1_+_91500827 | 1.45 |
ENST00000234626.11
|
CDC7
|
cell division cycle 7 |
| chrX_+_108045050 | 1.45 |
ENST00000458383.1
ENST00000217957.10 |
VSIG1
|
V-set and immunoglobulin domain containing 1 |
| chr7_-_22193728 | 1.42 |
ENST00000620335.4
|
RAPGEF5
|
Rap guanine nucleotide exchange factor 5 |
| chr2_-_227717981 | 1.42 |
ENST00000409456.2
ENST00000409287.5 ENST00000644224.2 ENST00000456524.6 |
SLC19A3
|
solute carrier family 19 member 3 |
| chr12_-_10849464 | 1.40 |
ENST00000544994.5
ENST00000228811.8 ENST00000540107.2 |
PRR4
|
proline rich 4 |
| chr15_+_76995118 | 1.40 |
ENST00000558012.6
ENST00000379595.7 |
PSTPIP1
|
proline-serine-threonine phosphatase interacting protein 1 |
| chr3_-_39280432 | 1.38 |
ENST00000542107.5
ENST00000435290.1 |
CX3CR1
|
C-X3-C motif chemokine receptor 1 |
| chr3_-_39281261 | 1.36 |
ENST00000541347.5
ENST00000412814.1 |
CX3CR1
|
C-X3-C motif chemokine receptor 1 |
| chr10_-_95656643 | 1.32 |
ENST00000371221.3
ENST00000371224.7 |
ALDH18A1
|
aldehyde dehydrogenase 18 family member A1 |
| chr8_-_38382146 | 1.32 |
ENST00000534155.1
ENST00000433384.6 ENST00000317025.13 ENST00000316985.7 |
NSD3
|
nuclear receptor binding SET domain protein 3 |
| chr1_+_244051275 | 1.32 |
ENST00000358704.4
|
ZBTB18
|
zinc finger and BTB domain containing 18 |
| chr16_+_11965234 | 1.30 |
ENST00000562385.1
|
TNFRSF17
|
TNF receptor superfamily member 17 |
| chr7_-_24918080 | 1.29 |
ENST00000441059.5
ENST00000415162.5 |
OSBPL3
|
oxysterol binding protein like 3 |
| chr1_+_158930778 | 1.28 |
ENST00000458222.5
|
PYHIN1
|
pyrin and HIN domain family member 1 |
| chr2_+_151357583 | 1.25 |
ENST00000243347.5
|
TNFAIP6
|
TNF alpha induced protein 6 |
| chr19_-_43667666 | 1.24 |
ENST00000593714.5
|
PLAUR
|
plasminogen activator, urokinase receptor |
| chr9_-_115118145 | 1.23 |
ENST00000350763.9
|
TNC
|
tenascin C |
| chr11_-_44950867 | 1.19 |
ENST00000528290.5
ENST00000525680.6 ENST00000530035.5 ENST00000527685.5 |
TP53I11
|
tumor protein p53 inducible protein 11 |
| chr5_-_177554545 | 1.17 |
ENST00000514747.6
|
FAM193B
|
family with sequence similarity 193 member B |
| chr4_-_158173042 | 1.15 |
ENST00000592057.1
ENST00000393807.9 |
GASK1B
|
golgi associated kinase 1B |
| chr2_+_218245426 | 1.13 |
ENST00000456575.1
|
ARPC2
|
actin related protein 2/3 complex subunit 2 |
| chr5_+_69189536 | 1.12 |
ENST00000515001.5
ENST00000283006.7 ENST00000502689.1 |
CENPH
|
centromere protein H |
| chr1_+_6034980 | 1.10 |
ENST00000378092.6
ENST00000472700.7 |
KCNAB2
|
potassium voltage-gated channel subfamily A regulatory beta subunit 2 |
| chr2_+_10368645 | 1.10 |
ENST00000613496.4
|
HPCAL1
|
hippocalcin like 1 |
| chr14_-_106875069 | 1.10 |
ENST00000390639.2
|
IGHV7-81
|
immunoglobulin heavy variable 7-81 (non-functional) |
| chr2_+_10368764 | 1.09 |
ENST00000620771.4
|
HPCAL1
|
hippocalcin like 1 |
| chr6_-_28923932 | 1.07 |
ENST00000377199.4
ENST00000377194.7 |
TRIM27
|
tripartite motif containing 27 |
| chr15_+_64911869 | 1.07 |
ENST00000319580.13
ENST00000496660.5 |
ANKDD1A
|
ankyrin repeat and death domain containing 1A |
| chr1_+_103750406 | 1.06 |
ENST00000370079.3
|
AMY1C
|
amylase alpha 1C |
| chr8_-_16192644 | 1.06 |
ENST00000262101.10
ENST00000381998.8 |
MSR1
|
macrophage scavenger receptor 1 |
| chr1_+_159302321 | 1.05 |
ENST00000368114.1
|
FCER1A
|
Fc fragment of IgE receptor Ia |
| chrX_+_108044967 | 1.03 |
ENST00000415430.7
|
VSIG1
|
V-set and immunoglobulin domain containing 1 |
| chr4_-_112285892 | 1.03 |
ENST00000361717.4
|
TIFA
|
TRAF interacting protein with forkhead associated domain |
| chr7_-_36985060 | 1.02 |
ENST00000396040.6
|
ELMO1
|
engulfment and cell motility 1 |
| chr12_+_54854505 | 1.00 |
ENST00000308796.11
ENST00000619042.1 |
MUCL1
|
mucin like 1 |
| chr12_-_14938508 | 0.99 |
ENST00000266397.7
|
ERP27
|
endoplasmic reticulum protein 27 |
| chr1_+_100345018 | 0.97 |
ENST00000635056.2
ENST00000647005.1 |
CDC14A
|
cell division cycle 14A |
| chr6_-_2744126 | 0.97 |
ENST00000647417.1
|
MYLK4
|
myosin light chain kinase family member 4 |
| chr4_+_8229170 | 0.96 |
ENST00000511002.6
|
SH3TC1
|
SH3 domain and tetratricopeptide repeats 1 |
| chr19_+_19458458 | 0.95 |
ENST00000358713.7
|
GATAD2A
|
GATA zinc finger domain containing 2A |
| chr6_+_135181361 | 0.95 |
ENST00000527615.5
ENST00000420123.6 ENST00000525369.5 ENST00000528774.5 ENST00000533624.5 ENST00000534044.5 ENST00000534121.5 |
MYB
|
MYB proto-oncogene, transcription factor |
| chr19_+_54906140 | 0.95 |
ENST00000291890.9
ENST00000598576.5 ENST00000594765.5 ENST00000350790.9 ENST00000338835.9 ENST00000357397.5 |
NCR1
|
natural cytotoxicity triggering receptor 1 |
| chr17_+_46713149 | 0.93 |
ENST00000576346.5
|
NSF
|
N-ethylmaleimide sensitive factor, vesicle fusing ATPase |
| chr16_+_22505845 | 0.92 |
ENST00000356156.7
|
NPIPB5
|
nuclear pore complex interacting protein family member B5 |
| chr12_+_9971512 | 0.92 |
ENST00000350667.4
|
CLEC12A
|
C-type lectin domain family 12 member A |
| chr11_-_89063631 | 0.91 |
ENST00000455756.6
|
GRM5
|
glutamate metabotropic receptor 5 |
| chr10_+_26438404 | 0.89 |
ENST00000356785.4
|
APBB1IP
|
amyloid beta precursor protein binding family B member 1 interacting protein |
| chr1_-_111427731 | 0.87 |
ENST00000369732.4
|
OVGP1
|
oviductal glycoprotein 1 |
| chr6_-_111793900 | 0.86 |
ENST00000462598.7
|
FYN
|
FYN proto-oncogene, Src family tyrosine kinase |
| chr12_+_40742342 | 0.86 |
ENST00000548005.5
ENST00000552248.5 |
CNTN1
|
contactin 1 |
| chr1_+_50103903 | 0.84 |
ENST00000371827.5
|
ELAVL4
|
ELAV like RNA binding protein 4 |
| chr3_+_150603279 | 0.83 |
ENST00000615547.4
ENST00000477889.5 ENST00000471696.6 ENST00000485923.1 |
SELENOT
|
selenoprotein T |
| chr1_+_19640520 | 0.82 |
ENST00000428975.5
|
NBL1
|
NBL1, DAN family BMP antagonist |
| chr19_+_49487510 | 0.81 |
ENST00000679106.1
ENST00000621674.4 ENST00000391857.9 ENST00000678510.1 ENST00000467825.2 |
RPL13A
|
ribosomal protein L13a |
| chr18_-_50287570 | 0.81 |
ENST00000586837.1
ENST00000412036.6 ENST00000589940.5 ENST00000587396.1 ENST00000591474.5 ENST00000285106.11 |
CXXC1
|
CXXC finger protein 1 |
| chr17_+_41689862 | 0.80 |
ENST00000586699.1
|
EIF1
|
eukaryotic translation initiation factor 1 |
| chr14_-_68978240 | 0.80 |
ENST00000556571.1
ENST00000553659.1 ENST00000555616.5 |
ACTN1
|
actinin alpha 1 |
| chr6_-_34426052 | 0.79 |
ENST00000344700.8
ENST00000644700.1 ENST00000648437.1 ENST00000644393.1 ENST00000639725.1 |
RPS10
RPS10-NUDT3
|
ribosomal protein S10 RPS10-NUDT3 readthrough |
| chr6_-_31680377 | 0.79 |
ENST00000383237.4
|
LY6G5C
|
lymphocyte antigen 6 family member G5C |
| chr1_+_147242654 | 0.78 |
ENST00000652587.1
ENST00000361293.10 ENST00000369258.8 ENST00000369259.4 ENST00000650714.1 ENST00000639534.1 |
CHD1L
|
chromodomain helicase DNA binding protein 1 like |
| chr17_-_181640 | 0.77 |
ENST00000613549.3
|
DOC2B
|
double C2 domain beta |
| chr8_-_23457618 | 0.76 |
ENST00000358689.9
ENST00000518718.1 |
ENTPD4
|
ectonucleoside triphosphate diphosphohydrolase 4 |
| chr11_-_101583985 | 0.75 |
ENST00000344327.8
|
TRPC6
|
transient receptor potential cation channel subfamily C member 6 |
| chr3_+_63652663 | 0.75 |
ENST00000343837.8
ENST00000469440.5 |
SNTN
|
sentan, cilia apical structure protein |
| chr3_-_146528750 | 0.73 |
ENST00000483300.5
|
PLSCR1
|
phospholipid scramblase 1 |
| chr12_-_108320635 | 0.72 |
ENST00000412676.5
ENST00000550573.5 |
CMKLR1
|
chemerin chemokine-like receptor 1 |
| chr1_-_19484635 | 0.72 |
ENST00000433834.5
|
CAPZB
|
capping actin protein of muscle Z-line subunit beta |
| chr3_+_9797651 | 0.71 |
ENST00000453882.1
|
ARPC4-TTLL3
|
ARPC4-TTLL3 readthrough |
| chr19_+_57389839 | 0.71 |
ENST00000366197.9
ENST00000336128.12 ENST00000596282.5 ENST00000597400.5 ENST00000598895.5 ENST00000596617.5 |
ZNF548
ENSG00000269533.5
|
zinc finger protein 548 novel transcript |
| chr17_+_68035636 | 0.71 |
ENST00000676857.1
ENST00000676594.1 ENST00000678388.1 |
KPNA2
|
karyopherin subunit alpha 2 |
| chr15_+_67067780 | 0.71 |
ENST00000679624.1
|
SMAD3
|
SMAD family member 3 |
| chrX_+_106611930 | 0.71 |
ENST00000372544.6
ENST00000372548.9 |
RADX
|
RPA1 related single stranded DNA binding protein, X-linked |
| chr3_+_62318983 | 0.70 |
ENST00000232519.9
ENST00000462069.6 ENST00000465142.5 |
C3orf14
|
chromosome 3 open reading frame 14 |
| chr9_+_5450503 | 0.70 |
ENST00000381573.8
ENST00000381577.4 |
CD274
|
CD274 molecule |
| chr15_+_51377247 | 0.70 |
ENST00000396399.6
|
GLDN
|
gliomedin |
| chr4_+_118034480 | 0.67 |
ENST00000296499.6
|
NDST3
|
N-deacetylase and N-sulfotransferase 3 |
| chr14_-_52695652 | 0.67 |
ENST00000629528.2
|
ERO1A
|
endoplasmic reticulum oxidoreductase 1 alpha |
| chrX_-_155334580 | 0.66 |
ENST00000369449.7
ENST00000321926.4 |
CLIC2
|
chloride intracellular channel 2 |
| chr3_-_108058361 | 0.65 |
ENST00000398258.7
|
CD47
|
CD47 molecule |
| chr15_+_51377410 | 0.64 |
ENST00000612989.1
|
GLDN
|
gliomedin |
| chr12_+_54000096 | 0.63 |
ENST00000303450.5
|
HOXC9
|
homeobox C9 |
| chr6_-_34426020 | 0.62 |
ENST00000621356.3
ENST00000494077.6 ENST00000639877.1 |
RPS10
RPS10-NUDT3
|
ribosomal protein S10 RPS10-NUDT3 readthrough |
| chr13_+_38349900 | 0.62 |
ENST00000437952.1
|
UFM1
|
ubiquitin fold modifier 1 |
| chr14_-_22823386 | 0.60 |
ENST00000554741.5
|
SLC7A7
|
solute carrier family 7 member 7 |
| chr6_-_69699124 | 0.60 |
ENST00000651675.1
|
LMBRD1
|
LMBR1 domain containing 1 |
| chr19_+_21142024 | 0.60 |
ENST00000600692.5
ENST00000599296.5 ENST00000594425.5 ENST00000311048.11 |
ZNF431
|
zinc finger protein 431 |
| chr6_-_130890393 | 0.59 |
ENST00000456097.6
|
EPB41L2
|
erythrocyte membrane protein band 4.1 like 2 |
| chr8_+_21966215 | 0.58 |
ENST00000433566.8
|
XPO7
|
exportin 7 |
| chr15_+_76995374 | 0.58 |
ENST00000559161.5
|
PSTPIP1
|
proline-serine-threonine phosphatase interacting protein 1 |
| chr1_+_110339323 | 0.57 |
ENST00000602849.1
ENST00000487146.8 ENST00000618772.4 ENST00000369784.9 ENST00000650953.2 ENST00000652342.2 ENST00000654015.1 |
RBM15
|
RNA binding motif protein 15 |
| chr1_+_153778178 | 0.57 |
ENST00000532853.5
|
SLC27A3
|
solute carrier family 27 member 3 |
| chr18_-_50287816 | 0.56 |
ENST00000589548.6
ENST00000673786.1 |
CXXC1
|
CXXC finger protein 1 |
| chr1_-_7940825 | 0.56 |
ENST00000377507.8
|
TNFRSF9
|
TNF receptor superfamily member 9 |
| chr6_-_31958935 | 0.56 |
ENST00000441998.5
ENST00000444811.6 ENST00000375429.8 |
NELFE
|
negative elongation factor complex member E |
| chr9_-_19786928 | 0.56 |
ENST00000341998.6
ENST00000286344.3 |
SLC24A2
|
solute carrier family 24 member 2 |
| chr17_+_47253817 | 0.55 |
ENST00000559488.7
ENST00000571680.1 |
ITGB3
|
integrin subunit beta 3 |
| chr3_-_98522514 | 0.54 |
ENST00000503004.5
ENST00000506575.1 ENST00000513452.5 ENST00000515620.5 |
CLDND1
|
claudin domain containing 1 |
| chr3_+_119579577 | 0.53 |
ENST00000478927.5
|
ADPRH
|
ADP-ribosylarginine hydrolase |
| chr9_+_18474100 | 0.53 |
ENST00000327883.11
ENST00000431052.6 ENST00000380570.8 ENST00000380548.9 |
ADAMTSL1
|
ADAMTS like 1 |
| chr6_-_31958852 | 0.53 |
ENST00000375425.9
ENST00000426722.5 |
NELFE
|
negative elongation factor complex member E |
| chr17_+_59685117 | 0.53 |
ENST00000475458.1
|
CLTC
|
clathrin heavy chain |
| chr12_-_102478539 | 0.52 |
ENST00000424202.6
|
IGF1
|
insulin like growth factor 1 |
| chr3_-_101513175 | 0.52 |
ENST00000394091.5
ENST00000394094.6 ENST00000394095.7 ENST00000348610.3 ENST00000314261.11 |
SENP7
|
SUMO specific peptidase 7 |
| chr8_-_16192772 | 0.52 |
ENST00000350896.3
|
MSR1
|
macrophage scavenger receptor 1 |
| chr14_+_22875136 | 0.52 |
ENST00000551466.1
|
LRP10
|
LDL receptor related protein 10 |
| chr17_-_49848017 | 0.52 |
ENST00000326219.5
ENST00000334568.8 ENST00000352793.6 ENST00000398154.5 ENST00000436235.5 |
TAC4
|
tachykinin precursor 4 |
| chr3_-_50350710 | 0.51 |
ENST00000232501.8
|
NPRL2
|
NPR2 like, GATOR1 complex subunit |
| chr3_+_119579433 | 0.51 |
ENST00000481816.5
|
ADPRH
|
ADP-ribosylarginine hydrolase |
| chr7_-_140479476 | 0.51 |
ENST00000443720.6
ENST00000255977.7 |
MKRN1
|
makorin ring finger protein 1 |
| chr17_-_75878542 | 0.51 |
ENST00000254816.6
|
TRIM47
|
tripartite motif containing 47 |
| chr7_+_65373839 | 0.51 |
ENST00000431504.1
ENST00000328747.12 |
ZNF92
|
zinc finger protein 92 |
| chr8_-_23457677 | 0.50 |
ENST00000356206.10
ENST00000417069.6 |
ENTPD4
|
ectonucleoside triphosphate diphosphohydrolase 4 |
| chr18_-_23437869 | 0.50 |
ENST00000542162.5
ENST00000582336.5 |
TMEM241
|
transmembrane protein 241 |
| chr1_-_152159227 | 0.50 |
ENST00000316073.3
|
RPTN
|
repetin |
| chr2_-_230960954 | 0.48 |
ENST00000392039.2
|
GPR55
|
G protein-coupled receptor 55 |
| chr7_-_2815226 | 0.48 |
ENST00000447791.1
ENST00000407904.7 |
GNA12
|
G protein subunit alpha 12 |
| chr18_-_5521373 | 0.47 |
ENST00000580989.5
|
EPB41L3
|
erythrocyte membrane protein band 4.1 like 3 |
| chr10_+_5094405 | 0.47 |
ENST00000380554.5
|
AKR1C3
|
aldo-keto reductase family 1 member C3 |
| chr1_+_86993009 | 0.47 |
ENST00000370548.3
|
ENSG00000267561.2
|
novel protein |
| chr16_-_30894264 | 0.46 |
ENST00000380317.8
|
BCL7C
|
BAF chromatin remodeling complex subunit BCL7C |
| chr2_+_157257687 | 0.46 |
ENST00000259056.5
|
GALNT5
|
polypeptide N-acetylgalactosaminyltransferase 5 |
| chr3_-_33659441 | 0.46 |
ENST00000650653.1
ENST00000480013.6 |
CLASP2
|
cytoplasmic linker associated protein 2 |
| chr20_+_64080129 | 0.46 |
ENST00000355631.8
|
OPRL1
|
opioid related nociceptin receptor 1 |
| chr6_+_12716801 | 0.46 |
ENST00000674595.1
|
PHACTR1
|
phosphatase and actin regulator 1 |
| chr17_-_49208882 | 0.45 |
ENST00000503070.5
|
GNGT2
|
G protein subunit gamma transducin 2 |
| chr7_-_11832190 | 0.45 |
ENST00000423059.9
ENST00000617773.1 |
THSD7A
|
thrombospondin type 1 domain containing 7A |
| chrX_-_13734575 | 0.45 |
ENST00000519885.5
ENST00000458511.7 ENST00000380579.6 ENST00000683983.1 ENST00000683569.1 ENST00000359680.9 |
TRAPPC2
|
trafficking protein particle complex 2 |
| chr4_+_77020532 | 0.44 |
ENST00000506731.5
|
SEPTIN11
|
septin 11 |
| chr8_-_134510182 | 0.44 |
ENST00000521673.5
|
ZFAT
|
zinc finger and AT-hook domain containing |
| chr10_+_66926028 | 0.43 |
ENST00000361320.5
|
LRRTM3
|
leucine rich repeat transmembrane neuronal 3 |
| chr4_+_159267737 | 0.43 |
ENST00000264431.8
|
RAPGEF2
|
Rap guanine nucleotide exchange factor 2 |
| chr14_-_23365149 | 0.43 |
ENST00000216733.8
|
EFS
|
embryonal Fyn-associated substrate |
| chr2_+_201129483 | 0.42 |
ENST00000440180.5
|
CFLAR
|
CASP8 and FADD like apoptosis regulator |
| chr7_+_111091006 | 0.42 |
ENST00000451085.5
ENST00000422987.3 ENST00000421101.1 |
LRRN3
|
leucine rich repeat neuronal 3 |
| chr15_-_40874216 | 0.42 |
ENST00000220507.5
|
RHOV
|
ras homolog family member V |
| chr4_+_145481194 | 0.42 |
ENST00000514778.1
ENST00000507594.1 |
SMAD1
|
SMAD family member 1 |
| chr2_-_162243375 | 0.42 |
ENST00000188790.9
ENST00000443424.5 |
FAP
|
fibroblast activation protein alpha |
| chr11_+_65833944 | 0.42 |
ENST00000308342.7
|
SNX32
|
sorting nexin 32 |
| chr12_-_113221022 | 0.42 |
ENST00000546692.1
|
IQCD
|
IQ motif containing D |
| chr2_+_201129318 | 0.41 |
ENST00000417748.1
|
CFLAR
|
CASP8 and FADD like apoptosis regulator |
Network of associatons between targets according to the STRING database.

First level regulatory network of OLIG1
Gene Ontology Analysis
Gene overrepresentation in biological process category:
| Log-likelihood per target | Total log-likelihood | Term | Description |
|---|---|---|---|
| 1.2 | 3.5 | GO:0060730 | regulation of intestinal epithelial structure maintenance(GO:0060730) |
| 1.1 | 5.7 | GO:0002669 | positive regulation of T cell anergy(GO:0002669) positive regulation of lymphocyte anergy(GO:0002913) |
| 0.9 | 2.7 | GO:0035397 | helper T cell enhancement of adaptive immune response(GO:0035397) |
| 0.8 | 3.2 | GO:0018125 | peptidyl-cysteine methylation(GO:0018125) |
| 0.8 | 3.0 | GO:0042631 | cellular response to water deprivation(GO:0042631) |
| 0.7 | 2.1 | GO:0032701 | negative regulation of interleukin-18 production(GO:0032701) |
| 0.7 | 2.7 | GO:0002881 | negative regulation of chronic inflammatory response to non-antigenic stimulus(GO:0002881) |
| 0.7 | 2.0 | GO:0002304 | gamma-delta intraepithelial T cell differentiation(GO:0002304) CD8-positive, gamma-delta intraepithelial T cell differentiation(GO:0002305) |
| 0.5 | 2.1 | GO:0000738 | DNA catabolic process, exonucleolytic(GO:0000738) |
| 0.5 | 2.4 | GO:0070837 | dehydroascorbic acid transport(GO:0070837) |
| 0.4 | 3.1 | GO:0002666 | positive regulation of T cell tolerance induction(GO:0002666) |
| 0.4 | 2.1 | GO:0033031 | positive regulation of neutrophil apoptotic process(GO:0033031) |
| 0.4 | 1.2 | GO:0060739 | mesenchymal-epithelial cell signaling involved in prostate gland development(GO:0060739) |
| 0.3 | 1.0 | GO:0001812 | positive regulation of type I hypersensitivity(GO:0001812) |
| 0.3 | 3.1 | GO:0000727 | double-strand break repair via break-induced replication(GO:0000727) |
| 0.3 | 2.3 | GO:0006543 | glutamine catabolic process(GO:0006543) |
| 0.3 | 0.9 | GO:1904897 | regulation of hepatic stellate cell proliferation(GO:1904897) positive regulation of hepatic stellate cell proliferation(GO:1904899) hepatic stellate cell proliferation(GO:1990922) |
| 0.3 | 2.0 | GO:0070269 | pyroptosis(GO:0070269) |
| 0.3 | 1.4 | GO:0071934 | thiamine transmembrane transport(GO:0071934) |
| 0.3 | 0.6 | GO:2001180 | negative regulation of interleukin-10 secretion(GO:2001180) |
| 0.2 | 0.9 | GO:1902938 | regulation of intracellular calcium activated chloride channel activity(GO:1902938) |
| 0.2 | 1.5 | GO:0022614 | membrane to membrane docking(GO:0022614) |
| 0.2 | 0.9 | GO:2000360 | negative regulation of binding of sperm to zona pellucida(GO:2000360) |
| 0.2 | 1.1 | GO:1900041 | negative regulation of interleukin-2 secretion(GO:1900041) |
| 0.2 | 0.6 | GO:0045715 | negative regulation of low-density lipoprotein particle receptor biosynthetic process(GO:0045715) |
| 0.2 | 2.7 | GO:1902951 | negative regulation of dendritic spine maintenance(GO:1902951) |
| 0.2 | 1.3 | GO:0009138 | pyrimidine nucleoside diphosphate metabolic process(GO:0009138) |
| 0.2 | 1.2 | GO:0038195 | urokinase plasminogen activator signaling pathway(GO:0038195) |
| 0.2 | 1.5 | GO:0042760 | very long-chain fatty acid catabolic process(GO:0042760) |
| 0.2 | 0.7 | GO:0010260 | organ senescence(GO:0010260) |
| 0.2 | 2.6 | GO:0002291 | T cell activation via T cell receptor contact with antigen bound to MHC molecule on antigen presenting cell(GO:0002291) |
| 0.2 | 0.8 | GO:0038098 | sequestering of BMP from receptor via BMP binding(GO:0038098) |
| 0.2 | 2.4 | GO:0001865 | NK T cell differentiation(GO:0001865) |
| 0.2 | 0.5 | GO:0006714 | sesquiterpenoid metabolic process(GO:0006714) sesquiterpenoid catabolic process(GO:0016107) farnesol metabolic process(GO:0016487) farnesol catabolic process(GO:0016488) regulation of testosterone biosynthetic process(GO:2000224) |
| 0.1 | 1.8 | GO:0071847 | TNFSF11-mediated signaling pathway(GO:0071847) negative regulation of osteoclast development(GO:2001205) |
| 0.1 | 0.7 | GO:1904059 | regulation of locomotor rhythm(GO:1904059) |
| 0.1 | 1.3 | GO:0055129 | L-proline biosynthetic process(GO:0055129) |
| 0.1 | 2.1 | GO:2000623 | regulation of nuclear-transcribed mRNA catabolic process, nonsense-mediated decay(GO:2000622) negative regulation of nuclear-transcribed mRNA catabolic process, nonsense-mediated decay(GO:2000623) |
| 0.1 | 1.0 | GO:0051725 | protein de-ADP-ribosylation(GO:0051725) |
| 0.1 | 1.1 | GO:0070995 | NADPH oxidation(GO:0070995) |
| 0.1 | 0.9 | GO:1990564 | protein polyufmylation(GO:1990564) protein K69-linked ufmylation(GO:1990592) |
| 0.1 | 1.7 | GO:0033227 | dsRNA transport(GO:0033227) |
| 0.1 | 0.5 | GO:1904073 | regulation of trophectodermal cell proliferation(GO:1904073) positive regulation of trophectodermal cell proliferation(GO:1904075) |
| 0.1 | 0.5 | GO:0046878 | positive regulation of saliva secretion(GO:0046878) |
| 0.1 | 0.9 | GO:0035494 | SNARE complex disassembly(GO:0035494) |
| 0.1 | 1.8 | GO:0030854 | positive regulation of granulocyte differentiation(GO:0030854) |
| 0.1 | 0.6 | GO:0038016 | insulin receptor internalization(GO:0038016) |
| 0.1 | 2.5 | GO:0030277 | maintenance of gastrointestinal epithelium(GO:0030277) |
| 0.1 | 0.3 | GO:1904211 | membrane protein proteolysis involved in retrograde protein transport, ER to cytosol(GO:1904211) |
| 0.1 | 0.7 | GO:0051490 | negative regulation of filopodium assembly(GO:0051490) |
| 0.1 | 0.7 | GO:0061767 | negative regulation of lung blood pressure(GO:0061767) |
| 0.1 | 0.5 | GO:0015783 | GDP-fucose transport(GO:0015783) purine nucleotide-sugar transport(GO:0036079) |
| 0.1 | 0.7 | GO:0006659 | phosphatidylserine biosynthetic process(GO:0006659) |
| 0.1 | 1.6 | GO:0045162 | clustering of voltage-gated sodium channels(GO:0045162) |
| 0.1 | 0.8 | GO:0009048 | dosage compensation(GO:0007549) dosage compensation by inactivation of X chromosome(GO:0009048) |
| 0.1 | 1.9 | GO:0010886 | positive regulation of cholesterol storage(GO:0010886) |
| 0.1 | 0.4 | GO:0097325 | melanocyte proliferation(GO:0097325) |
| 0.1 | 4.9 | GO:0006910 | phagocytosis, recognition(GO:0006910) |
| 0.1 | 0.5 | GO:1900126 | negative regulation of hyaluronan biosynthetic process(GO:1900126) |
| 0.1 | 0.8 | GO:0001731 | formation of translation preinitiation complex(GO:0001731) |
| 0.1 | 0.4 | GO:1900377 | negative regulation of melanin biosynthetic process(GO:0048022) negative regulation of secondary metabolite biosynthetic process(GO:1900377) positive regulation of dendritic cell apoptotic process(GO:2000670) |
| 0.1 | 0.6 | GO:0000821 | regulation of arginine metabolic process(GO:0000821) |
| 0.1 | 0.4 | GO:0007079 | mitotic chromosome movement towards spindle pole(GO:0007079) |
| 0.1 | 0.7 | GO:0018094 | protein polyglycylation(GO:0018094) |
| 0.1 | 0.4 | GO:2001106 | regulation of Rho guanyl-nucleotide exchange factor activity(GO:2001106) |
| 0.1 | 0.7 | GO:2001179 | regulation of interleukin-10 secretion(GO:2001179) positive regulation of interleukin-10 secretion(GO:2001181) |
| 0.1 | 1.1 | GO:0034244 | negative regulation of transcription elongation from RNA polymerase II promoter(GO:0034244) |
| 0.1 | 0.2 | GO:0015688 | iron chelate transport(GO:0015688) siderophore transport(GO:0015891) |
| 0.1 | 1.0 | GO:0051256 | mitotic spindle midzone assembly(GO:0051256) |
| 0.1 | 0.7 | GO:1903944 | regulation of hepatocyte apoptotic process(GO:1903943) negative regulation of hepatocyte apoptotic process(GO:1903944) |
| 0.0 | 0.8 | GO:0001514 | selenocysteine incorporation(GO:0001514) translational readthrough(GO:0006451) |
| 0.0 | 0.7 | GO:0015014 | heparan sulfate proteoglycan biosynthetic process, polysaccharide chain biosynthetic process(GO:0015014) |
| 0.0 | 2.1 | GO:0032012 | regulation of ARF protein signal transduction(GO:0032012) |
| 0.0 | 0.7 | GO:1903690 | negative regulation of wound healing, spreading of epidermal cells(GO:1903690) |
| 0.0 | 1.1 | GO:0051382 | kinetochore assembly(GO:0051382) |
| 0.0 | 0.2 | GO:1903575 | cornified envelope assembly(GO:1903575) |
| 0.0 | 0.5 | GO:0002051 | osteoblast fate commitment(GO:0002051) |
| 0.0 | 1.5 | GO:0090023 | positive regulation of neutrophil chemotaxis(GO:0090023) |
| 0.0 | 2.7 | GO:0002755 | MyD88-dependent toll-like receptor signaling pathway(GO:0002755) |
| 0.0 | 0.8 | GO:0007221 | positive regulation of transcription of Notch receptor target(GO:0007221) |
| 0.0 | 0.5 | GO:0090204 | protein localization to nuclear pore(GO:0090204) |
| 0.0 | 1.0 | GO:0000028 | ribosomal small subunit assembly(GO:0000028) |
| 0.0 | 0.4 | GO:0045905 | translational frameshifting(GO:0006452) positive regulation of translational termination(GO:0045905) |
| 0.0 | 1.5 | GO:0010447 | response to acidic pH(GO:0010447) |
| 0.0 | 0.5 | GO:0002175 | protein localization to paranode region of axon(GO:0002175) |
| 0.0 | 0.8 | GO:0031340 | positive regulation of vesicle fusion(GO:0031340) |
| 0.0 | 0.7 | GO:0060315 | negative regulation of ryanodine-sensitive calcium-release channel activity(GO:0060315) |
| 0.0 | 0.3 | GO:1903895 | negative regulation of IRE1-mediated unfolded protein response(GO:1903895) |
| 0.0 | 0.7 | GO:0032695 | negative regulation of interleukin-12 production(GO:0032695) |
| 0.0 | 0.5 | GO:0038171 | cannabinoid signaling pathway(GO:0038171) |
| 0.0 | 0.2 | GO:0046092 | deoxycytidine metabolic process(GO:0046092) |
| 0.0 | 0.2 | GO:0006269 | DNA replication, synthesis of RNA primer(GO:0006269) |
| 0.0 | 3.4 | GO:0002260 | lymphocyte homeostasis(GO:0002260) |
| 0.0 | 0.5 | GO:0036066 | protein O-linked fucosylation(GO:0036066) |
| 0.0 | 1.2 | GO:0030728 | ovulation(GO:0030728) |
| 0.0 | 6.4 | GO:0038096 | immune response-regulating cell surface receptor signaling pathway involved in phagocytosis(GO:0002433) Fc-gamma receptor signaling pathway involved in phagocytosis(GO:0038096) |
| 0.0 | 0.3 | GO:1902035 | positive regulation of hematopoietic stem cell proliferation(GO:1902035) |
| 0.0 | 0.8 | GO:0051639 | actin filament network formation(GO:0051639) |
| 0.0 | 0.3 | GO:2000324 | positive regulation of glucocorticoid receptor signaling pathway(GO:2000324) |
| 0.0 | 0.2 | GO:0002710 | negative regulation of T cell mediated immunity(GO:0002710) |
| 0.0 | 0.2 | GO:0060005 | vestibular reflex(GO:0060005) |
| 0.0 | 0.6 | GO:0008228 | opsonization(GO:0008228) |
| 0.0 | 0.3 | GO:0089700 | protein kinase D signaling(GO:0089700) |
| 0.0 | 2.3 | GO:0045576 | mast cell activation(GO:0045576) |
| 0.0 | 0.6 | GO:0006068 | ethanol catabolic process(GO:0006068) |
| 0.0 | 0.4 | GO:1902004 | positive regulation of beta-amyloid formation(GO:1902004) |
| 0.0 | 1.6 | GO:0050434 | positive regulation of viral transcription(GO:0050434) |
| 0.0 | 1.9 | GO:0042059 | negative regulation of epidermal growth factor receptor signaling pathway(GO:0042059) |
| 0.0 | 4.3 | GO:0002377 | immunoglobulin production(GO:0002377) |
| 0.0 | 0.8 | GO:0006293 | nucleotide-excision repair, preincision complex stabilization(GO:0006293) |
| 0.0 | 0.5 | GO:0006995 | cellular response to nitrogen starvation(GO:0006995) cellular response to nitrogen levels(GO:0043562) |
| 0.0 | 0.1 | GO:2000687 | negative regulation of rubidium ion transport(GO:2000681) negative regulation of rubidium ion transmembrane transporter activity(GO:2000687) |
| 0.0 | 1.9 | GO:0032945 | negative regulation of mononuclear cell proliferation(GO:0032945) negative regulation of lymphocyte proliferation(GO:0050672) |
| 0.0 | 0.4 | GO:0016540 | protein autoprocessing(GO:0016540) |
| 0.0 | 0.6 | GO:1904778 | regulation of protein localization to cell cortex(GO:1904776) positive regulation of protein localization to cell cortex(GO:1904778) |
| 0.0 | 2.0 | GO:0007602 | phototransduction(GO:0007602) |
| 0.0 | 0.4 | GO:1901741 | positive regulation of myoblast fusion(GO:1901741) |
| 0.0 | 0.7 | GO:0019054 | modulation by virus of host process(GO:0019054) |
| 0.0 | 0.1 | GO:0072757 | cellular response to camptothecin(GO:0072757) |
| 0.0 | 0.1 | GO:1903182 | regulation of SUMO transferase activity(GO:1903182) positive regulation of SUMO transferase activity(GO:1903755) |
| 0.0 | 0.1 | GO:0032804 | viral protein processing(GO:0019082) negative regulation of low-density lipoprotein particle receptor catabolic process(GO:0032804) regulation of nerve growth factor production(GO:0032903) negative regulation of nerve growth factor production(GO:0032904) dibasic protein processing(GO:0090472) |
| 0.0 | 0.3 | GO:0006828 | manganese ion transport(GO:0006828) |
| 0.0 | 0.1 | GO:0019348 | dolichol metabolic process(GO:0019348) |
| 0.0 | 0.2 | GO:0072656 | maintenance of protein location in mitochondrion(GO:0072656) |
| 0.0 | 0.4 | GO:0044804 | nucleophagy(GO:0044804) |
| 0.0 | 0.2 | GO:2000582 | regulation of ATP-dependent microtubule motor activity, plus-end-directed(GO:2000580) positive regulation of ATP-dependent microtubule motor activity, plus-end-directed(GO:2000582) |
| 0.0 | 0.2 | GO:0098535 | de novo centriole assembly(GO:0098535) |
| 0.0 | 1.2 | GO:0016266 | O-glycan processing(GO:0016266) |
| 0.0 | 2.4 | GO:0034968 | histone lysine methylation(GO:0034968) |
| 0.0 | 0.4 | GO:0098828 | positive regulation of inhibitory postsynaptic potential(GO:0097151) modulation of inhibitory postsynaptic potential(GO:0098828) |
| 0.0 | 0.4 | GO:0042118 | endothelial cell activation(GO:0042118) |
| 0.0 | 0.3 | GO:0080111 | DNA demethylation(GO:0080111) |
| 0.0 | 0.6 | GO:0060292 | long term synaptic depression(GO:0060292) |
| 0.0 | 0.3 | GO:1901663 | ubiquinone biosynthetic process(GO:0006744) quinone biosynthetic process(GO:1901663) |
| 0.0 | 1.0 | GO:0006306 | DNA alkylation(GO:0006305) DNA methylation(GO:0006306) DNA methylation or demethylation(GO:0044728) |
Gene overrepresentation in cellular component category:
| Log-likelihood per target | Total log-likelihood | Term | Description |
|---|---|---|---|
| 0.5 | 5.7 | GO:0042105 | alpha-beta T cell receptor complex(GO:0042105) |
| 0.5 | 2.8 | GO:0036398 | TCR signalosome(GO:0036398) |
| 0.4 | 1.1 | GO:0036194 | muscle cell projection(GO:0036194) muscle cell projection membrane(GO:0036195) |
| 0.3 | 2.0 | GO:0072557 | IPAF inflammasome complex(GO:0072557) |
| 0.3 | 1.3 | GO:0097637 | intrinsic component of autophagosome membrane(GO:0097636) integral component of autophagosome membrane(GO:0097637) |
| 0.3 | 0.9 | GO:0030312 | external encapsulating structure(GO:0030312) |
| 0.2 | 5.3 | GO:0042101 | T cell receptor complex(GO:0042101) |
| 0.2 | 0.6 | GO:0071062 | alphav-beta3 integrin-vitronectin complex(GO:0071062) |
| 0.2 | 1.1 | GO:1990031 | pinceau fiber(GO:1990031) |
| 0.1 | 3.5 | GO:0031254 | uropod(GO:0001931) cell trailing edge(GO:0031254) |
| 0.1 | 1.1 | GO:0032021 | NELF complex(GO:0032021) |
| 0.1 | 3.2 | GO:0042588 | zymogen granule(GO:0042588) |
| 0.1 | 0.5 | GO:1990498 | mitotic spindle microtubule(GO:1990498) |
| 0.1 | 0.8 | GO:0097452 | GAIT complex(GO:0097452) |
| 0.1 | 1.7 | GO:0071438 | invadopodium membrane(GO:0071438) |
| 0.1 | 4.9 | GO:0042571 | immunoglobulin complex, circulating(GO:0042571) |
| 0.1 | 10.1 | GO:0070821 | tertiary granule membrane(GO:0070821) |
| 0.1 | 1.9 | GO:0034362 | low-density lipoprotein particle(GO:0034362) |
| 0.1 | 1.0 | GO:0060091 | kinocilium(GO:0060091) |
| 0.1 | 1.6 | GO:0048188 | Set1C/COMPASS complex(GO:0048188) |
| 0.1 | 2.0 | GO:0071682 | endocytic vesicle lumen(GO:0071682) |
| 0.1 | 0.3 | GO:0034274 | Atg12-Atg5-Atg16 complex(GO:0034274) |
| 0.1 | 1.3 | GO:0032433 | filopodium tip(GO:0032433) |
| 0.1 | 0.5 | GO:0035867 | alphav-beta3 integrin-IGF-1-IGF1R complex(GO:0035867) |
| 0.1 | 0.5 | GO:1990130 | Iml1 complex(GO:1990130) |
| 0.1 | 4.4 | GO:0045171 | intercellular bridge(GO:0045171) |
| 0.1 | 0.7 | GO:0071144 | SMAD2-SMAD3 protein complex(GO:0071144) |
| 0.1 | 4.4 | GO:0005834 | heterotrimeric G-protein complex(GO:0005834) |
| 0.1 | 2.1 | GO:0042629 | mast cell granule(GO:0042629) |
| 0.1 | 3.7 | GO:0001917 | photoreceptor inner segment(GO:0001917) |
| 0.1 | 2.1 | GO:1990124 | messenger ribonucleoprotein complex(GO:1990124) |
| 0.1 | 2.7 | GO:0044298 | neuronal cell body membrane(GO:0032809) cell body membrane(GO:0044298) |
| 0.1 | 0.7 | GO:0005828 | kinetochore microtubule(GO:0005828) |
| 0.0 | 0.8 | GO:0008290 | F-actin capping protein complex(GO:0008290) |
| 0.0 | 0.8 | GO:0036056 | filtration diaphragm(GO:0036056) slit diaphragm(GO:0036057) |
| 0.0 | 1.0 | GO:0032045 | guanyl-nucleotide exchange factor complex(GO:0032045) |
| 0.0 | 0.3 | GO:1990745 | EARP complex(GO:1990745) |
| 0.0 | 0.1 | GO:0033185 | dolichol-phosphate-mannose synthase complex(GO:0033185) |
| 0.0 | 0.7 | GO:0005885 | Arp2/3 protein complex(GO:0005885) |
| 0.0 | 1.2 | GO:0005614 | interstitial matrix(GO:0005614) |
| 0.0 | 0.2 | GO:0031467 | Cul7-RING ubiquitin ligase complex(GO:0031467) 3M complex(GO:1990393) |
| 0.0 | 0.2 | GO:0005658 | alpha DNA polymerase:primase complex(GO:0005658) |
| 0.0 | 0.3 | GO:0005610 | laminin-5 complex(GO:0005610) |
| 0.0 | 1.1 | GO:0030904 | retromer complex(GO:0030904) |
| 0.0 | 0.4 | GO:0005642 | annulate lamellae(GO:0005642) |
| 0.0 | 0.7 | GO:0031265 | CD95 death-inducing signaling complex(GO:0031265) |
| 0.0 | 0.6 | GO:0008091 | spectrin(GO:0008091) |
| 0.0 | 0.5 | GO:0030008 | TRAPP complex(GO:0030008) |
| 0.0 | 0.5 | GO:0071141 | SMAD protein complex(GO:0071141) |
| 0.0 | 0.8 | GO:0005916 | fascia adherens(GO:0005916) |
| 0.0 | 0.5 | GO:0044613 | nuclear pore central transport channel(GO:0044613) |
| 0.0 | 2.1 | GO:0015030 | Cajal body(GO:0015030) |
| 0.0 | 1.0 | GO:0016581 | NuRD complex(GO:0016581) CHD-type complex(GO:0090545) |
| 0.0 | 0.4 | GO:0035253 | ciliary rootlet(GO:0035253) |
| 0.0 | 0.2 | GO:0098536 | deuterosome(GO:0098536) |
| 0.0 | 0.9 | GO:0016514 | SWI/SNF complex(GO:0016514) |
| 0.0 | 0.1 | GO:1990356 | sumoylated E2 ligase complex(GO:1990356) |
| 0.0 | 3.2 | GO:0031234 | extrinsic component of cytoplasmic side of plasma membrane(GO:0031234) |
| 0.0 | 0.1 | GO:0000444 | MIS12/MIND type complex(GO:0000444) |
| 0.0 | 1.5 | GO:0035579 | specific granule membrane(GO:0035579) |
| 0.0 | 0.5 | GO:0033270 | paranode region of axon(GO:0033270) |
| 0.0 | 1.0 | GO:0031201 | SNARE complex(GO:0031201) |
| 0.0 | 1.2 | GO:1904724 | tertiary granule lumen(GO:1904724) |
| 0.0 | 8.1 | GO:0005769 | early endosome(GO:0005769) |
| 0.0 | 0.4 | GO:0031616 | spindle pole centrosome(GO:0031616) |
| 0.0 | 0.9 | GO:0022627 | cytosolic small ribosomal subunit(GO:0022627) |
| 0.0 | 0.9 | GO:0043198 | dendritic shaft(GO:0043198) |
| 0.0 | 0.2 | GO:0034709 | methylosome(GO:0034709) |
Gene overrepresentation in molecular function category:
| Log-likelihood per target | Total log-likelihood | Term | Description |
|---|---|---|---|
| 0.7 | 2.1 | GO:0008859 | exoribonuclease II activity(GO:0008859) |
| 0.7 | 2.7 | GO:0016495 | C-X3-C chemokine receptor activity(GO:0016495) |
| 0.5 | 8.5 | GO:0042608 | T cell receptor binding(GO:0042608) |
| 0.5 | 2.4 | GO:0033300 | dehydroascorbic acid transporter activity(GO:0033300) |
| 0.5 | 1.4 | GO:0015403 | thiamine uptake transmembrane transporter activity(GO:0015403) |
| 0.4 | 3.1 | GO:0023029 | MHC class Ib protein binding(GO:0023029) inhibitory MHC class I receptor activity(GO:0032396) |
| 0.3 | 1.4 | GO:0045322 | unmethylated CpG binding(GO:0045322) |
| 0.3 | 0.9 | GO:0099530 | G-protein coupled receptor activity involved in regulation of postsynaptic membrane potential(GO:0099530) |
| 0.3 | 2.7 | GO:0042289 | MHC class II protein binding(GO:0042289) |
| 0.3 | 2.3 | GO:0004359 | glutaminase activity(GO:0004359) |
| 0.3 | 1.3 | GO:0016774 | phosphotransferase activity, carboxyl group as acceptor(GO:0016774) |
| 0.2 | 1.5 | GO:0005324 | long-chain fatty acid transporter activity(GO:0005324) |
| 0.2 | 1.7 | GO:0051033 | nucleic acid transmembrane transporter activity(GO:0051032) RNA transmembrane transporter activity(GO:0051033) |
| 0.2 | 1.2 | GO:0030377 | urokinase plasminogen activator receptor activity(GO:0030377) |
| 0.2 | 0.7 | GO:0001626 | nociceptin receptor activity(GO:0001626) |
| 0.2 | 3.7 | GO:0046625 | sphingolipid binding(GO:0046625) |
| 0.2 | 1.0 | GO:0003875 | ADP-ribosylarginine hydrolase activity(GO:0003875) |
| 0.2 | 0.6 | GO:0070053 | thrombospondin receptor activity(GO:0070053) |
| 0.2 | 1.1 | GO:0043515 | kinetochore binding(GO:0043515) |
| 0.2 | 1.3 | GO:0045134 | uridine-diphosphatase activity(GO:0045134) |
| 0.2 | 0.5 | GO:0045550 | geranylgeranyl reductase activity(GO:0045550) |
| 0.2 | 2.1 | GO:0035005 | 1-phosphatidylinositol-4-phosphate 3-kinase activity(GO:0035005) |
| 0.1 | 1.2 | GO:0045545 | syndecan binding(GO:0045545) |
| 0.1 | 1.0 | GO:0019763 | immunoglobulin receptor activity(GO:0019763) |
| 0.1 | 0.5 | GO:0004949 | cannabinoid receptor activity(GO:0004949) |
| 0.1 | 3.2 | GO:0031489 | myosin V binding(GO:0031489) |
| 0.1 | 1.0 | GO:0004687 | myosin light chain kinase activity(GO:0004687) |
| 0.1 | 1.5 | GO:0045236 | CXCR chemokine receptor binding(GO:0045236) |
| 0.1 | 1.9 | GO:0017034 | Rap guanyl-nucleotide exchange factor activity(GO:0017034) |
| 0.1 | 2.1 | GO:0005522 | profilin binding(GO:0005522) |
| 0.1 | 0.7 | GO:0031962 | mineralocorticoid receptor binding(GO:0031962) |
| 0.1 | 0.5 | GO:0005457 | GDP-fucose transmembrane transporter activity(GO:0005457) purine nucleotide-sugar transmembrane transporter activity(GO:0036080) |
| 0.1 | 0.6 | GO:0008273 | calcium, potassium:sodium antiporter activity(GO:0008273) |
| 0.1 | 0.6 | GO:0015235 | cobalamin transporter activity(GO:0015235) |
| 0.1 | 0.7 | GO:0042328 | heparan sulfate N-acetylglucosaminyltransferase activity(GO:0042328) |
| 0.1 | 0.6 | GO:0019960 | C-X3-C chemokine binding(GO:0019960) |
| 0.1 | 0.5 | GO:0031752 | D5 dopamine receptor binding(GO:0031752) |
| 0.1 | 4.9 | GO:0034987 | immunoglobulin receptor binding(GO:0034987) |
| 0.1 | 0.9 | GO:0001135 | transcription factor activity, RNA polymerase II transcription factor recruiting(GO:0001135) |
| 0.1 | 1.6 | GO:0030957 | Tat protein binding(GO:0030957) |
| 0.1 | 0.8 | GO:0016015 | morphogen activity(GO:0016015) |
| 0.1 | 1.6 | GO:0086080 | protein binding involved in heterotypic cell-cell adhesion(GO:0086080) |
| 0.1 | 0.7 | GO:0070735 | protein-glycine ligase activity(GO:0070735) |
| 0.1 | 0.3 | GO:0019776 | Atg8 ligase activity(GO:0019776) |
| 0.1 | 1.7 | GO:0008494 | translation activator activity(GO:0008494) |
| 0.1 | 1.9 | GO:0030169 | low-density lipoprotein particle binding(GO:0030169) |
| 0.1 | 2.0 | GO:0001965 | G-protein alpha-subunit binding(GO:0001965) |
| 0.1 | 10.6 | GO:0003823 | antigen binding(GO:0003823) |
| 0.1 | 0.9 | GO:0004568 | chitinase activity(GO:0004568) |
| 0.0 | 0.8 | GO:0004791 | thioredoxin-disulfide reductase activity(GO:0004791) |
| 0.0 | 0.2 | GO:0003896 | DNA primase activity(GO:0003896) |
| 0.0 | 0.6 | GO:0042731 | PH domain binding(GO:0042731) |
| 0.0 | 2.1 | GO:0005086 | ARF guanyl-nucleotide exchange factor activity(GO:0005086) |
| 0.0 | 0.7 | GO:0042609 | CD4 receptor binding(GO:0042609) |
| 0.0 | 0.3 | GO:0089720 | caspase binding(GO:0089720) |
| 0.0 | 0.5 | GO:0030618 | transforming growth factor beta receptor, pathway-specific cytoplasmic mediator activity(GO:0030618) |
| 0.0 | 0.1 | GO:0004582 | dolichyl-phosphate beta-D-mannosyltransferase activity(GO:0004582) |
| 0.0 | 2.0 | GO:0043027 | cysteine-type endopeptidase inhibitor activity involved in apoptotic process(GO:0043027) |
| 0.0 | 0.7 | GO:0016671 | oxidoreductase activity, acting on a sulfur group of donors, disulfide as acceptor(GO:0016671) |
| 0.0 | 0.5 | GO:0032051 | clathrin light chain binding(GO:0032051) |
| 0.0 | 0.2 | GO:0004797 | deoxycytidine kinase activity(GO:0004137) thymidine kinase activity(GO:0004797) |
| 0.0 | 0.3 | GO:0048039 | ubiquinone binding(GO:0048039) |
| 0.0 | 1.2 | GO:0005540 | hyaluronic acid binding(GO:0005540) |
| 0.0 | 0.6 | GO:0004062 | aryl sulfotransferase activity(GO:0004062) |
| 0.0 | 0.6 | GO:0015174 | basic amino acid transmembrane transporter activity(GO:0015174) |
| 0.0 | 1.3 | GO:0015248 | sterol transporter activity(GO:0015248) |
| 0.0 | 0.6 | GO:0031957 | very long-chain fatty acid-CoA ligase activity(GO:0031957) |
| 0.0 | 0.5 | GO:0005041 | low-density lipoprotein receptor activity(GO:0005041) |
| 0.0 | 0.3 | GO:0015279 | store-operated calcium channel activity(GO:0015279) |
| 0.0 | 1.1 | GO:0004033 | aldo-keto reductase (NADP) activity(GO:0004033) |
| 0.0 | 0.7 | GO:0097200 | cysteine-type endopeptidase activity involved in execution phase of apoptosis(GO:0097200) |
| 0.0 | 0.4 | GO:0017070 | U6 snRNA binding(GO:0017070) |
| 0.0 | 0.7 | GO:0008157 | protein phosphatase 1 binding(GO:0008157) |
| 0.0 | 0.1 | GO:0061656 | SUMO conjugating enzyme activity(GO:0061656) |
| 0.0 | 0.7 | GO:0004602 | glutathione peroxidase activity(GO:0004602) |
| 0.0 | 1.9 | GO:0004715 | non-membrane spanning protein tyrosine kinase activity(GO:0004715) |
| 0.0 | 4.5 | GO:0017124 | SH3 domain binding(GO:0017124) |
| 0.0 | 1.5 | GO:0018024 | histone-lysine N-methyltransferase activity(GO:0018024) |
| 0.0 | 0.8 | GO:0004950 | G-protein coupled chemoattractant receptor activity(GO:0001637) chemokine receptor activity(GO:0004950) |
| 0.0 | 0.2 | GO:0004340 | glucokinase activity(GO:0004340) hexokinase activity(GO:0004396) fructokinase activity(GO:0008865) mannokinase activity(GO:0019158) |
| 0.0 | 0.6 | GO:0008574 | ATP-dependent microtubule motor activity, plus-end-directed(GO:0008574) |
| 0.0 | 0.8 | GO:0017091 | AU-rich element binding(GO:0017091) |
| 0.0 | 0.6 | GO:0005031 | tumor necrosis factor-activated receptor activity(GO:0005031) death receptor activity(GO:0005035) |
| 0.0 | 2.3 | GO:0003725 | double-stranded RNA binding(GO:0003725) |
| 0.0 | 0.5 | GO:0004653 | polypeptide N-acetylgalactosaminyltransferase activity(GO:0004653) |
| 0.0 | 0.2 | GO:0022833 | mechanically-gated ion channel activity(GO:0008381) mechanically gated channel activity(GO:0022833) |
| 0.0 | 1.6 | GO:0005070 | SH3/SH2 adaptor activity(GO:0005070) |
| 0.0 | 0.5 | GO:0005487 | nucleocytoplasmic transporter activity(GO:0005487) |
| 0.0 | 0.7 | GO:0008139 | nuclear localization sequence binding(GO:0008139) |
| 0.0 | 0.8 | GO:0004003 | ATP-dependent DNA helicase activity(GO:0004003) |
| 0.0 | 1.2 | GO:0008138 | protein tyrosine/serine/threonine phosphatase activity(GO:0008138) |
| 0.0 | 0.4 | GO:0008239 | dipeptidyl-peptidase activity(GO:0008239) |
| 0.0 | 0.7 | GO:0017075 | syntaxin-1 binding(GO:0017075) |
| 0.0 | 0.2 | GO:0004579 | dolichyl-diphosphooligosaccharide-protein glycotransferase activity(GO:0004579) |
Gene overrepresentation in curated gene sets: canonical pathways category:
| Log-likelihood per target | Total log-likelihood | Term | Description |
|---|---|---|---|
| 0.1 | 8.4 | PID IL12 STAT4 PATHWAY | IL12 signaling mediated by STAT4 |
| 0.1 | 2.8 | PID TCR JNK PATHWAY | JNK signaling in the CD4+ TCR pathway |
| 0.1 | 2.7 | PID SYNDECAN 3 PATHWAY | Syndecan-3-mediated signaling events |
| 0.1 | 2.5 | PID CONE PATHWAY | Visual signal transduction: Cones |
| 0.1 | 0.5 | PID S1P S1P4 PATHWAY | S1P4 pathway |
| 0.1 | 5.5 | PID FCER1 PATHWAY | Fc-epsilon receptor I signaling in mast cells |
| 0.0 | 2.1 | SA TRKA RECEPTOR | The TrkA receptor binds nerve growth factor to activate MAP kinase pathways and promote cell growth. |
| 0.0 | 3.3 | PID INTEGRIN3 PATHWAY | Beta3 integrin cell surface interactions |
| 0.0 | 2.0 | PID ER NONGENOMIC PATHWAY | Plasma membrane estrogen receptor signaling |
| 0.0 | 1.9 | PID ERBB1 INTERNALIZATION PATHWAY | Internalization of ErbB1 |
| 0.0 | 1.1 | PID SMAD2 3PATHWAY | Regulation of cytoplasmic and nuclear SMAD2/3 signaling |
| 0.0 | 0.8 | PID EPO PATHWAY | EPO signaling pathway |
| 0.0 | 1.0 | PID IL8 CXCR2 PATHWAY | IL8- and CXCR2-mediated signaling events |
| 0.0 | 0.5 | PID ALK2 PATHWAY | ALK2 signaling events |
| 0.0 | 0.7 | PID TRAIL PATHWAY | TRAIL signaling pathway |
| 0.0 | 3.2 | PID PDGFRB PATHWAY | PDGFR-beta signaling pathway |
| 0.0 | 0.5 | PID FAS PATHWAY | FAS (CD95) signaling pathway |
| 0.0 | 0.9 | PID IL2 PI3K PATHWAY | IL2 signaling events mediated by PI3K |
| 0.0 | 0.8 | PID FAK PATHWAY | Signaling events mediated by focal adhesion kinase |
| 0.0 | 0.6 | PID CD8 TCR DOWNSTREAM PATHWAY | Downstream signaling in naïve CD8+ T cells |
| 0.0 | 0.3 | PID INTEGRIN4 PATHWAY | Alpha6 beta4 integrin-ligand interactions |
| 0.0 | 1.5 | PID TRKR PATHWAY | Neurotrophic factor-mediated Trk receptor signaling |
| 0.0 | 0.4 | PID ALPHA SYNUCLEIN PATHWAY | Alpha-synuclein signaling |
Gene overrepresentation in curated gene sets: REACTOME pathways category:
| Log-likelihood per target | Total log-likelihood | Term | Description |
|---|---|---|---|
| 0.4 | 2.7 | REACTOME BINDING AND ENTRY OF HIV VIRION | Genes involved in Binding and entry of HIV virion |
| 0.3 | 5.7 | REACTOME TRANSLOCATION OF ZAP 70 TO IMMUNOLOGICAL SYNAPSE | Genes involved in Translocation of ZAP-70 to Immunological synapse |
| 0.2 | 5.2 | REACTOME GENERATION OF SECOND MESSENGER MOLECULES | Genes involved in Generation of second messenger molecules |
| 0.2 | 3.3 | REACTOME PECAM1 INTERACTIONS | Genes involved in PECAM1 interactions |
| 0.1 | 2.1 | REACTOME GRB2 SOS PROVIDES LINKAGE TO MAPK SIGNALING FOR INTERGRINS | Genes involved in GRB2:SOS provides linkage to MAPK signaling for Intergrins |
| 0.1 | 0.7 | REACTOME PD1 SIGNALING | Genes involved in PD-1 signaling |
| 0.1 | 3.7 | REACTOME AMINO ACID SYNTHESIS AND INTERCONVERSION TRANSAMINATION | Genes involved in Amino acid synthesis and interconversion (transamination) |
| 0.1 | 4.0 | REACTOME INFLAMMASOMES | Genes involved in Inflammasomes |
| 0.1 | 1.7 | REACTOME COMMON PATHWAY | Genes involved in Common Pathway |
| 0.1 | 2.4 | REACTOME FACILITATIVE NA INDEPENDENT GLUCOSE TRANSPORTERS | Genes involved in Facilitative Na+-independent glucose transporters |
| 0.1 | 3.3 | REACTOME ACTIVATION OF THE PRE REPLICATIVE COMPLEX | Genes involved in Activation of the pre-replicative complex |
| 0.1 | 2.6 | REACTOME SIGNAL REGULATORY PROTEIN SIRP FAMILY INTERACTIONS | Genes involved in Signal regulatory protein (SIRP) family interactions |
| 0.1 | 0.5 | REACTOME THROMBIN SIGNALLING THROUGH PROTEINASE ACTIVATED RECEPTORS PARS | Genes involved in Thrombin signalling through proteinase activated receptors (PARs) |
| 0.1 | 3.1 | REACTOME ANTIGEN ACTIVATES B CELL RECEPTOR LEADING TO GENERATION OF SECOND MESSENGERS | Genes involved in Antigen Activates B Cell Receptor Leading to Generation of Second Messengers |
| 0.1 | 3.5 | REACTOME REGULATION OF GENE EXPRESSION IN BETA CELLS | Genes involved in Regulation of gene expression in beta cells |
| 0.1 | 3.0 | REACTOME RAP1 SIGNALLING | Genes involved in Rap1 signalling |
| 0.1 | 0.8 | REACTOME ELEVATION OF CYTOSOLIC CA2 LEVELS | Genes involved in Elevation of cytosolic Ca2+ levels |
| 0.1 | 1.5 | REACTOME ABCA TRANSPORTERS IN LIPID HOMEOSTASIS | Genes involved in ABCA transporters in lipid homeostasis |
| 0.1 | 2.0 | REACTOME G BETA GAMMA SIGNALLING THROUGH PLC BETA | Genes involved in G beta:gamma signalling through PLC beta |
| 0.0 | 0.7 | REACTOME DIGESTION OF DIETARY CARBOHYDRATE | Genes involved in Digestion of dietary carbohydrate |
| 0.0 | 2.7 | REACTOME CHEMOKINE RECEPTORS BIND CHEMOKINES | Genes involved in Chemokine receptors bind chemokines |
| 0.0 | 1.8 | REACTOME TIGHT JUNCTION INTERACTIONS | Genes involved in Tight junction interactions |
| 0.0 | 1.1 | REACTOME DEPOSITION OF NEW CENPA CONTAINING NUCLEOSOMES AT THE CENTROMERE | Genes involved in Deposition of New CENPA-containing Nucleosomes at the Centromere |
| 0.0 | 2.1 | REACTOME RECYCLING PATHWAY OF L1 | Genes involved in Recycling pathway of L1 |
| 0.0 | 2.0 | REACTOME G ALPHA Z SIGNALLING EVENTS | Genes involved in G alpha (z) signalling events |
| 0.0 | 3.5 | REACTOME ACTIVATION OF THE MRNA UPON BINDING OF THE CAP BINDING COMPLEX AND EIFS AND SUBSEQUENT BINDING TO 43S | Genes involved in Activation of the mRNA upon binding of the cap-binding complex and eIFs, and subsequent binding to 43S |
| 0.0 | 0.9 | REACTOME TRAFFICKING OF GLUR2 CONTAINING AMPA RECEPTORS | Genes involved in Trafficking of GluR2-containing AMPA receptors |
| 0.0 | 1.3 | REACTOME POST TRANSLATIONAL MODIFICATION SYNTHESIS OF GPI ANCHORED PROTEINS | Genes involved in Post-translational modification: synthesis of GPI-anchored proteins |
| 0.0 | 1.0 | REACTOME CONVERSION FROM APC C CDC20 TO APC C CDH1 IN LATE ANAPHASE | Genes involved in Conversion from APC/C:Cdc20 to APC/C:Cdh1 in late anaphase |
| 0.0 | 2.9 | REACTOME IMMUNOREGULATORY INTERACTIONS BETWEEN A LYMPHOID AND A NON LYMPHOID CELL | Genes involved in Immunoregulatory interactions between a Lymphoid and a non-Lymphoid cell |
| 0.0 | 0.6 | REACTOME CYTOSOLIC SULFONATION OF SMALL MOLECULES | Genes involved in Cytosolic sulfonation of small molecules |
| 0.0 | 1.0 | REACTOME TERMINATION OF O GLYCAN BIOSYNTHESIS | Genes involved in Termination of O-glycan biosynthesis |
| 0.0 | 0.9 | REACTOME ACTIVATED NOTCH1 TRANSMITS SIGNAL TO THE NUCLEUS | Genes involved in Activated NOTCH1 Transmits Signal to the Nucleus |
| 0.0 | 0.8 | REACTOME CELL EXTRACELLULAR MATRIX INTERACTIONS | Genes involved in Cell-extracellular matrix interactions |
| 0.0 | 0.7 | REACTOME EXTRINSIC PATHWAY FOR APOPTOSIS | Genes involved in Extrinsic Pathway for Apoptosis |
| 0.0 | 3.2 | REACTOME G ALPHA I SIGNALLING EVENTS | Genes involved in G alpha (i) signalling events |
| 0.0 | 1.4 | REACTOME INTEGRIN CELL SURFACE INTERACTIONS | Genes involved in Integrin cell surface interactions |
| 0.0 | 1.1 | REACTOME SMAD2 SMAD3 SMAD4 HETEROTRIMER REGULATES TRANSCRIPTION | Genes involved in SMAD2/SMAD3:SMAD4 heterotrimer regulates transcription |
| 0.0 | 1.4 | REACTOME ACTIVATION OF CHAPERONE GENES BY XBP1S | Genes involved in Activation of Chaperone Genes by XBP1(S) |
| 0.0 | 1.6 | REACTOME INTERFERON ALPHA BETA SIGNALING | Genes involved in Interferon alpha/beta signaling |
| 0.0 | 0.5 | REACTOME THE ROLE OF NEF IN HIV1 REPLICATION AND DISEASE PATHOGENESIS | Genes involved in The role of Nef in HIV-1 replication and disease pathogenesis |
| 0.0 | 1.4 | REACTOME METABOLISM OF VITAMINS AND COFACTORS | Genes involved in Metabolism of vitamins and cofactors |
| 0.0 | 2.8 | REACTOME TOLL RECEPTOR CASCADES | Genes involved in Toll Receptor Cascades |
| 0.0 | 0.7 | REACTOME HS GAG BIOSYNTHESIS | Genes involved in HS-GAG biosynthesis |
| 0.0 | 1.1 | REACTOME VOLTAGE GATED POTASSIUM CHANNELS | Genes involved in Voltage gated Potassium channels |
| 0.0 | 0.2 | REACTOME GLUCOSE TRANSPORT | Genes involved in Glucose transport |
| 0.0 | 0.6 | REACTOME BASIGIN INTERACTIONS | Genes involved in Basigin interactions |
| 0.0 | 0.4 | REACTOME NOREPINEPHRINE NEUROTRANSMITTER RELEASE CYCLE | Genes involved in Norepinephrine Neurotransmitter Release Cycle |
| 0.0 | 1.2 | REACTOME 3 UTR MEDIATED TRANSLATIONAL REGULATION | Genes involved in 3' -UTR-mediated translational regulation |
| 0.0 | 0.5 | REACTOME SIGNALING BY BMP | Genes involved in Signaling by BMP |
| 0.0 | 0.2 | REACTOME G1 S SPECIFIC TRANSCRIPTION | Genes involved in G1/S-Specific Transcription |