Project
Illumina Body Map 2 (GSE30611)
Navigation
Downloads
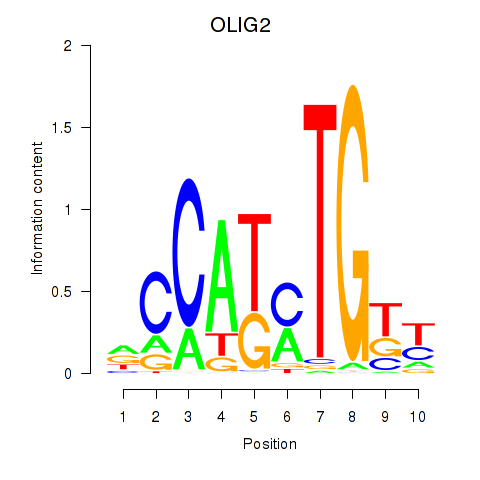
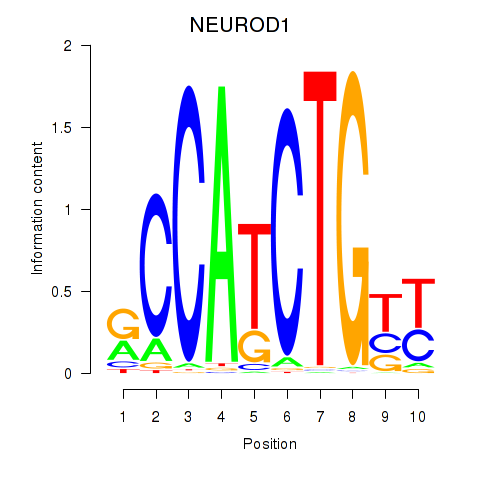
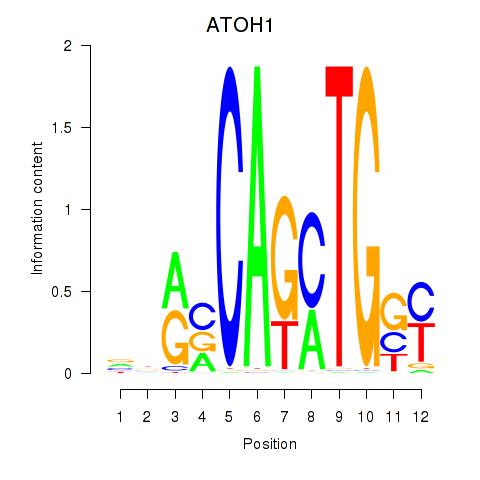
Results for OLIG2_NEUROD1_ATOH1
Z-value: 1.18
Motif logo
Transcription factors associated with OLIG2_NEUROD1_ATOH1
| Gene Symbol | Gene ID | Gene Info |
|---|---|---|
|
OLIG2
|
ENSG00000205927.5 | oligodendrocyte transcription factor 2 |
|
NEUROD1
|
ENSG00000162992.5 | neuronal differentiation 1 |
|
ATOH1
|
ENSG00000172238.6 | atonal bHLH transcription factor 1 |
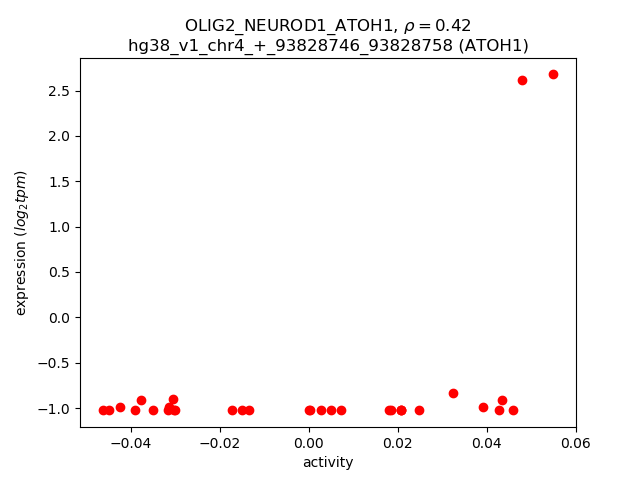
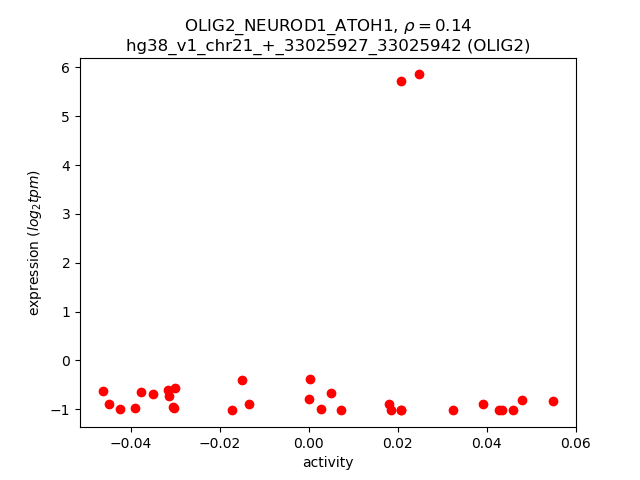
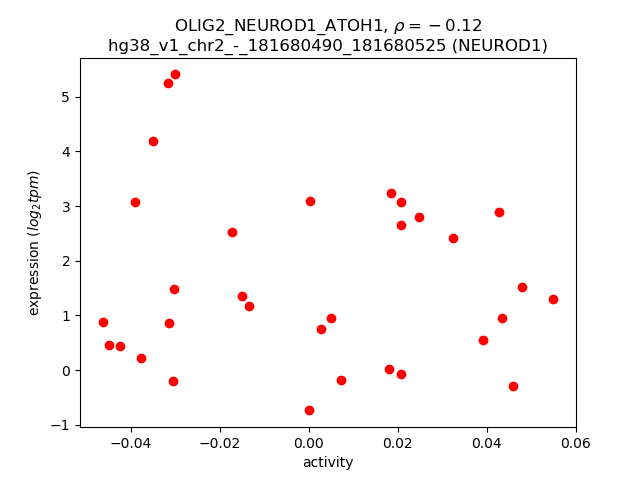
Activity-expression correlation:
| Gene | Promoter | Pearson corr. coef. | P-value | Plot |
|---|---|---|---|---|
| ATOH1 | hg38_v1_chr4_+_93828746_93828758 | 0.42 | 1.6e-02 | Click! |
| OLIG2 | hg38_v1_chr21_+_33025927_33025942 | 0.14 | 4.3e-01 | Click! |
| NEUROD1 | hg38_v1_chr2_-_181680490_181680525 | -0.12 | 5.3e-01 | Click! |
Activity profile of OLIG2_NEUROD1_ATOH1 motif
Sorted Z-values of OLIG2_NEUROD1_ATOH1 motif
Network of associatons between targets according to the STRING database.

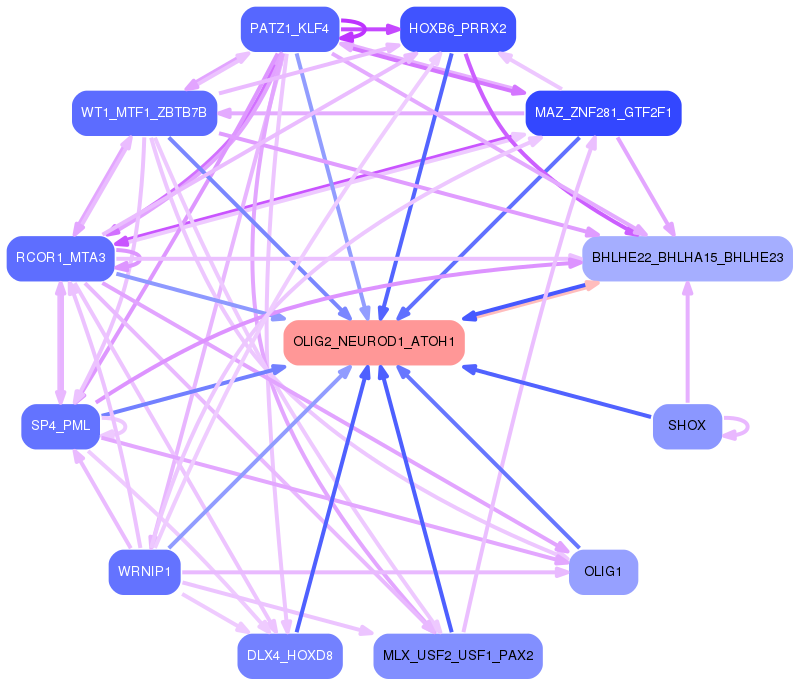
First level regulatory network of OLIG2_NEUROD1_ATOH1
Gene Ontology Analysis
Gene overrepresentation in biological process category:
| Log-likelihood per target | Total log-likelihood | Term | Description |
|---|---|---|---|
| 1.1 | 4.5 | GO:2000097 | regulation of smooth muscle cell-matrix adhesion(GO:2000097) |
| 0.5 | 1.4 | GO:0015938 | coenzyme A catabolic process(GO:0015938) nucleoside bisphosphate catabolic process(GO:0033869) ribonucleoside bisphosphate catabolic process(GO:0034031) purine nucleoside bisphosphate catabolic process(GO:0034034) |
| 0.4 | 4.6 | GO:0036371 | protein localization to T-tubule(GO:0036371) |
| 0.4 | 1.1 | GO:0043438 | acetoacetic acid metabolic process(GO:0043438) |
| 0.4 | 1.5 | GO:0090285 | negative regulation of protein glycosylation in Golgi(GO:0090285) |
| 0.3 | 4.3 | GO:0009414 | response to water deprivation(GO:0009414) |
| 0.3 | 1.1 | GO:0001869 | regulation of complement activation, lectin pathway(GO:0001868) negative regulation of complement activation, lectin pathway(GO:0001869) |
| 0.2 | 0.7 | GO:0018395 | peptidyl-lysine hydroxylation to 5-hydroxy-L-lysine(GO:0018395) histone arginine demethylation(GO:0070077) histone H3-R2 demethylation(GO:0070078) histone H4-R3 demethylation(GO:0070079) |
| 0.2 | 0.7 | GO:2000296 | lysosomal membrane organization(GO:0097212) negative regulation of hydrogen peroxide catabolic process(GO:2000296) regulation of oxygen metabolic process(GO:2000374) |
| 0.2 | 1.2 | GO:0035106 | operant conditioning(GO:0035106) |
| 0.2 | 1.6 | GO:0018032 | protein amidation(GO:0018032) |
| 0.2 | 1.2 | GO:0038098 | sequestering of BMP from receptor via BMP binding(GO:0038098) |
| 0.2 | 0.9 | GO:0014734 | skeletal muscle hypertrophy(GO:0014734) |
| 0.2 | 1.4 | GO:0099558 | maintenance of synapse structure(GO:0099558) |
| 0.2 | 0.6 | GO:0033861 | negative regulation of NAD(P)H oxidase activity(GO:0033861) negative regulation of respiratory burst involved in inflammatory response(GO:0060266) |
| 0.2 | 3.4 | GO:0014722 | regulation of skeletal muscle contraction by calcium ion signaling(GO:0014722) |
| 0.2 | 0.5 | GO:0043449 | olfactory learning(GO:0008355) cellular alkene metabolic process(GO:0043449) |
| 0.2 | 0.5 | GO:0002445 | type IIa hypersensitivity(GO:0001794) regulation of type IIa hypersensitivity(GO:0001796) positive regulation of activation of membrane attack complex(GO:0001970) type II hypersensitivity(GO:0002445) regulation of type II hypersensitivity(GO:0002892) |
| 0.2 | 0.5 | GO:0061033 | secretion by lung epithelial cell involved in lung growth(GO:0061033) |
| 0.2 | 0.5 | GO:1902303 | regulation of heart rate by hormone(GO:0003064) negative regulation of potassium ion export(GO:1902303) |
| 0.2 | 1.5 | GO:0043314 | negative regulation of neutrophil degranulation(GO:0043314) |
| 0.2 | 0.8 | GO:0035790 | platelet-derived growth factor receptor-alpha signaling pathway(GO:0035790) |
| 0.1 | 0.7 | GO:0001575 | globoside metabolic process(GO:0001575) |
| 0.1 | 1.3 | GO:0035405 | histone-threonine phosphorylation(GO:0035405) |
| 0.1 | 3.7 | GO:0003334 | keratinocyte development(GO:0003334) |
| 0.1 | 0.4 | GO:0003032 | detection of oxygen(GO:0003032) |
| 0.1 | 0.6 | GO:0007206 | phospholipase C-activating G-protein coupled glutamate receptor signaling pathway(GO:0007206) |
| 0.1 | 1.6 | GO:0051612 | negative regulation of neurotransmitter uptake(GO:0051581) regulation of serotonin uptake(GO:0051611) negative regulation of serotonin uptake(GO:0051612) |
| 0.1 | 0.8 | GO:0044333 | Wnt signaling pathway involved in digestive tract morphogenesis(GO:0044333) |
| 0.1 | 0.9 | GO:0006741 | NADP biosynthetic process(GO:0006741) |
| 0.1 | 0.3 | GO:0002194 | hepatocyte cell migration(GO:0002194) otic placode formation(GO:0043049) branching involved in pancreas morphogenesis(GO:0061114) acinar cell differentiation(GO:0090425) positive regulation of forebrain neuron differentiation(GO:2000979) |
| 0.1 | 0.7 | GO:0097498 | endothelial tube lumen extension(GO:0097498) |
| 0.1 | 2.9 | GO:0061339 | establishment or maintenance of monopolar cell polarity(GO:0061339) |
| 0.1 | 0.8 | GO:1900827 | maintenance of protein location in membrane(GO:0072658) maintenance of protein location in plasma membrane(GO:0072660) positive regulation of membrane depolarization during cardiac muscle cell action potential(GO:1900827) |
| 0.1 | 0.3 | GO:0010932 | macrophage tolerance induction(GO:0010931) regulation of macrophage tolerance induction(GO:0010932) positive regulation of macrophage tolerance induction(GO:0010933) |
| 0.1 | 0.5 | GO:0051758 | homologous chromosome movement towards spindle pole involved in homologous chromosome segregation(GO:0051758) |
| 0.1 | 2.1 | GO:0032780 | negative regulation of ATPase activity(GO:0032780) |
| 0.1 | 0.7 | GO:0008582 | regulation of synaptic growth at neuromuscular junction(GO:0008582) |
| 0.1 | 1.7 | GO:0019388 | galactose catabolic process(GO:0019388) |
| 0.1 | 1.4 | GO:0098914 | membrane repolarization during atrial cardiac muscle cell action potential(GO:0098914) |
| 0.1 | 0.3 | GO:0060302 | negative regulation of interleukin-18 production(GO:0032701) negative regulation of cytokine activity(GO:0060302) negative regulation of chemokine (C-C motif) ligand 5 production(GO:0071650) |
| 0.1 | 0.7 | GO:0097052 | L-kynurenine metabolic process(GO:0097052) |
| 0.1 | 0.4 | GO:0072717 | cellular response to actinomycin D(GO:0072717) |
| 0.1 | 1.3 | GO:0021942 | radial glia guided migration of Purkinje cell(GO:0021942) |
| 0.1 | 0.8 | GO:0021633 | optic nerve structural organization(GO:0021633) |
| 0.1 | 0.2 | GO:1902309 | negative regulation of peptidyl-serine dephosphorylation(GO:1902309) |
| 0.1 | 1.2 | GO:0070327 | thyroid hormone transport(GO:0070327) |
| 0.1 | 0.3 | GO:0036269 | swimming behavior(GO:0036269) |
| 0.1 | 0.2 | GO:1902630 | regulation of membrane hyperpolarization(GO:1902630) |
| 0.1 | 0.4 | GO:1904428 | negative regulation of tubulin deacetylation(GO:1904428) |
| 0.1 | 0.1 | GO:0015870 | acetylcholine transport(GO:0015870) |
| 0.1 | 0.2 | GO:0046416 | D-amino acid metabolic process(GO:0046416) |
| 0.1 | 0.4 | GO:0099640 | axo-dendritic protein transport(GO:0099640) |
| 0.1 | 1.4 | GO:2001256 | regulation of store-operated calcium entry(GO:2001256) |
| 0.1 | 0.3 | GO:0038031 | non-canonical Wnt signaling pathway via JNK cascade(GO:0038031) |
| 0.1 | 1.6 | GO:0035414 | negative regulation of catenin import into nucleus(GO:0035414) |
| 0.1 | 0.8 | GO:0035095 | behavioral response to nicotine(GO:0035095) |
| 0.1 | 0.5 | GO:0070278 | extracellular matrix constituent secretion(GO:0070278) |
| 0.1 | 0.3 | GO:1903361 | protein localization to basolateral plasma membrane(GO:1903361) |
| 0.1 | 0.3 | GO:0098746 | fast, calcium ion-dependent exocytosis of neurotransmitter(GO:0098746) |
| 0.1 | 0.9 | GO:0070777 | D-aspartate transport(GO:0070777) D-aspartate import(GO:0070779) |
| 0.1 | 0.2 | GO:0044537 | regulation of circulating fibrinogen levels(GO:0044537) |
| 0.1 | 0.8 | GO:0048245 | eosinophil chemotaxis(GO:0048245) |
| 0.1 | 0.5 | GO:0018230 | peptidyl-L-cysteine S-palmitoylation(GO:0018230) peptidyl-S-diacylglycerol-L-cysteine biosynthetic process from peptidyl-cysteine(GO:0018231) |
| 0.1 | 0.3 | GO:0034287 | detection of carbohydrate stimulus(GO:0009730) detection of hexose stimulus(GO:0009732) detection of monosaccharide stimulus(GO:0034287) detection of glucose(GO:0051594) |
| 0.1 | 1.3 | GO:0043374 | CD8-positive, alpha-beta T cell differentiation(GO:0043374) |
| 0.1 | 0.2 | GO:0046709 | IDP metabolic process(GO:0046707) IDP catabolic process(GO:0046709) |
| 0.1 | 1.2 | GO:0008090 | retrograde axonal transport(GO:0008090) |
| 0.1 | 0.6 | GO:2000795 | lung ciliated cell differentiation(GO:0061141) regulation of mesenchymal cell proliferation involved in lung development(GO:2000790) negative regulation of mesenchymal cell proliferation involved in lung development(GO:2000791) negative regulation of epithelial cell proliferation involved in lung morphogenesis(GO:2000795) |
| 0.1 | 0.2 | GO:1902683 | regulation of receptor localization to synapse(GO:1902683) |
| 0.0 | 0.5 | GO:0086024 | adrenergic receptor signaling pathway involved in positive regulation of heart rate(GO:0086024) |
| 0.0 | 0.5 | GO:1990034 | calcium ion export from cell(GO:1990034) |
| 0.0 | 0.2 | GO:1903615 | regulation of protein tyrosine phosphatase activity(GO:1903613) positive regulation of protein tyrosine phosphatase activity(GO:1903615) |
| 0.0 | 0.4 | GO:0032224 | positive regulation of synaptic transmission, cholinergic(GO:0032224) |
| 0.0 | 0.4 | GO:0033564 | anterior/posterior axon guidance(GO:0033564) |
| 0.0 | 0.1 | GO:0006601 | creatine biosynthetic process(GO:0006601) |
| 0.0 | 0.8 | GO:0097113 | AMPA glutamate receptor clustering(GO:0097113) glutamate receptor clustering(GO:0097688) |
| 0.0 | 0.1 | GO:0019364 | NADP catabolic process(GO:0006742) pyridine nucleotide catabolic process(GO:0019364) |
| 0.0 | 2.3 | GO:0003298 | physiological muscle hypertrophy(GO:0003298) physiological cardiac muscle hypertrophy(GO:0003301) cell growth involved in cardiac muscle cell development(GO:0061049) |
| 0.0 | 1.7 | GO:0048268 | clathrin coat assembly(GO:0048268) |
| 0.0 | 0.2 | GO:0060040 | retinal bipolar neuron differentiation(GO:0060040) |
| 0.0 | 0.5 | GO:2000601 | positive regulation of Arp2/3 complex-mediated actin nucleation(GO:2000601) |
| 0.0 | 0.5 | GO:0006682 | galactosylceramide biosynthetic process(GO:0006682) galactolipid biosynthetic process(GO:0019375) |
| 0.0 | 0.7 | GO:0046007 | negative regulation of activated T cell proliferation(GO:0046007) |
| 0.0 | 0.2 | GO:0043553 | negative regulation of phosphatidylinositol 3-kinase activity(GO:0043553) |
| 0.0 | 2.1 | GO:0002026 | regulation of the force of heart contraction(GO:0002026) |
| 0.0 | 0.3 | GO:0072513 | positive regulation of secondary heart field cardioblast proliferation(GO:0072513) |
| 0.0 | 0.8 | GO:0043562 | cellular response to nitrogen starvation(GO:0006995) cellular response to nitrogen levels(GO:0043562) |
| 0.0 | 0.3 | GO:0055129 | L-proline biosynthetic process(GO:0055129) |
| 0.0 | 0.8 | GO:0042753 | positive regulation of circadian rhythm(GO:0042753) |
| 0.0 | 0.1 | GO:1904000 | positive regulation of eating behavior(GO:1904000) |
| 0.0 | 0.4 | GO:0046959 | habituation(GO:0046959) |
| 0.0 | 0.5 | GO:0015693 | magnesium ion transport(GO:0015693) |
| 0.0 | 0.8 | GO:0000028 | ribosomal small subunit assembly(GO:0000028) |
| 0.0 | 0.5 | GO:0000338 | protein deneddylation(GO:0000338) |
| 0.0 | 0.1 | GO:0018106 | peptidyl-histidine phosphorylation(GO:0018106) |
| 0.0 | 0.8 | GO:0035988 | chondrocyte proliferation(GO:0035988) |
| 0.0 | 0.2 | GO:0030821 | negative regulation of cyclic nucleotide catabolic process(GO:0030806) negative regulation of cAMP catabolic process(GO:0030821) |
| 0.0 | 0.2 | GO:0019236 | response to pheromone(GO:0019236) |
| 0.0 | 1.0 | GO:1905145 | acetylcholine receptor signaling pathway(GO:0095500) postsynaptic signal transduction(GO:0098926) signal transduction involved in cellular response to ammonium ion(GO:1903831) response to acetylcholine(GO:1905144) cellular response to acetylcholine(GO:1905145) |
| 0.0 | 2.8 | GO:0007157 | heterophilic cell-cell adhesion via plasma membrane cell adhesion molecules(GO:0007157) |
| 0.0 | 0.1 | GO:0048496 | maintenance of organ identity(GO:0048496) |
| 0.0 | 0.1 | GO:0038018 | Wnt receptor catabolic process(GO:0038018) |
| 0.0 | 0.8 | GO:0031115 | negative regulation of microtubule polymerization(GO:0031115) |
| 0.0 | 0.3 | GO:0060158 | phospholipase C-activating dopamine receptor signaling pathway(GO:0060158) |
| 0.0 | 0.3 | GO:0097105 | presynaptic membrane assembly(GO:0097105) |
| 0.0 | 0.2 | GO:0003221 | right ventricular cardiac muscle tissue morphogenesis(GO:0003221) |
| 0.0 | 0.1 | GO:1901350 | cell-cell signaling involved in cell-cell junction organization(GO:1901350) |
| 0.0 | 1.4 | GO:0008089 | anterograde axonal transport(GO:0008089) |
| 0.0 | 0.1 | GO:0071930 | positive regulation of DNA endoreduplication(GO:0032877) negative regulation of transcription involved in G1/S transition of mitotic cell cycle(GO:0071930) |
| 0.0 | 0.2 | GO:1902723 | negative regulation of skeletal muscle cell proliferation(GO:0014859) negative regulation of skeletal muscle satellite cell proliferation(GO:1902723) |
| 0.0 | 0.3 | GO:0042090 | interleukin-12 biosynthetic process(GO:0042090) regulation of interleukin-12 biosynthetic process(GO:0045075) |
| 0.0 | 0.2 | GO:1904637 | response to ionomycin(GO:1904636) cellular response to ionomycin(GO:1904637) |
| 0.0 | 0.2 | GO:0090210 | regulation of establishment of blood-brain barrier(GO:0090210) |
| 0.0 | 0.6 | GO:0006853 | carnitine shuttle(GO:0006853) |
| 0.0 | 0.4 | GO:0014877 | response to muscle inactivity involved in regulation of muscle adaptation(GO:0014877) response to denervation involved in regulation of muscle adaptation(GO:0014894) |
| 0.0 | 0.1 | GO:0014846 | esophagus smooth muscle contraction(GO:0014846) |
| 0.0 | 0.3 | GO:0036089 | cleavage furrow formation(GO:0036089) |
| 0.0 | 0.3 | GO:0031987 | locomotion involved in locomotory behavior(GO:0031987) |
| 0.0 | 0.1 | GO:0015853 | adenine transport(GO:0015853) |
| 0.0 | 0.1 | GO:0034334 | adherens junction maintenance(GO:0034334) |
| 0.0 | 0.2 | GO:0006072 | glycerol-3-phosphate metabolic process(GO:0006072) |
| 0.0 | 0.4 | GO:1903715 | regulation of aerobic respiration(GO:1903715) |
| 0.0 | 0.1 | GO:0014878 | response to electrical stimulus involved in regulation of muscle adaptation(GO:0014878) |
| 0.0 | 0.1 | GO:1903045 | neural crest cell migration involved in sympathetic nervous system development(GO:1903045) |
| 0.0 | 0.1 | GO:0072061 | inner medullary collecting duct development(GO:0072061) |
| 0.0 | 0.1 | GO:0097211 | response to gonadotropin-releasing hormone(GO:0097210) cellular response to gonadotropin-releasing hormone(GO:0097211) |
| 0.0 | 0.3 | GO:0042670 | retinal cone cell differentiation(GO:0042670) retinal cone cell development(GO:0046549) |
| 0.0 | 0.1 | GO:0030682 | evasion or tolerance of host immune response(GO:0020012) evasion or tolerance of host defense response(GO:0030682) evasion or tolerance by virus of host immune response(GO:0030683) evasion or tolerance of immune response of other organism involved in symbiotic interaction(GO:0051805) evasion or tolerance of defense response of other organism involved in symbiotic interaction(GO:0051807) |
| 0.0 | 0.5 | GO:0051654 | establishment of mitochondrion localization(GO:0051654) |
| 0.0 | 0.7 | GO:0032060 | bleb assembly(GO:0032060) |
| 0.0 | 0.4 | GO:0001574 | ganglioside biosynthetic process(GO:0001574) |
| 0.0 | 2.4 | GO:0035690 | cellular response to drug(GO:0035690) |
| 0.0 | 0.2 | GO:0021979 | hypothalamus cell differentiation(GO:0021979) |
| 0.0 | 0.6 | GO:0006004 | fucose metabolic process(GO:0006004) |
| 0.0 | 0.1 | GO:0030311 | poly-N-acetyllactosamine biosynthetic process(GO:0030311) |
| 0.0 | 0.1 | GO:0045229 | cell envelope organization(GO:0043163) external encapsulating structure organization(GO:0045229) |
| 0.0 | 0.3 | GO:0051967 | negative regulation of synaptic transmission, glutamatergic(GO:0051967) |
| 0.0 | 1.4 | GO:0043268 | positive regulation of potassium ion transport(GO:0043268) |
| 0.0 | 1.8 | GO:0000381 | regulation of alternative mRNA splicing, via spliceosome(GO:0000381) |
| 0.0 | 0.3 | GO:2001214 | positive regulation of vasculogenesis(GO:2001214) |
| 0.0 | 0.2 | GO:0002329 | pre-B cell differentiation(GO:0002329) |
| 0.0 | 0.4 | GO:0034390 | smooth muscle cell apoptotic process(GO:0034390) regulation of smooth muscle cell apoptotic process(GO:0034391) |
| 0.0 | 0.9 | GO:0010039 | response to iron ion(GO:0010039) |
| 0.0 | 0.5 | GO:0097062 | dendritic spine maintenance(GO:0097062) |
| 0.0 | 0.2 | GO:0018095 | protein polyglutamylation(GO:0018095) |
| 0.0 | 0.2 | GO:0038166 | angiotensin-activated signaling pathway(GO:0038166) |
| 0.0 | 0.2 | GO:0060073 | micturition(GO:0060073) smooth muscle contraction involved in micturition(GO:0060083) |
| 0.0 | 0.3 | GO:0035372 | protein localization to microtubule(GO:0035372) |
| 0.0 | 0.1 | GO:0036414 | protein citrullination(GO:0018101) histone citrullination(GO:0036414) |
| 0.0 | 0.7 | GO:0010765 | positive regulation of sodium ion transport(GO:0010765) |
| 0.0 | 0.1 | GO:0035494 | SNARE complex disassembly(GO:0035494) |
| 0.0 | 0.0 | GO:0099404 | negative regulation of maintenance of sister chromatid cohesion(GO:0034092) negative regulation of maintenance of mitotic sister chromatid cohesion(GO:0034183) maintenance of mitotic sister chromatid cohesion, telomeric(GO:0099403) mitotic sister chromatid cohesion, telomeric(GO:0099404) regulation of maintenance of mitotic sister chromatid cohesion, telomeric(GO:1904907) negative regulation of maintenance of mitotic sister chromatid cohesion, telomeric(GO:1904908) |
| 0.0 | 0.2 | GO:0050957 | equilibrioception(GO:0050957) |
| 0.0 | 0.1 | GO:0001757 | somite specification(GO:0001757) sclerotome development(GO:0061056) |
| 0.0 | 0.2 | GO:0045199 | maintenance of apical/basal cell polarity(GO:0035090) maintenance of epithelial cell apical/basal polarity(GO:0045199) |
| 0.0 | 0.3 | GO:2001224 | positive regulation of neuron migration(GO:2001224) |
| 0.0 | 0.2 | GO:0038007 | netrin-activated signaling pathway(GO:0038007) |
| 0.0 | 0.1 | GO:0034421 | post-translational protein acetylation(GO:0034421) |
| 0.0 | 1.8 | GO:0006501 | C-terminal protein lipidation(GO:0006501) |
| 0.0 | 0.3 | GO:0002091 | negative regulation of receptor internalization(GO:0002091) |
| 0.0 | 0.2 | GO:1903817 | negative regulation of delayed rectifier potassium channel activity(GO:1902260) negative regulation of voltage-gated potassium channel activity(GO:1903817) |
| 0.0 | 0.6 | GO:0045737 | positive regulation of cyclin-dependent protein serine/threonine kinase activity(GO:0045737) |
| 0.0 | 0.4 | GO:0021854 | hypothalamus development(GO:0021854) |
| 0.0 | 0.3 | GO:0048742 | regulation of skeletal muscle fiber development(GO:0048742) |
| 0.0 | 0.1 | GO:0014052 | regulation of gamma-aminobutyric acid secretion(GO:0014052) |
| 0.0 | 0.1 | GO:0060754 | positive regulation of mast cell chemotaxis(GO:0060754) |
| 0.0 | 0.1 | GO:2000124 | regulation of endocannabinoid signaling pathway(GO:2000124) |
| 0.0 | 0.5 | GO:0035590 | purinergic nucleotide receptor signaling pathway(GO:0035590) |
| 0.0 | 0.2 | GO:0070560 | protein secretion by platelet(GO:0070560) |
| 0.0 | 1.8 | GO:0030449 | regulation of complement activation(GO:0030449) |
| 0.0 | 2.9 | GO:0006261 | DNA-dependent DNA replication(GO:0006261) |
| 0.0 | 0.2 | GO:0050774 | negative regulation of dendrite morphogenesis(GO:0050774) |
| 0.0 | 0.1 | GO:0001867 | complement activation, lectin pathway(GO:0001867) |
| 0.0 | 1.6 | GO:0030032 | lamellipodium assembly(GO:0030032) |
| 0.0 | 0.1 | GO:0006196 | AMP catabolic process(GO:0006196) adenosine biosynthetic process(GO:0046086) |
| 0.0 | 0.2 | GO:0015747 | urate transport(GO:0015747) |
| 0.0 | 0.6 | GO:0033572 | transferrin transport(GO:0033572) |
| 0.0 | 0.0 | GO:0018277 | protein deamination(GO:0018277) |
| 0.0 | 3.8 | GO:0050911 | detection of chemical stimulus involved in sensory perception of smell(GO:0050911) |
| 0.0 | 0.4 | GO:0010644 | cell communication by electrical coupling(GO:0010644) |
| 0.0 | 0.1 | GO:0003025 | regulation of systemic arterial blood pressure by baroreceptor feedback(GO:0003025) |
| 0.0 | 1.1 | GO:0006939 | smooth muscle contraction(GO:0006939) |
| 0.0 | 0.1 | GO:0019255 | glucose 1-phosphate metabolic process(GO:0019255) |
| 0.0 | 0.2 | GO:0007271 | synaptic transmission, cholinergic(GO:0007271) |
| 0.0 | 0.2 | GO:0002138 | retinoic acid biosynthetic process(GO:0002138) vitamin A metabolic process(GO:0006776) |
Gene overrepresentation in cellular component category:
| Log-likelihood per target | Total log-likelihood | Term | Description |
|---|---|---|---|
| 0.6 | 1.7 | GO:0005914 | spot adherens junction(GO:0005914) |
| 0.2 | 0.9 | GO:0005602 | complement component C1 complex(GO:0005602) |
| 0.1 | 2.1 | GO:0097512 | cardiac myofibril(GO:0097512) |
| 0.1 | 0.9 | GO:0097129 | cyclin D2-CDK4 complex(GO:0097129) |
| 0.1 | 0.9 | GO:0031673 | H zone(GO:0031673) |
| 0.1 | 1.7 | GO:0016013 | syntrophin complex(GO:0016013) |
| 0.1 | 0.5 | GO:1902937 | inward rectifier potassium channel complex(GO:1902937) |
| 0.1 | 2.0 | GO:0043083 | synaptic cleft(GO:0043083) |
| 0.1 | 5.6 | GO:0043034 | costamere(GO:0043034) |
| 0.1 | 4.3 | GO:0031092 | platelet alpha granule membrane(GO:0031092) |
| 0.1 | 0.8 | GO:0033269 | internode region of axon(GO:0033269) |
| 0.1 | 2.1 | GO:0032585 | multivesicular body membrane(GO:0032585) |
| 0.1 | 0.2 | GO:1990435 | stereocilia tip link(GO:0002140) myosin VII complex(GO:0031477) stereocilia tip-link density(GO:1990427) upper tip-link density(GO:1990435) |
| 0.1 | 0.5 | GO:0060201 | clathrin-sculpted acetylcholine transport vesicle(GO:0060200) clathrin-sculpted acetylcholine transport vesicle membrane(GO:0060201) |
| 0.1 | 1.0 | GO:0033162 | melanosome membrane(GO:0033162) chitosome(GO:0045009) |
| 0.1 | 0.9 | GO:0098839 | postsynaptic density membrane(GO:0098839) |
| 0.0 | 0.1 | GO:1990696 | stereocilia ankle link(GO:0002141) USH2 complex(GO:1990696) |
| 0.0 | 3.6 | GO:0002102 | podosome(GO:0002102) |
| 0.0 | 1.6 | GO:0031307 | integral component of mitochondrial outer membrane(GO:0031307) |
| 0.0 | 0.2 | GO:0070032 | synaptobrevin 2-SNAP-25-syntaxin-1a-complexin I complex(GO:0070032) |
| 0.0 | 1.4 | GO:0031672 | A band(GO:0031672) |
| 0.0 | 1.3 | GO:0043218 | compact myelin(GO:0043218) |
| 0.0 | 0.4 | GO:0016011 | dystroglycan complex(GO:0016011) sarcoglycan complex(GO:0016012) |
| 0.0 | 0.3 | GO:0031523 | Myb complex(GO:0031523) |
| 0.0 | 0.8 | GO:0033010 | paranodal junction(GO:0033010) |
| 0.0 | 0.8 | GO:0031045 | dense core granule(GO:0031045) |
| 0.0 | 0.7 | GO:0042589 | zymogen granule membrane(GO:0042589) |
| 0.0 | 2.7 | GO:0005782 | peroxisomal matrix(GO:0005782) microbody lumen(GO:0031907) |
| 0.0 | 0.1 | GO:0019034 | viral replication complex(GO:0019034) |
| 0.0 | 0.5 | GO:0005862 | muscle thin filament tropomyosin(GO:0005862) |
| 0.0 | 0.4 | GO:0044354 | pinosome(GO:0044352) macropinosome(GO:0044354) |
| 0.0 | 0.2 | GO:0005742 | mitochondrial outer membrane translocase complex(GO:0005742) |
| 0.0 | 0.1 | GO:0071817 | MMXD complex(GO:0071817) |
| 0.0 | 0.1 | GO:0036457 | keratohyalin granule(GO:0036457) |
| 0.0 | 1.1 | GO:0005892 | acetylcholine-gated channel complex(GO:0005892) |
| 0.0 | 2.5 | GO:0031228 | intrinsic component of Golgi membrane(GO:0031228) |
| 0.0 | 0.5 | GO:0031209 | SCAR complex(GO:0031209) |
| 0.0 | 5.5 | GO:0022626 | cytosolic ribosome(GO:0022626) |
| 0.0 | 0.3 | GO:0043194 | axon initial segment(GO:0043194) |
| 0.0 | 2.0 | GO:1904115 | axon cytoplasm(GO:1904115) |
| 0.0 | 0.5 | GO:0044300 | cerebellar mossy fiber(GO:0044300) |
| 0.0 | 0.6 | GO:0031588 | nucleotide-activated protein kinase complex(GO:0031588) |
| 0.0 | 1.0 | GO:0033268 | node of Ranvier(GO:0033268) |
| 0.0 | 1.4 | GO:0005720 | nuclear heterochromatin(GO:0005720) |
| 0.0 | 0.2 | GO:0030478 | actin cap(GO:0030478) |
| 0.0 | 0.9 | GO:0000421 | autophagosome membrane(GO:0000421) |
| 0.0 | 1.1 | GO:0046658 | anchored component of plasma membrane(GO:0046658) |
| 0.0 | 0.6 | GO:1990023 | mitotic spindle midzone(GO:1990023) |
| 0.0 | 4.2 | GO:0043204 | perikaryon(GO:0043204) |
| 0.0 | 0.3 | GO:0097450 | astrocyte end-foot(GO:0097450) |
| 0.0 | 0.5 | GO:0005639 | integral component of nuclear inner membrane(GO:0005639) intrinsic component of nuclear inner membrane(GO:0031229) |
| 0.0 | 1.0 | GO:0031594 | neuromuscular junction(GO:0031594) |
| 0.0 | 0.9 | GO:0030673 | axolemma(GO:0030673) |
| 0.0 | 0.4 | GO:0044298 | neuronal cell body membrane(GO:0032809) cell body membrane(GO:0044298) |
| 0.0 | 0.2 | GO:0090665 | dystrophin-associated glycoprotein complex(GO:0016010) glycoprotein complex(GO:0090665) |
| 0.0 | 0.5 | GO:0016342 | catenin complex(GO:0016342) |
| 0.0 | 4.0 | GO:0043197 | dendritic spine(GO:0043197) |
| 0.0 | 0.2 | GO:0000813 | ESCRT I complex(GO:0000813) |
| 0.0 | 0.2 | GO:0097433 | dense body(GO:0097433) |
| 0.0 | 0.2 | GO:0031083 | BLOC-1 complex(GO:0031083) |
| 0.0 | 1.6 | GO:0001725 | stress fiber(GO:0001725) contractile actin filament bundle(GO:0097517) |
| 0.0 | 0.2 | GO:0070652 | HAUS complex(GO:0070652) |
| 0.0 | 2.5 | GO:0016605 | PML body(GO:0016605) |
| 0.0 | 2.3 | GO:0030018 | Z disc(GO:0030018) |
| 0.0 | 1.9 | GO:0005913 | cell-cell adherens junction(GO:0005913) |
| 0.0 | 0.4 | GO:0005922 | connexon complex(GO:0005922) |
| 0.0 | 1.8 | GO:0008076 | voltage-gated potassium channel complex(GO:0008076) |
| 0.0 | 0.2 | GO:0005845 | mRNA cap binding complex(GO:0005845) |
| 0.0 | 0.0 | GO:0030526 | granulocyte macrophage colony-stimulating factor receptor complex(GO:0030526) |
| 0.0 | 3.1 | GO:0072562 | blood microparticle(GO:0072562) |
| 0.0 | 2.0 | GO:0031225 | anchored component of membrane(GO:0031225) |
| 0.0 | 0.2 | GO:0060077 | inhibitory synapse(GO:0060077) |
| 0.0 | 0.1 | GO:0032591 | dendritic spine membrane(GO:0032591) |
Gene overrepresentation in molecular function category:
| Log-likelihood per target | Total log-likelihood | Term | Description |
|---|---|---|---|
| 0.4 | 1.2 | GO:0016497 | substance K receptor activity(GO:0016497) |
| 0.4 | 2.1 | GO:0030172 | troponin C binding(GO:0030172) |
| 0.3 | 2.1 | GO:0032038 | myosin II heavy chain binding(GO:0032038) |
| 0.3 | 1.3 | GO:0004698 | calcium-dependent protein kinase C activity(GO:0004698) |
| 0.3 | 1.2 | GO:0016639 | oxidoreductase activity, acting on the CH-NH2 group of donors, NAD or NADP as acceptor(GO:0016639) |
| 0.3 | 1.1 | GO:0016716 | oxidoreductase activity, acting on paired donors, with incorporation or reduction of molecular oxygen, another compound as one donor, and incorporation of one atom of oxygen(GO:0016716) |
| 0.2 | 0.7 | GO:0033749 | histone demethylase activity (H3-R2 specific)(GO:0033746) histone demethylase activity (H4-R3 specific)(GO:0033749) |
| 0.2 | 1.6 | GO:0004598 | peptidylglycine monooxygenase activity(GO:0004504) peptidylamidoglycolate lyase activity(GO:0004598) |
| 0.2 | 0.6 | GO:0099530 | G-protein coupled receptor activity involved in regulation of postsynaptic membrane potential(GO:0099530) |
| 0.2 | 1.7 | GO:0004614 | phosphoglucomutase activity(GO:0004614) |
| 0.2 | 2.2 | GO:0016286 | small conductance calcium-activated potassium channel activity(GO:0016286) |
| 0.2 | 0.8 | GO:0030550 | acetylcholine receptor inhibitor activity(GO:0030550) |
| 0.2 | 0.5 | GO:0043849 | Ras palmitoyltransferase activity(GO:0043849) |
| 0.2 | 1.1 | GO:0016936 | galactoside binding(GO:0016936) |
| 0.1 | 1.9 | GO:0070097 | delta-catenin binding(GO:0070097) |
| 0.1 | 0.6 | GO:0047804 | cysteine-S-conjugate beta-lyase activity(GO:0047804) L-phenylalanine aminotransferase activity(GO:0070546) |
| 0.1 | 1.3 | GO:0017040 | ceramidase activity(GO:0017040) |
| 0.1 | 0.8 | GO:0005017 | platelet-derived growth factor-activated receptor activity(GO:0005017) |
| 0.1 | 0.5 | GO:0050508 | glucuronosyl-N-acetylglucosaminyl-proteoglycan 4-alpha-N-acetylglucosaminyltransferase activity(GO:0050508) |
| 0.1 | 2.1 | GO:0032051 | clathrin light chain binding(GO:0032051) |
| 0.1 | 0.4 | GO:0008426 | protein kinase C inhibitor activity(GO:0008426) |
| 0.1 | 0.9 | GO:0031811 | G-protein coupled nucleotide receptor binding(GO:0031811) P2Y1 nucleotide receptor binding(GO:0031812) |
| 0.1 | 1.1 | GO:0016015 | morphogen activity(GO:0016015) |
| 0.1 | 0.4 | GO:0070180 | large ribosomal subunit rRNA binding(GO:0070180) |
| 0.1 | 0.5 | GO:0048101 | calcium- and calmodulin-regulated 3',5'-cyclic-GMP phosphodiesterase activity(GO:0048101) |
| 0.1 | 3.0 | GO:0051371 | muscle alpha-actinin binding(GO:0051371) |
| 0.1 | 3.0 | GO:0008093 | cytoskeletal adaptor activity(GO:0008093) |
| 0.1 | 2.5 | GO:0005251 | delayed rectifier potassium channel activity(GO:0005251) |
| 0.1 | 0.7 | GO:0008440 | inositol-1,4,5-trisphosphate 3-kinase activity(GO:0008440) |
| 0.1 | 2.9 | GO:0070182 | DNA polymerase binding(GO:0070182) |
| 0.1 | 0.9 | GO:0032027 | myosin light chain binding(GO:0032027) |
| 0.1 | 5.1 | GO:0030507 | spectrin binding(GO:0030507) |
| 0.1 | 0.4 | GO:0034714 | type III transforming growth factor beta receptor binding(GO:0034714) |
| 0.1 | 1.0 | GO:0046870 | cadmium ion binding(GO:0046870) |
| 0.1 | 0.1 | GO:0005111 | type 2 fibroblast growth factor receptor binding(GO:0005111) |
| 0.1 | 0.9 | GO:0015501 | glutamate:sodium symporter activity(GO:0015501) |
| 0.1 | 0.5 | GO:1904315 | neurotransmitter receptor activity involved in regulation of postsynaptic membrane potential(GO:0099529) transmitter-gated ion channel activity involved in regulation of postsynaptic membrane potential(GO:1904315) |
| 0.1 | 2.0 | GO:0016805 | dipeptidase activity(GO:0016805) |
| 0.1 | 0.1 | GO:0043183 | vascular endothelial growth factor receptor 1 binding(GO:0043183) |
| 0.1 | 0.1 | GO:0036137 | kynurenine-oxoglutarate transaminase activity(GO:0016212) kynurenine aminotransferase activity(GO:0036137) |
| 0.1 | 0.6 | GO:0008607 | phosphorylase kinase regulator activity(GO:0008607) |
| 0.0 | 1.7 | GO:0002162 | dystroglycan binding(GO:0002162) |
| 0.0 | 0.2 | GO:1990430 | extracellular matrix protein binding(GO:1990430) |
| 0.0 | 4.3 | GO:0015485 | cholesterol binding(GO:0015485) |
| 0.0 | 0.4 | GO:0003828 | alpha-N-acetylneuraminate alpha-2,8-sialyltransferase activity(GO:0003828) |
| 0.0 | 0.3 | GO:0008532 | N-acetyllactosaminide beta-1,3-N-acetylglucosaminyltransferase activity(GO:0008532) |
| 0.0 | 0.5 | GO:0004931 | extracellular ATP-gated cation channel activity(GO:0004931) ATP-gated ion channel activity(GO:0035381) |
| 0.0 | 0.2 | GO:0004090 | carbonyl reductase (NADPH) activity(GO:0004090) |
| 0.0 | 0.2 | GO:0019144 | ADP-sugar diphosphatase activity(GO:0019144) |
| 0.0 | 0.3 | GO:0004735 | pyrroline-5-carboxylate reductase activity(GO:0004735) |
| 0.0 | 0.3 | GO:0036132 | 13-prostaglandin reductase activity(GO:0036132) 15-oxoprostaglandin 13-oxidase activity(GO:0047522) |
| 0.0 | 0.1 | GO:0005483 | soluble NSF attachment protein activity(GO:0005483) |
| 0.0 | 0.1 | GO:0005277 | acetylcholine transmembrane transporter activity(GO:0005277) acetate ester transmembrane transporter activity(GO:1901375) |
| 0.0 | 1.1 | GO:0022848 | acetylcholine-gated cation channel activity(GO:0022848) |
| 0.0 | 0.4 | GO:1903763 | gap junction channel activity involved in cell communication by electrical coupling(GO:1903763) |
| 0.0 | 0.3 | GO:0030348 | syntaxin-3 binding(GO:0030348) |
| 0.0 | 0.1 | GO:0015207 | ATP:ADP antiporter activity(GO:0005471) adenine transmembrane transporter activity(GO:0015207) |
| 0.0 | 0.2 | GO:0031728 | CCR3 chemokine receptor binding(GO:0031728) |
| 0.0 | 0.5 | GO:0039706 | co-receptor binding(GO:0039706) |
| 0.0 | 0.2 | GO:0005105 | type 1 fibroblast growth factor receptor binding(GO:0005105) |
| 0.0 | 0.2 | GO:0004945 | angiotensin receptor activity(GO:0001595) angiotensin type II receptor activity(GO:0004945) |
| 0.0 | 0.3 | GO:0042610 | CD8 receptor binding(GO:0042610) |
| 0.0 | 0.9 | GO:0042813 | Wnt-activated receptor activity(GO:0042813) |
| 0.0 | 0.3 | GO:0034988 | Fc-gamma receptor I complex binding(GO:0034988) |
| 0.0 | 0.3 | GO:0004704 | NF-kappaB-inducing kinase activity(GO:0004704) |
| 0.0 | 0.9 | GO:0070006 | metalloaminopeptidase activity(GO:0070006) |
| 0.0 | 0.2 | GO:0004366 | glycerol-3-phosphate O-acyltransferase activity(GO:0004366) |
| 0.0 | 0.7 | GO:0004993 | G-protein coupled serotonin receptor activity(GO:0004993) |
| 0.0 | 1.3 | GO:0042056 | chemoattractant activity(GO:0042056) |
| 0.0 | 0.8 | GO:0001011 | transcription factor activity, sequence-specific DNA binding, RNA polymerase recruiting(GO:0001011) transcription factor activity, TFIIB-class binding(GO:0001087) |
| 0.0 | 0.2 | GO:0070568 | guanylyltransferase activity(GO:0070568) |
| 0.0 | 0.3 | GO:0046920 | alpha-(1->3)-fucosyltransferase activity(GO:0046920) |
| 0.0 | 0.3 | GO:0050692 | DBD domain binding(GO:0050692) |
| 0.0 | 0.2 | GO:0042835 | BRE binding(GO:0042835) |
| 0.0 | 0.7 | GO:0008494 | translation activator activity(GO:0008494) |
| 0.0 | 0.2 | GO:0015277 | kainate selective glutamate receptor activity(GO:0015277) |
| 0.0 | 0.2 | GO:0008853 | exodeoxyribonuclease III activity(GO:0008853) |
| 0.0 | 0.2 | GO:0030144 | alpha-1,6-mannosylglycoprotein 6-beta-N-acetylglucosaminyltransferase activity(GO:0030144) |
| 0.0 | 0.2 | GO:0070740 | tubulin-glutamic acid ligase activity(GO:0070740) |
| 0.0 | 5.7 | GO:0005178 | integrin binding(GO:0005178) |
| 0.0 | 1.3 | GO:0017091 | AU-rich element binding(GO:0017091) |
| 0.0 | 0.1 | GO:0005173 | stem cell factor receptor binding(GO:0005173) |
| 0.0 | 1.0 | GO:0035250 | UDP-galactosyltransferase activity(GO:0035250) |
| 0.0 | 0.5 | GO:0015095 | magnesium ion transmembrane transporter activity(GO:0015095) |
| 0.0 | 1.8 | GO:0004864 | protein phosphatase inhibitor activity(GO:0004864) |
| 0.0 | 0.3 | GO:0001591 | dopamine neurotransmitter receptor activity, coupled via Gi/Go(GO:0001591) |
| 0.0 | 0.1 | GO:0004307 | ethanolaminephosphotransferase activity(GO:0004307) |
| 0.0 | 0.2 | GO:0038132 | neuregulin binding(GO:0038132) |
| 0.0 | 0.1 | GO:0016520 | growth hormone-releasing hormone receptor activity(GO:0016520) |
| 0.0 | 0.6 | GO:0001871 | pattern binding(GO:0001871) polysaccharide binding(GO:0030247) |
| 0.0 | 0.1 | GO:0035514 | DNA demethylase activity(GO:0035514) DNA-N1-methyladenine dioxygenase activity(GO:0043734) |
| 0.0 | 0.6 | GO:0042043 | neurexin family protein binding(GO:0042043) |
| 0.0 | 1.4 | GO:0016831 | carboxy-lyase activity(GO:0016831) |
| 0.0 | 1.6 | GO:0019888 | protein phosphatase regulator activity(GO:0019888) |
| 0.0 | 0.1 | GO:0004668 | protein-arginine deiminase activity(GO:0004668) |
| 0.0 | 0.1 | GO:0034618 | arginine binding(GO:0034618) |
| 0.0 | 0.5 | GO:0031698 | beta-2 adrenergic receptor binding(GO:0031698) |
| 0.0 | 0.2 | GO:0005314 | high-affinity glutamate transmembrane transporter activity(GO:0005314) |
| 0.0 | 0.2 | GO:0060072 | large conductance calcium-activated potassium channel activity(GO:0060072) |
| 0.0 | 0.3 | GO:0005225 | volume-sensitive anion channel activity(GO:0005225) |
| 0.0 | 0.1 | GO:0008449 | N-acetylglucosamine-6-sulfatase activity(GO:0008449) |
| 0.0 | 0.0 | GO:0033858 | N-acetylgalactosamine kinase activity(GO:0033858) |
| 0.0 | 0.4 | GO:0030215 | semaphorin receptor binding(GO:0030215) |
| 0.0 | 0.1 | GO:0004673 | protein histidine kinase activity(GO:0004673) |
| 0.0 | 0.1 | GO:0051748 | UTP:glucose-1-phosphate uridylyltransferase activity(GO:0003983) UTP-monosaccharide-1-phosphate uridylyltransferase activity(GO:0051748) |
| 0.0 | 0.1 | GO:0003986 | acetyl-CoA hydrolase activity(GO:0003986) |
| 0.0 | 0.4 | GO:0005109 | frizzled binding(GO:0005109) |
| 0.0 | 0.1 | GO:0097603 | temperature-gated ion channel activity(GO:0097603) |
| 0.0 | 0.8 | GO:0005158 | insulin receptor binding(GO:0005158) |
| 0.0 | 0.3 | GO:0008179 | adenylate cyclase binding(GO:0008179) |
| 0.0 | 2.0 | GO:0004222 | metalloendopeptidase activity(GO:0004222) |
| 0.0 | 0.6 | GO:0043015 | gamma-tubulin binding(GO:0043015) |
| 0.0 | 0.0 | GO:0008859 | exoribonuclease II activity(GO:0008859) |
| 0.0 | 0.4 | GO:0016638 | oxidoreductase activity, acting on the CH-NH2 group of donors(GO:0016638) |
| 0.0 | 0.2 | GO:0008140 | cAMP response element binding protein binding(GO:0008140) |
| 0.0 | 5.2 | GO:0008017 | microtubule binding(GO:0008017) |
| 0.0 | 0.0 | GO:0033862 | UMP kinase activity(GO:0033862) |
Gene overrepresentation in curated gene sets: canonical pathways category:
| Log-likelihood per target | Total log-likelihood | Term | Description |
|---|---|---|---|
| 0.0 | 5.4 | PID A6B1 A6B4 INTEGRIN PATHWAY | a6b1 and a6b4 Integrin signaling |
| 0.0 | 2.3 | PID LIS1 PATHWAY | Lissencephaly gene (LIS1) in neuronal migration and development |
| 0.0 | 0.7 | PID PDGFRA PATHWAY | PDGFR-alpha signaling pathway |
| 0.0 | 1.4 | PID VEGFR1 PATHWAY | VEGFR1 specific signals |
| 0.0 | 0.7 | PID HIF1A PATHWAY | Hypoxic and oxygen homeostasis regulation of HIF-1-alpha |
| 0.0 | 0.6 | SA FAS SIGNALING | The TNF-type receptor Fas induces apoptosis on ligand binding. |
| 0.0 | 0.6 | PID ERB GENOMIC PATHWAY | Validated nuclear estrogen receptor beta network |
| 0.0 | 0.4 | PID BETA CATENIN DEG PATHWAY | Degradation of beta catenin |
| 0.0 | 1.1 | ST GA12 PATHWAY | G alpha 12 Pathway |
| 0.0 | 0.7 | PID RET PATHWAY | Signaling events regulated by Ret tyrosine kinase |
| 0.0 | 1.2 | PID PS1 PATHWAY | Presenilin action in Notch and Wnt signaling |
| 0.0 | 2.1 | PID ILK PATHWAY | Integrin-linked kinase signaling |
| 0.0 | 1.7 | ST FAS SIGNALING PATHWAY | Fas Signaling Pathway |
| 0.0 | 0.3 | PID REELIN PATHWAY | Reelin signaling pathway |
| 0.0 | 1.6 | PID RAC1 REG PATHWAY | Regulation of RAC1 activity |
| 0.0 | 0.2 | SA REG CASCADE OF CYCLIN EXPR | Expression of cyclins regulates progression through the cell cycle by activating cyclin-dependent kinases. |
| 0.0 | 0.5 | PID HEDGEHOG 2PATHWAY | Signaling events mediated by the Hedgehog family |
| 0.0 | 1.2 | PID HNF3A PATHWAY | FOXA1 transcription factor network |
| 0.0 | 1.3 | PID CASPASE PATHWAY | Caspase cascade in apoptosis |
| 0.0 | 0.6 | PID CDC42 REG PATHWAY | Regulation of CDC42 activity |
| 0.0 | 0.6 | PID ECADHERIN NASCENT AJ PATHWAY | E-cadherin signaling in the nascent adherens junction |
| 0.0 | 0.4 | PID IL2 STAT5 PATHWAY | IL2 signaling events mediated by STAT5 |
Gene overrepresentation in curated gene sets: REACTOME pathways category:
| Log-likelihood per target | Total log-likelihood | Term | Description |
|---|---|---|---|
| 0.1 | 1.1 | REACTOME CREATION OF C4 AND C2 ACTIVATORS | Genes involved in Creation of C4 and C2 activators |
| 0.1 | 0.7 | REACTOME INITIAL TRIGGERING OF COMPLEMENT | Genes involved in Initial triggering of complement |
| 0.1 | 2.6 | REACTOME DCC MEDIATED ATTRACTIVE SIGNALING | Genes involved in DCC mediated attractive signaling |
| 0.0 | 1.1 | REACTOME PRESYNAPTIC NICOTINIC ACETYLCHOLINE RECEPTORS | Genes involved in Presynaptic nicotinic acetylcholine receptors |
| 0.0 | 3.3 | REACTOME STRIATED MUSCLE CONTRACTION | Genes involved in Striated Muscle Contraction |
| 0.0 | 1.1 | REACTOME INTRINSIC PATHWAY | Genes involved in Intrinsic Pathway |
| 0.0 | 3.0 | REACTOME VOLTAGE GATED POTASSIUM CHANNELS | Genes involved in Voltage gated Potassium channels |
| 0.0 | 1.4 | REACTOME TRAFFICKING OF GLUR2 CONTAINING AMPA RECEPTORS | Genes involved in Trafficking of GluR2-containing AMPA receptors |
| 0.0 | 1.2 | REACTOME OXYGEN DEPENDENT PROLINE HYDROXYLATION OF HYPOXIA INDUCIBLE FACTOR ALPHA | Genes involved in Oxygen-dependent Proline Hydroxylation of Hypoxia-inducible Factor Alpha |
| 0.0 | 0.2 | REACTOME COMMON PATHWAY | Genes involved in Common Pathway |
| 0.0 | 0.6 | REACTOME REGULATION OF RHEB GTPASE ACTIVITY BY AMPK | Genes involved in Regulation of Rheb GTPase activity by AMPK |
| 0.0 | 0.9 | REACTOME FORMATION OF TUBULIN FOLDING INTERMEDIATES BY CCT TRIC | Genes involved in Formation of tubulin folding intermediates by CCT/TriC |
| 0.0 | 0.4 | REACTOME ROLE OF DCC IN REGULATING APOPTOSIS | Genes involved in Role of DCC in regulating apoptosis |
| 0.0 | 0.6 | REACTOME ABCA TRANSPORTERS IN LIPID HOMEOSTASIS | Genes involved in ABCA transporters in lipid homeostasis |
| 0.0 | 3.9 | REACTOME RESPONSE TO ELEVATED PLATELET CYTOSOLIC CA2 | Genes involved in Response to elevated platelet cytosolic Ca2+ |
| 0.0 | 0.6 | REACTOME N GLYCAN ANTENNAE ELONGATION | Genes involved in N-Glycan antennae elongation |
| 0.0 | 0.8 | REACTOME SIGNALING BY NODAL | Genes involved in Signaling by NODAL |
| 0.0 | 1.0 | REACTOME INTERACTION BETWEEN L1 AND ANKYRINS | Genes involved in Interaction between L1 and Ankyrins |
| 0.0 | 0.5 | REACTOME ACETYLCHOLINE NEUROTRANSMITTER RELEASE CYCLE | Genes involved in Acetylcholine Neurotransmitter Release Cycle |
| 0.0 | 0.5 | REACTOME ACTIVATED POINT MUTANTS OF FGFR2 | Genes involved in Activated point mutants of FGFR2 |
| 0.0 | 1.0 | REACTOME ADHERENS JUNCTIONS INTERACTIONS | Genes involved in Adherens junctions interactions |
| 0.0 | 0.7 | REACTOME ACTIVATED NOTCH1 TRANSMITS SIGNAL TO THE NUCLEUS | Genes involved in Activated NOTCH1 Transmits Signal to the Nucleus |
| 0.0 | 0.6 | REACTOME INSULIN SYNTHESIS AND PROCESSING | Genes involved in Insulin Synthesis and Processing |
| 0.0 | 0.2 | REACTOME SYNTHESIS OF BILE ACIDS AND BILE SALTS VIA 24 HYDROXYCHOLESTEROL | Genes involved in Synthesis of bile acids and bile salts via 24-hydroxycholesterol |
| 0.0 | 1.7 | REACTOME POTASSIUM CHANNELS | Genes involved in Potassium Channels |
| 0.0 | 0.4 | REACTOME DESTABILIZATION OF MRNA BY AUF1 HNRNP D0 | Genes involved in Destabilization of mRNA by AUF1 (hnRNP D0) |
| 0.0 | 0.5 | REACTOME PLATELET CALCIUM HOMEOSTASIS | Genes involved in Platelet calcium homeostasis |
| 0.0 | 0.4 | REACTOME GAP JUNCTION ASSEMBLY | Genes involved in Gap junction assembly |
| 0.0 | 0.4 | REACTOME UNBLOCKING OF NMDA RECEPTOR GLUTAMATE BINDING AND ACTIVATION | Genes involved in Unblocking of NMDA receptor, glutamate binding and activation |
| 0.0 | 0.5 | REACTOME RNA POL III TRANSCRIPTION TERMINATION | Genes involved in RNA Polymerase III Transcription Termination |
| 0.0 | 0.1 | REACTOME INTERACTIONS OF VPR WITH HOST CELLULAR PROTEINS | Genes involved in Interactions of Vpr with host cellular proteins |
| 0.0 | 1.3 | REACTOME NRAGE SIGNALS DEATH THROUGH JNK | Genes involved in NRAGE signals death through JNK |
| 0.0 | 3.0 | REACTOME OLFACTORY SIGNALING PATHWAY | Genes involved in Olfactory Signaling Pathway |