Project
Illumina Body Map 2 (GSE30611)
Navigation
Downloads
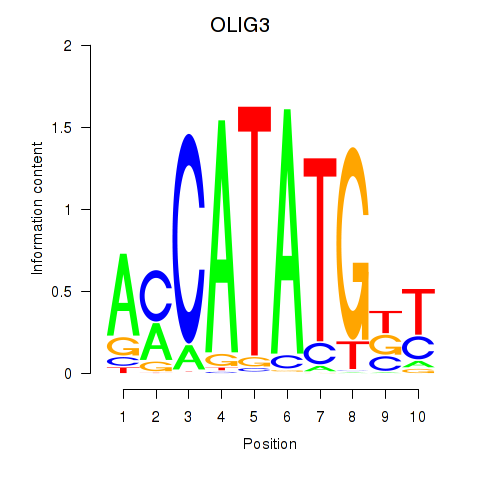
Results for OLIG3_NEUROD2_NEUROG2
Z-value: 1.89
Motif logo
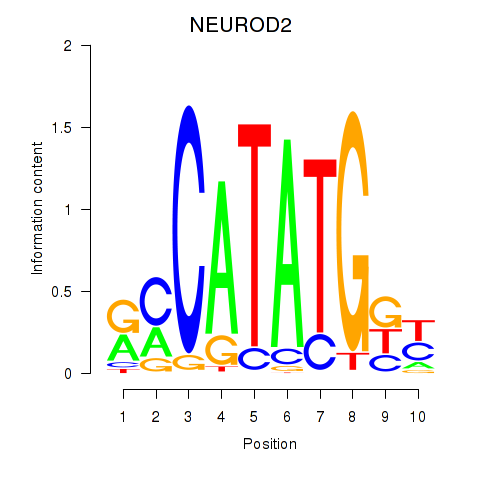
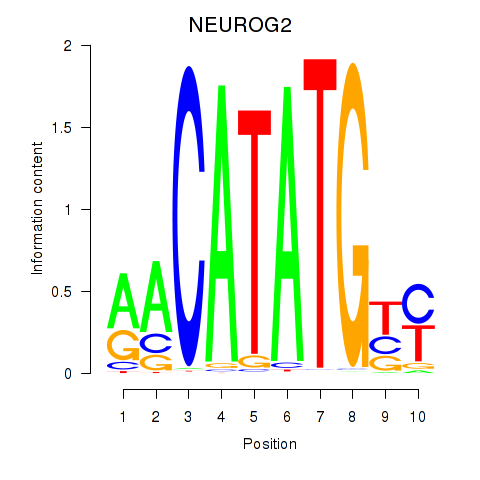
Transcription factors associated with OLIG3_NEUROD2_NEUROG2
| Gene Symbol | Gene ID | Gene Info |
|---|---|---|
|
OLIG3
|
ENSG00000177468.7 | oligodendrocyte transcription factor 3 |
|
NEUROD2
|
ENSG00000171532.5 | neuronal differentiation 2 |
|
NEUROG2
|
ENSG00000178403.4 | neurogenin 2 |
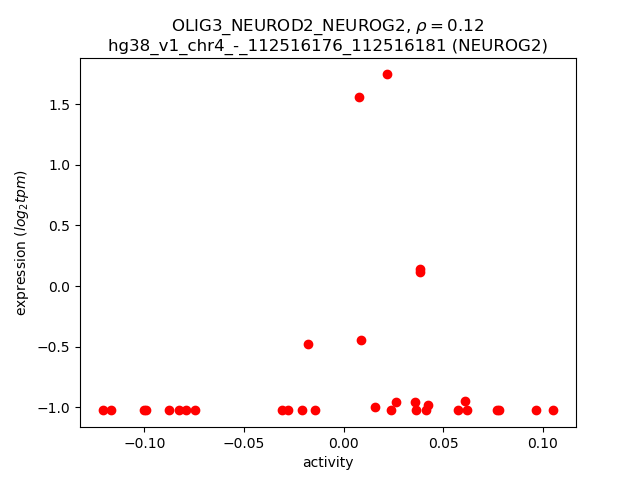
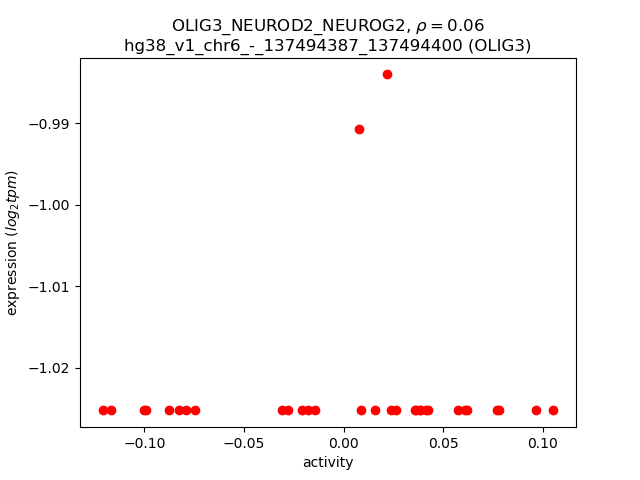
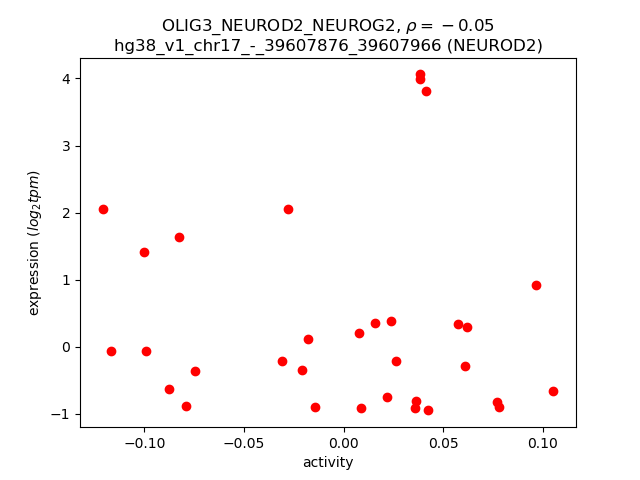
Activity-expression correlation:
| Gene | Promoter | Pearson corr. coef. | P-value | Plot |
|---|---|---|---|---|
| NEUROG2 | hg38_v1_chr4_-_112516176_112516181 | 0.12 | 5.0e-01 | Click! |
| OLIG3 | hg38_v1_chr6_-_137494387_137494400 | 0.06 | 7.4e-01 | Click! |
| NEUROD2 | hg38_v1_chr17_-_39607876_39607966 | -0.05 | 8.0e-01 | Click! |
Activity profile of OLIG3_NEUROD2_NEUROG2 motif
Sorted Z-values of OLIG3_NEUROD2_NEUROG2 motif
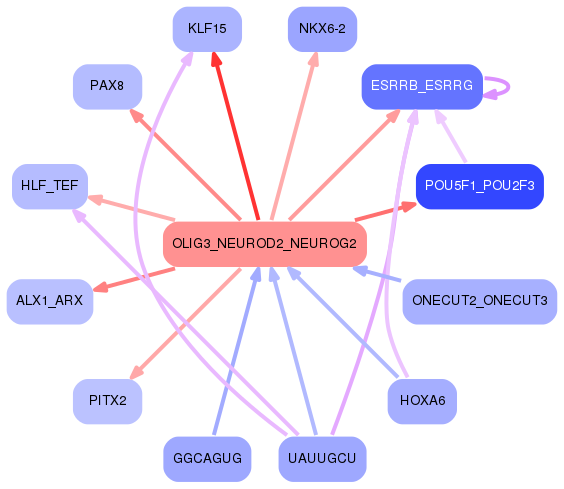
Network of associatons between targets according to the STRING database.

First level regulatory network of OLIG3_NEUROD2_NEUROG2
Gene Ontology Analysis
Gene overrepresentation in biological process category:
| Log-likelihood per target | Total log-likelihood | Term | Description |
|---|---|---|---|
| 6.7 | 26.9 | GO:0014724 | regulation of twitch skeletal muscle contraction(GO:0014724) |
| 3.6 | 10.9 | GO:0007525 | somatic muscle development(GO:0007525) |
| 2.4 | 7.3 | GO:2000184 | cellular response to nitrite(GO:0071250) response to nitrite(GO:0080033) glomerular visceral epithelial cell apoptotic process(GO:1903210) regulation of glomerular visceral epithelial cell apoptotic process(GO:1904633) positive regulation of glomerular visceral epithelial cell apoptotic process(GO:1904635) response to resveratrol(GO:1904638) cellular response to resveratrol(GO:1904639) positive regulation of progesterone biosynthetic process(GO:2000184) |
| 2.0 | 6.1 | GO:0003365 | establishment of cell polarity involved in ameboidal cell migration(GO:0003365) |
| 1.5 | 5.8 | GO:0070460 | thyroid-stimulating hormone secretion(GO:0070460) regulation of thyroid-stimulating hormone secretion(GO:2000612) |
| 1.4 | 7.1 | GO:1902081 | regulation of calcium ion import into sarcoplasmic reticulum(GO:1902080) negative regulation of calcium ion import into sarcoplasmic reticulum(GO:1902081) |
| 1.4 | 5.6 | GO:2000097 | regulation of smooth muscle cell-matrix adhesion(GO:2000097) |
| 1.3 | 4.0 | GO:1903280 | negative regulation of calcium:sodium antiporter activity(GO:1903280) |
| 1.3 | 2.7 | GO:1901876 | regulation of calcium ion binding(GO:1901876) negative regulation of calcium ion binding(GO:1901877) |
| 1.3 | 5.3 | GO:0072233 | thick ascending limb development(GO:0072023) metanephric thick ascending limb development(GO:0072233) |
| 0.7 | 3.0 | GO:0032972 | diaphragm contraction(GO:0002086) regulation of muscle filament sliding speed(GO:0032972) |
| 0.7 | 3.4 | GO:0051758 | homologous chromosome movement towards spindle pole involved in homologous chromosome segregation(GO:0051758) |
| 0.7 | 2.6 | GO:1990918 | double-strand break repair involved in meiotic recombination(GO:1990918) |
| 0.6 | 3.2 | GO:0034334 | adherens junction maintenance(GO:0034334) |
| 0.6 | 1.8 | GO:0014873 | G-protein coupled receptor signaling pathway coupled to cGMP nucleotide second messenger(GO:0007199) response to muscle activity involved in regulation of muscle adaptation(GO:0014873) |
| 0.6 | 4.8 | GO:0002074 | extraocular skeletal muscle development(GO:0002074) |
| 0.5 | 8.0 | GO:0061302 | smooth muscle cell-matrix adhesion(GO:0061302) |
| 0.5 | 1.5 | GO:0046338 | phosphatidylethanolamine catabolic process(GO:0046338) |
| 0.5 | 3.0 | GO:0098746 | fast, calcium ion-dependent exocytosis of neurotransmitter(GO:0098746) |
| 0.5 | 0.5 | GO:0071395 | response to jasmonic acid(GO:0009753) cellular response to jasmonic acid stimulus(GO:0071395) |
| 0.5 | 3.7 | GO:1900827 | maintenance of protein location in membrane(GO:0072658) maintenance of protein location in plasma membrane(GO:0072660) positive regulation of membrane depolarization during cardiac muscle cell action potential(GO:1900827) |
| 0.4 | 1.7 | GO:0050993 | dimethylallyl diphosphate biosynthetic process(GO:0050992) dimethylallyl diphosphate metabolic process(GO:0050993) |
| 0.4 | 2.1 | GO:0009106 | lipoate metabolic process(GO:0009106) |
| 0.4 | 1.3 | GO:0043438 | acetoacetic acid metabolic process(GO:0043438) |
| 0.4 | 2.5 | GO:0061107 | seminal vesicle development(GO:0061107) |
| 0.4 | 7.9 | GO:1900747 | negative regulation of vascular endothelial growth factor signaling pathway(GO:1900747) |
| 0.4 | 3.2 | GO:0046952 | ketone body catabolic process(GO:0046952) |
| 0.4 | 1.2 | GO:0042137 | sequestering of neurotransmitter(GO:0042137) |
| 0.4 | 3.4 | GO:0021831 | globus pallidus development(GO:0021759) embryonic olfactory bulb interneuron precursor migration(GO:0021831) |
| 0.4 | 1.5 | GO:0021913 | regulation of transcription from RNA polymerase II promoter involved in ventral spinal cord interneuron specification(GO:0021913) |
| 0.4 | 6.3 | GO:0015727 | lactate transport(GO:0015727) lactate transmembrane transport(GO:0035873) |
| 0.4 | 1.5 | GO:0018153 | isopeptide cross-linking via N6-(L-isoglutamyl)-L-lysine(GO:0018153) isopeptide cross-linking(GO:0018262) |
| 0.4 | 1.4 | GO:0060254 | regulation of N-terminal protein palmitoylation(GO:0060254) negative regulation of N-terminal protein palmitoylation(GO:0060262) negative regulation of protein lipidation(GO:1903060) |
| 0.4 | 3.9 | GO:0036371 | protein localization to T-tubule(GO:0036371) |
| 0.4 | 6.7 | GO:0090361 | platelet-derived growth factor production(GO:0090360) regulation of platelet-derived growth factor production(GO:0090361) |
| 0.3 | 8.2 | GO:0046069 | cGMP catabolic process(GO:0046069) |
| 0.3 | 1.3 | GO:1904934 | chemoattraction of serotonergic neuron axon(GO:0036517) planar cell polarity pathway involved in outflow tract morphogenesis(GO:0061347) planar cell polarity pathway involved in ventricular septum morphogenesis(GO:0061348) planar cell polarity pathway involved in cardiac right atrium morphogenesis(GO:0061349) planar cell polarity pathway involved in cardiac muscle tissue morphogenesis(GO:0061350) planar cell polarity pathway involved in pericardium morphogenesis(GO:0061354) chemoattraction of axon(GO:0061642) negative regulation of cell proliferation in midbrain(GO:1904934) planar cell polarity pathway involved in midbrain dopaminergic neuron differentiation(GO:1904955) |
| 0.3 | 7.4 | GO:0052695 | cellular glucuronidation(GO:0052695) |
| 0.3 | 0.9 | GO:0060266 | negative regulation of NAD(P)H oxidase activity(GO:0033861) negative regulation of respiratory burst involved in inflammatory response(GO:0060266) |
| 0.3 | 1.5 | GO:0071504 | cellular response to heparin(GO:0071504) |
| 0.3 | 0.8 | GO:0036451 | cap mRNA methylation(GO:0036451) |
| 0.3 | 0.8 | GO:0031453 | regulation of heterochromatin assembly(GO:0031445) positive regulation of heterochromatin assembly(GO:0031453) |
| 0.3 | 0.8 | GO:0033076 | isoquinoline alkaloid metabolic process(GO:0033076) |
| 0.3 | 2.9 | GO:0086024 | adrenergic receptor signaling pathway involved in positive regulation of heart rate(GO:0086024) |
| 0.2 | 1.5 | GO:0093001 | glycolysis from storage polysaccharide through glucose-1-phosphate(GO:0093001) |
| 0.2 | 1.2 | GO:0003350 | pulmonary myocardium development(GO:0003350) |
| 0.2 | 1.0 | GO:1901143 | insulin catabolic process(GO:1901143) |
| 0.2 | 1.0 | GO:2000255 | negative regulation of male germ cell proliferation(GO:2000255) |
| 0.2 | 1.0 | GO:1990926 | short-term synaptic potentiation(GO:1990926) |
| 0.2 | 2.1 | GO:0042271 | susceptibility to natural killer cell mediated cytotoxicity(GO:0042271) |
| 0.2 | 2.1 | GO:0046726 | positive regulation by virus of viral protein levels in host cell(GO:0046726) |
| 0.2 | 3.4 | GO:0098789 | pre-mRNA cleavage required for polyadenylation(GO:0098789) |
| 0.2 | 2.9 | GO:0015705 | iodide transport(GO:0015705) |
| 0.2 | 3.3 | GO:0006570 | tyrosine metabolic process(GO:0006570) |
| 0.2 | 2.6 | GO:0043569 | negative regulation of insulin-like growth factor receptor signaling pathway(GO:0043569) |
| 0.2 | 5.6 | GO:0007016 | cytoskeletal anchoring at plasma membrane(GO:0007016) |
| 0.2 | 0.9 | GO:0036216 | response to stem cell factor(GO:0036215) cellular response to stem cell factor stimulus(GO:0036216) Kit signaling pathway(GO:0038109) |
| 0.2 | 1.5 | GO:0099558 | maintenance of synapse structure(GO:0099558) |
| 0.2 | 1.7 | GO:1904879 | positive regulation of calcium ion transmembrane transport via high voltage-gated calcium channel(GO:1904879) |
| 0.2 | 0.2 | GO:0060702 | negative regulation of ribonuclease activity(GO:0060701) negative regulation of endoribonuclease activity(GO:0060702) |
| 0.2 | 4.7 | GO:0008090 | retrograde axonal transport(GO:0008090) |
| 0.2 | 2.6 | GO:0048251 | elastic fiber assembly(GO:0048251) |
| 0.2 | 1.2 | GO:0006740 | NADPH regeneration(GO:0006740) |
| 0.2 | 0.6 | GO:0043323 | regulation of natural killer cell degranulation(GO:0043321) positive regulation of natural killer cell degranulation(GO:0043323) |
| 0.2 | 3.3 | GO:0035269 | protein O-linked mannosylation(GO:0035269) |
| 0.2 | 1.6 | GO:0036438 | maintenance of lens transparency(GO:0036438) |
| 0.2 | 0.6 | GO:0060720 | spongiotrophoblast cell proliferation(GO:0060720) regulation of spongiotrophoblast cell proliferation(GO:0060721) cell proliferation involved in embryonic placenta development(GO:0060722) regulation of cell proliferation involved in embryonic placenta development(GO:0060723) |
| 0.2 | 0.9 | GO:0055011 | atrial cardiac muscle cell differentiation(GO:0055011) atrial cardiac muscle cell development(GO:0055014) |
| 0.2 | 0.6 | GO:0036111 | very long-chain fatty-acyl-CoA metabolic process(GO:0036111) |
| 0.2 | 0.6 | GO:1902616 | acyl carnitine transport(GO:0006844) acyl carnitine transmembrane transport(GO:1902616) |
| 0.2 | 0.9 | GO:0061026 | cardiac muscle tissue regeneration(GO:0061026) |
| 0.2 | 4.0 | GO:0046415 | urate metabolic process(GO:0046415) |
| 0.2 | 4.1 | GO:0043922 | negative regulation by host of viral transcription(GO:0043922) |
| 0.2 | 2.1 | GO:0019375 | galactosylceramide biosynthetic process(GO:0006682) galactolipid biosynthetic process(GO:0019375) |
| 0.2 | 2.6 | GO:1904352 | positive regulation of protein catabolic process in the vacuole(GO:1904352) |
| 0.2 | 1.4 | GO:0000255 | allantoin metabolic process(GO:0000255) |
| 0.2 | 1.0 | GO:0034392 | negative regulation of smooth muscle cell apoptotic process(GO:0034392) |
| 0.2 | 0.3 | GO:0097325 | melanocyte proliferation(GO:0097325) |
| 0.2 | 0.7 | GO:0002904 | positive regulation of B cell apoptotic process(GO:0002904) |
| 0.2 | 0.6 | GO:0033306 | phytol metabolic process(GO:0033306) fatty alcohol metabolic process(GO:1903173) |
| 0.2 | 1.7 | GO:0007185 | transmembrane receptor protein tyrosine phosphatase signaling pathway(GO:0007185) |
| 0.2 | 0.6 | GO:0043060 | meiotic metaphase I plate congression(GO:0043060) meiotic spindle midzone assembly(GO:0051257) meiotic metaphase plate congression(GO:0051311) |
| 0.2 | 7.1 | GO:0061318 | renal filtration cell differentiation(GO:0061318) glomerular visceral epithelial cell differentiation(GO:0072112) negative regulation of peptidyl-lysine acetylation(GO:2000757) |
| 0.2 | 0.5 | GO:0002175 | protein localization to paranode region of axon(GO:0002175) |
| 0.2 | 0.5 | GO:0031247 | actin rod assembly(GO:0031247) |
| 0.2 | 2.3 | GO:0051964 | negative regulation of synapse assembly(GO:0051964) |
| 0.2 | 5.3 | GO:1904707 | positive regulation of vascular smooth muscle cell proliferation(GO:1904707) |
| 0.2 | 0.6 | GO:0006421 | asparaginyl-tRNA aminoacylation(GO:0006421) |
| 0.2 | 6.6 | GO:0061049 | physiological muscle hypertrophy(GO:0003298) physiological cardiac muscle hypertrophy(GO:0003301) cell growth involved in cardiac muscle cell development(GO:0061049) |
| 0.1 | 10.6 | GO:0015949 | nucleobase-containing small molecule interconversion(GO:0015949) |
| 0.1 | 1.2 | GO:0019255 | glucose 1-phosphate metabolic process(GO:0019255) |
| 0.1 | 0.4 | GO:1900365 | positive regulation of mRNA polyadenylation(GO:1900365) |
| 0.1 | 0.3 | GO:0002032 | desensitization of G-protein coupled receptor protein signaling pathway by arrestin(GO:0002032) |
| 0.1 | 1.7 | GO:2000601 | positive regulation of Arp2/3 complex-mediated actin nucleation(GO:2000601) |
| 0.1 | 1.7 | GO:0016926 | protein desumoylation(GO:0016926) |
| 0.1 | 0.7 | GO:0019242 | methylglyoxal biosynthetic process(GO:0019242) |
| 0.1 | 0.9 | GO:0045196 | establishment or maintenance of neuroblast polarity(GO:0045196) establishment of neuroblast polarity(GO:0045200) |
| 0.1 | 0.8 | GO:2001250 | nitrogen catabolite regulation of transcription from RNA polymerase II promoter(GO:0001079) nitrogen catabolite activation of transcription from RNA polymerase II promoter(GO:0001080) regulation of urea metabolic process(GO:0034255) intracellular bile acid receptor signaling pathway(GO:0038185) interleukin-17 secretion(GO:0072615) nitrogen catabolite regulation of transcription(GO:0090293) nitrogen catabolite activation of transcription(GO:0090294) regulation of nitrogen cycle metabolic process(GO:1903314) positive regulation of glutamate metabolic process(GO:2000213) regulation of ammonia assimilation cycle(GO:2001248) positive regulation of ammonia assimilation cycle(GO:2001250) |
| 0.1 | 2.4 | GO:0042448 | progesterone metabolic process(GO:0042448) |
| 0.1 | 1.4 | GO:0018344 | protein geranylgeranylation(GO:0018344) |
| 0.1 | 0.5 | GO:0044501 | modulation of signal transduction in other organism(GO:0044501) modulation by symbiont of host signal transduction pathway(GO:0052027) modulation of signal transduction in other organism involved in symbiotic interaction(GO:0052250) modulation by symbiont of host I-kappaB kinase/NF-kappaB cascade(GO:0085032) |
| 0.1 | 0.6 | GO:0033512 | L-lysine catabolic process to acetyl-CoA via saccharopine(GO:0033512) |
| 0.1 | 0.4 | GO:0051805 | evasion or tolerance of host immune response(GO:0020012) evasion or tolerance of host defense response(GO:0030682) evasion or tolerance by virus of host immune response(GO:0030683) evasion or tolerance of immune response of other organism involved in symbiotic interaction(GO:0051805) evasion or tolerance of defense response of other organism involved in symbiotic interaction(GO:0051807) |
| 0.1 | 1.5 | GO:0070560 | protein secretion by platelet(GO:0070560) |
| 0.1 | 0.7 | GO:0033615 | mitochondrial proton-transporting ATP synthase complex assembly(GO:0033615) |
| 0.1 | 6.2 | GO:1903861 | positive regulation of dendrite extension(GO:1903861) |
| 0.1 | 0.5 | GO:0006272 | leading strand elongation(GO:0006272) |
| 0.1 | 0.9 | GO:1900262 | regulation of DNA-directed DNA polymerase activity(GO:1900262) positive regulation of DNA-directed DNA polymerase activity(GO:1900264) |
| 0.1 | 0.3 | GO:0002439 | chronic inflammatory response to antigenic stimulus(GO:0002439) |
| 0.1 | 5.3 | GO:0032958 | inositol phosphate biosynthetic process(GO:0032958) |
| 0.1 | 1.4 | GO:0045329 | carnitine biosynthetic process(GO:0045329) |
| 0.1 | 1.7 | GO:0030046 | parallel actin filament bundle assembly(GO:0030046) |
| 0.1 | 0.7 | GO:0019075 | virus maturation(GO:0019075) |
| 0.1 | 0.4 | GO:0086097 | phospholipase C-activating angiotensin-activated signaling pathway(GO:0086097) |
| 0.1 | 0.8 | GO:1903296 | regulation of synaptic vesicle fusion to presynaptic membrane(GO:0031630) regulation of glutamate secretion, neurotransmission(GO:1903294) positive regulation of glutamate secretion, neurotransmission(GO:1903296) |
| 0.1 | 1.3 | GO:1902412 | regulation of mitotic cytokinesis(GO:1902412) |
| 0.1 | 0.3 | GO:0006533 | aspartate catabolic process(GO:0006533) |
| 0.1 | 1.1 | GO:0097039 | protein linear polyubiquitination(GO:0097039) |
| 0.1 | 0.7 | GO:0018032 | protein amidation(GO:0018032) |
| 0.1 | 0.6 | GO:0033326 | cerebrospinal fluid secretion(GO:0033326) |
| 0.1 | 0.6 | GO:0006574 | valine catabolic process(GO:0006574) |
| 0.1 | 1.3 | GO:0021942 | radial glia guided migration of Purkinje cell(GO:0021942) |
| 0.1 | 1.0 | GO:0051835 | positive regulation of synapse structural plasticity(GO:0051835) |
| 0.1 | 3.5 | GO:0006309 | apoptotic DNA fragmentation(GO:0006309) |
| 0.1 | 2.6 | GO:0006068 | ethanol catabolic process(GO:0006068) |
| 0.1 | 1.0 | GO:0055089 | fatty acid homeostasis(GO:0055089) |
| 0.1 | 0.7 | GO:1903288 | positive regulation of potassium ion import(GO:1903288) |
| 0.1 | 0.3 | GO:0001207 | histone displacement(GO:0001207) positive regulation of transcription involved in meiotic cell cycle(GO:0051039) |
| 0.1 | 0.3 | GO:0006407 | rRNA export from nucleus(GO:0006407) |
| 0.1 | 1.7 | GO:0051823 | regulation of synapse structural plasticity(GO:0051823) |
| 0.1 | 0.7 | GO:0046092 | deoxycytidine metabolic process(GO:0046092) |
| 0.1 | 0.3 | GO:0007066 | female meiosis sister chromatid cohesion(GO:0007066) |
| 0.1 | 1.1 | GO:0032534 | regulation of microvillus assembly(GO:0032534) |
| 0.1 | 1.2 | GO:0060158 | phospholipase C-activating dopamine receptor signaling pathway(GO:0060158) |
| 0.1 | 0.3 | GO:0046379 | extracellular polysaccharide biosynthetic process(GO:0045226) extracellular polysaccharide metabolic process(GO:0046379) |
| 0.1 | 0.9 | GO:0046600 | negative regulation of centriole replication(GO:0046600) |
| 0.1 | 4.2 | GO:0000715 | nucleotide-excision repair, DNA damage recognition(GO:0000715) |
| 0.1 | 0.5 | GO:1900245 | positive regulation of MDA-5 signaling pathway(GO:1900245) |
| 0.1 | 0.4 | GO:1901563 | cellular response to camptothecin(GO:0072757) response to camptothecin(GO:1901563) |
| 0.1 | 1.7 | GO:2000480 | negative regulation of cAMP-dependent protein kinase activity(GO:2000480) |
| 0.1 | 1.2 | GO:0030262 | apoptotic nuclear changes(GO:0030262) |
| 0.1 | 0.9 | GO:2000580 | regulation of ATP-dependent microtubule motor activity, plus-end-directed(GO:2000580) positive regulation of ATP-dependent microtubule motor activity, plus-end-directed(GO:2000582) |
| 0.1 | 0.9 | GO:0031119 | tRNA pseudouridine synthesis(GO:0031119) |
| 0.1 | 1.8 | GO:0007021 | tubulin complex assembly(GO:0007021) |
| 0.1 | 0.3 | GO:1901165 | positive regulation of trophoblast cell migration(GO:1901165) |
| 0.1 | 1.9 | GO:0006590 | thyroid hormone generation(GO:0006590) |
| 0.1 | 0.8 | GO:1903361 | protein localization to basolateral plasma membrane(GO:1903361) |
| 0.1 | 4.6 | GO:0018149 | peptide cross-linking(GO:0018149) |
| 0.1 | 4.4 | GO:0070979 | protein K11-linked ubiquitination(GO:0070979) |
| 0.1 | 1.4 | GO:0016540 | protein autoprocessing(GO:0016540) |
| 0.1 | 0.4 | GO:1903615 | regulation of protein tyrosine phosphatase activity(GO:1903613) positive regulation of protein tyrosine phosphatase activity(GO:1903615) |
| 0.1 | 0.2 | GO:0006463 | steroid hormone receptor complex assembly(GO:0006463) |
| 0.1 | 0.2 | GO:0071449 | cellular response to lipid hydroperoxide(GO:0071449) |
| 0.1 | 4.7 | GO:0046710 | GDP metabolic process(GO:0046710) |
| 0.1 | 1.1 | GO:0036155 | acylglycerol acyl-chain remodeling(GO:0036155) |
| 0.1 | 5.0 | GO:1901385 | regulation of voltage-gated calcium channel activity(GO:1901385) |
| 0.1 | 0.3 | GO:0046946 | hydroxylysine metabolic process(GO:0046946) hydroxylysine biosynthetic process(GO:0046947) |
| 0.1 | 0.4 | GO:0097498 | endothelial tube lumen extension(GO:0097498) |
| 0.1 | 0.4 | GO:0035617 | stress granule disassembly(GO:0035617) |
| 0.1 | 0.6 | GO:0060754 | positive regulation of mast cell chemotaxis(GO:0060754) |
| 0.1 | 1.3 | GO:0006388 | tRNA splicing, via endonucleolytic cleavage and ligation(GO:0006388) |
| 0.1 | 2.1 | GO:0032060 | bleb assembly(GO:0032060) |
| 0.1 | 0.2 | GO:0035425 | autocrine signaling(GO:0035425) |
| 0.1 | 2.8 | GO:0001580 | detection of chemical stimulus involved in sensory perception of bitter taste(GO:0001580) |
| 0.1 | 0.3 | GO:0050915 | sensory perception of sour taste(GO:0050915) |
| 0.1 | 0.5 | GO:0006741 | NADP biosynthetic process(GO:0006741) |
| 0.1 | 0.2 | GO:1901804 | beta-glucoside metabolic process(GO:1901804) beta-glucoside catabolic process(GO:1901805) positive regulation of neuronal action potential(GO:1904457) |
| 0.1 | 0.7 | GO:0006983 | ER overload response(GO:0006983) |
| 0.1 | 2.9 | GO:0034243 | regulation of transcription elongation from RNA polymerase II promoter(GO:0034243) |
| 0.1 | 1.0 | GO:0021860 | pyramidal neuron development(GO:0021860) |
| 0.1 | 0.5 | GO:0035672 | oligopeptide transmembrane transport(GO:0035672) |
| 0.1 | 0.3 | GO:0017185 | peptidyl-lysine hydroxylation(GO:0017185) |
| 0.1 | 1.7 | GO:0060307 | regulation of ventricular cardiac muscle cell membrane repolarization(GO:0060307) |
| 0.1 | 0.5 | GO:0007070 | negative regulation of transcription during mitosis(GO:0007068) negative regulation of transcription from RNA polymerase II promoter during mitosis(GO:0007070) |
| 0.1 | 1.3 | GO:0006957 | complement activation, alternative pathway(GO:0006957) |
| 0.1 | 7.1 | GO:0070125 | mitochondrial translational elongation(GO:0070125) |
| 0.1 | 0.8 | GO:0043568 | positive regulation of insulin-like growth factor receptor signaling pathway(GO:0043568) |
| 0.1 | 2.8 | GO:0030866 | cortical actin cytoskeleton organization(GO:0030866) |
| 0.1 | 2.0 | GO:0042753 | positive regulation of circadian rhythm(GO:0042753) |
| 0.1 | 1.2 | GO:0033617 | mitochondrial respiratory chain complex IV assembly(GO:0033617) |
| 0.1 | 0.9 | GO:0031915 | positive regulation of synaptic plasticity(GO:0031915) |
| 0.1 | 0.4 | GO:0006651 | diacylglycerol biosynthetic process(GO:0006651) |
| 0.1 | 0.7 | GO:0030091 | protein repair(GO:0030091) |
| 0.1 | 2.1 | GO:0006099 | tricarboxylic acid cycle(GO:0006099) |
| 0.1 | 0.6 | GO:0006001 | fructose catabolic process(GO:0006001) fructose catabolic process to hydroxyacetone phosphate and glyceraldehyde-3-phosphate(GO:0061624) |
| 0.1 | 0.3 | GO:0035633 | maintenance of blood-brain barrier(GO:0035633) |
| 0.1 | 0.4 | GO:1904885 | beta-catenin destruction complex assembly(GO:1904885) |
| 0.1 | 0.6 | GO:0034465 | response to carbon monoxide(GO:0034465) |
| 0.1 | 2.4 | GO:0000027 | ribosomal large subunit assembly(GO:0000027) |
| 0.1 | 0.3 | GO:0015891 | iron chelate transport(GO:0015688) siderophore transport(GO:0015891) |
| 0.1 | 0.5 | GO:0050957 | equilibrioception(GO:0050957) |
| 0.1 | 0.2 | GO:1900533 | medium-chain fatty-acyl-CoA catabolic process(GO:0036114) long-chain fatty-acyl-CoA catabolic process(GO:0036116) palmitic acid metabolic process(GO:1900533) palmitic acid biosynthetic process(GO:1900535) |
| 0.1 | 0.3 | GO:1900039 | positive regulation of cellular response to hypoxia(GO:1900039) |
| 0.1 | 0.5 | GO:0080154 | regulation of fertilization(GO:0080154) |
| 0.1 | 3.0 | GO:2000114 | regulation of establishment of cell polarity(GO:2000114) |
| 0.1 | 0.8 | GO:0032782 | bile acid secretion(GO:0032782) |
| 0.1 | 0.4 | GO:0061143 | alveolar primary septum development(GO:0061143) |
| 0.0 | 0.2 | GO:0018874 | benzoate metabolic process(GO:0018874) |
| 0.0 | 0.4 | GO:0035583 | sequestering of TGFbeta in extracellular matrix(GO:0035583) |
| 0.0 | 0.2 | GO:0001880 | Mullerian duct regression(GO:0001880) |
| 0.0 | 4.2 | GO:0000381 | regulation of alternative mRNA splicing, via spliceosome(GO:0000381) |
| 0.0 | 0.3 | GO:0060371 | regulation of atrial cardiac muscle cell membrane depolarization(GO:0060371) bundle of His cell to Purkinje myocyte signaling(GO:0086028) bundle of His cell action potential(GO:0086043) |
| 0.0 | 0.7 | GO:0044341 | sodium-dependent phosphate transport(GO:0044341) |
| 0.0 | 0.3 | GO:0090669 | telomerase RNA stabilization(GO:0090669) |
| 0.0 | 0.6 | GO:0071073 | positive regulation of phospholipid biosynthetic process(GO:0071073) |
| 0.0 | 0.6 | GO:0045617 | negative regulation of keratinocyte differentiation(GO:0045617) |
| 0.0 | 0.5 | GO:0060054 | positive regulation of epithelial cell proliferation involved in wound healing(GO:0060054) |
| 0.0 | 0.3 | GO:0035407 | histone H3-T11 phosphorylation(GO:0035407) |
| 0.0 | 0.4 | GO:1903237 | negative regulation of leukocyte tethering or rolling(GO:1903237) |
| 0.0 | 0.3 | GO:0090063 | positive regulation of microtubule nucleation(GO:0090063) |
| 0.0 | 0.3 | GO:0061588 | calcium activated phospholipid scrambling(GO:0061588) calcium activated phosphatidylcholine scrambling(GO:0061590) calcium activated galactosylceramide scrambling(GO:0061591) |
| 0.0 | 0.3 | GO:0061760 | antifungal innate immune response(GO:0061760) |
| 0.0 | 0.3 | GO:0002331 | pre-B cell allelic exclusion(GO:0002331) |
| 0.0 | 0.4 | GO:0006499 | N-terminal protein myristoylation(GO:0006499) |
| 0.0 | 0.2 | GO:0048170 | positive regulation of long-term neuronal synaptic plasticity(GO:0048170) regulation of receptor localization to synapse(GO:1902683) |
| 0.0 | 2.5 | GO:0032728 | positive regulation of interferon-beta production(GO:0032728) |
| 0.0 | 0.2 | GO:0090149 | mitochondrial membrane fission(GO:0090149) |
| 0.0 | 0.8 | GO:0019388 | galactose catabolic process(GO:0019388) |
| 0.0 | 0.9 | GO:1900103 | positive regulation of endoplasmic reticulum unfolded protein response(GO:1900103) |
| 0.0 | 1.7 | GO:0060292 | long term synaptic depression(GO:0060292) |
| 0.0 | 14.9 | GO:0050911 | detection of chemical stimulus involved in sensory perception of smell(GO:0050911) |
| 0.0 | 0.2 | GO:0070378 | positive regulation of ERK5 cascade(GO:0070378) |
| 0.0 | 1.4 | GO:0034375 | high-density lipoprotein particle remodeling(GO:0034375) |
| 0.0 | 0.3 | GO:0051673 | membrane disruption in other organism(GO:0051673) |
| 0.0 | 0.2 | GO:0030961 | peptidyl-arginine hydroxylation(GO:0030961) |
| 0.0 | 0.7 | GO:0060155 | platelet dense granule organization(GO:0060155) |
| 0.0 | 1.8 | GO:0006783 | heme biosynthetic process(GO:0006783) |
| 0.0 | 10.9 | GO:0006986 | response to unfolded protein(GO:0006986) |
| 0.0 | 0.2 | GO:0043324 | eye pigment biosynthetic process(GO:0006726) eye pigment metabolic process(GO:0042441) pigment metabolic process involved in developmental pigmentation(GO:0043324) pigment metabolic process involved in pigmentation(GO:0043474) |
| 0.0 | 1.1 | GO:1901685 | glutathione derivative metabolic process(GO:1901685) glutathione derivative biosynthetic process(GO:1901687) |
| 0.0 | 0.1 | GO:0060290 | transdifferentiation(GO:0060290) |
| 0.0 | 0.8 | GO:0070200 | establishment of protein localization to telomere(GO:0070200) |
| 0.0 | 0.5 | GO:0021794 | thalamus development(GO:0021794) |
| 0.0 | 1.0 | GO:0007289 | spermatid nucleus differentiation(GO:0007289) |
| 0.0 | 1.7 | GO:0070884 | regulation of calcineurin-NFAT signaling cascade(GO:0070884) |
| 0.0 | 0.4 | GO:0006268 | DNA unwinding involved in DNA replication(GO:0006268) transcription from mitochondrial promoter(GO:0006390) |
| 0.0 | 0.6 | GO:1990118 | sodium ion import across plasma membrane(GO:0098719) sodium ion import into cell(GO:1990118) |
| 0.0 | 0.5 | GO:0019227 | neuronal action potential propagation(GO:0019227) action potential propagation(GO:0098870) |
| 0.0 | 1.0 | GO:0009083 | branched-chain amino acid catabolic process(GO:0009083) |
| 0.0 | 0.7 | GO:0033141 | positive regulation of peptidyl-serine phosphorylation of STAT protein(GO:0033141) |
| 0.0 | 0.3 | GO:0035494 | SNARE complex disassembly(GO:0035494) |
| 0.0 | 0.7 | GO:0090266 | regulation of mitotic cell cycle spindle assembly checkpoint(GO:0090266) regulation of mitotic spindle checkpoint(GO:1903504) |
| 0.0 | 1.5 | GO:0071108 | protein K48-linked deubiquitination(GO:0071108) |
| 0.0 | 0.4 | GO:0032525 | somite rostral/caudal axis specification(GO:0032525) |
| 0.0 | 3.6 | GO:0035914 | skeletal muscle cell differentiation(GO:0035914) |
| 0.0 | 0.1 | GO:0052651 | monoacylglycerol metabolic process(GO:0046462) monoacylglycerol catabolic process(GO:0052651) |
| 0.0 | 0.7 | GO:0030322 | stabilization of membrane potential(GO:0030322) |
| 0.0 | 0.9 | GO:0035774 | positive regulation of insulin secretion involved in cellular response to glucose stimulus(GO:0035774) |
| 0.0 | 2.7 | GO:0010257 | NADH dehydrogenase complex assembly(GO:0010257) mitochondrial respiratory chain complex I assembly(GO:0032981) mitochondrial respiratory chain complex I biogenesis(GO:0097031) |
| 0.0 | 1.6 | GO:0060765 | regulation of androgen receptor signaling pathway(GO:0060765) |
| 0.0 | 2.1 | GO:0007029 | endoplasmic reticulum organization(GO:0007029) |
| 0.0 | 1.6 | GO:0001709 | cell fate determination(GO:0001709) |
| 0.0 | 1.0 | GO:0047497 | establishment of mitochondrion localization, microtubule-mediated(GO:0034643) mitochondrion transport along microtubule(GO:0047497) |
| 0.0 | 0.2 | GO:0034227 | tRNA thio-modification(GO:0034227) |
| 0.0 | 0.1 | GO:0033385 | geranylgeranyl diphosphate metabolic process(GO:0033385) geranylgeranyl diphosphate biosynthetic process(GO:0033386) |
| 0.0 | 0.2 | GO:0098886 | modification of dendritic spine(GO:0098886) |
| 0.0 | 0.2 | GO:0097068 | response to thyroxine(GO:0097068) response to L-phenylalanine derivative(GO:1904386) |
| 0.0 | 0.4 | GO:0034058 | endosomal vesicle fusion(GO:0034058) |
| 0.0 | 2.2 | GO:0048384 | retinoic acid receptor signaling pathway(GO:0048384) |
| 0.0 | 1.3 | GO:0010107 | potassium ion import(GO:0010107) |
| 0.0 | 0.4 | GO:0006776 | vitamin A metabolic process(GO:0006776) |
| 0.0 | 1.1 | GO:0031954 | positive regulation of protein autophosphorylation(GO:0031954) |
| 0.0 | 1.0 | GO:0035728 | response to hepatocyte growth factor(GO:0035728) |
| 0.0 | 2.3 | GO:0032411 | positive regulation of transporter activity(GO:0032411) |
| 0.0 | 0.2 | GO:0060050 | positive regulation of protein glycosylation(GO:0060050) |
| 0.0 | 0.3 | GO:0071233 | cellular response to leucine(GO:0071233) |
| 0.0 | 2.4 | GO:1901379 | regulation of potassium ion transmembrane transport(GO:1901379) |
| 0.0 | 0.7 | GO:0033169 | histone H3-K9 demethylation(GO:0033169) |
| 0.0 | 0.7 | GO:0071294 | cellular response to zinc ion(GO:0071294) |
| 0.0 | 1.2 | GO:0051973 | positive regulation of telomerase activity(GO:0051973) |
| 0.0 | 0.6 | GO:0051131 | chaperone-mediated protein complex assembly(GO:0051131) |
| 0.0 | 0.2 | GO:0030916 | otic vesicle formation(GO:0030916) |
| 0.0 | 0.4 | GO:0098828 | positive regulation of inhibitory postsynaptic potential(GO:0097151) modulation of inhibitory postsynaptic potential(GO:0098828) |
| 0.0 | 0.3 | GO:2001214 | positive regulation of vasculogenesis(GO:2001214) |
| 0.0 | 0.1 | GO:0006012 | galactose metabolic process(GO:0006012) |
| 0.0 | 0.4 | GO:0010765 | positive regulation of sodium ion transport(GO:0010765) |
| 0.0 | 0.4 | GO:0031284 | positive regulation of guanylate cyclase activity(GO:0031284) |
| 0.0 | 0.2 | GO:0008295 | spermidine biosynthetic process(GO:0008295) |
| 0.0 | 0.8 | GO:0015879 | carnitine transport(GO:0015879) |
| 0.0 | 0.7 | GO:0071354 | cellular response to interleukin-6(GO:0071354) |
| 0.0 | 0.3 | GO:0090026 | positive regulation of monocyte chemotaxis(GO:0090026) |
| 0.0 | 0.2 | GO:2000680 | rubidium ion transport(GO:0035826) regulation of rubidium ion transport(GO:2000680) |
| 0.0 | 0.1 | GO:0034164 | negative regulation of toll-like receptor 9 signaling pathway(GO:0034164) |
| 0.0 | 0.3 | GO:0045721 | negative regulation of gluconeogenesis(GO:0045721) |
| 0.0 | 0.6 | GO:0010880 | regulation of release of sequestered calcium ion into cytosol by sarcoplasmic reticulum(GO:0010880) |
| 0.0 | 0.1 | GO:0010644 | cell communication by electrical coupling(GO:0010644) |
| 0.0 | 0.3 | GO:0042738 | exogenous drug catabolic process(GO:0042738) |
| 0.0 | 0.3 | GO:0033630 | positive regulation of cell adhesion mediated by integrin(GO:0033630) |
| 0.0 | 1.1 | GO:0030521 | androgen receptor signaling pathway(GO:0030521) |
| 0.0 | 2.4 | GO:0010923 | negative regulation of phosphatase activity(GO:0010923) |
| 0.0 | 0.8 | GO:0001893 | maternal placenta development(GO:0001893) |
| 0.0 | 0.7 | GO:0035640 | exploration behavior(GO:0035640) |
| 0.0 | 0.6 | GO:0090286 | cytoskeletal anchoring at nuclear membrane(GO:0090286) |
| 0.0 | 0.2 | GO:0045218 | zonula adherens maintenance(GO:0045218) |
| 0.0 | 0.4 | GO:0046548 | retinal rod cell development(GO:0046548) |
| 0.0 | 0.1 | GO:0071163 | DNA replication preinitiation complex assembly(GO:0071163) |
| 0.0 | 0.5 | GO:0032784 | regulation of DNA-templated transcription, elongation(GO:0032784) |
| 0.0 | 1.1 | GO:0009250 | glycogen biosynthetic process(GO:0005978) glucan biosynthetic process(GO:0009250) |
| 0.0 | 1.0 | GO:0007274 | neuromuscular synaptic transmission(GO:0007274) |
| 0.0 | 0.6 | GO:0051898 | negative regulation of protein kinase B signaling(GO:0051898) |
| 0.0 | 0.3 | GO:0060081 | membrane hyperpolarization(GO:0060081) |
| 0.0 | 1.3 | GO:0046579 | positive regulation of Ras protein signal transduction(GO:0046579) |
| 0.0 | 0.9 | GO:0090003 | regulation of establishment of protein localization to plasma membrane(GO:0090003) |
| 0.0 | 1.1 | GO:0061178 | regulation of insulin secretion involved in cellular response to glucose stimulus(GO:0061178) |
| 0.0 | 1.8 | GO:0021954 | central nervous system neuron development(GO:0021954) |
| 0.0 | 0.1 | GO:0032380 | regulation of intracellular lipid transport(GO:0032377) regulation of intracellular sterol transport(GO:0032380) regulation of intracellular cholesterol transport(GO:0032383) |
| 0.0 | 0.4 | GO:1902018 | negative regulation of cilium assembly(GO:1902018) |
| 0.0 | 0.3 | GO:0007413 | axonal fasciculation(GO:0007413) |
| 0.0 | 0.9 | GO:0071377 | cellular response to glucagon stimulus(GO:0071377) |
| 0.0 | 0.4 | GO:0051646 | mitochondrion localization(GO:0051646) |
| 0.0 | 0.8 | GO:0033572 | transferrin transport(GO:0033572) |
| 0.0 | 1.5 | GO:0045669 | positive regulation of osteoblast differentiation(GO:0045669) |
| 0.0 | 0.4 | GO:0046621 | negative regulation of organ growth(GO:0046621) |
| 0.0 | 0.5 | GO:0015695 | organic cation transport(GO:0015695) |
| 0.0 | 0.4 | GO:0040036 | regulation of fibroblast growth factor receptor signaling pathway(GO:0040036) |
| 0.0 | 0.6 | GO:0060004 | reflex(GO:0060004) |
| 0.0 | 0.6 | GO:0032467 | positive regulation of cytokinesis(GO:0032467) |
| 0.0 | 0.6 | GO:0097435 | fibril organization(GO:0097435) |
| 0.0 | 1.2 | GO:1902017 | regulation of cilium assembly(GO:1902017) |
| 0.0 | 0.2 | GO:0000055 | ribosomal large subunit export from nucleus(GO:0000055) |
| 0.0 | 0.2 | GO:0002430 | complement receptor mediated signaling pathway(GO:0002430) |
| 0.0 | 0.1 | GO:0010265 | SCF complex assembly(GO:0010265) |
| 0.0 | 0.1 | GO:0009437 | carnitine metabolic process(GO:0009437) |
| 0.0 | 0.1 | GO:0042754 | negative regulation of circadian rhythm(GO:0042754) positive regulation of oxidative stress-induced intrinsic apoptotic signaling pathway(GO:1902177) |
| 0.0 | 0.4 | GO:0048240 | sperm capacitation(GO:0048240) |
| 0.0 | 1.3 | GO:1901222 | regulation of NIK/NF-kappaB signaling(GO:1901222) |
| 0.0 | 0.2 | GO:0034116 | positive regulation of heterotypic cell-cell adhesion(GO:0034116) |
| 0.0 | 0.8 | GO:1902600 | hydrogen ion transmembrane transport(GO:1902600) |
| 0.0 | 0.1 | GO:0003360 | brainstem development(GO:0003360) |
| 0.0 | 2.3 | GO:0031424 | keratinization(GO:0031424) |
| 0.0 | 1.8 | GO:0032231 | regulation of actin filament bundle assembly(GO:0032231) |
| 0.0 | 0.7 | GO:0060997 | dendritic spine morphogenesis(GO:0060997) |
| 0.0 | 0.7 | GO:0006749 | glutathione metabolic process(GO:0006749) |
| 0.0 | 0.2 | GO:0000712 | resolution of meiotic recombination intermediates(GO:0000712) |
| 0.0 | 0.3 | GO:0080111 | DNA demethylation(GO:0080111) |
| 0.0 | 0.1 | GO:0070857 | regulation of bile acid biosynthetic process(GO:0070857) |
| 0.0 | 0.4 | GO:0008542 | visual learning(GO:0008542) |
| 0.0 | 0.2 | GO:0034356 | NAD biosynthesis via nicotinamide riboside salvage pathway(GO:0034356) |
| 0.0 | 0.3 | GO:0000729 | DNA double-strand break processing(GO:0000729) |
| 0.0 | 0.2 | GO:0014912 | negative regulation of smooth muscle cell migration(GO:0014912) |
| 0.0 | 0.2 | GO:0048025 | negative regulation of mRNA splicing, via spliceosome(GO:0048025) |
| 0.0 | 0.4 | GO:0019228 | neuronal action potential(GO:0019228) |
| 0.0 | 0.8 | GO:0051965 | positive regulation of synapse assembly(GO:0051965) |
| 0.0 | 0.3 | GO:0048665 | neuron fate specification(GO:0048665) |
Gene overrepresentation in cellular component category:
| Log-likelihood per target | Total log-likelihood | Term | Description |
|---|---|---|---|
| 2.4 | 7.3 | GO:1990844 | subsarcolemmal mitochondrion(GO:1990843) interfibrillar mitochondrion(GO:1990844) |
| 0.8 | 3.1 | GO:0005863 | striated muscle myosin thick filament(GO:0005863) |
| 0.7 | 2.1 | GO:0043159 | acrosomal matrix(GO:0043159) |
| 0.6 | 2.5 | GO:0036027 | protein C inhibitor-TMPRSS7 complex(GO:0036024) protein C inhibitor-TMPRSS11E complex(GO:0036025) protein C inhibitor-PLAT complex(GO:0036026) protein C inhibitor-PLAU complex(GO:0036027) protein C inhibitor-thrombin complex(GO:0036028) protein C inhibitor-KLK3 complex(GO:0036029) protein C inhibitor-plasma kallikrein complex(GO:0036030) serine protease inhibitor complex(GO:0097180) protein C inhibitor-coagulation factor V complex(GO:0097181) protein C inhibitor-coagulation factor Xa complex(GO:0097182) protein C inhibitor-coagulation factor XI complex(GO:0097183) |
| 0.6 | 7.9 | GO:0005589 | collagen type VI trimer(GO:0005589) collagen beaded filament(GO:0098647) |
| 0.5 | 4.7 | GO:0031673 | H zone(GO:0031673) |
| 0.5 | 3.6 | GO:0071942 | XPC complex(GO:0071942) |
| 0.5 | 16.0 | GO:0031095 | platelet dense tubular network membrane(GO:0031095) |
| 0.5 | 3.0 | GO:1990584 | cardiac Troponin complex(GO:1990584) |
| 0.5 | 1.4 | GO:0070195 | growth hormone receptor complex(GO:0070195) |
| 0.4 | 11.9 | GO:0032982 | myosin filament(GO:0032982) |
| 0.3 | 4.1 | GO:0060203 | clathrin-sculpted glutamate transport vesicle(GO:0060199) clathrin-sculpted glutamate transport vesicle membrane(GO:0060203) |
| 0.3 | 3.5 | GO:0097442 | CA3 pyramidal cell dendrite(GO:0097442) |
| 0.3 | 0.8 | GO:0005914 | spot adherens junction(GO:0005914) |
| 0.2 | 2.9 | GO:0031466 | Cul5-RING ubiquitin ligase complex(GO:0031466) |
| 0.2 | 1.4 | GO:0005968 | Rab-protein geranylgeranyltransferase complex(GO:0005968) |
| 0.2 | 0.9 | GO:0071920 | cleavage body(GO:0071920) |
| 0.2 | 5.6 | GO:0005890 | sodium:potassium-exchanging ATPase complex(GO:0005890) |
| 0.2 | 1.5 | GO:0005945 | 6-phosphofructokinase complex(GO:0005945) |
| 0.2 | 1.4 | GO:0070033 | synaptobrevin 2-SNAP-25-syntaxin-1a-complexin II complex(GO:0070033) |
| 0.2 | 0.5 | GO:0031477 | stereocilia tip link(GO:0002140) myosin VII complex(GO:0031477) stereocilia tip-link density(GO:1990427) upper tip-link density(GO:1990435) |
| 0.2 | 3.4 | GO:0005847 | mRNA cleavage and polyadenylation specificity factor complex(GO:0005847) |
| 0.2 | 3.0 | GO:0031010 | ISWI-type complex(GO:0031010) |
| 0.2 | 1.7 | GO:0097512 | cardiac myofibril(GO:0097512) |
| 0.2 | 0.6 | GO:0005715 | late recombination nodule(GO:0005715) |
| 0.2 | 1.4 | GO:0005663 | DNA replication factor C complex(GO:0005663) |
| 0.2 | 12.8 | GO:0033017 | sarcoplasmic reticulum membrane(GO:0033017) |
| 0.2 | 2.6 | GO:0016013 | syntrophin complex(GO:0016013) |
| 0.2 | 3.7 | GO:0014731 | spectrin-associated cytoskeleton(GO:0014731) |
| 0.2 | 1.1 | GO:0071797 | LUBAC complex(GO:0071797) |
| 0.1 | 1.3 | GO:0005579 | membrane attack complex(GO:0005579) |
| 0.1 | 9.9 | GO:0016235 | aggresome(GO:0016235) |
| 0.1 | 1.0 | GO:0005947 | mitochondrial alpha-ketoglutarate dehydrogenase complex(GO:0005947) |
| 0.1 | 3.1 | GO:0001527 | microfibril(GO:0001527) fibril(GO:0043205) |
| 0.1 | 2.7 | GO:0031588 | nucleotide-activated protein kinase complex(GO:0031588) |
| 0.1 | 6.0 | GO:0043034 | costamere(GO:0043034) |
| 0.1 | 1.7 | GO:0031209 | SCAR complex(GO:0031209) |
| 0.1 | 0.8 | GO:0002177 | manchette(GO:0002177) |
| 0.1 | 0.3 | GO:0055087 | Ski complex(GO:0055087) |
| 0.1 | 0.9 | GO:1990578 | perinuclear endoplasmic reticulum membrane(GO:1990578) |
| 0.1 | 0.4 | GO:0097229 | sperm end piece(GO:0097229) |
| 0.1 | 0.8 | GO:0048787 | presynaptic active zone membrane(GO:0048787) |
| 0.1 | 0.8 | GO:0045252 | oxoglutarate dehydrogenase complex(GO:0045252) |
| 0.1 | 8.2 | GO:0005891 | voltage-gated calcium channel complex(GO:0005891) |
| 0.1 | 0.5 | GO:0097454 | Schwann cell microvillus(GO:0097454) |
| 0.1 | 5.9 | GO:0008180 | COP9 signalosome(GO:0008180) |
| 0.1 | 0.6 | GO:0030934 | anchoring collagen complex(GO:0030934) |
| 0.1 | 2.5 | GO:0005763 | organellar small ribosomal subunit(GO:0000314) mitochondrial small ribosomal subunit(GO:0005763) |
| 0.1 | 16.9 | GO:0030018 | Z disc(GO:0030018) |
| 0.1 | 1.6 | GO:0097225 | sperm midpiece(GO:0097225) |
| 0.1 | 1.6 | GO:0032426 | stereocilium tip(GO:0032426) |
| 0.1 | 0.4 | GO:0000221 | vacuolar proton-transporting V-type ATPase, V1 domain(GO:0000221) |
| 0.1 | 2.9 | GO:0043218 | compact myelin(GO:0043218) |
| 0.1 | 1.3 | GO:0000235 | astral microtubule(GO:0000235) aster(GO:0005818) |
| 0.1 | 0.8 | GO:0005577 | fibrinogen complex(GO:0005577) |
| 0.1 | 4.6 | GO:0005762 | organellar large ribosomal subunit(GO:0000315) mitochondrial large ribosomal subunit(GO:0005762) |
| 0.1 | 8.9 | GO:0005796 | Golgi lumen(GO:0005796) |
| 0.1 | 3.2 | GO:0098576 | lumenal side of membrane(GO:0098576) |
| 0.1 | 3.8 | GO:0044224 | juxtaparanode region of axon(GO:0044224) |
| 0.1 | 0.4 | GO:0072669 | tRNA-splicing ligase complex(GO:0072669) |
| 0.1 | 0.3 | GO:0033596 | TSC1-TSC2 complex(GO:0033596) |
| 0.1 | 0.4 | GO:0070876 | SOSS complex(GO:0070876) |
| 0.1 | 1.4 | GO:0045009 | melanosome membrane(GO:0033162) chitosome(GO:0045009) |
| 0.1 | 1.7 | GO:0005868 | cytoplasmic dynein complex(GO:0005868) |
| 0.1 | 11.0 | GO:0043204 | perikaryon(GO:0043204) |
| 0.1 | 0.4 | GO:0033263 | CORVET complex(GO:0033263) |
| 0.1 | 0.2 | GO:0070032 | synaptobrevin 2-SNAP-25-syntaxin-1a-complexin I complex(GO:0070032) |
| 0.1 | 1.0 | GO:0001518 | voltage-gated sodium channel complex(GO:0001518) |
| 0.1 | 0.8 | GO:0019774 | proteasome core complex, beta-subunit complex(GO:0019774) |
| 0.1 | 3.7 | GO:0001533 | cornified envelope(GO:0001533) |
| 0.1 | 0.4 | GO:0070847 | core mediator complex(GO:0070847) |
| 0.1 | 0.5 | GO:0070449 | elongin complex(GO:0070449) |
| 0.1 | 0.3 | GO:0048179 | activin receptor complex(GO:0048179) |
| 0.1 | 0.6 | GO:0008282 | ATP-sensitive potassium channel complex(GO:0008282) |
| 0.0 | 0.6 | GO:0034992 | microtubule organizing center attachment site(GO:0034992) LINC complex(GO:0034993) |
| 0.0 | 1.0 | GO:0031089 | platelet dense granule lumen(GO:0031089) |
| 0.0 | 0.9 | GO:0043194 | axon initial segment(GO:0043194) |
| 0.0 | 0.8 | GO:0046581 | intercellular canaliculus(GO:0046581) |
| 0.0 | 1.0 | GO:0031597 | cytosolic proteasome complex(GO:0031597) |
| 0.0 | 1.1 | GO:0005832 | chaperonin-containing T-complex(GO:0005832) |
| 0.0 | 0.8 | GO:0097433 | dense body(GO:0097433) |
| 0.0 | 0.5 | GO:0070938 | contractile ring(GO:0070938) |
| 0.0 | 1.4 | GO:0071782 | endoplasmic reticulum tubular network(GO:0071782) |
| 0.0 | 0.2 | GO:0048476 | Holliday junction resolvase complex(GO:0048476) |
| 0.0 | 0.7 | GO:0000813 | ESCRT I complex(GO:0000813) |
| 0.0 | 0.4 | GO:0097427 | microtubule bundle(GO:0097427) |
| 0.0 | 0.6 | GO:0005583 | fibrillar collagen trimer(GO:0005583) banded collagen fibril(GO:0098643) |
| 0.0 | 0.6 | GO:0042589 | zymogen granule membrane(GO:0042589) |
| 0.0 | 0.5 | GO:0044666 | MLL3/4 complex(GO:0044666) |
| 0.0 | 0.1 | GO:1902937 | inward rectifier potassium channel complex(GO:1902937) |
| 0.0 | 1.2 | GO:0035371 | microtubule plus-end(GO:0035371) |
| 0.0 | 3.5 | GO:0030016 | myofibril(GO:0030016) |
| 0.0 | 0.5 | GO:0016281 | eukaryotic translation initiation factor 4F complex(GO:0016281) |
| 0.0 | 5.8 | GO:0016605 | PML body(GO:0016605) |
| 0.0 | 0.3 | GO:0005742 | mitochondrial outer membrane translocase complex(GO:0005742) |
| 0.0 | 8.1 | GO:0030426 | growth cone(GO:0030426) |
| 0.0 | 0.9 | GO:0005922 | connexon complex(GO:0005922) |
| 0.0 | 2.1 | GO:0005747 | mitochondrial respiratory chain complex I(GO:0005747) NADH dehydrogenase complex(GO:0030964) respiratory chain complex I(GO:0045271) |
| 0.0 | 5.7 | GO:0022626 | cytosolic ribosome(GO:0022626) |
| 0.0 | 2.9 | GO:0097517 | stress fiber(GO:0001725) contractile actin filament bundle(GO:0097517) |
| 0.0 | 0.4 | GO:0005687 | U4 snRNP(GO:0005687) |
| 0.0 | 0.5 | GO:0000974 | Prp19 complex(GO:0000974) |
| 0.0 | 0.2 | GO:0000801 | central element(GO:0000801) |
| 0.0 | 0.1 | GO:0005854 | nascent polypeptide-associated complex(GO:0005854) |
| 0.0 | 0.6 | GO:0060077 | inhibitory synapse(GO:0060077) |
| 0.0 | 0.6 | GO:0044453 | nuclear membrane part(GO:0044453) |
| 0.0 | 0.6 | GO:0036038 | MKS complex(GO:0036038) |
| 0.0 | 2.1 | GO:0045095 | keratin filament(GO:0045095) |
| 0.0 | 0.3 | GO:0044305 | calyx of Held(GO:0044305) |
| 0.0 | 1.2 | GO:0005746 | mitochondrial respiratory chain(GO:0005746) |
| 0.0 | 0.6 | GO:0031011 | Ino80 complex(GO:0031011) DNA helicase complex(GO:0033202) |
| 0.0 | 0.8 | GO:0005719 | nuclear euchromatin(GO:0005719) |
| 0.0 | 1.9 | GO:0019005 | SCF ubiquitin ligase complex(GO:0019005) |
| 0.0 | 0.8 | GO:0030686 | 90S preribosome(GO:0030686) |
| 0.0 | 0.3 | GO:0000808 | origin recognition complex(GO:0000808) nuclear origin of replication recognition complex(GO:0005664) |
| 0.0 | 0.7 | GO:0030992 | intraciliary transport particle B(GO:0030992) |
| 0.0 | 1.0 | GO:0048786 | presynaptic active zone(GO:0048786) |
| 0.0 | 0.4 | GO:0097440 | apical dendrite(GO:0097440) |
| 0.0 | 0.8 | GO:0071564 | npBAF complex(GO:0071564) |
| 0.0 | 0.2 | GO:0033503 | HULC complex(GO:0033503) |
| 0.0 | 0.3 | GO:0030897 | HOPS complex(GO:0030897) |
| 0.0 | 1.3 | GO:0005840 | ribosome(GO:0005840) |
| 0.0 | 1.1 | GO:0005902 | microvillus(GO:0005902) |
| 0.0 | 0.2 | GO:0097487 | multivesicular body, internal vesicle(GO:0097487) |
| 0.0 | 1.9 | GO:0008076 | voltage-gated potassium channel complex(GO:0008076) |
| 0.0 | 1.6 | GO:0005791 | rough endoplasmic reticulum(GO:0005791) |
| 0.0 | 0.2 | GO:1990909 | Wnt signalosome(GO:1990909) |
| 0.0 | 0.9 | GO:0016592 | mediator complex(GO:0016592) |
| 0.0 | 0.0 | GO:0030123 | AP-3 adaptor complex(GO:0030123) |
| 0.0 | 0.6 | GO:0005680 | anaphase-promoting complex(GO:0005680) |
| 0.0 | 8.3 | GO:0045177 | apical part of cell(GO:0045177) |
| 0.0 | 0.2 | GO:0030126 | COPI vesicle coat(GO:0030126) |
| 0.0 | 0.2 | GO:0044754 | autolysosome(GO:0044754) |
| 0.0 | 0.5 | GO:0034364 | high-density lipoprotein particle(GO:0034364) |
| 0.0 | 0.2 | GO:0005915 | zonula adherens(GO:0005915) |
| 0.0 | 1.4 | GO:0099501 | synaptic vesicle membrane(GO:0030672) exocytic vesicle membrane(GO:0099501) |
| 0.0 | 0.3 | GO:0044232 | organelle membrane contact site(GO:0044232) |
| 0.0 | 0.2 | GO:0042405 | nuclear inclusion body(GO:0042405) |
| 0.0 | 3.6 | GO:0045211 | postsynaptic membrane(GO:0045211) |
| 0.0 | 2.6 | GO:0016323 | basolateral plasma membrane(GO:0016323) |
| 0.0 | 0.6 | GO:0030131 | clathrin adaptor complex(GO:0030131) |
| 0.0 | 0.9 | GO:0005882 | intermediate filament(GO:0005882) |
| 0.0 | 0.2 | GO:0005852 | eukaryotic translation initiation factor 3 complex(GO:0005852) |
| 0.0 | 0.1 | GO:0042382 | paraspeckles(GO:0042382) |
Gene overrepresentation in molecular function category:
| Log-likelihood per target | Total log-likelihood | Term | Description |
|---|---|---|---|
| 1.2 | 6.1 | GO:1904408 | dihydronicotinamide riboside quinone reductase activity(GO:0001512) melatonin binding(GO:1904408) |
| 1.1 | 3.3 | GO:0097363 | protein O-GlcNAc transferase activity(GO:0097363) |
| 1.0 | 5.9 | GO:0048101 | calcium- and calmodulin-regulated 3',5'-cyclic-GMP phosphodiesterase activity(GO:0048101) |
| 0.8 | 4.2 | GO:0052836 | inositol 5-diphosphate pentakisphosphate 5-kinase activity(GO:0052836) inositol diphosphate tetrakisphosphate kinase activity(GO:0052839) |
| 0.8 | 3.2 | GO:0003858 | 3-hydroxybutyrate dehydrogenase activity(GO:0003858) |
| 0.7 | 5.8 | GO:0004996 | thyroid-stimulating hormone receptor activity(GO:0004996) |
| 0.5 | 10.3 | GO:0004017 | adenylate kinase activity(GO:0004017) |
| 0.5 | 12.9 | GO:0030898 | actin-dependent ATPase activity(GO:0030898) |
| 0.5 | 1.4 | GO:0036440 | citrate (Si)-synthase activity(GO:0004108) citrate synthase activity(GO:0036440) |
| 0.4 | 2.2 | GO:0070139 | ubiquitin-like protein-specific endopeptidase activity(GO:0070137) SUMO-specific endopeptidase activity(GO:0070139) |
| 0.4 | 8.0 | GO:0038062 | protein tyrosine kinase collagen receptor activity(GO:0038062) |
| 0.4 | 2.2 | GO:0004447 | iodide peroxidase activity(GO:0004447) |
| 0.4 | 1.7 | GO:0004452 | isopentenyl-diphosphate delta-isomerase activity(GO:0004452) |
| 0.4 | 3.0 | GO:0031013 | troponin I binding(GO:0031013) |
| 0.4 | 6.3 | GO:0015129 | lactate transmembrane transporter activity(GO:0015129) |
| 0.4 | 3.4 | GO:0004652 | polynucleotide adenylyltransferase activity(GO:0004652) |
| 0.4 | 1.2 | GO:0016652 | NAD(P)+ transhydrogenase activity(GO:0008746) oxidoreductase activity, acting on NAD(P)H, NAD(P) as acceptor(GO:0016652) |
| 0.4 | 2.6 | GO:0004035 | alkaline phosphatase activity(GO:0004035) |
| 0.4 | 7.3 | GO:0042975 | peroxisome proliferator activated receptor binding(GO:0042975) |
| 0.4 | 1.4 | GO:0008336 | gamma-butyrobetaine dioxygenase activity(GO:0008336) |
| 0.4 | 13.7 | GO:0005388 | calcium-transporting ATPase activity(GO:0005388) |
| 0.3 | 1.0 | GO:0031626 | beta-endorphin binding(GO:0031626) |
| 0.3 | 1.0 | GO:0004958 | prostaglandin F receptor activity(GO:0004958) |
| 0.3 | 1.3 | GO:0016716 | oxidoreductase activity, acting on paired donors, with incorporation or reduction of molecular oxygen, another compound as one donor, and incorporation of one atom of oxygen(GO:0016716) |
| 0.3 | 1.3 | GO:1902379 | receptor tyrosine kinase-like orphan receptor binding(GO:0005115) chemoattractant activity involved in axon guidance(GO:1902379) |
| 0.3 | 2.8 | GO:0008597 | calcium-dependent protein serine/threonine phosphatase regulator activity(GO:0008597) |
| 0.3 | 0.9 | GO:0008900 | hydrogen:potassium-exchanging ATPase activity(GO:0008900) |
| 0.3 | 3.0 | GO:0030348 | syntaxin-3 binding(GO:0030348) |
| 0.3 | 2.1 | GO:0102344 | 3-hydroxy-behenoyl-CoA dehydratase activity(GO:0102344) 3-hydroxy-lignoceroyl-CoA dehydratase activity(GO:0102345) |
| 0.3 | 9.6 | GO:0031005 | filamin binding(GO:0031005) |
| 0.3 | 0.8 | GO:0004483 | mRNA (nucleoside-2'-O-)-methyltransferase activity(GO:0004483) |
| 0.3 | 3.6 | GO:0030280 | structural constituent of epidermis(GO:0030280) |
| 0.3 | 1.9 | GO:0004800 | thyroxine 5'-deiodinase activity(GO:0004800) |
| 0.3 | 2.5 | GO:0032190 | acrosin binding(GO:0032190) |
| 0.2 | 4.7 | GO:0008556 | sodium:potassium-exchanging ATPase activity(GO:0005391) potassium-transporting ATPase activity(GO:0008556) |
| 0.2 | 1.5 | GO:0070004 | cysteine-type carboxypeptidase activity(GO:0016807) cysteine-type exopeptidase activity(GO:0070004) |
| 0.2 | 2.1 | GO:0034604 | pyruvate dehydrogenase activity(GO:0004738) pyruvate dehydrogenase [NAD(P)+] activity(GO:0034603) pyruvate dehydrogenase (NAD+) activity(GO:0034604) |
| 0.2 | 1.7 | GO:0008273 | calcium, potassium:sodium antiporter activity(GO:0008273) |
| 0.2 | 1.4 | GO:0004663 | Rab geranylgeranyltransferase activity(GO:0004663) |
| 0.2 | 2.2 | GO:0050682 | AF-2 domain binding(GO:0050682) |
| 0.2 | 0.6 | GO:0046577 | long-chain-alcohol oxidase activity(GO:0046577) |
| 0.2 | 1.9 | GO:0015319 | sodium:inorganic phosphate symporter activity(GO:0015319) |
| 0.2 | 3.6 | GO:0019864 | IgG binding(GO:0019864) |
| 0.2 | 1.2 | GO:0051748 | UTP:glucose-1-phosphate uridylyltransferase activity(GO:0003983) UTP-monosaccharide-1-phosphate uridylyltransferase activity(GO:0051748) |
| 0.2 | 0.6 | GO:0070336 | flap-structured DNA binding(GO:0070336) |
| 0.2 | 0.6 | GO:0044594 | 3alpha,7alpha,12alpha-trihydroxy-5beta-cholest-24-enoyl-CoA hydratase activity(GO:0033989) 17-beta-hydroxysteroid dehydrogenase (NAD+) activity(GO:0044594) |
| 0.2 | 0.6 | GO:0015227 | acyl carnitine transmembrane transporter activity(GO:0015227) |
| 0.2 | 1.2 | GO:0047288 | monosialoganglioside sialyltransferase activity(GO:0047288) |
| 0.2 | 0.9 | GO:0033677 | DNA/RNA helicase activity(GO:0033677) |
| 0.2 | 1.6 | GO:0008109 | N-acetyllactosaminide beta-1,6-N-acetylglucosaminyltransferase activity(GO:0008109) |
| 0.2 | 1.0 | GO:0060230 | lipoprotein lipase activator activity(GO:0060230) |
| 0.2 | 1.5 | GO:0003872 | 6-phosphofructokinase activity(GO:0003872) |
| 0.2 | 2.3 | GO:0004118 | cGMP-stimulated cyclic-nucleotide phosphodiesterase activity(GO:0004118) |
| 0.2 | 1.5 | GO:0036042 | long-chain fatty acyl-CoA binding(GO:0036042) |
| 0.2 | 7.4 | GO:0008093 | cytoskeletal adaptor activity(GO:0008093) |
| 0.2 | 0.5 | GO:0030337 | DNA polymerase processivity factor activity(GO:0030337) |
| 0.2 | 0.9 | GO:0003998 | acylphosphatase activity(GO:0003998) |
| 0.2 | 2.0 | GO:0001733 | galactosylceramide sulfotransferase activity(GO:0001733) galactose 3-O-sulfotransferase activity(GO:0050694) |
| 0.2 | 6.1 | GO:0008331 | high voltage-gated calcium channel activity(GO:0008331) |
| 0.2 | 6.6 | GO:0001972 | retinoic acid binding(GO:0001972) |
| 0.2 | 1.1 | GO:0004679 | AMP-activated protein kinase activity(GO:0004679) |
| 0.1 | 0.4 | GO:0001596 | angiotensin type I receptor activity(GO:0001596) |
| 0.1 | 1.0 | GO:0004366 | glycerol-3-phosphate O-acyltransferase activity(GO:0004366) |
| 0.1 | 0.7 | GO:0004347 | glucose-6-phosphate isomerase activity(GO:0004347) |
| 0.1 | 1.5 | GO:0008131 | primary amine oxidase activity(GO:0008131) |
| 0.1 | 1.6 | GO:0003810 | protein-glutamine gamma-glutamyltransferase activity(GO:0003810) |
| 0.1 | 0.8 | GO:1902122 | chenodeoxycholic acid binding(GO:1902122) |
| 0.1 | 0.6 | GO:0052798 | beta-galactoside alpha-2,3-sialyltransferase activity(GO:0052798) |
| 0.1 | 5.1 | GO:0008395 | steroid hydroxylase activity(GO:0008395) |
| 0.1 | 15.0 | GO:0008307 | structural constituent of muscle(GO:0008307) |
| 0.1 | 4.7 | GO:0051010 | microtubule plus-end binding(GO:0051010) |
| 0.1 | 0.6 | GO:0005502 | 11-cis retinal binding(GO:0005502) |
| 0.1 | 2.6 | GO:0008320 | protein transmembrane transporter activity(GO:0008320) |
| 0.1 | 1.0 | GO:0015057 | thrombin receptor activity(GO:0015057) |
| 0.1 | 0.3 | GO:0080130 | L-phenylalanine:2-oxoglutarate aminotransferase activity(GO:0080130) |
| 0.1 | 2.5 | GO:0002162 | dystroglycan binding(GO:0002162) |
| 0.1 | 0.7 | GO:0042030 | ATPase inhibitor activity(GO:0042030) |
| 0.1 | 1.4 | GO:0010859 | calcium-dependent cysteine-type endopeptidase inhibitor activity(GO:0010859) |
| 0.1 | 2.6 | GO:0004062 | aryl sulfotransferase activity(GO:0004062) |
| 0.1 | 0.3 | GO:0070095 | fructose-6-phosphate binding(GO:0070095) |
| 0.1 | 0.8 | GO:0004591 | oxoglutarate dehydrogenase (succinyl-transferring) activity(GO:0004591) |
| 0.1 | 1.5 | GO:0047499 | calcium-independent phospholipase A2 activity(GO:0047499) |
| 0.1 | 0.7 | GO:0004598 | peptidylglycine monooxygenase activity(GO:0004504) peptidylamidoglycolate lyase activity(GO:0004598) |
| 0.1 | 0.8 | GO:0004614 | phosphoglucomutase activity(GO:0004614) |
| 0.1 | 0.6 | GO:0016212 | kynurenine-oxoglutarate transaminase activity(GO:0016212) kynurenine aminotransferase activity(GO:0036137) |
| 0.1 | 0.8 | GO:0005124 | scavenger receptor binding(GO:0005124) |
| 0.1 | 2.1 | GO:0001206 | transcriptional repressor activity, RNA polymerase II distal enhancer sequence-specific binding(GO:0001206) |
| 0.1 | 0.4 | GO:1904713 | beta-catenin destruction complex binding(GO:1904713) |
| 0.1 | 0.3 | GO:0004939 | beta-adrenergic receptor activity(GO:0004939) |
| 0.1 | 0.8 | GO:0004468 | lysine N-acetyltransferase activity, acting on acetyl phosphate as donor(GO:0004468) |
| 0.1 | 0.6 | GO:0005497 | androgen binding(GO:0005497) |
| 0.1 | 0.9 | GO:0033170 | DNA clamp loader activity(GO:0003689) protein-DNA loading ATPase activity(GO:0033170) |
| 0.1 | 0.5 | GO:0098519 | nucleotide phosphatase activity, acting on free nucleotides(GO:0098519) |
| 0.1 | 0.6 | GO:0008281 | sulfonylurea receptor activity(GO:0008281) |
| 0.1 | 2.9 | GO:0031698 | beta-2 adrenergic receptor binding(GO:0031698) |
| 0.1 | 3.2 | GO:0017081 | chloride channel regulator activity(GO:0017081) |
| 0.1 | 2.3 | GO:0008432 | JUN kinase binding(GO:0008432) |
| 0.1 | 1.2 | GO:0001591 | dopamine neurotransmitter receptor activity, coupled via Gi/Go(GO:0001591) |
| 0.1 | 1.6 | GO:0050998 | nitric-oxide synthase binding(GO:0050998) |
| 0.1 | 1.8 | GO:0031702 | type 1 angiotensin receptor binding(GO:0031702) |
| 0.1 | 3.8 | GO:0017075 | syntaxin-1 binding(GO:0017075) |
| 0.1 | 0.7 | GO:0004137 | deoxycytidine kinase activity(GO:0004137) thymidine kinase activity(GO:0004797) |
| 0.1 | 5.9 | GO:0030507 | spectrin binding(GO:0030507) |
| 0.1 | 1.2 | GO:0097371 | MDM2/MDM4 family protein binding(GO:0097371) |
| 0.1 | 0.2 | GO:0004982 | N-formyl peptide receptor activity(GO:0004982) |
| 0.1 | 0.5 | GO:0035673 | oligopeptide transmembrane transporter activity(GO:0035673) |
| 0.1 | 0.2 | GO:0038052 | RNA polymerase II transcription factor activity, estrogen-activated sequence-specific DNA binding(GO:0038052) |
| 0.1 | 0.7 | GO:0033743 | peptide-methionine (R)-S-oxide reductase activity(GO:0033743) |
| 0.1 | 1.7 | GO:0008603 | cAMP-dependent protein kinase regulator activity(GO:0008603) |
| 0.1 | 2.1 | GO:0030506 | ankyrin binding(GO:0030506) |
| 0.1 | 0.9 | GO:0070290 | N-acylphosphatidylethanolamine-specific phospholipase D activity(GO:0070290) |
| 0.1 | 4.7 | GO:0004385 | guanylate kinase activity(GO:0004385) |
| 0.1 | 0.3 | GO:0033823 | procollagen-lysine 5-dioxygenase activity(GO:0008475) procollagen glucosyltransferase activity(GO:0033823) |
| 0.1 | 0.3 | GO:0050501 | hyaluronan synthase activity(GO:0050501) |
| 0.1 | 0.6 | GO:0008158 | hedgehog receptor activity(GO:0008158) |
| 0.1 | 4.0 | GO:0061631 | ubiquitin conjugating enzyme activity(GO:0061631) |
| 0.1 | 1.1 | GO:0019870 | potassium channel inhibitor activity(GO:0019870) |
| 0.1 | 0.3 | GO:0001156 | TFIIIC-class transcription factor binding(GO:0001156) |
| 0.1 | 4.8 | GO:0015485 | cholesterol binding(GO:0015485) |
| 0.1 | 0.4 | GO:0031735 | CCR10 chemokine receptor binding(GO:0031735) |
| 0.1 | 0.9 | GO:0045504 | dynein heavy chain binding(GO:0045504) |
| 0.1 | 1.2 | GO:0008035 | high-density lipoprotein particle binding(GO:0008035) |
| 0.1 | 0.5 | GO:0097322 | 7SK snRNA binding(GO:0097322) |
| 0.1 | 0.5 | GO:0003846 | 2-acylglycerol O-acyltransferase activity(GO:0003846) |
| 0.1 | 0.8 | GO:0008160 | protein tyrosine phosphatase activator activity(GO:0008160) insulin-like growth factor II binding(GO:0031995) |
| 0.1 | 0.9 | GO:0043559 | insulin binding(GO:0043559) |
| 0.1 | 0.6 | GO:0060072 | large conductance calcium-activated potassium channel activity(GO:0060072) |
| 0.1 | 9.0 | GO:0004860 | protein kinase inhibitor activity(GO:0004860) |
| 0.1 | 0.2 | GO:0004766 | spermidine synthase activity(GO:0004766) |
| 0.1 | 1.6 | GO:0008510 | sodium:bicarbonate symporter activity(GO:0008510) |
| 0.1 | 1.4 | GO:0043495 | protein anchor(GO:0043495) |
| 0.1 | 3.5 | GO:0001786 | phosphatidylserine binding(GO:0001786) |
| 0.1 | 0.2 | GO:0047023 | androsterone dehydrogenase activity(GO:0047023) |
| 0.1 | 0.6 | GO:0032137 | guanine/thymine mispair binding(GO:0032137) |
| 0.1 | 0.3 | GO:0044736 | acid-sensing ion channel activity(GO:0044736) |
| 0.1 | 0.4 | GO:0008048 | calcium sensitive guanylate cyclase activator activity(GO:0008048) |
| 0.1 | 0.7 | GO:0005132 | type I interferon receptor binding(GO:0005132) |
| 0.1 | 0.2 | GO:0015173 | aromatic amino acid transmembrane transporter activity(GO:0015173) |
| 0.0 | 0.3 | GO:0004013 | adenosylhomocysteinase activity(GO:0004013) trialkylsulfonium hydrolase activity(GO:0016802) |
| 0.0 | 0.9 | GO:0043422 | protein kinase B binding(GO:0043422) |
| 0.0 | 0.9 | GO:0004716 | receptor signaling protein tyrosine kinase activity(GO:0004716) |
| 0.0 | 1.2 | GO:0030215 | semaphorin receptor binding(GO:0030215) |
| 0.0 | 0.9 | GO:0009982 | pseudouridine synthase activity(GO:0009982) |
| 0.0 | 0.3 | GO:0035402 | histone kinase activity (H3-T11 specific)(GO:0035402) |
| 0.0 | 1.5 | GO:0005212 | structural constituent of eye lens(GO:0005212) |
| 0.0 | 0.4 | GO:0004694 | eukaryotic translation initiation factor 2alpha kinase activity(GO:0004694) |
| 0.0 | 0.7 | GO:0032454 | histone demethylase activity (H3-K9 specific)(GO:0032454) |
| 0.0 | 4.1 | GO:0031593 | polyubiquitin binding(GO:0031593) |
| 0.0 | 0.9 | GO:0005049 | nuclear export signal receptor activity(GO:0005049) |
| 0.0 | 14.9 | GO:0004984 | olfactory receptor activity(GO:0004984) |
| 0.0 | 3.2 | GO:0008028 | monocarboxylic acid transmembrane transporter activity(GO:0008028) |
| 0.0 | 0.4 | GO:0043139 | 5'-3' DNA helicase activity(GO:0043139) |
| 0.0 | 1.1 | GO:0004745 | retinol dehydrogenase activity(GO:0004745) |
| 0.0 | 1.4 | GO:0070064 | proline-rich region binding(GO:0070064) |
| 0.0 | 0.1 | GO:0033858 | N-acetylgalactosamine kinase activity(GO:0033858) |
| 0.0 | 4.5 | GO:0035064 | methylated histone binding(GO:0035064) |
| 0.0 | 0.3 | GO:0004046 | aminoacylase activity(GO:0004046) |
| 0.0 | 0.2 | GO:0004348 | glucosylceramidase activity(GO:0004348) |
| 0.0 | 2.0 | GO:1990841 | promoter-specific chromatin binding(GO:1990841) |
| 0.0 | 4.1 | GO:0043130 | ubiquitin binding(GO:0043130) |
| 0.0 | 3.5 | GO:0050681 | androgen receptor binding(GO:0050681) |
| 0.0 | 2.7 | GO:0048487 | beta-tubulin binding(GO:0048487) |
| 0.0 | 1.6 | GO:0019198 | transmembrane receptor protein tyrosine phosphatase activity(GO:0005001) transmembrane receptor protein phosphatase activity(GO:0019198) |
| 0.0 | 1.5 | GO:0004181 | metallocarboxypeptidase activity(GO:0004181) |
| 0.0 | 3.6 | GO:0030971 | receptor tyrosine kinase binding(GO:0030971) |
| 0.0 | 0.6 | GO:0010314 | phosphatidylinositol-5-phosphate binding(GO:0010314) |
| 0.0 | 0.7 | GO:0042301 | phosphate ion binding(GO:0042301) |
| 0.0 | 0.2 | GO:0032767 | copper-dependent protein binding(GO:0032767) |
| 0.0 | 1.0 | GO:0022841 | potassium ion leak channel activity(GO:0022841) |
| 0.0 | 0.1 | GO:0004967 | glucagon receptor activity(GO:0004967) |
| 0.0 | 0.3 | GO:0004735 | pyrroline-5-carboxylate reductase activity(GO:0004735) |
| 0.0 | 0.3 | GO:0001594 | trace-amine receptor activity(GO:0001594) |
| 0.0 | 0.6 | GO:0022821 | potassium ion antiporter activity(GO:0022821) |
| 0.0 | 0.2 | GO:0018685 | alkane 1-monooxygenase activity(GO:0018685) |
| 0.0 | 0.1 | GO:0004644 | phosphoribosylamine-glycine ligase activity(GO:0004637) phosphoribosylformylglycinamidine cyclo-ligase activity(GO:0004641) phosphoribosylglycinamide formyltransferase activity(GO:0004644) |
| 0.0 | 1.3 | GO:0001848 | complement binding(GO:0001848) |
| 0.0 | 0.2 | GO:0004991 | parathyroid hormone receptor activity(GO:0004991) |
| 0.0 | 0.3 | GO:0016361 | activin receptor activity, type I(GO:0016361) |
| 0.0 | 2.1 | GO:0050136 | NADH dehydrogenase (ubiquinone) activity(GO:0008137) NADH dehydrogenase (quinone) activity(GO:0050136) |
| 0.0 | 0.5 | GO:0015101 | organic cation transmembrane transporter activity(GO:0015101) |
| 0.0 | 0.4 | GO:0033192 | calmodulin-dependent protein phosphatase activity(GO:0033192) |
| 0.0 | 0.4 | GO:0046703 | natural killer cell lectin-like receptor binding(GO:0046703) |
| 0.0 | 4.9 | GO:0005200 | structural constituent of cytoskeleton(GO:0005200) |
| 0.0 | 0.2 | GO:0005105 | type 1 fibroblast growth factor receptor binding(GO:0005105) |
| 0.0 | 1.6 | GO:0019894 | kinesin binding(GO:0019894) |
| 0.0 | 0.5 | GO:0086080 | protein binding involved in heterotypic cell-cell adhesion(GO:0086080) |
| 0.0 | 0.4 | GO:0004673 | protein histidine kinase activity(GO:0004673) |
| 0.0 | 1.1 | GO:0044183 | protein binding involved in protein folding(GO:0044183) |
| 0.0 | 0.8 | GO:0070003 | threonine-type endopeptidase activity(GO:0004298) threonine-type peptidase activity(GO:0070003) |
| 0.0 | 1.0 | GO:1905030 | voltage-gated sodium channel activity(GO:0005248) voltage-gated ion channel activity involved in regulation of postsynaptic membrane potential(GO:1905030) |
| 0.0 | 6.4 | GO:0003735 | structural constituent of ribosome(GO:0003735) |
| 0.0 | 0.2 | GO:0060698 | endoribonuclease inhibitor activity(GO:0060698) |
| 0.0 | 1.7 | GO:0004683 | calmodulin-dependent protein kinase activity(GO:0004683) |
| 0.0 | 0.2 | GO:0050733 | RS domain binding(GO:0050733) |
| 0.0 | 0.6 | GO:0003995 | acyl-CoA dehydrogenase activity(GO:0003995) |
| 0.0 | 0.8 | GO:0015020 | glucuronosyltransferase activity(GO:0015020) |
| 0.0 | 0.9 | GO:0001671 | ATPase activator activity(GO:0001671) |
| 0.0 | 0.7 | GO:0030552 | cAMP binding(GO:0030552) |
| 0.0 | 0.2 | GO:0008821 | crossover junction endodeoxyribonuclease activity(GO:0008821) |
| 0.0 | 0.6 | GO:0008349 | MAP kinase kinase kinase kinase activity(GO:0008349) |
| 0.0 | 0.4 | GO:0042809 | vitamin D receptor binding(GO:0042809) |
| 0.0 | 0.1 | GO:0004427 | inorganic diphosphatase activity(GO:0004427) |
| 0.0 | 7.0 | GO:0061630 | ubiquitin protein ligase activity(GO:0061630) |
| 0.0 | 2.7 | GO:0030165 | PDZ domain binding(GO:0030165) |
| 0.0 | 0.8 | GO:0005229 | intracellular calcium activated chloride channel activity(GO:0005229) |
| 0.0 | 0.8 | GO:0005242 | inward rectifier potassium channel activity(GO:0005242) |
| 0.0 | 0.4 | GO:0035613 | RNA stem-loop binding(GO:0035613) |
| 0.0 | 0.4 | GO:0005024 | transforming growth factor beta-activated receptor activity(GO:0005024) |
| 0.0 | 1.5 | GO:0001205 | transcriptional activator activity, RNA polymerase II distal enhancer sequence-specific binding(GO:0001205) |
| 0.0 | 0.6 | GO:0070006 | metalloaminopeptidase activity(GO:0070006) |
| 0.0 | 0.1 | GO:0031849 | olfactory receptor binding(GO:0031849) |
| 0.0 | 0.1 | GO:0035374 | chondroitin sulfate binding(GO:0035374) |
| 0.0 | 0.1 | GO:1903763 | gap junction channel activity involved in cell communication by electrical coupling(GO:1903763) |
| 0.0 | 0.6 | GO:0016876 | aminoacyl-tRNA ligase activity(GO:0004812) ligase activity, forming carbon-oxygen bonds(GO:0016875) ligase activity, forming aminoacyl-tRNA and related compounds(GO:0016876) |
| 0.0 | 0.1 | GO:0070568 | guanylyltransferase activity(GO:0070568) |
| 0.0 | 0.1 | GO:0004161 | dimethylallyltranstransferase activity(GO:0004161) geranyltranstransferase activity(GO:0004337) |
| 0.0 | 0.4 | GO:0050321 | tau-protein kinase activity(GO:0050321) |
| 0.0 | 0.3 | GO:0048407 | platelet-derived growth factor binding(GO:0048407) |
| 0.0 | 0.4 | GO:0036442 | hydrogen-exporting ATPase activity(GO:0036442) ATPase activity, coupled to transmembrane movement of ions, rotational mechanism(GO:0044769) proton-transporting ATPase activity, rotational mechanism(GO:0046961) |
| 0.0 | 0.2 | GO:0032453 | histone demethylase activity (H3-K4 specific)(GO:0032453) |
| 0.0 | 0.3 | GO:0003688 | DNA replication origin binding(GO:0003688) |
| 0.0 | 1.4 | GO:0015459 | potassium channel regulator activity(GO:0015459) |
| 0.0 | 0.5 | GO:0031210 | phosphatidylcholine binding(GO:0031210) |
| 0.0 | 4.2 | GO:0001078 | transcriptional repressor activity, RNA polymerase II core promoter proximal region sequence-specific binding(GO:0001078) |
| 0.0 | 0.3 | GO:0031404 | chloride ion binding(GO:0031404) |
| 0.0 | 5.2 | GO:0008017 | microtubule binding(GO:0008017) |
| 0.0 | 0.1 | GO:0016308 | 1-phosphatidylinositol-4-phosphate 5-kinase activity(GO:0016308) |
| 0.0 | 0.3 | GO:0032794 | GTPase activating protein binding(GO:0032794) |
| 0.0 | 0.2 | GO:0047144 | 2-acylglycerol-3-phosphate O-acyltransferase activity(GO:0047144) |
| 0.0 | 0.4 | GO:0005523 | tropomyosin binding(GO:0005523) |
| 0.0 | 0.8 | GO:0005160 | transforming growth factor beta receptor binding(GO:0005160) |
| 0.0 | 0.4 | GO:0070182 | DNA polymerase binding(GO:0070182) |
| 0.0 | 1.3 | GO:0048365 | Rac GTPase binding(GO:0048365) |
| 0.0 | 0.3 | GO:0019911 | structural constituent of myelin sheath(GO:0019911) |
| 0.0 | 1.4 | GO:0031490 | chromatin DNA binding(GO:0031490) |
| 0.0 | 0.3 | GO:0033038 | bitter taste receptor activity(GO:0033038) |
| 0.0 | 0.2 | GO:0004321 | fatty-acyl-CoA synthase activity(GO:0004321) |
| 0.0 | 0.6 | GO:0031369 | translation initiation factor binding(GO:0031369) |
| 0.0 | 1.2 | GO:0051117 | ATPase binding(GO:0051117) |
| 0.0 | 0.3 | GO:0004535 | poly(A)-specific ribonuclease activity(GO:0004535) |
| 0.0 | 0.2 | GO:1900750 | glutathione binding(GO:0043295) oligopeptide binding(GO:1900750) |
| 0.0 | 0.3 | GO:0008239 | dipeptidyl-peptidase activity(GO:0008239) |
| 0.0 | 1.9 | GO:0005179 | hormone activity(GO:0005179) |
| 0.0 | 0.1 | GO:0042799 | histone methyltransferase activity (H4-K20 specific)(GO:0042799) |
| 0.0 | 0.2 | GO:0016783 | sulfurtransferase activity(GO:0016783) |
| 0.0 | 0.2 | GO:0005537 | mannose binding(GO:0005537) |
| 0.0 | 0.1 | GO:0016416 | carnitine O-palmitoyltransferase activity(GO:0004095) O-palmitoyltransferase activity(GO:0016416) |
| 0.0 | 0.2 | GO:0050811 | GABA receptor binding(GO:0050811) |
Gene overrepresentation in curated gene sets: canonical pathways category:
| Log-likelihood per target | Total log-likelihood | Term | Description |
|---|---|---|---|
| 0.2 | 8.3 | PID HDAC CLASSIII PATHWAY | Signaling events mediated by HDAC Class III |
| 0.1 | 1.9 | PID P38 GAMMA DELTA PATHWAY | Signaling mediated by p38-gamma and p38-delta |
| 0.1 | 4.2 | ST GA12 PATHWAY | G alpha 12 Pathway |
| 0.1 | 4.4 | NABA PROTEOGLYCANS | Genes encoding proteoglycans |
| 0.1 | 3.2 | PID PRL SIGNALING EVENTS PATHWAY | Signaling events mediated by PRL |
| 0.1 | 1.5 | PID HES HEY PATHWAY | Notch-mediated HES/HEY network |
| 0.1 | 5.7 | PID PI3K PLC TRK PATHWAY | Trk receptor signaling mediated by PI3K and PLC-gamma |
| 0.1 | 5.5 | PID HNF3B PATHWAY | FOXA2 and FOXA3 transcription factor networks |
| 0.1 | 5.0 | PID TAP63 PATHWAY | Validated transcriptional targets of TAp63 isoforms |
| 0.1 | 1.4 | PID INTEGRIN A9B1 PATHWAY | Alpha9 beta1 integrin signaling events |
| 0.0 | 2.1 | ST JNK MAPK PATHWAY | JNK MAPK Pathway |
| 0.0 | 3.3 | PID FANCONI PATHWAY | Fanconi anemia pathway |
| 0.0 | 2.8 | PID NFAT TFPATHWAY | Calcineurin-regulated NFAT-dependent transcription in lymphocytes |
| 0.0 | 1.7 | PID P38 MKK3 6PATHWAY | p38 MAPK signaling pathway |
| 0.0 | 2.3 | PID TCR CALCIUM PATHWAY | Calcium signaling in the CD4+ TCR pathway |
| 0.0 | 3.3 | PID LKB1 PATHWAY | LKB1 signaling events |
| 0.0 | 1.7 | ST MYOCYTE AD PATHWAY | Myocyte Adrenergic Pathway is a specific case of the generalized Adrenergic Pathway. |
| 0.0 | 1.5 | PID WNT SIGNALING PATHWAY | Wnt signaling network |
| 0.0 | 1.9 | PID A6B1 A6B4 INTEGRIN PATHWAY | a6b1 and a6b4 Integrin signaling |
| 0.0 | 1.1 | PID ALPHA SYNUCLEIN PATHWAY | Alpha-synuclein signaling |
| 0.0 | 3.2 | PID CASPASE PATHWAY | Caspase cascade in apoptosis |
| 0.0 | 2.1 | SIG REGULATION OF THE ACTIN CYTOSKELETON BY RHO GTPASES | Genes related to regulation of the actin cytoskeleton |
| 0.0 | 1.7 | PID ECADHERIN NASCENT AJ PATHWAY | E-cadherin signaling in the nascent adherens junction |
| 0.0 | 0.8 | PID ERB GENOMIC PATHWAY | Validated nuclear estrogen receptor beta network |
| 0.0 | 3.4 | PID MYC REPRESS PATHWAY | Validated targets of C-MYC transcriptional repression |
| 0.0 | 0.8 | PID SMAD2 3PATHWAY | Regulation of cytoplasmic and nuclear SMAD2/3 signaling |
| 0.0 | 0.9 | SIG CD40PATHWAYMAP | Genes related to CD40 signaling |
| 0.0 | 1.0 | PID LIS1 PATHWAY | Lissencephaly gene (LIS1) in neuronal migration and development |
| 0.0 | 1.4 | ST WNT BETA CATENIN PATHWAY | Wnt/beta-catenin Pathway |
| 0.0 | 0.5 | PID TOLL ENDOGENOUS PATHWAY | Endogenous TLR signaling |
| 0.0 | 1.2 | PID NCADHERIN PATHWAY | N-cadherin signaling events |
| 0.0 | 1.4 | PID INTEGRIN A4B1 PATHWAY | Alpha4 beta1 integrin signaling events |
| 0.0 | 2.1 | PID MYC ACTIV PATHWAY | Validated targets of C-MYC transcriptional activation |
| 0.0 | 0.5 | PID BARD1 PATHWAY | BARD1 signaling events |
| 0.0 | 0.5 | PID ERBB NETWORK PATHWAY | ErbB receptor signaling network |
| 0.0 | 0.4 | PID HEDGEHOG GLI PATHWAY | Hedgehog signaling events mediated by Gli proteins |
| 0.0 | 0.9 | PID TGFBR PATHWAY | TGF-beta receptor signaling |
| 0.0 | 0.9 | PID SYNDECAN 1 PATHWAY | Syndecan-1-mediated signaling events |
| 0.0 | 1.6 | PID P53 DOWNSTREAM PATHWAY | Direct p53 effectors |
| 0.0 | 0.5 | PID RXR VDR PATHWAY | RXR and RAR heterodimerization with other nuclear receptor |
Gene overrepresentation in curated gene sets: REACTOME pathways category:
| Log-likelihood per target | Total log-likelihood | Term | Description |
|---|---|---|---|
| 0.4 | 14.5 | REACTOME PRE NOTCH PROCESSING IN GOLGI | Genes involved in Pre-NOTCH Processing in Golgi |
| 0.3 | 8.1 | REACTOME GLUCURONIDATION | Genes involved in Glucuronidation |
| 0.3 | 10.6 | REACTOME SYNTHESIS AND INTERCONVERSION OF NUCLEOTIDE DI AND TRIPHOSPHATES | Genes involved in Synthesis and interconversion of nucleotide di- and triphosphates |
| 0.3 | 7.9 | REACTOME CS DS DEGRADATION | Genes involved in CS/DS degradation |
| 0.2 | 14.8 | REACTOME STRIATED MUSCLE CONTRACTION | Genes involved in Striated Muscle Contraction |
| 0.2 | 5.7 | REACTOME NOREPINEPHRINE NEUROTRANSMITTER RELEASE CYCLE | Genes involved in Norepinephrine Neurotransmitter Release Cycle |
| 0.2 | 2.9 | REACTOME ANDROGEN BIOSYNTHESIS | Genes involved in Androgen biosynthesis |
| 0.2 | 4.0 | REACTOME AMINE DERIVED HORMONES | Genes involved in Amine-derived hormones |
| 0.2 | 6.4 | REACTOME SIGNALING BY HIPPO | Genes involved in Signaling by Hippo |
| 0.2 | 4.7 | REACTOME CITRIC ACID CYCLE TCA CYCLE | Genes involved in Citric acid cycle (TCA cycle) |
| 0.2 | 7.3 | REACTOME CIRCADIAN REPRESSION OF EXPRESSION BY REV ERBA | Genes involved in Circadian Repression of Expression by REV-ERBA |
| 0.2 | 8.0 | REACTOME CGMP EFFECTS | Genes involved in cGMP effects |
| 0.1 | 1.6 | REACTOME SYNTHESIS OF BILE ACIDS AND BILE SALTS VIA 24 HYDROXYCHOLESTEROL | Genes involved in Synthesis of bile acids and bile salts via 24-hydroxycholesterol |
| 0.1 | 2.6 | REACTOME CYTOSOLIC SULFONATION OF SMALL MOLECULES | Genes involved in Cytosolic sulfonation of small molecules |
| 0.1 | 5.2 | REACTOME ION TRANSPORT BY P TYPE ATPASES | Genes involved in Ion transport by P-type ATPases |
| 0.1 | 5.2 | REACTOME INTERACTION BETWEEN L1 AND ANKYRINS | Genes involved in Interaction between L1 and Ankyrins |
| 0.1 | 1.4 | REACTOME REPAIR SYNTHESIS FOR GAP FILLING BY DNA POL IN TC NER | Genes involved in Repair synthesis for gap-filling by DNA polymerase in TC-NER |
| 0.1 | 3.3 | REACTOME FORMATION OF INCISION COMPLEX IN GG NER | Genes involved in Formation of incision complex in GG-NER |
| 0.1 | 2.5 | REACTOME CASPASE MEDIATED CLEAVAGE OF CYTOSKELETAL PROTEINS | Genes involved in Caspase-mediated cleavage of cytoskeletal proteins |
| 0.1 | 6.6 | REACTOME NCAM1 INTERACTIONS | Genes involved in NCAM1 interactions |
| 0.1 | 1.6 | REACTOME DSCAM INTERACTIONS | Genes involved in DSCAM interactions |
| 0.1 | 1.4 | REACTOME REGULATION OF RHEB GTPASE ACTIVITY BY AMPK | Genes involved in Regulation of Rheb GTPase activity by AMPK |
| 0.1 | 4.6 | REACTOME DARPP 32 EVENTS | Genes involved in DARPP-32 events |
| 0.1 | 5.6 | REACTOME TRAFFICKING OF AMPA RECEPTORS | Genes involved in Trafficking of AMPA receptors |
| 0.1 | 0.8 | REACTOME SYNTHESIS OF BILE ACIDS AND BILE SALTS VIA 7ALPHA HYDROXYCHOLESTEROL | Genes involved in Synthesis of bile acids and bile salts via 7alpha-hydroxycholesterol |
| 0.1 | 0.9 | REACTOME ROLE OF DCC IN REGULATING APOPTOSIS | Genes involved in Role of DCC in regulating apoptosis |
| 0.1 | 1.9 | REACTOME SIGNAL REGULATORY PROTEIN SIRP FAMILY INTERACTIONS | Genes involved in Signal regulatory protein (SIRP) family interactions |
| 0.0 | 0.9 | REACTOME XENOBIOTICS | Genes involved in Xenobiotics |
| 0.0 | 14.0 | REACTOME OLFACTORY SIGNALING PATHWAY | Genes involved in Olfactory Signaling Pathway |
| 0.0 | 2.2 | REACTOME SIGNALING BY CONSTITUTIVELY ACTIVE EGFR | Genes involved in Signaling by constitutively active EGFR |
| 0.0 | 0.6 | REACTOME TRYPTOPHAN CATABOLISM | Genes involved in Tryptophan catabolism |
| 0.0 | 1.8 | REACTOME CHOLESTEROL BIOSYNTHESIS | Genes involved in Cholesterol biosynthesis |
| 0.0 | 1.0 | REACTOME TANDEM PORE DOMAIN POTASSIUM CHANNELS | Genes involved in Tandem pore domain potassium channels |
| 0.0 | 1.5 | REACTOME PROLACTIN RECEPTOR SIGNALING | Genes involved in Prolactin receptor signaling |
| 0.0 | 0.6 | REACTOME APOPTOSIS INDUCED DNA FRAGMENTATION | Genes involved in Apoptosis induced DNA fragmentation |
| 0.0 | 0.2 | REACTOME ACYL CHAIN REMODELLING OF PG | Genes involved in Acyl chain remodelling of PG |
| 0.0 | 0.7 | REACTOME REGULATION OF AMPK ACTIVITY VIA LKB1 | Genes involved in Regulation of AMPK activity via LKB1 |
| 0.0 | 0.8 | REACTOME SYNTHESIS SECRETION AND DEACYLATION OF GHRELIN | Genes involved in Synthesis, Secretion, and Deacylation of Ghrelin |
| 0.0 | 2.2 | REACTOME GLYCOLYSIS | Genes involved in Glycolysis |
| 0.0 | 0.9 | REACTOME SIGNALING BY SCF KIT | Genes involved in Signaling by SCF-KIT |
| 0.0 | 2.1 | REACTOME ADHERENS JUNCTIONS INTERACTIONS | Genes involved in Adherens junctions interactions |
| 0.0 | 0.6 | REACTOME ACTIVATED AMPK STIMULATES FATTY ACID OXIDATION IN MUSCLE | Genes involved in Activated AMPK stimulates fatty-acid oxidation in muscle |
| 0.0 | 2.4 | REACTOME GLYCOSPHINGOLIPID METABOLISM | Genes involved in Glycosphingolipid metabolism |
| 0.0 | 0.3 | REACTOME INNATE IMMUNE SYSTEM | Genes involved in Innate Immune System |
| 0.0 | 1.4 | REACTOME SYNTHESIS OF PA | Genes involved in Synthesis of PA |
| 0.0 | 4.9 | REACTOME PPARA ACTIVATES GENE EXPRESSION | Genes involved in PPARA Activates Gene Expression |
| 0.0 | 0.9 | REACTOME GAP JUNCTION ASSEMBLY | Genes involved in Gap junction assembly |
| 0.0 | 2.8 | REACTOME ACTIVATION OF NF KAPPAB IN B CELLS | Genes involved in Activation of NF-kappaB in B Cells |
| 0.0 | 2.0 | REACTOME PHASE II CONJUGATION | Genes involved in Phase II conjugation |
| 0.0 | 0.8 | REACTOME REGULATION OF INSULIN LIKE GROWTH FACTOR IGF ACTIVITY BY INSULIN LIKE GROWTH FACTOR BINDING PROTEINS IGFBPS | Genes involved in Regulation of Insulin-like Growth Factor (IGF) Activity by Insulin-like Growth Factor Binding Proteins (IGFBPs) |
| 0.0 | 0.7 | REACTOME REGULATION OF IFNA SIGNALING | Genes involved in Regulation of IFNA signaling |
| 0.0 | 0.5 | REACTOME RIP MEDIATED NFKB ACTIVATION VIA DAI | Genes involved in RIP-mediated NFkB activation via DAI |
| 0.0 | 0.4 | REACTOME CDT1 ASSOCIATION WITH THE CDC6 ORC ORIGIN COMPLEX | Genes involved in CDT1 association with the CDC6:ORC:origin complex |
| 0.0 | 7.0 | REACTOME ANTIGEN PROCESSING UBIQUITINATION PROTEASOME DEGRADATION | Genes involved in Antigen processing: Ubiquitination & Proteasome degradation |
| 0.0 | 1.0 | REACTOME BETA DEFENSINS | Genes involved in Beta defensins |
| 0.0 | 1.3 | REACTOME MITOCHONDRIAL PROTEIN IMPORT | Genes involved in Mitochondrial Protein Import |
| 0.0 | 2.5 | REACTOME NUCLEAR RECEPTOR TRANSCRIPTION PATHWAY | Genes involved in Nuclear Receptor transcription pathway |
| 0.0 | 0.6 | REACTOME BRANCHED CHAIN AMINO ACID CATABOLISM | Genes involved in Branched-chain amino acid catabolism |
| 0.0 | 0.4 | REACTOME ETHANOL OXIDATION | Genes involved in Ethanol oxidation |
| 0.0 | 0.4 | REACTOME NEF MEDIATED DOWNREGULATION OF MHC CLASS I COMPLEX CELL SURFACE EXPRESSION | Genes involved in Nef mediated downregulation of MHC class I complex cell surface expression |
| 0.0 | 0.9 | REACTOME MEIOTIC RECOMBINATION | Genes involved in Meiotic Recombination |
| 0.0 | 0.7 | REACTOME SIGNALING BY NODAL | Genes involved in Signaling by NODAL |
| 0.0 | 0.9 | REACTOME COMPLEMENT CASCADE | Genes involved in Complement cascade |
| 0.0 | 1.6 | REACTOME LOSS OF NLP FROM MITOTIC CENTROSOMES | Genes involved in Loss of Nlp from mitotic centrosomes |
| 0.0 | 0.4 | REACTOME FORMATION OF TUBULIN FOLDING INTERMEDIATES BY CCT TRIC | Genes involved in Formation of tubulin folding intermediates by CCT/TriC |
| 0.0 | 0.7 | REACTOME APOPTOTIC CLEAVAGE OF CELLULAR PROTEINS | Genes involved in Apoptotic cleavage of cellular proteins |
| 0.0 | 0.8 | REACTOME GLUCAGON SIGNALING IN METABOLIC REGULATION | Genes involved in Glucagon signaling in metabolic regulation |
| 0.0 | 0.6 | REACTOME INWARDLY RECTIFYING K CHANNELS | Genes involved in Inwardly rectifying K+ channels |
| 0.0 | 0.5 | REACTOME NUCLEAR SIGNALING BY ERBB4 | Genes involved in Nuclear signaling by ERBB4 |
| 0.0 | 0.4 | REACTOME INSULIN RECEPTOR RECYCLING | Genes involved in Insulin receptor recycling |
| 0.0 | 0.6 | REACTOME AMINE LIGAND BINDING RECEPTORS | Genes involved in Amine ligand-binding receptors |
| 0.0 | 0.3 | REACTOME DESTABILIZATION OF MRNA BY KSRP | Genes involved in Destabilization of mRNA by KSRP |
| 0.0 | 0.4 | REACTOME ACTIVATED NOTCH1 TRANSMITS SIGNAL TO THE NUCLEUS | Genes involved in Activated NOTCH1 Transmits Signal to the Nucleus |
| 0.0 | 0.9 | REACTOME RESPIRATORY ELECTRON TRANSPORT | Genes involved in Respiratory electron transport |
| 0.0 | 0.4 | REACTOME ZINC TRANSPORTERS | Genes involved in Zinc transporters |
| 0.0 | 0.7 | REACTOME COLLAGEN FORMATION | Genes involved in Collagen formation |