Project
Illumina Body Map 2 (GSE30611)
Navigation
Downloads
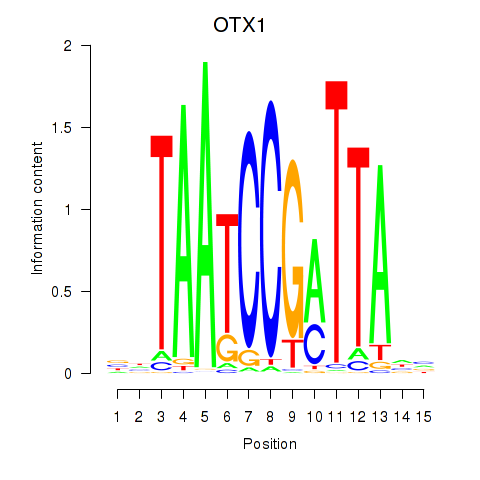
Results for OTX1
Z-value: 0.77
Motif logo
Transcription factors associated with OTX1
| Gene Symbol | Gene ID | Gene Info |
|---|---|---|
|
OTX1
|
ENSG00000115507.10 | orthodenticle homeobox 1 |
Activity-expression correlation:
| Gene | Promoter | Pearson corr. coef. | P-value | Plot |
|---|---|---|---|---|
| OTX1 | hg38_v1_chr2_+_63050813_63050839 | -0.41 | 2.1e-02 | Click! |
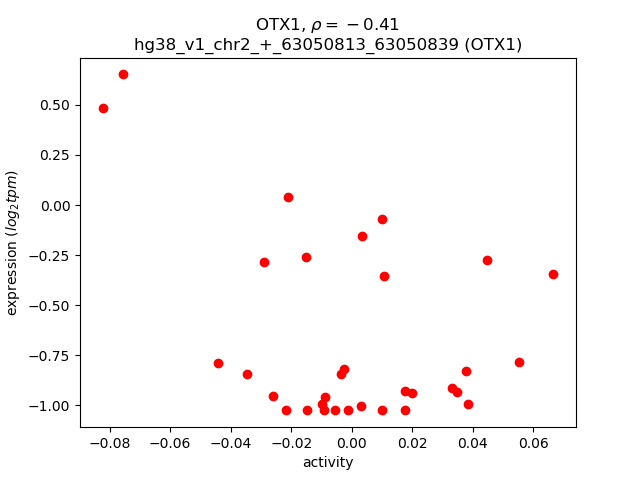
Activity profile of OTX1 motif
Sorted Z-values of OTX1 motif
| Promoter | Log-likelihood | Transcript | Gene | Gene Info |
|---|---|---|---|---|
| chr7_-_15686671 | 2.54 |
ENST00000262041.6
|
MEOX2
|
mesenchyme homeobox 2 |
| chr14_-_106675544 | 2.52 |
ENST00000390632.2
|
IGHV3-66
|
immunoglobulin heavy variable 3-66 |
| chr9_+_98943705 | 2.10 |
ENST00000610452.1
|
COL15A1
|
collagen type XV alpha 1 chain |
| chr3_+_188947199 | 1.48 |
ENST00000433971.5
|
TPRG1
|
tumor protein p63 regulated 1 |
| chr1_-_91886144 | 1.40 |
ENST00000212355.9
|
TGFBR3
|
transforming growth factor beta receptor 3 |
| chr21_+_32298945 | 1.35 |
ENST00000339944.4
|
MRAP
|
melanocortin 2 receptor accessory protein |
| chr19_-_47113756 | 1.30 |
ENST00000253048.10
|
ZC3H4
|
zinc finger CCCH-type containing 4 |
| chr4_-_137532452 | 1.30 |
ENST00000412923.6
ENST00000511115.5 ENST00000344876.9 ENST00000507846.5 ENST00000510305.5 ENST00000611581.1 |
PCDH18
|
protocadherin 18 |
| chr9_+_122370523 | 1.27 |
ENST00000643810.1
ENST00000540753.6 |
PTGS1
|
prostaglandin-endoperoxide synthase 1 |
| chr7_+_121062765 | 1.23 |
ENST00000423795.5
|
CPED1
|
cadherin like and PC-esterase domain containing 1 |
| chr16_-_15856994 | 1.21 |
ENST00000576790.7
ENST00000396324.7 ENST00000300036.6 ENST00000452625.7 |
MYH11
|
myosin heavy chain 11 |
| chr16_-_55833186 | 1.17 |
ENST00000361503.8
ENST00000422046.6 |
CES1
|
carboxylesterase 1 |
| chr9_-_92482499 | 1.16 |
ENST00000375544.7
|
ASPN
|
asporin |
| chr19_+_50854910 | 1.11 |
ENST00000601503.5
ENST00000326003.7 ENST00000617027.4 ENST00000597286.5 ENST00000597483.5 ENST00000593997.5 |
KLK3
|
kallikrein related peptidase 3 |
| chr9_-_92482350 | 1.00 |
ENST00000375543.2
|
ASPN
|
asporin |
| chr14_-_106005574 | 1.00 |
ENST00000390595.3
|
IGHV1-3
|
immunoglobulin heavy variable 1-3 |
| chr6_+_33391805 | 0.99 |
ENST00000428849.7
ENST00000450504.1 |
KIFC1
|
kinesin family member C1 |
| chr19_+_50854938 | 0.98 |
ENST00000595952.5
ENST00000360617.7 ENST00000598145.1 |
KLK3
|
kallikrein related peptidase 3 |
| chr14_-_106511856 | 0.95 |
ENST00000390622.2
|
IGHV1-46
|
immunoglobulin heavy variable 1-46 |
| chr6_+_35452314 | 0.95 |
ENST00000229769.3
|
FANCE
|
FA complementation group E |
| chr22_+_22369601 | 0.94 |
ENST00000390295.3
|
IGLV7-46
|
immunoglobulin lambda variable 7-46 |
| chr3_-_149377637 | 0.94 |
ENST00000305366.8
|
TM4SF1
|
transmembrane 4 L six family member 1 |
| chr19_-_42412347 | 0.92 |
ENST00000601189.1
ENST00000599211.1 |
LIPE
|
lipase E, hormone sensitive type |
| chr7_+_120988683 | 0.92 |
ENST00000340646.9
ENST00000310396.10 |
CPED1
|
cadherin like and PC-esterase domain containing 1 |
| chr9_-_92482461 | 0.90 |
ENST00000651738.1
|
ASPN
|
asporin |
| chr1_+_34792990 | 0.88 |
ENST00000450137.1
ENST00000342280.5 |
GJA4
|
gap junction protein alpha 4 |
| chr13_+_24309565 | 0.88 |
ENST00000332018.4
|
C1QTNF9
|
C1q and TNF related 9 |
| chr12_-_9115907 | 0.83 |
ENST00000318602.12
|
A2M
|
alpha-2-macroglobulin |
| chr6_-_32763466 | 0.81 |
ENST00000427449.1
ENST00000411527.5 |
HLA-DQB2
|
major histocompatibility complex, class II, DQ beta 2 |
| chr9_-_35563867 | 0.81 |
ENST00000399742.7
ENST00000619051.4 |
FAM166B
|
family with sequence similarity 166 member B |
| chr11_+_8683201 | 0.78 |
ENST00000526562.5
ENST00000525981.1 |
RPL27A
|
ribosomal protein L27a |
| chr19_-_3761657 | 0.78 |
ENST00000316757.4
|
APBA3
|
amyloid beta precursor protein binding family A member 3 |
| chrX_+_101390824 | 0.77 |
ENST00000427805.6
ENST00000614077.4 |
RPL36A
|
ribosomal protein L36a |
| chr16_+_68085552 | 0.77 |
ENST00000329524.8
|
NFATC3
|
nuclear factor of activated T cells 3 |
| chr2_-_189583392 | 0.75 |
ENST00000440626.1
|
SLC40A1
|
solute carrier family 40 member 1 |
| chr14_-_106724093 | 0.74 |
ENST00000390634.3
|
IGHV2-70D
|
immunoglobulin heavy variable 2-70D |
| chr17_-_38825303 | 0.74 |
ENST00000614790.5
|
CWC25
|
CWC25 spliceosome associated protein homolog |
| chr17_+_59940908 | 0.73 |
ENST00000591035.1
|
ENSG00000267318.1
|
novel protein |
| chr3_-_69013639 | 0.73 |
ENST00000456376.2
ENST00000383701.8 |
EOGT
|
EGF domain specific O-linked N-acetylglucosamine transferase |
| chr15_-_19988117 | 0.73 |
ENST00000558565.2
|
IGHV3OR15-7
|
immunoglobulin heavy variable 3/OR15-7 (pseudogene) |
| chr2_+_102104563 | 0.72 |
ENST00000409589.5
ENST00000409329.5 |
IL1R1
|
interleukin 1 receptor type 1 |
| chr16_-_54286763 | 0.71 |
ENST00000329734.4
|
IRX3
|
iroquois homeobox 3 |
| chr14_-_89412025 | 0.69 |
ENST00000553840.5
ENST00000556916.5 |
FOXN3
|
forkhead box N3 |
| chr3_-_69013612 | 0.68 |
ENST00000295571.9
|
EOGT
|
EGF domain specific O-linked N-acetylglucosamine transferase |
| chr8_-_56074144 | 0.67 |
ENST00000618656.2
|
RPS20
|
ribosomal protein S20 |
| chr3_+_138621225 | 0.64 |
ENST00000479848.1
|
FAIM
|
Fas apoptotic inhibitory molecule |
| chr3_+_138621207 | 0.63 |
ENST00000464668.5
|
FAIM
|
Fas apoptotic inhibitory molecule |
| chr1_-_16212598 | 0.63 |
ENST00000270747.8
|
ARHGEF19
|
Rho guanine nucleotide exchange factor 19 |
| chr5_+_111071710 | 0.62 |
ENST00000344895.4
|
TSLP
|
thymic stromal lymphopoietin |
| chr1_+_160739286 | 0.62 |
ENST00000359331.8
ENST00000495334.1 |
SLAMF7
|
SLAM family member 7 |
| chr16_-_21440719 | 0.61 |
ENST00000521589.5
|
NPIPB3
|
nuclear pore complex interacting protein family member B3 |
| chr1_+_86993009 | 0.59 |
ENST00000370548.3
|
ENSG00000267561.2
|
novel protein |
| chr19_-_38975687 | 0.57 |
ENST00000292852.9
|
FBXO17
|
F-box protein 17 |
| chr16_-_21652598 | 0.57 |
ENST00000569602.1
ENST00000268389.6 |
IGSF6
|
immunoglobulin superfamily member 6 |
| chr1_+_24556087 | 0.56 |
ENST00000374392.3
|
NCMAP
|
non-compact myelin associated protein |
| chr6_-_130890393 | 0.56 |
ENST00000456097.6
|
EPB41L2
|
erythrocyte membrane protein band 4.1 like 2 |
| chr14_-_106803221 | 0.56 |
ENST00000390636.2
|
IGHV3-73
|
immunoglobulin heavy variable 3-73 |
| chr3_-_71132099 | 0.55 |
ENST00000650188.1
ENST00000648121.1 ENST00000648794.1 ENST00000649592.1 |
FOXP1
|
forkhead box P1 |
| chr2_+_169479445 | 0.55 |
ENST00000513963.1
ENST00000392663.6 ENST00000295240.8 |
ENSG00000251569.1
BBS5
|
novel protein Bardet-Biedl syndrome 5 |
| chr11_-_67508091 | 0.54 |
ENST00000531506.1
|
CDK2AP2
|
cyclin dependent kinase 2 associated protein 2 |
| chr5_-_39425187 | 0.54 |
ENST00000545653.5
|
DAB2
|
DAB adaptor protein 2 |
| chr4_+_99816797 | 0.51 |
ENST00000512369.2
ENST00000296414.11 |
DAPP1
|
dual adaptor of phosphotyrosine and 3-phosphoinositides 1 |
| chr14_-_106301848 | 0.50 |
ENST00000390611.2
|
IGHV2-26
|
immunoglobulin heavy variable 2-26 |
| chr18_-_80247348 | 0.50 |
ENST00000470488.2
ENST00000353265.8 |
PARD6G
|
par-6 family cell polarity regulator gamma |
| chr1_-_16156059 | 0.50 |
ENST00000358432.8
|
EPHA2
|
EPH receptor A2 |
| chr18_+_23689439 | 0.49 |
ENST00000313654.14
|
LAMA3
|
laminin subunit alpha 3 |
| chr3_+_136930469 | 0.48 |
ENST00000469404.1
ENST00000467911.1 |
NCK1
|
NCK adaptor protein 1 |
| chr4_-_82848843 | 0.48 |
ENST00000511338.1
|
SEC31A
|
SEC31 homolog A, COPII coat complex component |
| chr1_-_53142577 | 0.46 |
ENST00000620347.5
ENST00000611397.5 |
SLC1A7
|
solute carrier family 1 member 7 |
| chr3_+_155083523 | 0.46 |
ENST00000680057.1
|
MME
|
membrane metalloendopeptidase |
| chrX_-_135022473 | 0.46 |
ENST00000391440.3
|
RTL8B
|
retrotransposon Gag like 8B |
| chr13_+_23180960 | 0.45 |
ENST00000218867.4
|
SGCG
|
sarcoglycan gamma |
| chr16_-_29862890 | 0.45 |
ENST00000563415.1
|
CDIPT
|
CDP-diacylglycerol--inositol 3-phosphatidyltransferase |
| chr6_+_106098933 | 0.44 |
ENST00000369089.3
|
PRDM1
|
PR/SET domain 1 |
| chr10_+_24466487 | 0.44 |
ENST00000396446.5
ENST00000396445.5 ENST00000376451.4 |
KIAA1217
|
KIAA1217 |
| chr1_+_174875505 | 0.42 |
ENST00000486220.5
|
RABGAP1L
|
RAB GTPase activating protein 1 like |
| chr11_-_67508152 | 0.42 |
ENST00000301488.8
|
CDK2AP2
|
cyclin dependent kinase 2 associated protein 2 |
| chr20_+_3071618 | 0.41 |
ENST00000217386.2
|
OXT
|
oxytocin/neurophysin I prepropeptide |
| chr16_+_33802683 | 0.41 |
ENST00000570121.2
|
IGHV3OR16-12
|
immunoglobulin heavy variable 3/OR16-12 (non-functional) |
| chr2_+_109898685 | 0.38 |
ENST00000480744.2
|
LIMS3
|
LIM zinc finger domain containing 3 |
| chr6_-_34426052 | 0.38 |
ENST00000344700.8
ENST00000644700.1 ENST00000648437.1 ENST00000644393.1 ENST00000639725.1 |
RPS10
RPS10-NUDT3
|
ribosomal protein S10 RPS10-NUDT3 readthrough |
| chrX_-_15315615 | 0.37 |
ENST00000380470.7
ENST00000480796.6 |
ASB11
|
ankyrin repeat and SOCS box containing 11 |
| chr10_+_112374110 | 0.37 |
ENST00000354655.9
|
ACSL5
|
acyl-CoA synthetase long chain family member 5 |
| chr17_-_8867639 | 0.36 |
ENST00000619866.5
|
PIK3R6
|
phosphoinositide-3-kinase regulatory subunit 6 |
| chr17_-_35560812 | 0.35 |
ENST00000674182.1
|
SLFN14
|
schlafen family member 14 |
| chr1_-_28643005 | 0.35 |
ENST00000263974.4
ENST00000373824.9 ENST00000495422.2 |
TAF12
|
TATA-box binding protein associated factor 12 |
| chr1_+_150321523 | 0.34 |
ENST00000324862.7
|
PRPF3
|
pre-mRNA processing factor 3 |
| chr2_-_105438503 | 0.34 |
ENST00000393352.7
ENST00000607522.1 |
FHL2
|
four and a half LIM domains 2 |
| chr6_+_42050876 | 0.34 |
ENST00000465926.5
ENST00000482432.1 |
TAF8
|
TATA-box binding protein associated factor 8 |
| chr17_-_36001549 | 0.34 |
ENST00000617897.2
|
CCL15
|
C-C motif chemokine ligand 15 |
| chr14_-_26598025 | 0.33 |
ENST00000539517.7
|
NOVA1
|
NOVA alternative splicing regulator 1 |
| chr1_-_53142617 | 0.33 |
ENST00000371491.4
ENST00000371494.9 |
SLC1A7
|
solute carrier family 1 member 7 |
| chr19_+_16197900 | 0.33 |
ENST00000429941.6
ENST00000291439.8 ENST00000444449.6 ENST00000589822.5 |
AP1M1
|
adaptor related protein complex 1 subunit mu 1 |
| chr6_-_34426020 | 0.32 |
ENST00000621356.3
ENST00000494077.6 ENST00000639877.1 |
RPS10
RPS10-NUDT3
|
ribosomal protein S10 RPS10-NUDT3 readthrough |
| chr17_+_43006740 | 0.31 |
ENST00000438323.2
ENST00000415816.7 |
IFI35
|
interferon induced protein 35 |
| chr14_+_20110739 | 0.31 |
ENST00000641386.2
ENST00000641633.2 |
OR4K17
|
olfactory receptor family 4 subfamily K member 17 |
| chr21_+_42653734 | 0.31 |
ENST00000335512.8
ENST00000328862.10 ENST00000335440.10 ENST00000380328.6 ENST00000398225.7 ENST00000398227.7 ENST00000398229.7 ENST00000398232.7 ENST00000398234.7 ENST00000398236.7 ENST00000349112.7 ENST00000398224.3 |
PDE9A
|
phosphodiesterase 9A |
| chr5_+_136160986 | 0.30 |
ENST00000507637.1
|
SMAD5
|
SMAD family member 5 |
| chr5_-_55692620 | 0.30 |
ENST00000503817.5
ENST00000512595.5 |
SLC38A9
|
solute carrier family 38 member 9 |
| chr8_+_22275309 | 0.30 |
ENST00000356766.11
ENST00000521356.5 |
PIWIL2
|
piwi like RNA-mediated gene silencing 2 |
| chr17_-_73227700 | 0.30 |
ENST00000579872.1
ENST00000580032.1 |
FAM104A
|
family with sequence similarity 104 member A |
| chr19_+_13151975 | 0.30 |
ENST00000588173.1
|
IER2
|
immediate early response 2 |
| chr16_-_29404029 | 0.29 |
ENST00000524087.5
|
NPIPB11
|
nuclear pore complex interacting protein family member B11 |
| chr14_-_26597430 | 0.27 |
ENST00000344429.9
ENST00000574031.1 ENST00000465357.6 ENST00000547619.5 |
NOVA1
|
NOVA alternative splicing regulator 1 |
| chr19_+_34428353 | 0.26 |
ENST00000590048.6
ENST00000246548.9 |
UBA2
|
ubiquitin like modifier activating enzyme 2 |
| chr16_-_66549770 | 0.26 |
ENST00000677715.1
ENST00000525974.5 |
TK2
|
thymidine kinase 2 |
| chr10_-_34815257 | 0.26 |
ENST00000374789.8
ENST00000374788.8 ENST00000346874.9 ENST00000374794.8 ENST00000350537.9 ENST00000374790.8 ENST00000374776.6 ENST00000374773.6 ENST00000545260.5 ENST00000545693.5 ENST00000340077.9 |
PARD3
|
par-3 family cell polarity regulator |
| chr2_-_159798234 | 0.26 |
ENST00000429078.6
ENST00000553424.5 |
CD302
|
CD302 molecule |
| chr16_-_29863117 | 0.26 |
ENST00000566113.5
ENST00000569956.5 ENST00000570016.5 ENST00000219789.11 |
CDIPT
|
CDP-diacylglycerol--inositol 3-phosphatidyltransferase |
| chr16_-_21857657 | 0.26 |
ENST00000341400.11
ENST00000518761.8 ENST00000682606.1 |
NPIPB4
|
nuclear pore complex interacting protein family member B4 |
| chr19_+_47113425 | 0.26 |
ENST00000594526.5
|
SAE1
|
SUMO1 activating enzyme subunit 1 |
| chr19_-_51108365 | 0.26 |
ENST00000421832.3
|
CTU1
|
cytosolic thiouridylase subunit 1 |
| chr19_+_17337539 | 0.25 |
ENST00000324894.13
ENST00000358792.11 ENST00000600625.5 |
GTPBP3
|
GTP binding protein 3, mitochondrial |
| chr1_+_81306096 | 0.25 |
ENST00000370721.5
ENST00000370727.5 ENST00000370725.5 ENST00000370723.5 ENST00000370728.5 ENST00000370730.5 |
ADGRL2
|
adhesion G protein-coupled receptor L2 |
| chr6_-_144095556 | 0.25 |
ENST00000367569.4
|
SF3B5
|
splicing factor 3b subunit 5 |
| chr1_-_15976114 | 0.24 |
ENST00000375733.6
|
ZBTB17
|
zinc finger and BTB domain containing 17 |
| chr17_-_7234262 | 0.24 |
ENST00000575756.5
ENST00000575458.5 |
DVL2
|
dishevelled segment polarity protein 2 |
| chr5_+_96702849 | 0.24 |
ENST00000508197.1
|
CAST
|
calpastatin |
| chr19_+_35449584 | 0.24 |
ENST00000246549.2
|
FFAR2
|
free fatty acid receptor 2 |
| chr16_-_21425278 | 0.23 |
ENST00000504841.6
ENST00000419180.6 |
NPIPB3
|
nuclear pore complex interacting protein family member B3 |
| chr14_+_77116562 | 0.23 |
ENST00000557408.5
|
TMEM63C
|
transmembrane protein 63C |
| chr4_-_121823843 | 0.23 |
ENST00000274026.10
|
CCNA2
|
cyclin A2 |
| chr6_-_31680377 | 0.23 |
ENST00000383237.4
|
LY6G5C
|
lymphocyte antigen 6 family member G5C |
| chr19_+_16197848 | 0.22 |
ENST00000590263.5
ENST00000590756.5 |
AP1M1
|
adaptor related protein complex 1 subunit mu 1 |
| chr16_-_66549839 | 0.22 |
ENST00000527800.6
ENST00000677555.1 ENST00000563369.6 |
TK2
|
thymidine kinase 2 |
| chr16_-_69339493 | 0.22 |
ENST00000562595.5
ENST00000615447.1 ENST00000306875.10 ENST00000562081.2 |
COG8
|
component of oligomeric golgi complex 8 |
| chr4_-_47981535 | 0.21 |
ENST00000402813.9
|
CNGA1
|
cyclic nucleotide gated channel subunit alpha 1 |
| chr19_-_53159004 | 0.21 |
ENST00000599096.1
ENST00000597183.5 ENST00000601804.5 ENST00000334197.12 ENST00000601469.2 ENST00000452676.6 |
ZNF347
|
zinc finger protein 347 |
| chr1_+_224356852 | 0.21 |
ENST00000366858.7
ENST00000366857.9 ENST00000465271.6 ENST00000366856.3 |
CNIH4
|
cornichon family AMPA receptor auxiliary protein 4 |
| chr4_+_74308463 | 0.21 |
ENST00000413830.6
|
EPGN
|
epithelial mitogen |
| chr11_+_124012997 | 0.21 |
ENST00000641521.1
ENST00000641722.1 |
OR10G4
|
olfactory receptor family 10 subfamily G member 4 |
| chr9_+_21802628 | 0.21 |
ENST00000644715.2
ENST00000460874.6 ENST00000580900.5 |
MTAP
|
methylthioadenosine phosphorylase |
| chr15_+_42495253 | 0.20 |
ENST00000349777.5
|
SNAP23
|
synaptosome associated protein 23 |
| chr1_+_184051678 | 0.20 |
ENST00000643231.1
|
TSEN15
|
tRNA splicing endonuclease subunit 15 |
| chr1_-_216423396 | 0.20 |
ENST00000366942.3
ENST00000674083.1 ENST00000307340.8 |
USH2A
|
usherin |
| chr22_+_38656627 | 0.19 |
ENST00000411557.5
ENST00000396811.6 ENST00000216029.7 ENST00000416285.5 |
CBY1
|
chibby family member 1, beta catenin antagonist |
| chr11_+_119334511 | 0.19 |
ENST00000311413.5
|
RNF26
|
ring finger protein 26 |
| chr1_-_92075441 | 0.19 |
ENST00000596516.2
|
SETSIP
|
SET like protein |
| chr11_-_112086727 | 0.18 |
ENST00000504148.3
ENST00000541231.1 |
TIMM8B
|
translocase of inner mitochondrial membrane 8 homolog B |
| chr1_-_15976070 | 0.18 |
ENST00000537142.5
ENST00000375743.9 |
ZBTB17
|
zinc finger and BTB domain containing 17 |
| chr15_-_61229297 | 0.18 |
ENST00000335670.11
|
RORA
|
RAR related orphan receptor A |
| chr16_-_66550005 | 0.18 |
ENST00000527284.6
|
TK2
|
thymidine kinase 2 |
| chr11_-_85665077 | 0.17 |
ENST00000527447.2
|
CREBZF
|
CREB/ATF bZIP transcription factor |
| chr1_+_247549002 | 0.17 |
ENST00000366488.5
|
GCSAML
|
germinal center associated signaling and motility like |
| chr1_-_154956086 | 0.17 |
ENST00000368463.8
ENST00000368460.7 ENST00000368465.5 |
PBXIP1
|
PBX homeobox interacting protein 1 |
| chr20_+_9166322 | 0.17 |
ENST00000416836.5
|
PLCB4
|
phospholipase C beta 4 |
| chr5_-_60488055 | 0.16 |
ENST00000505507.6
ENST00000515835.2 ENST00000502484.6 |
PDE4D
|
phosphodiesterase 4D |
| chr19_-_10420121 | 0.16 |
ENST00000593124.1
|
CDC37
|
cell division cycle 37, HSP90 cochaperone |
| chr19_-_15815664 | 0.16 |
ENST00000641419.1
|
OR10H1
|
olfactory receptor family 10 subfamily H member 1 |
| chr11_-_67443459 | 0.16 |
ENST00000341356.10
ENST00000627576.2 |
CORO1B
|
coronin 1B |
| chr8_-_78805515 | 0.16 |
ENST00000379113.6
ENST00000541183.2 |
IL7
|
interleukin 7 |
| chr3_-_98901155 | 0.16 |
ENST00000449482.1
|
DCBLD2
|
discoidin, CUB and LCCL domain containing 2 |
| chr2_-_85410336 | 0.15 |
ENST00000263867.9
ENST00000409921.5 |
CAPG
|
capping actin protein, gelsolin like |
| chr5_-_82278396 | 0.14 |
ENST00000510019.5
|
RPS23
|
ribosomal protein S23 |
| chr5_-_82278341 | 0.14 |
ENST00000510210.5
ENST00000512493.5 ENST00000296674.13 ENST00000507980.1 ENST00000511844.1 ENST00000651545.1 |
RPS23
|
ribosomal protein S23 |
| chr2_-_24084822 | 0.14 |
ENST00000238721.9
|
TP53I3
|
tumor protein p53 inducible protein 3 |
| chr1_+_243256034 | 0.13 |
ENST00000366541.8
|
SDCCAG8
|
SHH signaling and ciliogenesis regulator SDCCAG8 |
| chr19_+_10271093 | 0.13 |
ENST00000423829.2
ENST00000588645.1 ENST00000264832.8 |
ICAM1
|
intercellular adhesion molecule 1 |
| chr2_-_159798043 | 0.13 |
ENST00000664982.1
ENST00000259053.6 |
ENSG00000287091.1
CD302
|
novel transcript, sense intronic to CD302and LY75-CD302 CD302 molecule |
| chr12_-_53677397 | 0.13 |
ENST00000338662.6
ENST00000552242.5 |
ATP5MC2
|
ATP synthase membrane subunit c locus 2 |
| chr6_-_127342398 | 0.13 |
ENST00000531582.1
|
ECHDC1
|
ethylmalonyl-CoA decarboxylase 1 |
| chr5_+_148063971 | 0.12 |
ENST00000398454.5
ENST00000359874.7 ENST00000508733.5 ENST00000256084.8 |
SPINK5
|
serine peptidase inhibitor Kazal type 5 |
| chr4_+_75513885 | 0.12 |
ENST00000506261.5
|
THAP6
|
THAP domain containing 6 |
| chr14_-_24442241 | 0.12 |
ENST00000555355.5
ENST00000553343.5 ENST00000556523.1 ENST00000556249.1 ENST00000538105.6 ENST00000555225.5 |
SDR39U1
|
short chain dehydrogenase/reductase family 39U member 1 |
| chr8_+_142700095 | 0.12 |
ENST00000292430.10
ENST00000518841.5 ENST00000519387.1 |
LY6K
|
lymphocyte antigen 6 family member K |
| chr15_+_101812202 | 0.12 |
ENST00000332238.5
|
OR4F15
|
olfactory receptor family 4 subfamily F member 15 |
| chr13_+_113548303 | 0.12 |
ENST00000620021.4
|
TMCO3
|
transmembrane and coiled-coil domains 3 |
| chr13_+_97960192 | 0.12 |
ENST00000496368.6
ENST00000421861.7 ENST00000357602.7 |
IPO5
|
importin 5 |
| chr17_-_81656532 | 0.12 |
ENST00000331056.10
|
PDE6G
|
phosphodiesterase 6G |
| chr12_-_4645150 | 0.12 |
ENST00000536414.3
|
AKAP3
|
A-kinase anchoring protein 3 |
| chr4_+_1712821 | 0.11 |
ENST00000458173.4
|
TACC3
|
transforming acidic coiled-coil containing protein 3 |
| chr3_-_142029108 | 0.11 |
ENST00000497579.5
|
TFDP2
|
transcription factor Dp-2 |
| chr5_-_147906530 | 0.11 |
ENST00000318315.5
ENST00000515291.1 |
C5orf46
|
chromosome 5 open reading frame 46 |
| chr1_-_54887161 | 0.11 |
ENST00000535035.6
ENST00000371269.9 ENST00000436604.2 |
DHCR24
|
24-dehydrocholesterol reductase |
| chr6_-_132734692 | 0.11 |
ENST00000509351.5
ENST00000417437.6 ENST00000423615.6 ENST00000427187.6 ENST00000414302.7 ENST00000367927.9 ENST00000450865.2 |
VNN3
|
vanin 3 |
| chr3_-_11643871 | 0.10 |
ENST00000430365.7
|
VGLL4
|
vestigial like family member 4 |
| chr4_+_186144824 | 0.10 |
ENST00000227065.8
ENST00000502970.5 ENST00000514153.5 |
FAM149A
|
family with sequence similarity 149 member A |
| chr7_-_101252133 | 0.10 |
ENST00000435848.1
ENST00000474120.5 |
FIS1
|
fission, mitochondrial 1 |
| chr21_-_30755428 | 0.10 |
ENST00000335093.5
|
KRTAP21-1
|
keratin associated protein 21-1 |
| chr17_-_8376658 | 0.10 |
ENST00000643221.1
ENST00000647210.1 ENST00000649935.1 ENST00000396267.3 |
KRBA2
|
KRAB-A domain containing 2 |
| chr16_+_14708944 | 0.10 |
ENST00000526520.5
ENST00000531598.6 |
NPIPA3
|
nuclear pore complex interacting protein family member A3 |
| chr14_+_21736136 | 0.09 |
ENST00000390426.2
|
TRAV4
|
T cell receptor alpha variable 4 |
| chr17_-_41168219 | 0.09 |
ENST00000391356.4
|
KRTAP4-3
|
keratin associated protein 4-3 |
| chr15_-_68229658 | 0.09 |
ENST00000565471.6
ENST00000637494.1 ENST00000636314.1 ENST00000637667.1 ENST00000564752.1 ENST00000566347.5 ENST00000249806.11 ENST00000562767.2 |
CLN6
ENSG00000260007.3
|
CLN6 transmembrane ER protein novel protein |
| chr14_-_34714579 | 0.09 |
ENST00000298159.11
|
CFL2
|
cofilin 2 |
| chr6_+_70566892 | 0.09 |
ENST00000370474.4
|
SDHAF4
|
succinate dehydrogenase complex assembly factor 4 |
| chr17_-_28549333 | 0.09 |
ENST00000470125.5
|
UNC119
|
unc-119 lipid binding chaperone |
| chrX_+_80420466 | 0.08 |
ENST00000308293.5
|
TENT5D
|
terminal nucleotidyltransferase 5D |
| chrX_+_7219431 | 0.08 |
ENST00000674499.1
ENST00000217961.5 |
STS
|
steroid sulfatase |
| chr8_+_54616078 | 0.08 |
ENST00000220676.2
|
RP1
|
RP1 axonemal microtubule associated |
| chr1_-_165698863 | 0.07 |
ENST00000354775.4
|
ALDH9A1
|
aldehyde dehydrogenase 9 family member A1 |
| chr5_+_134967901 | 0.07 |
ENST00000282611.8
|
CATSPER3
|
cation channel sperm associated 3 |
| chr16_+_10866199 | 0.07 |
ENST00000637439.1
|
CIITA
|
class II major histocompatibility complex transactivator |
| chr12_+_6494087 | 0.06 |
ENST00000382457.8
ENST00000315579.10 |
NCAPD2
|
non-SMC condensin I complex subunit D2 |
| chr1_-_160862880 | 0.06 |
ENST00000368034.9
|
CD244
|
CD244 molecule |
| chr17_-_4786354 | 0.06 |
ENST00000328739.6
ENST00000441199.2 ENST00000416307.6 |
VMO1
|
vitelline membrane outer layer 1 homolog |
| chr5_+_111092329 | 0.05 |
ENST00000513710.4
|
WDR36
|
WD repeat domain 36 |
| chr22_-_38656353 | 0.05 |
ENST00000535113.7
|
FAM227A
|
family with sequence similarity 227 member A |
| chr4_-_107283689 | 0.05 |
ENST00000513208.5
|
DKK2
|
dickkopf WNT signaling pathway inhibitor 2 |
| chr6_+_38722810 | 0.04 |
ENST00000449981.6
|
DNAH8
|
dynein axonemal heavy chain 8 |
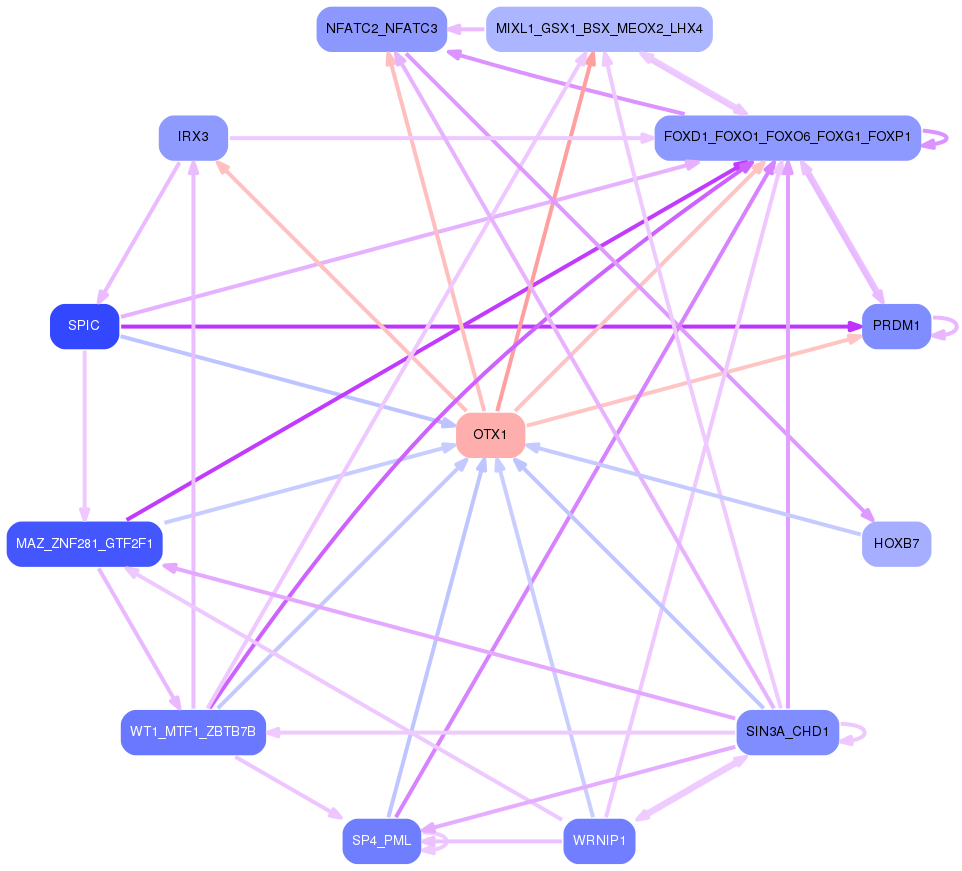
Network of associatons between targets according to the STRING database.

First level regulatory network of OTX1
Gene Ontology Analysis
Gene overrepresentation in biological process category:
| Log-likelihood per target | Total log-likelihood | Term | Description |
|---|---|---|---|
| 0.4 | 2.5 | GO:0001757 | somite specification(GO:0001757) |
| 0.4 | 3.1 | GO:0070171 | negative regulation of tooth mineralization(GO:0070171) |
| 0.3 | 1.2 | GO:0090119 | vesicle-mediated cholesterol transport(GO:0090119) |
| 0.3 | 1.4 | GO:0007181 | transforming growth factor beta receptor complex assembly(GO:0007181) |
| 0.2 | 0.7 | GO:0060345 | spleen trabecula formation(GO:0060345) iron cation export(GO:1903414) ferrous iron export(GO:1903988) |
| 0.2 | 0.8 | GO:0001869 | regulation of complement activation, lectin pathway(GO:0001868) negative regulation of complement activation, lectin pathway(GO:0001869) |
| 0.2 | 2.2 | GO:0002778 | antimicrobial peptide production(GO:0002775) antibacterial peptide production(GO:0002778) |
| 0.2 | 0.5 | GO:1901491 | axial mesoderm formation(GO:0048320) negative regulation of lymphangiogenesis(GO:1901491) |
| 0.2 | 0.5 | GO:1903676 | regulation of cap-dependent translational initiation(GO:1903674) positive regulation of cap-dependent translational initiation(GO:1903676) |
| 0.2 | 0.9 | GO:0046340 | diacylglycerol catabolic process(GO:0046340) |
| 0.2 | 1.2 | GO:0030241 | skeletal muscle myosin thick filament assembly(GO:0030241) |
| 0.1 | 0.4 | GO:1990654 | sebum secreting cell proliferation(GO:1990654) |
| 0.1 | 0.7 | GO:0072086 | specification of loop of Henle identity(GO:0072086) |
| 0.1 | 0.4 | GO:0002125 | maternal aggressive behavior(GO:0002125) |
| 0.1 | 0.7 | GO:2000661 | positive regulation of interleukin-1-mediated signaling pathway(GO:2000661) |
| 0.1 | 0.6 | GO:0032290 | peripheral nervous system myelin formation(GO:0032290) |
| 0.1 | 0.5 | GO:0035026 | leading edge cell differentiation(GO:0035026) |
| 0.1 | 1.0 | GO:2000035 | regulation of stem cell division(GO:2000035) |
| 0.1 | 0.3 | GO:0030718 | germ-line stem cell population maintenance(GO:0030718) |
| 0.1 | 0.7 | GO:0046092 | deoxycytidine metabolic process(GO:0046092) |
| 0.1 | 0.2 | GO:0002752 | cell surface pattern recognition receptor signaling pathway(GO:0002752) |
| 0.1 | 0.2 | GO:0071314 | cellular response to cocaine(GO:0071314) |
| 0.1 | 6.5 | GO:0006910 | phagocytosis, recognition(GO:0006910) |
| 0.1 | 0.2 | GO:0022007 | neural plate elongation(GO:0014022) convergent extension involved in neural plate elongation(GO:0022007) |
| 0.1 | 1.3 | GO:0019371 | cyclooxygenase pathway(GO:0019371) |
| 0.1 | 0.3 | GO:0001880 | Mullerian duct regression(GO:0001880) |
| 0.0 | 0.3 | GO:0034227 | tRNA thio-modification(GO:0034227) |
| 0.0 | 0.3 | GO:0055014 | atrial cardiac muscle cell differentiation(GO:0055011) atrial cardiac muscle cell development(GO:0055014) |
| 0.0 | 0.2 | GO:0048496 | maintenance of organ identity(GO:0048496) |
| 0.0 | 0.2 | GO:1902463 | protein localization to cell leading edge(GO:1902463) |
| 0.0 | 0.5 | GO:0071492 | cellular response to UV-A(GO:0071492) |
| 0.0 | 0.2 | GO:0019509 | L-methionine biosynthetic process from methylthioadenosine(GO:0019509) |
| 0.0 | 0.6 | GO:0032625 | interleukin-21 production(GO:0032625) interleukin-21 secretion(GO:0072619) |
| 0.0 | 0.1 | GO:2001287 | negative regulation of caveolin-mediated endocytosis(GO:2001287) |
| 0.0 | 0.8 | GO:1902894 | negative regulation of pri-miRNA transcription from RNA polymerase II promoter(GO:1902894) |
| 0.0 | 0.7 | GO:0000028 | ribosomal small subunit assembly(GO:0000028) |
| 0.0 | 0.1 | GO:0097368 | establishment of Sertoli cell barrier(GO:0097368) |
| 0.0 | 0.5 | GO:0090110 | cargo loading into COPII-coated vesicle(GO:0090110) |
| 0.0 | 0.7 | GO:0046341 | CDP-diacylglycerol metabolic process(GO:0046341) |
| 0.0 | 0.3 | GO:0071287 | cellular response to magnesium ion(GO:0071286) cellular response to manganese ion(GO:0071287) |
| 0.0 | 0.7 | GO:0097094 | craniofacial suture morphogenesis(GO:0097094) |
| 0.0 | 0.3 | GO:0000244 | spliceosomal tri-snRNP complex assembly(GO:0000244) |
| 0.0 | 1.4 | GO:0050873 | brown fat cell differentiation(GO:0050873) |
| 0.0 | 0.6 | GO:0043485 | endosome to melanosome transport(GO:0035646) endosome to pigment granule transport(GO:0043485) pigment granule maturation(GO:0048757) |
| 0.0 | 0.1 | GO:1904578 | response to thapsigargin(GO:1904578) cellular response to thapsigargin(GO:1904579) |
| 0.0 | 0.3 | GO:0001833 | inner cell mass cell proliferation(GO:0001833) |
| 0.0 | 0.6 | GO:1904776 | regulation of protein localization to cell cortex(GO:1904776) positive regulation of protein localization to cell cortex(GO:1904778) |
| 0.0 | 0.1 | GO:0033489 | cholesterol biosynthetic process via desmosterol(GO:0033489) cholesterol biosynthetic process via lathosterol(GO:0033490) |
| 0.0 | 2.2 | GO:0002181 | cytoplasmic translation(GO:0002181) |
| 0.0 | 0.2 | GO:0002441 | histamine production involved in inflammatory response(GO:0002349) histamine secretion involved in inflammatory response(GO:0002441) histamine secretion by mast cell(GO:0002553) |
| 0.0 | 0.5 | GO:0031581 | hemidesmosome assembly(GO:0031581) |
| 0.0 | 1.9 | GO:0030574 | collagen catabolic process(GO:0030574) |
| 0.0 | 0.2 | GO:0086024 | adrenergic receptor signaling pathway involved in positive regulation of heart rate(GO:0086024) |
| 0.0 | 1.0 | GO:0007080 | mitotic metaphase plate congression(GO:0007080) |
| 0.0 | 0.9 | GO:0048265 | response to pain(GO:0048265) |
| 0.0 | 0.3 | GO:0046069 | cGMP catabolic process(GO:0046069) |
| 0.0 | 1.0 | GO:0036297 | interstrand cross-link repair(GO:0036297) |
| 0.0 | 0.4 | GO:0007398 | ectoderm development(GO:0007398) |
Gene overrepresentation in cellular component category:
| Log-likelihood per target | Total log-likelihood | Term | Description |
|---|---|---|---|
| 0.2 | 1.4 | GO:0034673 | inhibin-betaglycan-ActRII complex(GO:0034673) |
| 0.1 | 2.1 | GO:0098651 | basement membrane collagen trimer(GO:0098651) |
| 0.1 | 6.5 | GO:0042571 | immunoglobulin complex, circulating(GO:0042571) |
| 0.1 | 0.5 | GO:0031510 | SUMO activating enzyme complex(GO:0031510) |
| 0.1 | 0.3 | GO:1990923 | PET complex(GO:1990923) |
| 0.1 | 0.4 | GO:0005944 | phosphatidylinositol 3-kinase complex, class IB(GO:0005944) |
| 0.1 | 0.5 | GO:0070022 | transforming growth factor beta receptor homodimeric complex(GO:0070022) |
| 0.1 | 0.2 | GO:1990696 | stereocilia ankle link(GO:0002141) USH2 complex(GO:1990696) |
| 0.1 | 0.9 | GO:0043240 | Fanconi anaemia nuclear complex(GO:0043240) |
| 0.0 | 0.4 | GO:0016012 | sarcoglycan complex(GO:0016012) |
| 0.0 | 0.5 | GO:0005610 | laminin-5 complex(GO:0005610) |
| 0.0 | 0.8 | GO:0042613 | MHC class II protein complex(GO:0042613) |
| 0.0 | 1.2 | GO:0032982 | myosin filament(GO:0032982) |
| 0.0 | 0.6 | GO:0034464 | BBSome(GO:0034464) |
| 0.0 | 0.9 | GO:0005922 | connexon complex(GO:0005922) |
| 0.0 | 0.3 | GO:0071986 | Ragulator complex(GO:0071986) |
| 0.0 | 0.6 | GO:0008091 | spectrin(GO:0008091) |
| 0.0 | 0.5 | GO:0030127 | COPII vesicle coat(GO:0030127) |
| 0.0 | 0.3 | GO:0033269 | internode region of axon(GO:0033269) |
| 0.0 | 0.6 | GO:0043220 | paranode region of axon(GO:0033270) Schmidt-Lanterman incisure(GO:0043220) |
| 0.0 | 0.5 | GO:0000164 | protein phosphatase type 1 complex(GO:0000164) |
| 0.0 | 1.6 | GO:0022627 | cytosolic small ribosomal subunit(GO:0022627) |
| 0.0 | 0.2 | GO:0042719 | mitochondrial intermembrane space protein transporter complex(GO:0042719) |
| 0.0 | 0.3 | GO:0030914 | STAGA complex(GO:0030914) |
| 0.0 | 0.2 | GO:0001940 | male pronucleus(GO:0001940) |
| 0.0 | 0.1 | GO:0097209 | epidermal lamellar body(GO:0097209) |
| 0.0 | 0.2 | GO:0005686 | U2 snRNP(GO:0005686) |
| 0.0 | 1.6 | GO:0022625 | cytosolic large ribosomal subunit(GO:0022625) |
| 0.0 | 0.2 | GO:0017119 | Golgi transport complex(GO:0017119) |
| 0.0 | 0.3 | GO:0046540 | U4/U6 x U5 tri-snRNP complex(GO:0046540) |
| 0.0 | 0.1 | GO:0000799 | nuclear condensin complex(GO:0000799) |
Gene overrepresentation in molecular function category:
| Log-likelihood per target | Total log-likelihood | Term | Description |
|---|---|---|---|
| 0.5 | 1.4 | GO:0070123 | transforming growth factor beta receptor activity, type III(GO:0070123) |
| 0.5 | 1.4 | GO:0031780 | corticotropin hormone receptor binding(GO:0031780) type 5 melanocortin receptor binding(GO:0031783) |
| 0.3 | 0.9 | GO:0033878 | hormone-sensitive lipase activity(GO:0033878) |
| 0.3 | 1.4 | GO:0016262 | protein N-acetylglucosaminyltransferase activity(GO:0016262) |
| 0.3 | 1.3 | GO:0004666 | prostaglandin-endoperoxide synthase activity(GO:0004666) |
| 0.2 | 0.7 | GO:0097689 | iron channel activity(GO:0097689) |
| 0.2 | 1.2 | GO:0047374 | methylumbelliferyl-acetate deacetylase activity(GO:0047374) |
| 0.2 | 0.5 | GO:0019948 | SUMO activating enzyme activity(GO:0019948) |
| 0.1 | 0.8 | GO:0043120 | interleukin-8 binding(GO:0019959) tumor necrosis factor binding(GO:0043120) |
| 0.1 | 0.7 | GO:0004909 | interleukin-1, Type I, activating receptor activity(GO:0004909) |
| 0.1 | 6.5 | GO:0034987 | immunoglobulin receptor binding(GO:0034987) |
| 0.1 | 0.7 | GO:0004137 | deoxycytidine kinase activity(GO:0004137) thymidine kinase activity(GO:0004797) |
| 0.1 | 0.5 | GO:0071074 | eukaryotic initiation factor eIF2 binding(GO:0071074) |
| 0.1 | 0.3 | GO:0034584 | piRNA binding(GO:0034584) |
| 0.1 | 0.7 | GO:0017169 | CDP-alcohol phosphatidyltransferase activity(GO:0017169) |
| 0.1 | 0.2 | GO:0005139 | interleukin-7 receptor binding(GO:0005139) |
| 0.1 | 0.3 | GO:0016524 | latrotoxin receptor activity(GO:0016524) |
| 0.0 | 0.8 | GO:0032395 | MHC class II receptor activity(GO:0032395) |
| 0.0 | 0.6 | GO:0042731 | PH domain binding(GO:0042731) |
| 0.0 | 0.1 | GO:0004492 | methylmalonyl-CoA decarboxylase activity(GO:0004492) |
| 0.0 | 2.5 | GO:0001205 | transcriptional activator activity, RNA polymerase II distal enhancer sequence-specific binding(GO:0001205) |
| 0.0 | 0.6 | GO:0019911 | structural constituent of myelin sheath(GO:0019911) |
| 0.0 | 0.1 | GO:0017159 | pantetheine hydrolase activity(GO:0017159) |
| 0.0 | 0.3 | GO:0030618 | transforming growth factor beta receptor, pathway-specific cytoplasmic mediator activity(GO:0030618) |
| 0.0 | 0.4 | GO:0046935 | 1-phosphatidylinositol-3-kinase regulator activity(GO:0046935) |
| 0.0 | 0.2 | GO:0031730 | CCR5 chemokine receptor binding(GO:0031730) |
| 0.0 | 0.1 | GO:0004773 | steryl-sulfatase activity(GO:0004773) |
| 0.0 | 0.2 | GO:0004645 | phosphorylase activity(GO:0004645) |
| 0.0 | 0.2 | GO:0010859 | calcium-dependent cysteine-type endopeptidase inhibitor activity(GO:0010859) |
| 0.0 | 0.5 | GO:0098748 | clathrin adaptor activity(GO:0035615) endocytic adaptor activity(GO:0098748) |
| 0.0 | 3.3 | GO:0005518 | collagen binding(GO:0005518) |
| 0.0 | 0.1 | GO:0003960 | NADPH:quinone reductase activity(GO:0003960) |
| 0.0 | 0.5 | GO:0005003 | ephrin receptor activity(GO:0005003) |
| 0.0 | 0.5 | GO:0043325 | phosphatidylinositol-3,4-bisphosphate binding(GO:0043325) |
| 0.0 | 0.8 | GO:0032266 | phosphatidylinositol-3-phosphate binding(GO:0032266) |
| 0.0 | 0.2 | GO:0008142 | oxysterol binding(GO:0008142) |
| 0.0 | 3.2 | GO:0003735 | structural constituent of ribosome(GO:0003735) |
| 0.0 | 2.1 | GO:0016811 | hydrolase activity, acting on carbon-nitrogen (but not peptide) bonds, in linear amides(GO:0016811) |
| 0.0 | 0.4 | GO:0047555 | 3',5'-cyclic-GMP phosphodiesterase activity(GO:0047555) |
| 0.0 | 0.0 | GO:0072545 | tyrosine binding(GO:0072545) |
| 0.0 | 0.4 | GO:0005184 | neuropeptide hormone activity(GO:0005184) |
Gene overrepresentation in curated gene sets: canonical pathways category:
| Log-likelihood per target | Total log-likelihood | Term | Description |
|---|---|---|---|
| 0.0 | 3.1 | NABA PROTEOGLYCANS | Genes encoding proteoglycans |
| 0.0 | 1.2 | SA PROGRAMMED CELL DEATH | Programmed cell death, or apoptosis, eliminates damaged or unneeded cells. |
| 0.0 | 2.8 | NABA BASEMENT MEMBRANES | Genes encoding structural components of basement membranes |
| 0.0 | 2.4 | PID AR TF PATHWAY | Regulation of Androgen receptor activity |
| 0.0 | 1.5 | ST JNK MAPK PATHWAY | JNK MAPK Pathway |
| 0.0 | 0.8 | PID MYC PATHWAY | C-MYC pathway |
| 0.0 | 0.9 | PID BARD1 PATHWAY | BARD1 signaling events |
| 0.0 | 1.9 | PID TGFBR PATHWAY | TGF-beta receptor signaling |
| 0.0 | 0.3 | PID ALK2 PATHWAY | ALK2 signaling events |
| 0.0 | 0.9 | PID EPHA FWDPATHWAY | EPHA forward signaling |
| 0.0 | 0.8 | PID IL6 7 PATHWAY | IL6-mediated signaling events |
| 0.0 | 1.3 | PID TRKR PATHWAY | Neurotrophic factor-mediated Trk receptor signaling |
| 0.0 | 0.5 | PID NEPHRIN NEPH1 PATHWAY | Nephrin/Neph1 signaling in the kidney podocyte |
Gene overrepresentation in curated gene sets: REACTOME pathways category:
| Log-likelihood per target | Total log-likelihood | Term | Description |
|---|---|---|---|
| 0.1 | 2.1 | REACTOME REGULATION OF INSULIN LIKE GROWTH FACTOR IGF ACTIVITY BY INSULIN LIKE GROWTH FACTOR BINDING PROTEINS IGFBPS | Genes involved in Regulation of Insulin-like Growth Factor (IGF) Activity by Insulin-like Growth Factor Binding Proteins (IGFBPs) |
| 0.0 | 0.8 | REACTOME HDL MEDIATED LIPID TRANSPORT | Genes involved in HDL-mediated lipid transport |
| 0.0 | 0.9 | REACTOME GAP JUNCTION ASSEMBLY | Genes involved in Gap junction assembly |
| 0.0 | 0.6 | REACTOME NEF MEDIATED DOWNREGULATION OF MHC CLASS I COMPLEX CELL SURFACE EXPRESSION | Genes involved in Nef mediated downregulation of MHC class I complex cell surface expression |
| 0.0 | 0.9 | REACTOME FANCONI ANEMIA PATHWAY | Genes involved in Fanconi Anemia pathway |
| 0.0 | 1.2 | REACTOME SEMA4D INDUCED CELL MIGRATION AND GROWTH CONE COLLAPSE | Genes involved in Sema4D induced cell migration and growth-cone collapse |
| 0.0 | 0.9 | REACTOME HORMONE SENSITIVE LIPASE HSL MEDIATED TRIACYLGLYCEROL HYDROLYSIS | Genes involved in Hormone-sensitive lipase (HSL)-mediated triacylglycerol hydrolysis |
| 0.0 | 1.0 | REACTOME KINESINS | Genes involved in Kinesins |
| 0.0 | 3.2 | REACTOME PEPTIDE CHAIN ELONGATION | Genes involved in Peptide chain elongation |
| 0.0 | 0.5 | REACTOME GAP JUNCTION TRAFFICKING | Genes involved in Gap junction trafficking |
| 0.0 | 0.7 | REACTOME G1 S SPECIFIC TRANSCRIPTION | Genes involved in G1/S-Specific Transcription |
| 0.0 | 1.9 | REACTOME COLLAGEN FORMATION | Genes involved in Collagen formation |
| 0.0 | 0.8 | REACTOME GLUTAMATE NEUROTRANSMITTER RELEASE CYCLE | Genes involved in Glutamate Neurotransmitter Release Cycle |
| 0.0 | 0.5 | REACTOME ANTIGEN PRESENTATION FOLDING ASSEMBLY AND PEPTIDE LOADING OF CLASS I MHC | Genes involved in Antigen Presentation: Folding, assembly and peptide loading of class I MHC |
| 0.0 | 0.8 | REACTOME TIGHT JUNCTION INTERACTIONS | Genes involved in Tight junction interactions |
| 0.0 | 0.5 | REACTOME ACTIVATION OF RAC | Genes involved in Activation of Rac |
| 0.0 | 0.1 | REACTOME INFLUENZA VIRAL RNA TRANSCRIPTION AND REPLICATION | Genes involved in Influenza Viral RNA Transcription and Replication |
| 0.0 | 0.5 | REACTOME METAL ION SLC TRANSPORTERS | Genes involved in Metal ion SLC transporters |