Project
Illumina Body Map 2 (GSE30611)
Navigation
Downloads
Results for OTX2_CRX
Z-value: 0.85
Motif logo
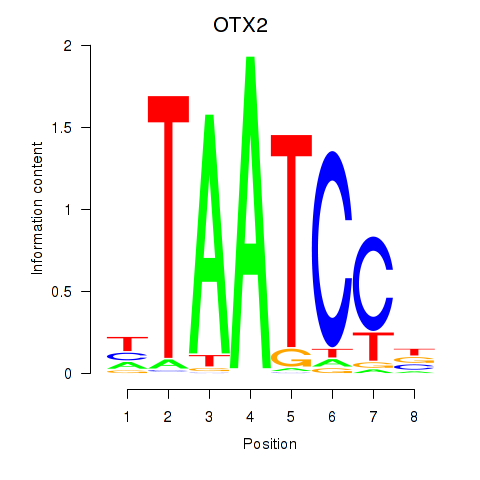
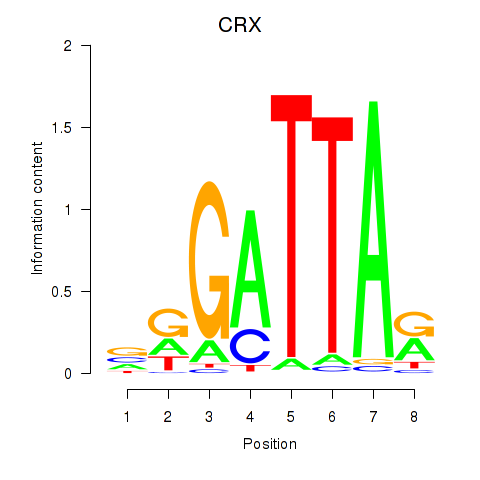
Transcription factors associated with OTX2_CRX
| Gene Symbol | Gene ID | Gene Info |
|---|---|---|
|
OTX2
|
ENSG00000165588.18 | orthodenticle homeobox 2 |
|
CRX
|
ENSG00000105392.16 | cone-rod homeobox |
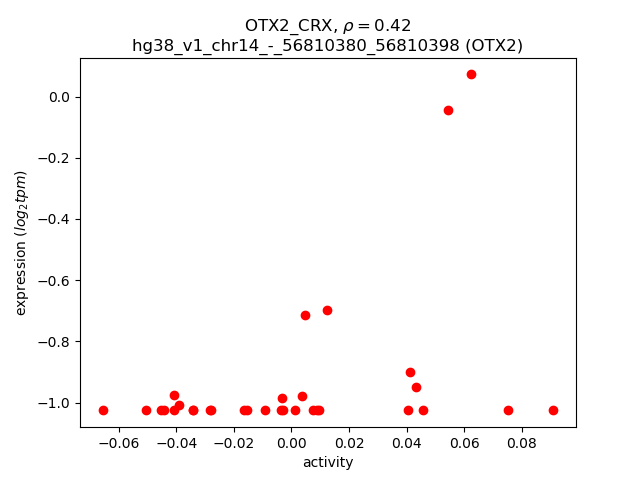
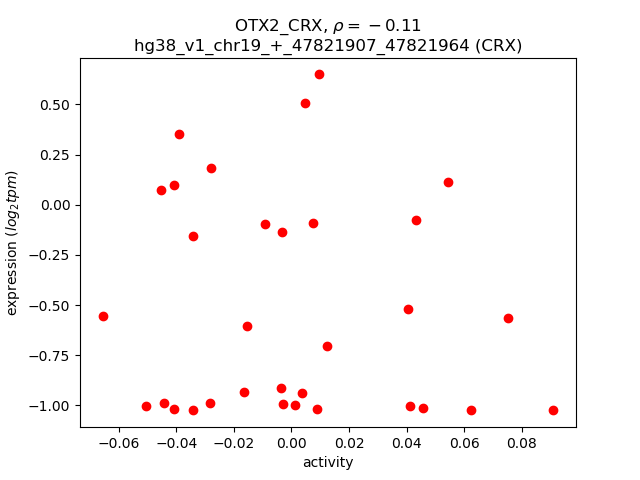
Activity-expression correlation:
| Gene | Promoter | Pearson corr. coef. | P-value | Plot |
|---|---|---|---|---|
| OTX2 | hg38_v1_chr14_-_56810380_56810398 | 0.42 | 1.8e-02 | Click! |
| CRX | hg38_v1_chr19_+_47821907_47821964 | -0.11 | 5.5e-01 | Click! |
Activity profile of OTX2_CRX motif
Sorted Z-values of OTX2_CRX motif
| Promoter | Log-likelihood | Transcript | Gene | Gene Info |
|---|---|---|---|---|
| chr18_+_34710249 | 4.91 |
ENST00000680346.1
ENST00000348997.9 ENST00000681274.1 ENST00000680822.1 ENST00000680767.2 ENST00000597599.5 ENST00000444659.6 |
DTNA
|
dystrobrevin alpha |
| chr7_+_74453790 | 3.06 |
ENST00000265755.7
ENST00000424337.7 ENST00000455841.6 |
GTF2IRD1
|
GTF2I repeat domain containing 1 |
| chr2_+_219491867 | 2.87 |
ENST00000412982.5
|
ENSG00000286143.1
|
novel protein |
| chrX_-_21658324 | 2.72 |
ENST00000379499.3
|
KLHL34
|
kelch like family member 34 |
| chr2_+_169509693 | 2.42 |
ENST00000284669.2
|
KLHL41
|
kelch like family member 41 |
| chr15_+_86079863 | 2.41 |
ENST00000614907.3
ENST00000441037.7 |
AGBL1
|
ATP/GTP binding protein like 1 |
| chr5_-_150289764 | 2.21 |
ENST00000671881.1
ENST00000672752.1 ENST00000510347.2 ENST00000672829.1 ENST00000348628.11 |
CAMK2A
|
calcium/calmodulin dependent protein kinase II alpha |
| chr7_+_123655857 | 2.11 |
ENST00000458573.3
ENST00000456238.2 |
LMOD2
|
leiomodin 2 |
| chr5_-_88883147 | 2.04 |
ENST00000513252.5
ENST00000506554.5 ENST00000508569.5 ENST00000637732.1 ENST00000504921.7 ENST00000637481.1 ENST00000510942.5 |
MEF2C
|
myocyte enhancer factor 2C |
| chr5_-_150289625 | 2.00 |
ENST00000683332.1
ENST00000398376.8 ENST00000672785.1 ENST00000672396.1 |
CAMK2A
|
calcium/calmodulin dependent protein kinase II alpha |
| chr3_-_179974078 | 1.90 |
ENST00000464614.5
ENST00000476138.5 ENST00000463761.1 |
PEX5L
|
peroxisomal biogenesis factor 5 like |
| chr12_+_80707625 | 1.83 |
ENST00000228641.4
|
MYF6
|
myogenic factor 6 |
| chr18_+_34710307 | 1.82 |
ENST00000679796.1
|
DTNA
|
dystrobrevin alpha |
| chr10_-_114658268 | 1.70 |
ENST00000649363.1
ENST00000277895.9 |
ABLIM1
|
actin binding LIM protein 1 |
| chr6_-_139291987 | 1.65 |
ENST00000358430.8
|
TXLNB
|
taxilin beta |
| chr6_+_34466059 | 1.65 |
ENST00000620693.4
ENST00000244458.7 ENST00000374043.6 |
PACSIN1
|
protein kinase C and casein kinase substrate in neurons 1 |
| chr5_-_88883199 | 1.64 |
ENST00000514015.5
ENST00000503075.1 |
MEF2C
|
myocyte enhancer factor 2C |
| chr2_-_174846405 | 1.60 |
ENST00000409597.5
ENST00000413882.6 |
CHN1
|
chimerin 1 |
| chr3_+_50611871 | 1.53 |
ENST00000446044.5
|
MAPKAPK3
|
MAPK activated protein kinase 3 |
| chr15_-_26939518 | 1.50 |
ENST00000541819.6
|
GABRB3
|
gamma-aminobutyric acid type A receptor subunit beta3 |
| chr10_-_75109172 | 1.48 |
ENST00000372700.7
ENST00000473072.2 ENST00000491677.6 ENST00000372702.7 |
DUSP13
|
dual specificity phosphatase 13 |
| chrX_+_136197020 | 1.47 |
ENST00000370676.7
|
FHL1
|
four and a half LIM domains 1 |
| chr5_-_88883420 | 1.47 |
ENST00000437473.6
|
MEF2C
|
myocyte enhancer factor 2C |
| chr1_-_165445088 | 1.41 |
ENST00000359842.10
|
RXRG
|
retinoid X receptor gamma |
| chr22_-_37984534 | 1.39 |
ENST00000396884.8
|
SOX10
|
SRY-box transcription factor 10 |
| chr2_+_218607914 | 1.34 |
ENST00000417849.5
|
PLCD4
|
phospholipase C delta 4 |
| chr1_+_202462730 | 1.30 |
ENST00000290419.9
ENST00000491336.5 |
PPP1R12B
|
protein phosphatase 1 regulatory subunit 12B |
| chrX_-_15600953 | 1.27 |
ENST00000679212.1
ENST00000679278.1 ENST00000678046.1 ENST00000252519.8 |
ACE2
|
angiotensin I converting enzyme 2 |
| chr6_-_42722590 | 1.26 |
ENST00000230381.7
|
PRPH2
|
peripherin 2 |
| chr3_-_179974254 | 1.26 |
ENST00000468741.5
|
PEX5L
|
peroxisomal biogenesis factor 5 like |
| chr11_-_72041945 | 1.25 |
ENST00000543009.5
|
NUMA1
|
nuclear mitotic apparatus protein 1 |
| chr1_+_18630839 | 1.23 |
ENST00000420770.7
|
PAX7
|
paired box 7 |
| chr18_-_24311495 | 1.22 |
ENST00000357041.8
|
OSBPL1A
|
oxysterol binding protein like 1A |
| chr2_-_174847015 | 1.21 |
ENST00000650938.1
|
CHN1
|
chimerin 1 |
| chr18_-_66604076 | 1.19 |
ENST00000540086.5
ENST00000580157.2 ENST00000262150.7 |
CDH19
|
cadherin 19 |
| chr5_-_150289941 | 1.18 |
ENST00000682786.1
|
CAMK2A
|
calcium/calmodulin dependent protein kinase II alpha |
| chr11_-_111923722 | 1.17 |
ENST00000527950.5
|
CRYAB
|
crystallin alpha B |
| chrX_-_15601077 | 1.13 |
ENST00000680121.1
|
ACE2
|
angiotensin I converting enzyme 2 |
| chr10_+_17951906 | 1.13 |
ENST00000377371.3
ENST00000377369.7 |
SLC39A12
|
solute carrier family 39 member 12 |
| chr5_+_162067458 | 1.07 |
ENST00000639975.1
ENST00000639111.2 ENST00000639683.1 |
GABRG2
|
gamma-aminobutyric acid type A receptor subunit gamma2 |
| chr6_-_154247630 | 1.07 |
ENST00000519344.5
|
IPCEF1
|
interaction protein for cytohesin exchange factors 1 |
| chr10_-_75109085 | 1.06 |
ENST00000607131.5
|
DUSP13
|
dual specificity phosphatase 13 |
| chr10_+_17951825 | 1.04 |
ENST00000539911.5
|
SLC39A12
|
solute carrier family 39 member 12 |
| chrX_+_136197039 | 1.04 |
ENST00000370683.6
|
FHL1
|
four and a half LIM domains 1 |
| chr14_-_93955258 | 1.04 |
ENST00000556062.5
|
ASB2
|
ankyrin repeat and SOCS box containing 2 |
| chr4_-_110636963 | 1.03 |
ENST00000394595.8
|
PITX2
|
paired like homeodomain 2 |
| chr9_+_100442271 | 1.03 |
ENST00000502978.1
|
MSANTD3-TMEFF1
|
MSANTD3-TMEFF1 readthrough |
| chr5_-_41794211 | 1.02 |
ENST00000512084.5
|
OXCT1
|
3-oxoacid CoA-transferase 1 |
| chr11_-_72041522 | 1.01 |
ENST00000544238.5
|
NUMA1
|
nuclear mitotic apparatus protein 1 |
| chr5_-_88883701 | 1.00 |
ENST00000636998.1
|
MEF2C
|
myocyte enhancer factor 2C |
| chr7_+_123601815 | 1.00 |
ENST00000451215.6
|
ASB15
|
ankyrin repeat and SOCS box containing 15 |
| chr5_-_150290093 | 1.00 |
ENST00000672479.1
|
CAMK2A
|
calcium/calmodulin dependent protein kinase II alpha |
| chr1_-_201112420 | 0.99 |
ENST00000362061.4
ENST00000681874.1 |
CACNA1S
|
calcium voltage-gated channel subunit alpha1 S |
| chr10_+_17951885 | 0.98 |
ENST00000377374.8
|
SLC39A12
|
solute carrier family 39 member 12 |
| chr4_-_101346842 | 0.98 |
ENST00000507176.5
|
PPP3CA
|
protein phosphatase 3 catalytic subunit alpha |
| chr13_+_35476740 | 0.96 |
ENST00000537702.5
|
NBEA
|
neurobeachin |
| chr2_+_218607861 | 0.95 |
ENST00000450993.7
|
PLCD4
|
phospholipase C delta 4 |
| chr1_-_165445220 | 0.95 |
ENST00000619224.1
|
RXRG
|
retinoid X receptor gamma |
| chr7_+_123601836 | 0.95 |
ENST00000434204.5
|
ASB15
|
ankyrin repeat and SOCS box containing 15 |
| chr11_-_111912871 | 0.94 |
ENST00000528628.5
|
CRYAB
|
crystallin alpha B |
| chr15_+_33310946 | 0.94 |
ENST00000415757.7
ENST00000634891.2 ENST00000389232.9 ENST00000622037.1 |
RYR3
|
ryanodine receptor 3 |
| chrX_+_136196750 | 0.92 |
ENST00000539015.5
|
FHL1
|
four and a half LIM domains 1 |
| chr12_-_54981838 | 0.91 |
ENST00000316577.12
|
TESPA1
|
thymocyte expressed, positive selection associated 1 |
| chr1_+_244051275 | 0.91 |
ENST00000358704.4
|
ZBTB18
|
zinc finger and BTB domain containing 18 |
| chr8_+_53851786 | 0.90 |
ENST00000297313.8
ENST00000344277.10 |
RGS20
|
regulator of G protein signaling 20 |
| chr13_-_61427849 | 0.89 |
ENST00000409186.1
ENST00000472649.2 |
ENSG00000197991.11
LINC02339
|
novel protein long intergenic non-protein coding RNA 2339 |
| chr5_+_162067764 | 0.88 |
ENST00000639213.2
ENST00000414552.6 |
GABRG2
|
gamma-aminobutyric acid type A receptor subunit gamma2 |
| chr4_-_101347551 | 0.87 |
ENST00000525819.1
|
PPP3CA
|
protein phosphatase 3 catalytic subunit alpha |
| chr3_+_49021071 | 0.87 |
ENST00000395458.6
|
NDUFAF3
|
NADH:ubiquinone oxidoreductase complex assembly factor 3 |
| chr1_-_117121692 | 0.85 |
ENST00000256649.9
ENST00000369464.7 ENST00000485032.1 |
TRIM45
|
tripartite motif containing 45 |
| chrM_+_8366 | 0.85 |
ENST00000361851.1
|
MT-ATP8
|
mitochondrially encoded ATP synthase membrane subunit 8 |
| chr11_-_72041792 | 0.84 |
ENST00000537930.5
|
NUMA1
|
nuclear mitotic apparatus protein 1 |
| chr5_-_150758497 | 0.84 |
ENST00000521533.1
ENST00000424236.5 |
DCTN4
|
dynactin subunit 4 |
| chr7_+_30145789 | 0.84 |
ENST00000324489.5
|
MTURN
|
maturin, neural progenitor differentiation regulator homolog |
| chr7_-_33040893 | 0.83 |
ENST00000643244.1
ENST00000409467.6 ENST00000449201.5 |
NT5C3A
|
5'-nucleotidase, cytosolic IIIA |
| chr10_+_94089067 | 0.80 |
ENST00000371375.1
ENST00000675218.1 |
PLCE1
|
phospholipase C epsilon 1 |
| chr5_-_96433214 | 0.79 |
ENST00000311106.8
|
PCSK1
|
proprotein convertase subtilisin/kexin type 1 |
| chr10_+_94089034 | 0.79 |
ENST00000676102.1
ENST00000371385.8 |
PLCE1
|
phospholipase C epsilon 1 |
| chrX_-_32412220 | 0.78 |
ENST00000619831.5
|
DMD
|
dystrophin |
| chr9_+_34992849 | 0.78 |
ENST00000443266.2
|
DNAJB5
|
DnaJ heat shock protein family (Hsp40) member B5 |
| chr13_-_35476682 | 0.78 |
ENST00000379919.6
|
MAB21L1
|
mab-21 like 1 |
| chr5_-_88824334 | 0.77 |
ENST00000506716.5
|
MEF2C
|
myocyte enhancer factor 2C |
| chr7_+_123601859 | 0.73 |
ENST00000437535.5
|
ASB15
|
ankyrin repeat and SOCS box containing 15 |
| chr12_+_40393392 | 0.72 |
ENST00000676020.1
|
MUC19
|
mucin 19, oligomeric |
| chr10_-_75109106 | 0.68 |
ENST00000607487.5
|
DUSP13
|
dual specificity phosphatase 13 |
| chr14_-_100568070 | 0.65 |
ENST00000557378.6
ENST00000443071.6 ENST00000637646.1 |
BEGAIN
|
brain enriched guanylate kinase associated |
| chr5_+_150660841 | 0.61 |
ENST00000297130.4
|
MYOZ3
|
myozenin 3 |
| chr8_-_42502496 | 0.61 |
ENST00000522707.1
|
SLC20A2
|
solute carrier family 20 member 2 |
| chr18_-_72865680 | 0.61 |
ENST00000397929.5
|
NETO1
|
neuropilin and tolloid like 1 |
| chr3_+_69866217 | 0.61 |
ENST00000314589.10
|
MITF
|
melanocyte inducing transcription factor |
| chr5_-_24644968 | 0.60 |
ENST00000264463.8
|
CDH10
|
cadherin 10 |
| chr2_-_224497816 | 0.60 |
ENST00000451538.1
|
CUL3
|
cullin 3 |
| chrM_+_8489 | 0.59 |
ENST00000361899.2
|
MT-ATP6
|
mitochondrially encoded ATP synthase membrane subunit 6 |
| chr5_+_102864505 | 0.58 |
ENST00000511839.5
|
PAM
|
peptidylglycine alpha-amidating monooxygenase |
| chr10_+_24239181 | 0.57 |
ENST00000438429.5
|
KIAA1217
|
KIAA1217 |
| chr1_+_159171607 | 0.57 |
ENST00000368124.8
ENST00000368125.9 ENST00000416746.1 |
CADM3
|
cell adhesion molecule 3 |
| chrX_+_28587411 | 0.56 |
ENST00000378993.6
|
IL1RAPL1
|
interleukin 1 receptor accessory protein like 1 |
| chr17_-_45132505 | 0.55 |
ENST00000619929.5
|
PLCD3
|
phospholipase C delta 3 |
| chr3_+_69866236 | 0.54 |
ENST00000451708.5
|
MITF
|
melanocyte inducing transcription factor |
| chr12_-_14696571 | 0.54 |
ENST00000261170.5
|
GUCY2C
|
guanylate cyclase 2C |
| chr5_-_88824266 | 0.53 |
ENST00000509373.1
ENST00000636541.1 |
MEF2C
|
myocyte enhancer factor 2C |
| chr7_+_136869077 | 0.52 |
ENST00000320658.9
ENST00000453373.5 ENST00000401861.1 |
CHRM2
|
cholinergic receptor muscarinic 2 |
| chr10_-_67696115 | 0.51 |
ENST00000433211.7
|
CTNNA3
|
catenin alpha 3 |
| chr9_+_12693327 | 0.51 |
ENST00000388918.10
|
TYRP1
|
tyrosinase related protein 1 |
| chr4_-_101347327 | 0.50 |
ENST00000394853.8
|
PPP3CA
|
protein phosphatase 3 catalytic subunit alpha |
| chr8_+_103880412 | 0.49 |
ENST00000436393.6
|
RIMS2
|
regulating synaptic membrane exocytosis 2 |
| chr16_-_57971121 | 0.49 |
ENST00000251102.13
|
CNGB1
|
cyclic nucleotide gated channel subunit beta 1 |
| chr11_-_41459592 | 0.48 |
ENST00000528697.6
ENST00000530763.5 |
LRRC4C
|
leucine rich repeat containing 4C |
| chr21_-_18403754 | 0.48 |
ENST00000284885.8
|
TMPRSS15
|
transmembrane serine protease 15 |
| chr11_-_72041054 | 0.47 |
ENST00000542977.5
|
NUMA1
|
nuclear mitotic apparatus protein 1 |
| chr2_+_161624406 | 0.47 |
ENST00000446997.6
ENST00000272716.9 |
SLC4A10
|
solute carrier family 4 member 10 |
| chr7_+_28412511 | 0.47 |
ENST00000357727.7
|
CREB5
|
cAMP responsive element binding protein 5 |
| chr18_-_43277482 | 0.46 |
ENST00000255224.8
ENST00000590752.5 ENST00000596867.1 |
SYT4
|
synaptotagmin 4 |
| chr18_-_37565628 | 0.45 |
ENST00000334919.9
ENST00000591282.5 ENST00000588597.5 |
CELF4
|
CUGBP Elav-like family member 4 |
| chr9_-_28670285 | 0.45 |
ENST00000379992.6
ENST00000308675.5 ENST00000613945.3 |
LINGO2
|
leucine rich repeat and Ig domain containing 2 |
| chr11_-_72040694 | 0.45 |
ENST00000535947.5
|
NUMA1
|
nuclear mitotic apparatus protein 1 |
| chr5_-_11589019 | 0.45 |
ENST00000511377.5
|
CTNND2
|
catenin delta 2 |
| chr18_-_37565714 | 0.45 |
ENST00000591287.5
ENST00000601019.5 ENST00000601392.5 |
CELF4
|
CUGBP Elav-like family member 4 |
| chr10_-_114632011 | 0.44 |
ENST00000651023.1
|
ABLIM1
|
actin binding LIM protein 1 |
| chr14_-_22926413 | 0.44 |
ENST00000556043.5
|
PRMT5
|
protein arginine methyltransferase 5 |
| chr5_+_162067500 | 0.44 |
ENST00000639384.1
ENST00000640985.1 ENST00000638772.1 |
GABRG2
|
gamma-aminobutyric acid type A receptor subunit gamma2 |
| chr1_+_164559173 | 0.44 |
ENST00000420696.7
|
PBX1
|
PBX homeobox 1 |
| chr1_+_205257180 | 0.44 |
ENST00000330675.12
|
TMCC2
|
transmembrane and coiled-coil domain family 2 |
| chr10_+_50990864 | 0.44 |
ENST00000401604.8
|
PRKG1
|
protein kinase cGMP-dependent 1 |
| chr3_+_173584433 | 0.43 |
ENST00000361589.8
|
NLGN1
|
neuroligin 1 |
| chr5_-_11588842 | 0.43 |
ENST00000503622.5
|
CTNND2
|
catenin delta 2 |
| chr9_+_85941121 | 0.42 |
ENST00000361671.10
|
NAA35
|
N-alpha-acetyltransferase 35, NatC auxiliary subunit |
| chr2_-_212124901 | 0.42 |
ENST00000402597.6
|
ERBB4
|
erb-b2 receptor tyrosine kinase 4 |
| chr15_+_62758585 | 0.42 |
ENST00000472902.1
|
TLN2
|
talin 2 |
| chr1_+_164559766 | 0.42 |
ENST00000367897.5
ENST00000559240.5 |
PBX1
|
PBX homeobox 1 |
| chr10_-_125028061 | 0.42 |
ENST00000309035.11
|
CTBP2
|
C-terminal binding protein 2 |
| chr11_+_63681573 | 0.42 |
ENST00000354497.4
|
RTN3
|
reticulon 3 |
| chr11_-_47499757 | 0.42 |
ENST00000535982.1
|
CELF1
|
CUGBP Elav-like family member 1 |
| chr1_+_164559739 | 0.42 |
ENST00000627490.2
|
PBX1
|
PBX homeobox 1 |
| chr15_+_33310993 | 0.41 |
ENST00000634418.1
ENST00000634750.1 |
RYR3
|
ryanodine receptor 3 |
| chr10_-_84241538 | 0.41 |
ENST00000372105.4
|
LRIT1
|
leucine rich repeat, Ig-like and transmembrane domains 1 |
| chr2_+_56183973 | 0.41 |
ENST00000407595.3
|
CCDC85A
|
coiled-coil domain containing 85A |
| chr10_-_87818153 | 0.41 |
ENST00000308448.11
ENST00000680024.1 |
ATAD1
|
ATPase family AAA domain containing 1 |
| chr11_-_129024157 | 0.41 |
ENST00000392657.7
|
ARHGAP32
|
Rho GTPase activating protein 32 |
| chr17_-_45133213 | 0.38 |
ENST00000538093.1
ENST00000590644.5 |
PLCD3
|
phospholipase C delta 3 |
| chr6_-_83708713 | 0.38 |
ENST00000519825.5
ENST00000523484.6 |
SNAP91
|
synaptosome associated protein 91 |
| chr19_-_55354540 | 0.38 |
ENST00000590900.5
|
COX6B2
|
cytochrome c oxidase subunit 6B2 |
| chr12_-_13981957 | 0.38 |
ENST00000627535.2
ENST00000630791.2 |
GRIN2B
|
glutamate ionotropic receptor NMDA type subunit 2B |
| chr17_-_38343810 | 0.37 |
ENST00000621958.1
ENST00000616987.5 |
GPR179
|
G protein-coupled receptor 179 |
| chr19_-_43619591 | 0.37 |
ENST00000598676.1
ENST00000300811.8 |
ZNF428
|
zinc finger protein 428 |
| chr1_-_68449927 | 0.37 |
ENST00000262340.6
|
RPE65
|
retinoid isomerohydrolase RPE65 |
| chr15_+_43593054 | 0.36 |
ENST00000453782.5
ENST00000300283.10 ENST00000437924.5 |
CKMT1B
|
creatine kinase, mitochondrial 1B |
| chr3_+_49021605 | 0.35 |
ENST00000451378.2
|
NDUFAF3
|
NADH:ubiquinone oxidoreductase complex assembly factor 3 |
| chrX_-_33339525 | 0.35 |
ENST00000288447.9
|
DMD
|
dystrophin |
| chr12_-_13095664 | 0.35 |
ENST00000337630.10
ENST00000545699.1 |
GSG1
|
germ cell associated 1 |
| chr3_-_32570771 | 0.34 |
ENST00000273130.9
ENST00000432458.6 ENST00000424991.1 |
DYNC1LI1
|
dynein cytoplasmic 1 light intermediate chain 1 |
| chr14_+_23376786 | 0.34 |
ENST00000359320.7
|
CMTM5
|
CKLF like MARVEL transmembrane domain containing 5 |
| chr3_-_50567711 | 0.34 |
ENST00000357203.8
|
C3orf18
|
chromosome 3 open reading frame 18 |
| chr14_+_23376765 | 0.34 |
ENST00000649278.1
|
CMTM5
|
CKLF like MARVEL transmembrane domain containing 5 |
| chr12_-_86256299 | 0.33 |
ENST00000552808.6
ENST00000547225.5 |
MGAT4C
|
MGAT4 family member C |
| chr15_-_34318761 | 0.33 |
ENST00000290209.9
|
SLC12A6
|
solute carrier family 12 member 6 |
| chr4_+_153204410 | 0.33 |
ENST00000675838.1
ENST00000674967.1 ENST00000632856.2 ENST00000441616.6 ENST00000433687.2 ENST00000494872.6 ENST00000460908.2 ENST00000675780.1 ENST00000674976.1 ENST00000338700.10 ENST00000675293.1 ENST00000676172.1 ENST00000675673.1 ENST00000675492.1 ENST00000675425.1 ENST00000675384.1 ENST00000675063.1 ENST00000675340.1 ENST00000675835.1 ENST00000675054.1 ENST00000675710.1 ENST00000502281.3 |
ENSG00000288637.1
TRIM2
|
novel protein tripartite motif containing 2 |
| chr4_-_101347492 | 0.33 |
ENST00000394854.8
|
PPP3CA
|
protein phosphatase 3 catalytic subunit alpha |
| chr21_-_32727889 | 0.32 |
ENST00000630077.3
ENST00000674204.1 |
SYNJ1
|
synaptojanin 1 |
| chr5_+_173889337 | 0.32 |
ENST00000520867.5
ENST00000334035.9 |
CPEB4
|
cytoplasmic polyadenylation element binding protein 4 |
| chr1_-_101846957 | 0.31 |
ENST00000338858.9
|
OLFM3
|
olfactomedin 3 |
| chr5_+_138873990 | 0.31 |
ENST00000518381.5
|
CTNNA1
|
catenin alpha 1 |
| chr1_+_171970115 | 0.31 |
ENST00000523513.1
|
DNM3
|
dynamin 3 |
| chr11_-_30586866 | 0.31 |
ENST00000528686.2
|
MPPED2
|
metallophosphoesterase domain containing 2 |
| chr22_-_38084093 | 0.31 |
ENST00000681075.1
|
SLC16A8
|
solute carrier family 16 member 8 |
| chr12_+_14973020 | 0.31 |
ENST00000266395.3
|
PDE6H
|
phosphodiesterase 6H |
| chr15_-_34754989 | 0.31 |
ENST00000290374.5
|
GJD2
|
gap junction protein delta 2 |
| chr16_+_81238682 | 0.30 |
ENST00000258168.7
ENST00000564552.1 |
BCO1
|
beta-carotene oxygenase 1 |
| chr10_-_102418748 | 0.30 |
ENST00000020673.6
|
PSD
|
pleckstrin and Sec7 domain containing |
| chr8_-_113436883 | 0.30 |
ENST00000455883.2
ENST00000297405.10 |
CSMD3
|
CUB and Sushi multiple domains 3 |
| chr7_+_136868622 | 0.30 |
ENST00000680005.1
ENST00000445907.6 |
CHRM2
|
cholinergic receptor muscarinic 2 |
| chr10_-_59363176 | 0.30 |
ENST00000512919.5
|
FAM13C
|
family with sequence similarity 13 member C |
| chr10_-_125161019 | 0.30 |
ENST00000411419.6
|
CTBP2
|
C-terminal binding protein 2 |
| chr9_+_34179005 | 0.30 |
ENST00000625521.2
ENST00000379186.8 ENST00000297661.9 ENST00000626262.2 |
UBAP1
|
ubiquitin associated protein 1 |
| chr3_-_12987036 | 0.30 |
ENST00000618604.4
|
IQSEC1
|
IQ motif and Sec7 domain ArfGEF 1 |
| chr11_-_130314686 | 0.29 |
ENST00000525842.5
|
ZBTB44
|
zinc finger and BTB domain containing 44 |
| chr11_-_47176851 | 0.29 |
ENST00000629231.2
ENST00000526342.5 ENST00000528444.5 ENST00000530596.5 ENST00000525398.5 ENST00000524782.6 ENST00000527927.5 ENST00000525314.5 |
ARFGAP2
|
ADP ribosylation factor GTPase activating protein 2 |
| chr3_-_197226351 | 0.29 |
ENST00000656428.1
|
DLG1
|
discs large MAGUK scaffold protein 1 |
| chr3_-_98522514 | 0.29 |
ENST00000503004.5
ENST00000506575.1 ENST00000513452.5 ENST00000515620.5 |
CLDND1
|
claudin domain containing 1 |
| chr16_+_76277568 | 0.28 |
ENST00000622250.4
|
CNTNAP4
|
contactin associated protein family member 4 |
| chr9_-_35754256 | 0.28 |
ENST00000436428.3
|
MSMP
|
microseminoprotein, prostate associated |
| chr5_-_11588796 | 0.28 |
ENST00000513598.5
|
CTNND2
|
catenin delta 2 |
| chrX_+_12137409 | 0.28 |
ENST00000672010.1
|
FRMPD4
|
FERM and PDZ domain containing 4 |
| chr17_+_62458641 | 0.27 |
ENST00000582809.5
|
TLK2
|
tousled like kinase 2 |
| chr1_+_164559378 | 0.27 |
ENST00000340699.7
|
PBX1
|
PBX homeobox 1 |
| chr1_-_223845894 | 0.27 |
ENST00000391878.6
ENST00000343537.12 |
TP53BP2
|
tumor protein p53 binding protein 2 |
| chr16_+_57976435 | 0.27 |
ENST00000290871.10
ENST00000441824.4 |
TEPP
|
testis, prostate and placenta expressed |
| chr2_-_229923163 | 0.26 |
ENST00000435716.5
|
TRIP12
|
thyroid hormone receptor interactor 12 |
| chr12_-_49130113 | 0.26 |
ENST00000549870.5
|
TUBA1B
|
tubulin alpha 1b |
| chr11_+_67605488 | 0.26 |
ENST00000533876.1
ENST00000647561.1 |
ENSG00000255119.1
NDUFV1
|
novel transcript NADH:ubiquinone oxidoreductase core subunit V1 |
| chr6_+_12716554 | 0.26 |
ENST00000676159.1
|
PHACTR1
|
phosphatase and actin regulator 1 |
| chr19_+_39498938 | 0.25 |
ENST00000356433.10
ENST00000596614.5 ENST00000205143.4 |
DLL3
|
delta like canonical Notch ligand 3 |
| chr4_-_101347471 | 0.25 |
ENST00000323055.10
ENST00000512215.5 |
PPP3CA
|
protein phosphatase 3 catalytic subunit alpha |
| chr21_-_15002364 | 0.24 |
ENST00000411932.1
|
NRIP1
|
nuclear receptor interacting protein 1 |
| chr2_+_183078736 | 0.24 |
ENST00000354221.5
|
DUSP19
|
dual specificity phosphatase 19 |
| chr3_+_49022077 | 0.24 |
ENST00000326925.11
|
NDUFAF3
|
NADH:ubiquinone oxidoreductase complex assembly factor 3 |
| chr11_-_130314575 | 0.24 |
ENST00000397753.5
|
ZBTB44
|
zinc finger and BTB domain containing 44 |
| chr17_-_57745292 | 0.23 |
ENST00000299415.3
|
CCDC182
|
coiled-coil domain containing 182 |
| chr6_-_154247422 | 0.23 |
ENST00000519190.1
|
IPCEF1
|
interaction protein for cytohesin exchange factors 1 |
| chr5_-_41510623 | 0.23 |
ENST00000328457.5
|
PLCXD3
|
phosphatidylinositol specific phospholipase C X domain containing 3 |
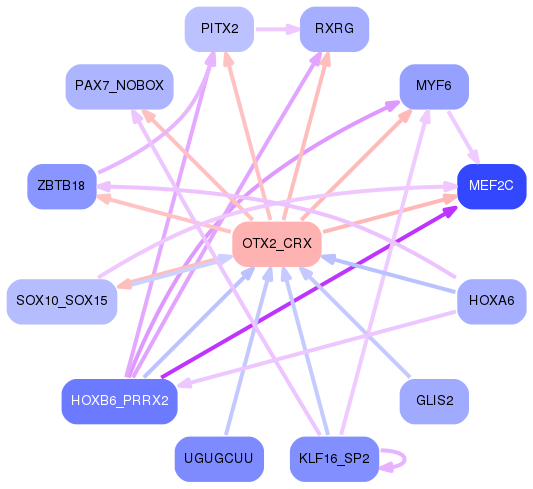
Network of associatons between targets according to the STRING database.

First level regulatory network of OTX2_CRX
Gene Ontology Analysis
Gene overrepresentation in biological process category:
| Log-likelihood per target | Total log-likelihood | Term | Description |
|---|---|---|---|
| 0.7 | 7.4 | GO:0003172 | primary heart field specification(GO:0003138) sinoatrial valve development(GO:0003172) sinoatrial valve morphogenesis(GO:0003185) |
| 0.6 | 3.1 | GO:0014886 | transition between slow and fast fiber(GO:0014886) |
| 0.6 | 2.9 | GO:1905205 | positive regulation of connective tissue replacement(GO:1905205) |
| 0.5 | 1.4 | GO:0071393 | cellular response to progesterone stimulus(GO:0071393) |
| 0.4 | 1.3 | GO:0014813 | skeletal muscle satellite cell commitment(GO:0014813) |
| 0.4 | 4.0 | GO:1902363 | regulation of spindle elongation(GO:0032887) regulation of mitotic spindle elongation(GO:0032888) anastral spindle assembly(GO:0055048) protein localization to spindle pole body(GO:0071988) regulation of protein localization to spindle pole body(GO:1902363) positive regulation of protein localization to spindle pole body(GO:1902365) positive regulation of mitotic spindle elongation(GO:1902846) |
| 0.4 | 2.4 | GO:0003051 | angiotensin-mediated drinking behavior(GO:0003051) |
| 0.3 | 2.4 | GO:0035610 | protein side chain deglutamylation(GO:0035610) |
| 0.3 | 1.0 | GO:0060127 | subthalamic nucleus development(GO:0021763) prolactin secreting cell differentiation(GO:0060127) superior vena cava morphogenesis(GO:0060578) |
| 0.3 | 3.2 | GO:0016560 | protein import into peroxisome matrix, docking(GO:0016560) |
| 0.3 | 6.4 | GO:0038166 | angiotensin-activated signaling pathway(GO:0038166) |
| 0.2 | 1.4 | GO:0042776 | mitochondrial ATP synthesis coupled proton transport(GO:0042776) |
| 0.2 | 1.6 | GO:0006651 | diacylglycerol biosynthetic process(GO:0006651) |
| 0.2 | 2.1 | GO:0051694 | pointed-end actin filament capping(GO:0051694) |
| 0.2 | 2.4 | GO:2000291 | regulation of myoblast proliferation(GO:2000291) |
| 0.2 | 0.5 | GO:0043438 | acetoacetic acid metabolic process(GO:0043438) |
| 0.2 | 1.8 | GO:0048743 | positive regulation of skeletal muscle fiber development(GO:0048743) |
| 0.2 | 0.9 | GO:0010387 | COP9 signalosome assembly(GO:0010387) |
| 0.2 | 3.2 | GO:0071578 | zinc II ion transmembrane import(GO:0071578) |
| 0.1 | 0.6 | GO:0001831 | trophectodermal cellular morphogenesis(GO:0001831) |
| 0.1 | 4.1 | GO:0071420 | cellular response to histamine(GO:0071420) |
| 0.1 | 2.3 | GO:0071313 | cellular response to caffeine(GO:0071313) |
| 0.1 | 1.0 | GO:0046952 | ketone body catabolic process(GO:0046952) |
| 0.1 | 0.6 | GO:2000312 | regulation of kainate selective glutamate receptor activity(GO:2000312) |
| 0.1 | 0.8 | GO:0007197 | adenylate cyclase-inhibiting G-protein coupled acetylcholine receptor signaling pathway(GO:0007197) |
| 0.1 | 0.4 | GO:0097115 | cytoskeletal matrix organization at active zone(GO:0048789) neurexin clustering involved in presynaptic membrane assembly(GO:0097115) retrograde trans-synaptic signaling by trans-synaptic protein complex(GO:0098942) |
| 0.1 | 0.3 | GO:0098884 | postsynaptic neurotransmitter receptor internalization(GO:0098884) |
| 0.1 | 6.7 | GO:0007274 | neuromuscular synaptic transmission(GO:0007274) |
| 0.1 | 0.4 | GO:0061026 | cardiac muscle tissue regeneration(GO:0061026) |
| 0.1 | 0.6 | GO:0018032 | protein amidation(GO:0018032) |
| 0.1 | 0.3 | GO:1904980 | positive regulation of endosome organization(GO:1904980) |
| 0.1 | 0.2 | GO:0001543 | ovarian follicle rupture(GO:0001543) |
| 0.1 | 1.8 | GO:0007021 | tubulin complex assembly(GO:0007021) |
| 0.1 | 0.3 | GO:0016119 | carotene metabolic process(GO:0016119) |
| 0.1 | 1.1 | GO:0014809 | regulation of skeletal muscle contraction by regulation of release of sequestered calcium ion(GO:0014809) |
| 0.1 | 0.9 | GO:0097105 | presynaptic membrane assembly(GO:0097105) |
| 0.1 | 0.7 | GO:0007168 | receptor guanylyl cyclase signaling pathway(GO:0007168) |
| 0.1 | 0.7 | GO:0048386 | positive regulation of retinoic acid receptor signaling pathway(GO:0048386) |
| 0.1 | 0.4 | GO:0007468 | regulation of rhodopsin gene expression(GO:0007468) |
| 0.1 | 1.0 | GO:0044351 | macropinocytosis(GO:0044351) |
| 0.1 | 0.2 | GO:0002326 | B cell lineage commitment(GO:0002326) |
| 0.1 | 0.4 | GO:0019918 | peptidyl-arginine methylation, to symmetrical-dimethyl arginine(GO:0019918) |
| 0.1 | 0.7 | GO:0031339 | negative regulation of vesicle fusion(GO:0031339) |
| 0.1 | 1.9 | GO:0097320 | membrane tubulation(GO:0097320) |
| 0.1 | 0.3 | GO:2001045 | negative regulation of integrin-mediated signaling pathway(GO:2001045) |
| 0.0 | 0.2 | GO:0035054 | embryonic heart tube anterior/posterior pattern specification(GO:0035054) |
| 0.0 | 1.5 | GO:0015671 | oxygen transport(GO:0015671) |
| 0.0 | 0.4 | GO:0060087 | relaxation of vascular smooth muscle(GO:0060087) |
| 0.0 | 0.9 | GO:0090394 | negative regulation of excitatory postsynaptic potential(GO:0090394) |
| 0.0 | 0.3 | GO:0042539 | hypotonic salinity response(GO:0042539) cellular hypotonic salinity response(GO:0071477) |
| 0.0 | 0.2 | GO:0006663 | platelet activating factor biosynthetic process(GO:0006663) |
| 0.0 | 0.1 | GO:1990451 | cellular stress response to acidic pH(GO:1990451) |
| 0.0 | 2.5 | GO:0008045 | motor neuron axon guidance(GO:0008045) |
| 0.0 | 0.3 | GO:0007386 | compartment pattern specification(GO:0007386) |
| 0.0 | 0.2 | GO:0001971 | negative regulation of activation of membrane attack complex(GO:0001971) |
| 0.0 | 0.8 | GO:0046085 | adenosine metabolic process(GO:0046085) |
| 0.0 | 2.3 | GO:0007340 | acrosome reaction(GO:0007340) |
| 0.0 | 0.3 | GO:0071386 | cellular response to corticosterone stimulus(GO:0071386) |
| 0.0 | 0.5 | GO:0098814 | spontaneous neurotransmitter secretion(GO:0061669) spontaneous synaptic transmission(GO:0098814) |
| 0.0 | 1.7 | GO:0035162 | embryonic hemopoiesis(GO:0035162) |
| 0.0 | 3.7 | GO:0043268 | positive regulation of potassium ion transport(GO:0043268) |
| 0.0 | 0.9 | GO:0060716 | labyrinthine layer blood vessel development(GO:0060716) |
| 0.0 | 2.2 | GO:1901522 | positive regulation of transcription from RNA polymerase II promoter involved in cellular response to chemical stimulus(GO:1901522) |
| 0.0 | 0.3 | GO:0051835 | positive regulation of synapse structural plasticity(GO:0051835) |
| 0.0 | 0.6 | GO:0044341 | sodium-dependent phosphate transport(GO:0044341) |
| 0.0 | 0.2 | GO:0046340 | diacylglycerol catabolic process(GO:0046340) |
| 0.0 | 0.1 | GO:0036269 | swimming behavior(GO:0036269) |
| 0.0 | 0.3 | GO:0090267 | positive regulation of mitotic cell cycle spindle assembly checkpoint(GO:0090267) |
| 0.0 | 0.2 | GO:0015772 | disaccharide transport(GO:0015766) sucrose transport(GO:0015770) oligosaccharide transport(GO:0015772) |
| 0.0 | 0.8 | GO:0007097 | nuclear migration(GO:0007097) |
| 0.0 | 0.3 | GO:0001672 | regulation of chromatin assembly or disassembly(GO:0001672) |
| 0.0 | 0.3 | GO:1900045 | negative regulation of histone ubiquitination(GO:0033183) negative regulation of protein K63-linked ubiquitination(GO:1900045) regulation of histone H2A K63-linked ubiquitination(GO:1901314) negative regulation of histone H2A K63-linked ubiquitination(GO:1901315) negative regulation of protein polyubiquitination(GO:1902915) |
| 0.0 | 0.3 | GO:0071787 | endoplasmic reticulum tubular network assembly(GO:0071787) |
| 0.0 | 0.2 | GO:0003221 | right ventricular cardiac muscle tissue morphogenesis(GO:0003221) |
| 0.0 | 0.3 | GO:0021860 | pyramidal neuron development(GO:0021860) |
| 0.0 | 0.2 | GO:0086073 | bundle of His cell-Purkinje myocyte adhesion involved in cell communication(GO:0086073) |
| 0.0 | 1.9 | GO:0010257 | NADH dehydrogenase complex assembly(GO:0010257) mitochondrial respiratory chain complex I assembly(GO:0032981) mitochondrial respiratory chain complex I biogenesis(GO:0097031) |
| 0.0 | 1.2 | GO:0006699 | bile acid biosynthetic process(GO:0006699) |
| 0.0 | 0.4 | GO:0006474 | N-terminal protein amino acid acetylation(GO:0006474) |
| 0.0 | 0.7 | GO:0045662 | negative regulation of myoblast differentiation(GO:0045662) |
| 0.0 | 0.5 | GO:0007216 | G-protein coupled glutamate receptor signaling pathway(GO:0007216) |
| 0.0 | 0.3 | GO:0035873 | lactate transport(GO:0015727) lactate transmembrane transport(GO:0035873) |
| 0.0 | 3.5 | GO:0035335 | peptidyl-tyrosine dephosphorylation(GO:0035335) |
| 0.0 | 0.4 | GO:0051967 | negative regulation of synaptic transmission, glutamatergic(GO:0051967) |
| 0.0 | 0.3 | GO:0031284 | positive regulation of guanylate cyclase activity(GO:0031284) |
| 0.0 | 1.0 | GO:2000144 | positive regulation of DNA-templated transcription, initiation(GO:2000144) |
| 0.0 | 0.3 | GO:2000821 | regulation of grooming behavior(GO:2000821) |
| 0.0 | 0.2 | GO:0021902 | commitment of neuronal cell to specific neuron type in forebrain(GO:0021902) |
| 0.0 | 0.2 | GO:0040023 | establishment of nucleus localization(GO:0040023) |
| 0.0 | 2.1 | GO:0030032 | lamellipodium assembly(GO:0030032) |
| 0.0 | 0.1 | GO:0044334 | canonical Wnt signaling pathway involved in positive regulation of epithelial to mesenchymal transition(GO:0044334) |
| 0.0 | 0.1 | GO:0032468 | Golgi calcium ion homeostasis(GO:0032468) |
| 0.0 | 0.4 | GO:0007016 | cytoskeletal anchoring at plasma membrane(GO:0007016) |
| 0.0 | 0.1 | GO:0009957 | epidermal cell fate specification(GO:0009957) response to chlorate(GO:0010157) |
| 0.0 | 0.6 | GO:0032012 | regulation of ARF protein signal transduction(GO:0032012) |
| 0.0 | 0.3 | GO:2000766 | negative regulation of cytoplasmic translation(GO:2000766) |
| 0.0 | 0.1 | GO:0097500 | receptor localization to nonmotile primary cilium(GO:0097500) |
| 0.0 | 0.3 | GO:1900119 | positive regulation of execution phase of apoptosis(GO:1900119) |
| 0.0 | 0.2 | GO:0035845 | photoreceptor cell outer segment organization(GO:0035845) |
| 0.0 | 0.4 | GO:2000369 | regulation of clathrin-mediated endocytosis(GO:2000369) |
| 0.0 | 1.2 | GO:0060997 | dendritic spine morphogenesis(GO:0060997) |
| 0.0 | 2.5 | GO:0007156 | homophilic cell adhesion via plasma membrane adhesion molecules(GO:0007156) |
| 0.0 | 0.4 | GO:0016246 | RNA interference(GO:0016246) |
| 0.0 | 0.0 | GO:1903015 | regulation of exo-alpha-sialidase activity(GO:1903015) |
| 0.0 | 0.1 | GO:0042756 | drinking behavior(GO:0042756) |
| 0.0 | 0.1 | GO:0032534 | regulation of microvillus assembly(GO:0032534) |
| 0.0 | 0.3 | GO:0043162 | ubiquitin-dependent protein catabolic process via the multivesicular body sorting pathway(GO:0043162) |
Gene overrepresentation in cellular component category:
| Log-likelihood per target | Total log-likelihood | Term | Description |
|---|---|---|---|
| 0.4 | 4.0 | GO:0055028 | cortical microtubule(GO:0055028) |
| 0.4 | 1.4 | GO:0045259 | mitochondrial proton-transporting ATP synthase complex(GO:0005753) proton-transporting ATP synthase complex(GO:0045259) |
| 0.2 | 2.6 | GO:0005955 | calcineurin complex(GO:0005955) |
| 0.2 | 0.7 | GO:0017071 | intracellular cyclic nucleotide activated cation channel complex(GO:0017071) |
| 0.2 | 0.7 | GO:0032127 | dense core granule membrane(GO:0032127) |
| 0.1 | 2.1 | GO:0097512 | cardiac myofibril(GO:0097512) |
| 0.1 | 0.8 | GO:0032280 | symmetric synapse(GO:0032280) |
| 0.1 | 0.3 | GO:0098844 | postsynaptic endocytic zone membrane(GO:0098844) |
| 0.1 | 4.1 | GO:1902711 | GABA-A receptor complex(GO:1902711) |
| 0.1 | 1.0 | GO:0031466 | Cul5-RING ubiquitin ligase complex(GO:0031466) |
| 0.1 | 0.5 | GO:0097441 | basilar dendrite(GO:0097441) |
| 0.1 | 0.3 | GO:0035841 | new growing cell tip(GO:0035841) |
| 0.1 | 1.1 | GO:0016013 | syntrophin complex(GO:0016013) |
| 0.1 | 2.4 | GO:0031143 | pseudopodium(GO:0031143) |
| 0.1 | 0.4 | GO:0031417 | NatC complex(GO:0031417) |
| 0.1 | 0.6 | GO:0005827 | polar microtubule(GO:0005827) |
| 0.1 | 0.8 | GO:0005869 | dynactin complex(GO:0005869) |
| 0.0 | 2.1 | GO:0005865 | striated muscle thin filament(GO:0005865) |
| 0.0 | 7.3 | GO:0042734 | presynaptic membrane(GO:0042734) |
| 0.0 | 0.7 | GO:0097470 | ribbon synapse(GO:0097470) |
| 0.0 | 1.0 | GO:1990454 | L-type voltage-gated calcium channel complex(GO:1990454) |
| 0.0 | 0.3 | GO:0030061 | mitochondrial crista(GO:0030061) |
| 0.0 | 0.8 | GO:0017146 | NMDA selective glutamate receptor complex(GO:0017146) |
| 0.0 | 0.6 | GO:0098839 | postsynaptic density membrane(GO:0098839) |
| 0.0 | 0.7 | GO:0008074 | guanylate cyclase complex, soluble(GO:0008074) |
| 0.0 | 1.2 | GO:0030137 | COPI-coated vesicle(GO:0030137) |
| 0.0 | 0.3 | GO:0016600 | flotillin complex(GO:0016600) |
| 0.0 | 3.6 | GO:0005778 | peroxisomal membrane(GO:0005778) microbody membrane(GO:0031903) |
| 0.0 | 0.6 | GO:0000812 | Swr1 complex(GO:0000812) |
| 0.0 | 0.5 | GO:0005916 | fascia adherens(GO:0005916) |
| 0.0 | 0.2 | GO:0032444 | activin responsive factor complex(GO:0032444) |
| 0.0 | 1.4 | GO:0031312 | extrinsic component of organelle membrane(GO:0031312) |
| 0.0 | 2.7 | GO:0031463 | Cul3-RING ubiquitin ligase complex(GO:0031463) |
| 0.0 | 0.4 | GO:0034709 | methylosome(GO:0034709) |
| 0.0 | 0.5 | GO:0033162 | melanosome membrane(GO:0033162) chitosome(GO:0045009) |
| 0.0 | 7.2 | GO:0042383 | sarcolemma(GO:0042383) |
| 0.0 | 1.7 | GO:0045171 | intercellular bridge(GO:0045171) |
| 0.0 | 2.4 | GO:0097517 | stress fiber(GO:0001725) contractile actin filament bundle(GO:0097517) |
| 0.0 | 1.3 | GO:0033017 | sarcoplasmic reticulum membrane(GO:0033017) |
| 0.0 | 0.3 | GO:0000813 | ESCRT I complex(GO:0000813) |
| 0.0 | 0.3 | GO:0032591 | dendritic spine membrane(GO:0032591) |
| 0.0 | 1.2 | GO:0032154 | cleavage furrow(GO:0032154) cell surface furrow(GO:0097610) |
| 0.0 | 1.3 | GO:0031672 | A band(GO:0031672) |
| 0.0 | 0.1 | GO:0071664 | beta-catenin-TCF7L2 complex(GO:0070369) catenin-TCF7L2 complex(GO:0071664) |
| 0.0 | 0.9 | GO:0008180 | COP9 signalosome(GO:0008180) |
| 0.0 | 3.1 | GO:0090575 | RNA polymerase II transcription factor complex(GO:0090575) |
| 0.0 | 0.3 | GO:0005868 | cytoplasmic dynein complex(GO:0005868) |
| 0.0 | 0.3 | GO:0005922 | connexon complex(GO:0005922) |
| 0.0 | 7.7 | GO:0016607 | nuclear speck(GO:0016607) |
| 0.0 | 0.5 | GO:0030132 | clathrin coat of coated pit(GO:0030132) |
Gene overrepresentation in molecular function category:
| Log-likelihood per target | Total log-likelihood | Term | Description |
|---|---|---|---|
| 0.5 | 2.4 | GO:0004886 | 9-cis retinoic acid receptor activity(GO:0004886) |
| 0.4 | 2.4 | GO:0008241 | peptidyl-dipeptidase activity(GO:0008241) |
| 0.4 | 7.9 | GO:0009931 | calcium-dependent protein serine/threonine kinase activity(GO:0009931) |
| 0.4 | 3.2 | GO:0005052 | peroxisome matrix targeting signal-1 binding(GO:0005052) |
| 0.3 | 7.4 | GO:0003680 | AT DNA binding(GO:0003680) |
| 0.3 | 1.3 | GO:0048763 | calcium-induced calcium release activity(GO:0048763) |
| 0.3 | 1.0 | GO:0008260 | 3-oxoacid CoA-transferase activity(GO:0008260) |
| 0.2 | 2.9 | GO:0033192 | calmodulin-dependent protein phosphatase activity(GO:0033192) |
| 0.2 | 0.8 | GO:0008665 | 2'-phosphotransferase activity(GO:0008665) |
| 0.2 | 4.0 | GO:0051011 | microtubule minus-end binding(GO:0051011) |
| 0.1 | 0.6 | GO:0031208 | POZ domain binding(GO:0031208) |
| 0.1 | 1.5 | GO:0022851 | GABA-gated chloride ion channel activity(GO:0022851) |
| 0.1 | 2.6 | GO:0008503 | benzodiazepine receptor activity(GO:0008503) |
| 0.1 | 1.3 | GO:0042835 | BRE binding(GO:0042835) |
| 0.1 | 0.5 | GO:0016716 | oxidoreductase activity, acting on paired donors, with incorporation or reduction of molecular oxygen, another compound as one donor, and incorporation of one atom of oxygen(GO:0016716) |
| 0.1 | 0.3 | GO:0031798 | type 1 metabotropic glutamate receptor binding(GO:0031798) |
| 0.1 | 0.8 | GO:1990763 | arrestin family protein binding(GO:1990763) |
| 0.1 | 4.8 | GO:0004435 | phosphatidylinositol phospholipase C activity(GO:0004435) |
| 0.1 | 0.8 | GO:0005223 | intracellular cGMP activated cation channel activity(GO:0005223) |
| 0.1 | 0.7 | GO:0016618 | hydroxypyruvate reductase activity(GO:0016618) glyoxylate reductase (NADP) activity(GO:0030267) |
| 0.1 | 0.6 | GO:0004598 | peptidylglycine monooxygenase activity(GO:0004504) peptidylamidoglycolate lyase activity(GO:0004598) |
| 0.1 | 0.6 | GO:0008454 | alpha-1,3-mannosylglycoprotein 4-beta-N-acetylglucosaminyltransferase activity(GO:0008454) |
| 0.1 | 0.6 | GO:0051373 | FATZ binding(GO:0051373) |
| 0.1 | 0.4 | GO:0004692 | cGMP-dependent protein kinase activity(GO:0004692) |
| 0.1 | 2.1 | GO:0005523 | tropomyosin binding(GO:0005523) |
| 0.1 | 0.6 | GO:0015319 | sodium:inorganic phosphate symporter activity(GO:0015319) |
| 0.1 | 3.2 | GO:0005385 | zinc ion transmembrane transporter activity(GO:0005385) |
| 0.1 | 0.2 | GO:0033878 | hormone-sensitive lipase activity(GO:0033878) |
| 0.1 | 2.4 | GO:0004181 | metallocarboxypeptidase activity(GO:0004181) |
| 0.1 | 1.5 | GO:0005344 | oxygen transporter activity(GO:0005344) |
| 0.1 | 0.4 | GO:0035243 | protein-arginine omega-N symmetric methyltransferase activity(GO:0035243) histone methyltransferase activity (H4-R3 specific)(GO:0044020) |
| 0.0 | 2.8 | GO:0046875 | ephrin receptor binding(GO:0046875) |
| 0.0 | 0.3 | GO:0043812 | phosphatidylinositol-4-phosphate phosphatase activity(GO:0043812) |
| 0.0 | 1.3 | GO:0005212 | structural constituent of eye lens(GO:0005212) |
| 0.0 | 3.5 | GO:0008138 | protein tyrosine/serine/threonine phosphatase activity(GO:0008138) |
| 0.0 | 7.1 | GO:0030165 | PDZ domain binding(GO:0030165) |
| 0.0 | 1.1 | GO:0050998 | nitric-oxide synthase binding(GO:0050998) |
| 0.0 | 0.3 | GO:0008048 | calcium sensitive guanylate cyclase activator activity(GO:0008048) |
| 0.0 | 0.7 | GO:0004383 | guanylate cyclase activity(GO:0004383) |
| 0.0 | 0.2 | GO:0015154 | sucrose:proton symporter activity(GO:0008506) sucrose transmembrane transporter activity(GO:0008515) disaccharide transmembrane transporter activity(GO:0015154) oligosaccharide transmembrane transporter activity(GO:0015157) |
| 0.0 | 1.3 | GO:0000983 | transcription factor activity, RNA polymerase II core promoter sequence-specific(GO:0000983) |
| 0.0 | 0.6 | GO:0019966 | interleukin-1 binding(GO:0019966) |
| 0.0 | 2.7 | GO:0070888 | E-box binding(GO:0070888) |
| 0.0 | 1.0 | GO:0008331 | high voltage-gated calcium channel activity(GO:0008331) |
| 0.0 | 0.4 | GO:0004972 | NMDA glutamate receptor activity(GO:0004972) |
| 0.0 | 1.2 | GO:0015248 | sterol transporter activity(GO:0015248) |
| 0.0 | 0.2 | GO:0030348 | syntaxin-3 binding(GO:0030348) |
| 0.0 | 0.4 | GO:1901612 | cardiolipin binding(GO:1901612) |
| 0.0 | 0.3 | GO:0045504 | dynein heavy chain binding(GO:0045504) |
| 0.0 | 0.4 | GO:0004596 | peptide alpha-N-acetyltransferase activity(GO:0004596) |
| 0.0 | 0.4 | GO:0004716 | receptor signaling protein tyrosine kinase activity(GO:0004716) |
| 0.0 | 0.2 | GO:0086083 | cell adhesive protein binding involved in bundle of His cell-Purkinje myocyte communication(GO:0086083) |
| 0.0 | 0.3 | GO:0015129 | lactate transmembrane transporter activity(GO:0015129) |
| 0.0 | 0.3 | GO:0015379 | potassium:chloride symporter activity(GO:0015379) potassium ion symporter activity(GO:0022820) |
| 0.0 | 0.1 | GO:0030171 | voltage-gated proton channel activity(GO:0030171) |
| 0.0 | 0.3 | GO:0097016 | L27 domain binding(GO:0097016) |
| 0.0 | 0.4 | GO:0045295 | gamma-catenin binding(GO:0045295) |
| 0.0 | 0.3 | GO:0005243 | gap junction channel activity(GO:0005243) |
| 0.0 | 3.0 | GO:0003705 | transcription factor activity, RNA polymerase II distal enhancer sequence-specific binding(GO:0003705) |
| 0.0 | 0.2 | GO:0047498 | calcium-dependent phospholipase A2 activity(GO:0047498) |
| 0.0 | 0.1 | GO:0004704 | NF-kappaB-inducing kinase activity(GO:0004704) |
| 0.0 | 0.4 | GO:0008510 | sodium:bicarbonate symporter activity(GO:0008510) |
| 0.0 | 0.3 | GO:0035259 | glucocorticoid receptor binding(GO:0035259) |
| 0.0 | 1.0 | GO:0019212 | phosphatase inhibitor activity(GO:0019212) |
| 0.0 | 0.6 | GO:0005086 | ARF guanyl-nucleotide exchange factor activity(GO:0005086) |
| 0.0 | 0.1 | GO:0097108 | smoothened binding(GO:0005119) hedgehog family protein binding(GO:0097108) |
| 0.0 | 9.0 | GO:0004842 | ubiquitin-protein transferase activity(GO:0004842) |
| 0.0 | 0.3 | GO:0010181 | FMN binding(GO:0010181) |
Gene overrepresentation in curated gene sets: canonical pathways category:
| Log-likelihood per target | Total log-likelihood | Term | Description |
|---|---|---|---|
| 0.1 | 6.0 | ST WNT CA2 CYCLIC GMP PATHWAY | Wnt/Ca2+/cyclic GMP signaling. |
| 0.1 | 9.8 | PID P38 ALPHA BETA DOWNSTREAM PATHWAY | Signaling mediated by p38-alpha and p38-beta |
| 0.0 | 2.6 | PID RETINOIC ACID PATHWAY | Retinoic acid receptors-mediated signaling |
| 0.0 | 2.9 | PID IL12 STAT4 PATHWAY | IL12 signaling mediated by STAT4 |
| 0.0 | 1.9 | ST G ALPHA I PATHWAY | G alpha i Pathway |
| 0.0 | 0.5 | ST G ALPHA S PATHWAY | G alpha s Pathway |
| 0.0 | 1.5 | SA PTEN PATHWAY | PTEN is a tumor suppressor that dephosphorylates the lipid messenger phosphatidylinositol triphosphate. |
| 0.0 | 4.2 | PID CASPASE PATHWAY | Caspase cascade in apoptosis |
| 0.0 | 1.4 | PID RAS PATHWAY | Regulation of Ras family activation |
| 0.0 | 2.8 | PID RAC1 REG PATHWAY | Regulation of RAC1 activity |
| 0.0 | 2.4 | PID CMYB PATHWAY | C-MYB transcription factor network |
| 0.0 | 0.6 | PID WNT CANONICAL PATHWAY | Canonical Wnt signaling pathway |
| 0.0 | 1.7 | PID REG GR PATHWAY | Glucocorticoid receptor regulatory network |
Gene overrepresentation in curated gene sets: REACTOME pathways category:
| Log-likelihood per target | Total log-likelihood | Term | Description |
|---|---|---|---|
| 0.2 | 4.0 | REACTOME RECRUITMENT OF NUMA TO MITOTIC CENTROSOMES | Genes involved in Recruitment of NuMA to mitotic centrosomes |
| 0.2 | 6.8 | REACTOME RAS ACTIVATION UOPN CA2 INFUX THROUGH NMDA RECEPTOR | Genes involved in Ras activation uopn Ca2+ infux through NMDA receptor |
| 0.1 | 7.4 | REACTOME ERK MAPK TARGETS | Genes involved in ERK/MAPK targets |
| 0.1 | 4.1 | REACTOME GABA A RECEPTOR ACTIVATION | Genes involved in GABA A receptor activation |
| 0.1 | 1.5 | REACTOME P38MAPK EVENTS | Genes involved in p38MAPK events |
| 0.1 | 2.4 | REACTOME DCC MEDIATED ATTRACTIVE SIGNALING | Genes involved in DCC mediated attractive signaling |
| 0.0 | 2.9 | REACTOME DARPP 32 EVENTS | Genes involved in DARPP-32 events |
| 0.0 | 0.8 | REACTOME PEPTIDE HORMONE BIOSYNTHESIS | Genes involved in Peptide hormone biosynthesis |
| 0.0 | 0.6 | REACTOME N GLYCAN ANTENNAE ELONGATION | Genes involved in N-Glycan antennae elongation |
| 0.0 | 0.7 | REACTOME TERMINATION OF O GLYCAN BIOSYNTHESIS | Genes involved in Termination of O-glycan biosynthesis |
| 0.0 | 1.4 | REACTOME MYOGENESIS | Genes involved in Myogenesis |
| 0.0 | 0.7 | REACTOME ADHERENS JUNCTIONS INTERACTIONS | Genes involved in Adherens junctions interactions |
| 0.0 | 0.8 | REACTOME AMINE LIGAND BINDING RECEPTORS | Genes involved in Amine ligand-binding receptors |
| 0.0 | 1.1 | REACTOME STRIATED MUSCLE CONTRACTION | Genes involved in Striated Muscle Contraction |
| 0.0 | 0.3 | REACTOME BILE SALT AND ORGANIC ANION SLC TRANSPORTERS | Genes involved in Bile salt and organic anion SLC transporters |
| 0.0 | 1.8 | REACTOME NUCLEAR RECEPTOR TRANSCRIPTION PATHWAY | Genes involved in Nuclear Receptor transcription pathway |
| 0.0 | 4.6 | REACTOME ANTIGEN PROCESSING UBIQUITINATION PROTEASOME DEGRADATION | Genes involved in Antigen processing: Ubiquitination & Proteasome degradation |
| 0.0 | 0.3 | REACTOME GAP JUNCTION ASSEMBLY | Genes involved in Gap junction assembly |
| 0.0 | 2.0 | REACTOME MHC CLASS II ANTIGEN PRESENTATION | Genes involved in MHC class II antigen presentation |
| 0.0 | 0.2 | REACTOME ACYL CHAIN REMODELLING OF PS | Genes involved in Acyl chain remodelling of PS |
| 0.0 | 1.0 | REACTOME NCAM1 INTERACTIONS | Genes involved in NCAM1 interactions |