Project
Illumina Body Map 2 (GSE30611)
Navigation
Downloads
Results for OVOL1
Z-value: 0.64
Motif logo
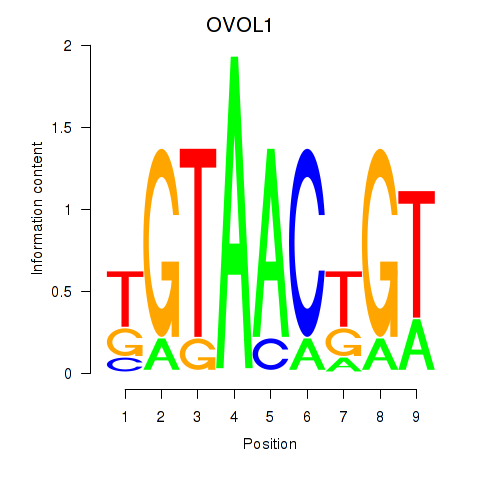
Transcription factors associated with OVOL1
| Gene Symbol | Gene ID | Gene Info |
|---|---|---|
|
OVOL1
|
ENSG00000172818.10 | ovo like transcriptional repressor 1 |
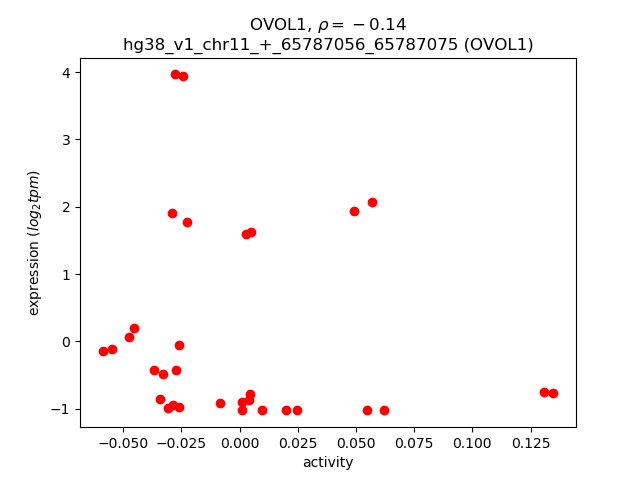
Activity-expression correlation:
| Gene | Promoter | Pearson corr. coef. | P-value | Plot |
|---|---|---|---|---|
| OVOL1 | hg38_v1_chr11_+_65787056_65787075 | -0.14 | 4.5e-01 | Click! |
Activity profile of OVOL1 motif
Sorted Z-values of OVOL1 motif
| Promoter | Log-likelihood | Transcript | Gene | Gene Info |
|---|---|---|---|---|
| chr5_+_161850597 | 2.79 |
ENST00000634335.1
ENST00000635880.1 |
GABRA1
|
gamma-aminobutyric acid type A receptor subunit alpha1 |
| chr10_-_72088972 | 2.14 |
ENST00000317376.8
ENST00000412663.5 |
SPOCK2
|
SPARC (osteonectin), cwcv and kazal like domains proteoglycan 2 |
| chr10_-_72088533 | 1.98 |
ENST00000373109.7
|
SPOCK2
|
SPARC (osteonectin), cwcv and kazal like domains proteoglycan 2 |
| chr10_-_72088504 | 1.77 |
ENST00000536168.2
|
SPOCK2
|
SPARC (osteonectin), cwcv and kazal like domains proteoglycan 2 |
| chr6_-_83709382 | 1.75 |
ENST00000520302.5
ENST00000520213.5 ENST00000439399.6 |
SNAP91
|
synaptosome associated protein 91 |
| chr19_-_49442360 | 1.65 |
ENST00000600601.5
|
SLC17A7
|
solute carrier family 17 member 7 |
| chr5_-_16508788 | 1.63 |
ENST00000682142.1
|
RETREG1
|
reticulophagy regulator 1 |
| chr5_-_16508990 | 1.60 |
ENST00000399793.6
|
RETREG1
|
reticulophagy regulator 1 |
| chr11_+_123430259 | 1.55 |
ENST00000533341.3
ENST00000635736.2 |
GRAMD1B
|
GRAM domain containing 1B |
| chr5_+_68239815 | 1.47 |
ENST00000520675.1
|
PIK3R1
|
phosphoinositide-3-kinase regulatory subunit 1 |
| chr5_-_16508858 | 1.46 |
ENST00000684456.1
|
RETREG1
|
reticulophagy regulator 1 |
| chr5_-_16508812 | 1.46 |
ENST00000683414.1
|
RETREG1
|
reticulophagy regulator 1 |
| chr5_-_16508951 | 1.43 |
ENST00000682628.1
|
RETREG1
|
reticulophagy regulator 1 |
| chr18_-_5544250 | 1.21 |
ENST00000540638.6
ENST00000342933.7 |
EPB41L3
|
erythrocyte membrane protein band 4.1 like 3 |
| chr18_-_5543960 | 1.10 |
ENST00000400111.8
|
EPB41L3
|
erythrocyte membrane protein band 4.1 like 3 |
| chr18_-_5543988 | 1.01 |
ENST00000341928.7
|
EPB41L3
|
erythrocyte membrane protein band 4.1 like 3 |
| chr5_+_140882116 | 0.88 |
ENST00000289272.3
ENST00000409494.5 ENST00000617769.1 |
PCDHA13
|
protocadherin alpha 13 |
| chr1_+_174877430 | 0.87 |
ENST00000392064.6
|
RABGAP1L
|
RAB GTPase activating protein 1 like |
| chr2_-_152099155 | 0.86 |
ENST00000637309.1
|
CACNB4
|
calcium voltage-gated channel auxiliary subunit beta 4 |
| chr2_-_182522556 | 0.83 |
ENST00000435564.5
|
PDE1A
|
phosphodiesterase 1A |
| chr2_-_152099023 | 0.62 |
ENST00000201943.10
ENST00000427385.6 ENST00000539935.7 |
CACNB4
|
calcium voltage-gated channel auxiliary subunit beta 4 |
| chr19_+_37371152 | 0.58 |
ENST00000483919.5
ENST00000588911.5 ENST00000587349.1 |
ZNF527
|
zinc finger protein 527 |
| chr15_+_75043263 | 0.42 |
ENST00000563393.1
|
PPCDC
|
phosphopantothenoylcysteine decarboxylase |
| chr11_-_75306688 | 0.40 |
ENST00000532525.1
|
ARRB1
|
arrestin beta 1 |
| chr6_-_35688907 | 0.39 |
ENST00000539068.5
ENST00000357266.9 |
FKBP5
|
FKBP prolyl isomerase 5 |
| chr5_+_141359970 | 0.38 |
ENST00000522605.2
ENST00000622527.1 |
PCDHGB2
|
protocadherin gamma subfamily B, 2 |
| chr2_-_182522703 | 0.34 |
ENST00000410103.1
|
PDE1A
|
phosphodiesterase 1A |
| chr19_+_6772699 | 0.24 |
ENST00000602142.6
ENST00000304076.6 ENST00000596764.5 |
VAV1
|
vav guanine nucleotide exchange factor 1 |
| chr19_-_51501755 | 0.18 |
ENST00000291707.8
|
SIGLEC12
|
sialic acid binding Ig like lectin 12 |
| chr4_+_75556048 | 0.18 |
ENST00000616557.1
ENST00000435974.2 ENST00000311623.9 |
ODAPH
|
odontogenesis associated phosphoprotein |
| chr11_+_71999927 | 0.14 |
ENST00000393707.4
|
IL18BP
|
interleukin 18 binding protein |
| chr9_+_122800123 | 0.13 |
ENST00000277309.3
|
OR1K1
|
olfactory receptor family 1 subfamily K member 1 |
| chr5_-_17492076 | 0.12 |
ENST00000600799.3
|
H3Y2
|
H3.Y histone 2 |
| chr12_-_76084666 | 0.11 |
ENST00000393263.7
ENST00000548044.5 ENST00000547704.5 ENST00000618691.5 ENST00000431879.7 ENST00000549596.5 ENST00000550934.5 ENST00000551600.5 ENST00000547479.5 ENST00000547773.5 ENST00000544816.5 ENST00000542344.5 ENST00000548273.5 |
NAP1L1
|
nucleosome assembly protein 1 like 1 |
| chr4_-_67754335 | 0.09 |
ENST00000420975.2
ENST00000226413.5 |
GNRHR
|
gonadotropin releasing hormone receptor |
| chr17_-_7242156 | 0.07 |
ENST00000571129.5
ENST00000571253.1 ENST00000573928.1 ENST00000302386.10 |
GABARAP
|
GABA type A receptor-associated protein |
| chr20_+_56248732 | 0.05 |
ENST00000243911.2
|
MC3R
|
melanocortin 3 receptor |
| chr19_-_45792755 | 0.03 |
ENST00000377735.7
ENST00000270223.7 |
DMWD
|
DM1 locus, WD repeat containing |
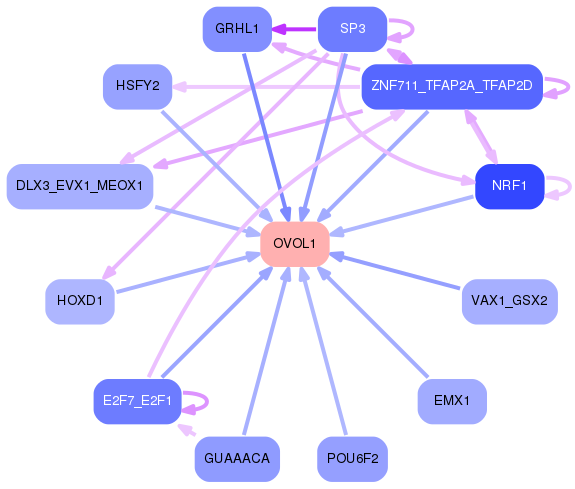
Network of associatons between targets according to the STRING database.

First level regulatory network of OVOL1
Gene Ontology Analysis
Gene overrepresentation in biological process category:
| Log-likelihood per target | Total log-likelihood | Term | Description |
|---|---|---|---|
| 0.9 | 7.6 | GO:0061709 | reticulophagy(GO:0061709) |
| 0.5 | 1.6 | GO:0042137 | sequestering of neurotransmitter(GO:0042137) |
| 0.3 | 5.9 | GO:0019800 | peptide cross-linking via chondroitin 4-sulfate glycosaminoglycan(GO:0019800) |
| 0.2 | 3.3 | GO:0002175 | protein localization to paranode region of axon(GO:0002175) |
| 0.1 | 2.8 | GO:0071420 | cellular response to histamine(GO:0071420) |
| 0.1 | 1.5 | GO:0051531 | NFAT protein import into nucleus(GO:0051531) |
| 0.1 | 1.6 | GO:0034390 | smooth muscle cell apoptotic process(GO:0034390) regulation of smooth muscle cell apoptotic process(GO:0034391) |
| 0.0 | 1.8 | GO:0048268 | clathrin coat assembly(GO:0048268) |
| 0.0 | 0.1 | GO:0097211 | response to gonadotropin-releasing hormone(GO:0097210) cellular response to gonadotropin-releasing hormone(GO:0097211) |
| 0.0 | 0.1 | GO:0042309 | homoiothermy(GO:0042309) |
| 0.0 | 1.5 | GO:1901385 | regulation of voltage-gated calcium channel activity(GO:1901385) |
| 0.0 | 0.4 | GO:0015937 | coenzyme A biosynthetic process(GO:0015937) |
Gene overrepresentation in cellular component category:
| Log-likelihood per target | Total log-likelihood | Term | Description |
|---|---|---|---|
| 0.2 | 1.5 | GO:1990578 | perinuclear endoplasmic reticulum membrane(GO:1990578) |
| 0.1 | 1.6 | GO:0060203 | clathrin-sculpted glutamate transport vesicle(GO:0060199) clathrin-sculpted glutamate transport vesicle membrane(GO:0060203) |
| 0.1 | 3.3 | GO:0033270 | paranode region of axon(GO:0033270) |
| 0.1 | 7.6 | GO:0005801 | cis-Golgi network(GO:0005801) |
| 0.1 | 2.8 | GO:1902711 | GABA-A receptor complex(GO:1902711) |
| 0.0 | 1.5 | GO:0005891 | voltage-gated calcium channel complex(GO:0005891) |
| 0.0 | 2.2 | GO:0005905 | clathrin-coated pit(GO:0005905) |
Gene overrepresentation in molecular function category:
| Log-likelihood per target | Total log-likelihood | Term | Description |
|---|---|---|---|
| 0.3 | 2.8 | GO:0099529 | neurotransmitter receptor activity involved in regulation of postsynaptic membrane potential(GO:0099529) transmitter-gated ion channel activity involved in regulation of postsynaptic membrane potential(GO:1904315) |
| 0.2 | 5.9 | GO:0008191 | metalloendopeptidase inhibitor activity(GO:0008191) |
| 0.2 | 1.2 | GO:0048101 | calcium- and calmodulin-regulated 3',5'-cyclic-GMP phosphodiesterase activity(GO:0048101) |
| 0.2 | 1.6 | GO:0015319 | sodium:inorganic phosphate symporter activity(GO:0015319) |
| 0.1 | 0.4 | GO:0031896 | V2 vasopressin receptor binding(GO:0031896) |
| 0.1 | 1.5 | GO:0046935 | 1-phosphatidylinositol-3-kinase regulator activity(GO:0046935) |
| 0.0 | 0.1 | GO:0042007 | interleukin-18 binding(GO:0042007) |
| 0.0 | 1.8 | GO:0005545 | 1-phosphatidylinositol binding(GO:0005545) |
| 0.0 | 1.5 | GO:0008331 | high voltage-gated calcium channel activity(GO:0008331) |
| 0.0 | 0.1 | GO:0004980 | melanocyte-stimulating hormone receptor activity(GO:0004980) |
| 0.0 | 3.3 | GO:0005200 | structural constituent of cytoskeleton(GO:0005200) |
| 0.0 | 0.4 | GO:0005528 | macrolide binding(GO:0005527) FK506 binding(GO:0005528) |
Gene overrepresentation in curated gene sets: canonical pathways category:
| Log-likelihood per target | Total log-likelihood | Term | Description |
|---|---|---|---|
| 0.1 | 5.9 | NABA PROTEOGLYCANS | Genes encoding proteoglycans |
| 0.0 | 1.5 | PID IL5 PATHWAY | IL5-mediated signaling events |
Gene overrepresentation in curated gene sets: REACTOME pathways category:
| Log-likelihood per target | Total log-likelihood | Term | Description |
|---|---|---|---|
| 0.1 | 2.8 | REACTOME GABA A RECEPTOR ACTIVATION | Genes involved in GABA A receptor activation |
| 0.0 | 1.5 | REACTOME IL 7 SIGNALING | Genes involved in Interleukin-7 signaling |
| 0.0 | 1.6 | REACTOME GLUTAMATE NEUROTRANSMITTER RELEASE CYCLE | Genes involved in Glutamate Neurotransmitter Release Cycle |
| 0.0 | 1.2 | REACTOME CGMP EFFECTS | Genes involved in cGMP effects |
| 0.0 | 0.4 | REACTOME VITAMIN B5 PANTOTHENATE METABOLISM | Genes involved in Vitamin B5 (pantothenate) metabolism |
| 0.0 | 1.5 | REACTOME NCAM1 INTERACTIONS | Genes involved in NCAM1 interactions |