Project
Illumina Body Map 2 (GSE30611)
Navigation
Downloads
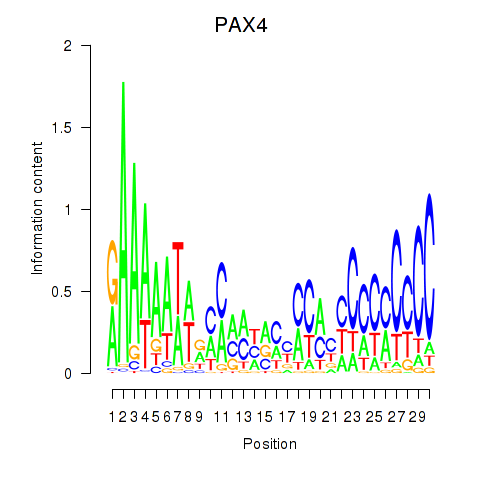
Results for PAX4
Z-value: 1.48
Motif logo
Transcription factors associated with PAX4
| Gene Symbol | Gene ID | Gene Info |
|---|---|---|
|
PAX4
|
ENSG00000106331.17 | paired box 4 |
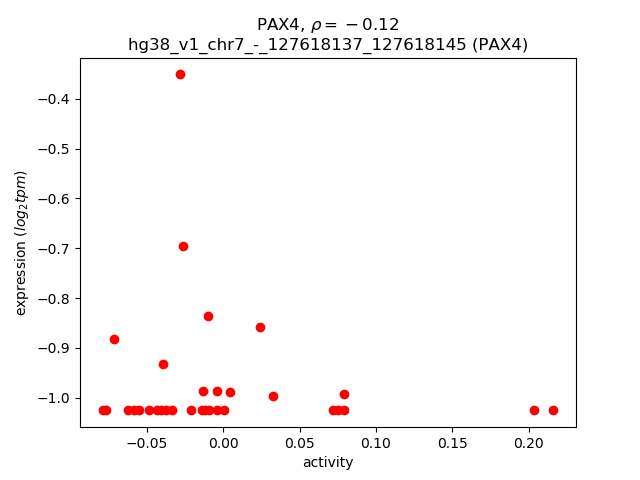
Activity-expression correlation:
| Gene | Promoter | Pearson corr. coef. | P-value | Plot |
|---|---|---|---|---|
| PAX4 | hg38_v1_chr7_-_127618137_127618145 | -0.12 | 5.0e-01 | Click! |
Activity profile of PAX4 motif
Sorted Z-values of PAX4 motif
| Promoter | Log-likelihood | Transcript | Gene | Gene Info |
|---|---|---|---|---|
| chr1_-_153375591 | 8.08 |
ENST00000368737.5
|
S100A12
|
S100 calcium binding protein A12 |
| chr1_+_26317950 | 7.06 |
ENST00000374213.3
|
CD52
|
CD52 molecule |
| chr4_-_83109843 | 6.73 |
ENST00000411416.6
|
PLAC8
|
placenta associated 8 |
| chr1_+_101236860 | 5.50 |
ENST00000475821.2
|
S1PR1
|
sphingosine-1-phosphate receptor 1 |
| chr6_+_31586124 | 5.49 |
ENST00000418507.6
ENST00000376096.5 ENST00000376099.5 ENST00000376110.7 |
LST1
|
leukocyte specific transcript 1 |
| chr1_+_101237009 | 4.73 |
ENST00000305352.7
|
S1PR1
|
sphingosine-1-phosphate receptor 1 |
| chr6_+_31586269 | 4.57 |
ENST00000438075.7
|
LST1
|
leukocyte specific transcript 1 |
| chr2_-_136118142 | 4.34 |
ENST00000241393.4
|
CXCR4
|
C-X-C motif chemokine receptor 4 |
| chr1_-_24964984 | 4.13 |
ENST00000338888.3
ENST00000399916.5 |
RUNX3
|
RUNX family transcription factor 3 |
| chr19_+_54593619 | 4.12 |
ENST00000251372.8
ENST00000453777.1 |
LILRA1
|
leukocyte immunoglobulin like receptor A1 |
| chr2_-_136116165 | 4.09 |
ENST00000409817.1
|
CXCR4
|
C-X-C motif chemokine receptor 4 |
| chr6_+_32439866 | 4.05 |
ENST00000374982.5
ENST00000395388.7 |
HLA-DRA
|
major histocompatibility complex, class II, DR alpha |
| chr11_-_59212869 | 3.80 |
ENST00000361050.4
|
MPEG1
|
macrophage expressed 1 |
| chr22_-_17219424 | 3.72 |
ENST00000649540.1
ENST00000399837.8 ENST00000543038.1 |
ADA2
|
adenosine deaminase 2 |
| chr1_-_151059561 | 3.68 |
ENST00000357235.6
ENST00000540998.5 |
CDC42SE1
|
CDC42 small effector 1 |
| chr19_-_54281145 | 3.62 |
ENST00000434421.5
ENST00000391749.4 |
LILRB2
|
leukocyte immunoglobulin like receptor B2 |
| chr7_+_80638633 | 3.59 |
ENST00000447544.7
ENST00000482059.6 |
CD36
|
CD36 molecule |
| chr6_-_25042003 | 3.53 |
ENST00000510784.8
|
RIPOR2
|
RHO family interacting cell polarization regulator 2 |
| chr7_+_80638510 | 3.44 |
ENST00000433696.6
ENST00000538969.5 ENST00000544133.5 |
CD36
|
CD36 molecule |
| chr6_+_31586680 | 3.38 |
ENST00000339530.8
|
LST1
|
leukocyte specific transcript 1 |
| chr7_+_80638662 | 3.37 |
ENST00000394788.7
|
CD36
|
CD36 molecule |
| chr17_+_45221854 | 3.33 |
ENST00000331495.8
|
FMNL1
|
formin like 1 |
| chr5_+_119333151 | 3.29 |
ENST00000513374.1
|
TNFAIP8
|
TNF alpha induced protein 8 |
| chr19_+_10848366 | 3.25 |
ENST00000397820.5
|
C19orf38
|
chromosome 19 open reading frame 38 |
| chr12_-_44875647 | 3.24 |
ENST00000395487.6
|
NELL2
|
neural EGFL like 2 |
| chr6_+_31586835 | 3.23 |
ENST00000211921.11
|
LST1
|
leukocyte specific transcript 1 |
| chr16_-_28610032 | 3.23 |
ENST00000567512.1
|
SULT1A1
|
sulfotransferase family 1A member 1 |
| chr19_-_54281082 | 3.20 |
ENST00000314446.10
|
LILRB2
|
leukocyte immunoglobulin like receptor B2 |
| chr11_+_1853049 | 3.19 |
ENST00000311604.8
|
LSP1
|
lymphocyte specific protein 1 |
| chr16_-_28609992 | 3.16 |
ENST00000314752.11
|
SULT1A1
|
sulfotransferase family 1A member 1 |
| chr19_+_41549510 | 3.12 |
ENST00000407170.6
ENST00000601116.5 ENST00000595395.1 |
CEACAM21
ENSG00000268027.5
|
CEA cell adhesion molecule 21 novel transcript, sense intronic to CEACAM21 |
| chr22_-_17219571 | 3.11 |
ENST00000610390.4
|
ADA2
|
adenosine deaminase 2 |
| chr12_-_44875980 | 3.09 |
ENST00000548826.5
|
NELL2
|
neural EGFL like 2 |
| chr16_-_28609976 | 3.08 |
ENST00000566189.5
|
SULT1A1
|
sulfotransferase family 1A member 1 |
| chr8_-_21913671 | 3.08 |
ENST00000523932.1
ENST00000276420.9 |
DOK2
|
docking protein 2 |
| chr20_-_53593829 | 3.05 |
ENST00000371471.7
|
ZNF217
|
zinc finger protein 217 |
| chr2_-_86861871 | 2.99 |
ENST00000390655.12
ENST00000393759.6 ENST00000349455.7 ENST00000331469.6 ENST00000393761.6 ENST00000431506.3 |
CD8B
|
CD8b molecule |
| chr22_-_31292445 | 2.90 |
ENST00000402249.7
ENST00000215912.10 ENST00000443175.1 ENST00000441972.5 |
PIK3IP1
|
phosphoinositide-3-kinase interacting protein 1 |
| chr5_+_147878703 | 2.85 |
ENST00000296694.5
|
SCGB3A2
|
secretoglobin family 3A member 2 |
| chr17_+_45221993 | 2.78 |
ENST00000328118.7
|
FMNL1
|
formin like 1 |
| chr22_+_22887780 | 2.69 |
ENST00000532223.2
ENST00000526893.6 ENST00000531372.1 |
IGLL5
|
immunoglobulin lambda like polypeptide 5 |
| chr6_+_32637396 | 2.68 |
ENST00000395363.5
ENST00000496318.5 ENST00000343139.11 |
HLA-DQA1
|
major histocompatibility complex, class II, DQ alpha 1 |
| chr12_-_44875468 | 2.62 |
ENST00000553120.1
|
NELL2
|
neural EGFL like 2 |
| chr7_+_142587857 | 2.51 |
ENST00000617639.1
|
TRBV14
|
T cell receptor beta variable 14 |
| chr6_+_32637419 | 2.46 |
ENST00000374949.2
|
HLA-DQA1
|
major histocompatibility complex, class II, DQ alpha 1 |
| chr19_+_54630410 | 2.45 |
ENST00000396327.7
ENST00000324602.12 |
LILRB1
|
leukocyte immunoglobulin like receptor B1 |
| chr19_+_54630497 | 2.44 |
ENST00000396332.8
ENST00000427581.6 |
LILRB1
|
leukocyte immunoglobulin like receptor B1 |
| chrY_+_2841594 | 2.39 |
ENST00000250784.13
|
RPS4Y1
|
ribosomal protein S4 Y-linked 1 |
| chr14_-_49586325 | 2.39 |
ENST00000557519.1
ENST00000396020.7 ENST00000554075.2 ENST00000245458.11 |
RPS29
|
ribosomal protein S29 |
| chr8_-_21913661 | 2.37 |
ENST00000518197.1
|
DOK2
|
docking protein 2 |
| chrX_-_49264668 | 2.37 |
ENST00000455775.7
ENST00000652559.1 ENST00000376207.10 ENST00000557224.6 ENST00000684155.1 ENST00000376199.7 |
FOXP3
|
forkhead box P3 |
| chrX_-_132489954 | 2.34 |
ENST00000370844.5
|
MBNL3
|
muscleblind like splicing regulator 3 |
| chrX_-_132489842 | 2.20 |
ENST00000436215.5
|
MBNL3
|
muscleblind like splicing regulator 3 |
| chr2_+_102355750 | 2.17 |
ENST00000233957.7
|
IL18R1
|
interleukin 18 receptor 1 |
| chr6_+_20403679 | 2.07 |
ENST00000535432.2
|
E2F3
|
E2F transcription factor 3 |
| chr9_+_131228109 | 2.05 |
ENST00000498010.2
ENST00000476004.5 ENST00000528406.1 |
NUP214
|
nucleoporin 214 |
| chr9_-_20622479 | 2.03 |
ENST00000380338.9
|
MLLT3
|
MLLT3 super elongation complex subunit |
| chr1_+_21551260 | 2.00 |
ENST00000374832.5
|
ALPL
|
alkaline phosphatase, biomineralization associated |
| chr19_-_55325316 | 1.93 |
ENST00000591570.5
ENST00000326652.9 |
TMEM150B
|
transmembrane protein 150B |
| chr16_+_85555962 | 1.92 |
ENST00000635906.1
|
GSE1
|
Gse1 coiled-coil protein |
| chr16_+_50696999 | 1.92 |
ENST00000300589.6
|
NOD2
|
nucleotide binding oligomerization domain containing 2 |
| chr2_+_102355881 | 1.88 |
ENST00000409599.5
|
IL18R1
|
interleukin 18 receptor 1 |
| chr6_+_15246054 | 1.88 |
ENST00000341776.7
|
JARID2
|
jumonji and AT-rich interaction domain containing 2 |
| chr6_+_31586859 | 1.84 |
ENST00000433492.5
|
LST1
|
leukocyte specific transcript 1 |
| chr12_-_121039204 | 1.81 |
ENST00000620239.5
|
OASL
|
2'-5'-oligoadenylate synthetase like |
| chr12_-_121039236 | 1.80 |
ENST00000257570.9
|
OASL
|
2'-5'-oligoadenylate synthetase like |
| chr14_-_91244669 | 1.74 |
ENST00000650645.1
|
GPR68
|
G protein-coupled receptor 68 |
| chr12_-_121039156 | 1.67 |
ENST00000339275.10
|
OASL
|
2'-5'-oligoadenylate synthetase like |
| chr7_-_37449174 | 1.60 |
ENST00000445322.1
ENST00000448602.5 |
ELMO1
|
engulfment and cell motility 1 |
| chr6_+_31615215 | 1.60 |
ENST00000337917.11
ENST00000376059.8 |
AIF1
|
allograft inflammatory factor 1 |
| chr11_+_72114840 | 1.59 |
ENST00000622388.4
|
FOLR3
|
folate receptor gamma |
| chrX_+_71910818 | 1.56 |
ENST00000633930.1
|
NHSL2
|
NHS like 2 |
| chr6_+_132814566 | 1.56 |
ENST00000230050.4
|
RPS12
|
ribosomal protein S12 |
| chr15_-_40108861 | 1.54 |
ENST00000354670.9
ENST00000559701.5 ENST00000557870.1 ENST00000558774.5 |
BMF
|
Bcl2 modifying factor |
| chr8_+_32548210 | 1.53 |
ENST00000523079.5
ENST00000650919.1 |
NRG1
|
neuregulin 1 |
| chr10_+_112375196 | 1.45 |
ENST00000393081.6
|
ACSL5
|
acyl-CoA synthetase long chain family member 5 |
| chr18_-_63319987 | 1.43 |
ENST00000398117.1
|
BCL2
|
BCL2 apoptosis regulator |
| chr7_+_26291941 | 1.42 |
ENST00000412416.5
|
SNX10
|
sorting nexin 10 |
| chr1_+_206440061 | 1.42 |
ENST00000604925.5
|
SRGAP2
|
SLIT-ROBO Rho GTPase activating protein 2 |
| chr9_-_20621835 | 1.38 |
ENST00000630269.2
|
MLLT3
|
MLLT3 super elongation complex subunit |
| chr11_-_65606959 | 1.38 |
ENST00000532507.5
|
MAP3K11
|
mitogen-activated protein kinase kinase kinase 11 |
| chr7_-_23470469 | 1.37 |
ENST00000258729.8
|
IGF2BP3
|
insulin like growth factor 2 mRNA binding protein 3 |
| chr4_-_112285892 | 1.36 |
ENST00000361717.4
|
TIFA
|
TRAF interacting protein with forkhead associated domain |
| chr17_-_79009778 | 1.31 |
ENST00000591773.5
ENST00000588611.5 ENST00000586916.6 ENST00000592033.5 ENST00000588075.5 ENST00000302345.6 ENST00000591811.1 |
CANT1
|
calcium activated nucleotidase 1 |
| chr7_+_26152188 | 1.29 |
ENST00000056233.4
|
NFE2L3
|
nuclear factor, erythroid 2 like 3 |
| chr16_+_69924984 | 1.28 |
ENST00000568684.1
|
WWP2
|
WW domain containing E3 ubiquitin protein ligase 2 |
| chr6_-_32128191 | 1.28 |
ENST00000453203.2
ENST00000375203.8 ENST00000375201.8 |
ATF6B
|
activating transcription factor 6 beta |
| chr15_-_60398733 | 1.28 |
ENST00000559818.6
|
ANXA2
|
annexin A2 |
| chr22_-_39244969 | 1.25 |
ENST00000331163.11
|
PDGFB
|
platelet derived growth factor subunit B |
| chr12_-_108827384 | 1.24 |
ENST00000326470.9
|
SSH1
|
slingshot protein phosphatase 1 |
| chr11_-_124752247 | 1.24 |
ENST00000326621.10
|
VSIG2
|
V-set and immunoglobulin domain containing 2 |
| chr1_-_85276467 | 1.23 |
ENST00000648566.1
|
BCL10
|
BCL10 immune signaling adaptor |
| chr7_-_138002017 | 1.23 |
ENST00000452463.5
ENST00000456390.5 ENST00000330387.11 |
CREB3L2
|
cAMP responsive element binding protein 3 like 2 |
| chr19_-_35900532 | 1.22 |
ENST00000396901.5
ENST00000641389.2 ENST00000585925.7 |
NFKBID
|
NFKB inhibitor delta |
| chr3_-_142448028 | 1.20 |
ENST00000392981.7
|
XRN1
|
5'-3' exoribonuclease 1 |
| chr8_+_32548303 | 1.18 |
ENST00000650967.1
|
NRG1
|
neuregulin 1 |
| chr16_+_81779279 | 1.16 |
ENST00000564138.6
|
PLCG2
|
phospholipase C gamma 2 |
| chr18_-_55588146 | 1.16 |
ENST00000627784.2
|
TCF4
|
transcription factor 4 |
| chr3_-_142448060 | 1.16 |
ENST00000264951.8
|
XRN1
|
5'-3' exoribonuclease 1 |
| chr16_-_28597042 | 1.13 |
ENST00000533150.5
ENST00000335715.9 |
SULT1A2
|
sulfotransferase family 1A member 2 |
| chr1_+_12063357 | 1.12 |
ENST00000417814.3
|
TNFRSF8
|
TNF receptor superfamily member 8 |
| chr18_-_63319729 | 1.12 |
ENST00000333681.5
|
BCL2
|
BCL2 apoptosis regulator |
| chr18_-_55422492 | 1.09 |
ENST00000561992.5
ENST00000630712.2 |
TCF4
|
transcription factor 4 |
| chr17_-_79009731 | 1.08 |
ENST00000392446.10
ENST00000590370.5 ENST00000591625.5 |
CANT1
|
calcium activated nucleotidase 1 |
| chr11_-_62601223 | 1.06 |
ENST00000527204.5
|
MTA2
|
metastasis associated 1 family member 2 |
| chr18_-_55588184 | 1.03 |
ENST00000354452.8
ENST00000565908.6 ENST00000635822.2 |
TCF4
|
transcription factor 4 |
| chr4_-_140152969 | 1.02 |
ENST00000502696.1
|
MAML3
|
mastermind like transcriptional coactivator 3 |
| chr1_+_12063285 | 1.00 |
ENST00000263932.7
|
TNFRSF8
|
TNF receptor superfamily member 8 |
| chr11_+_20363685 | 1.00 |
ENST00000530266.5
ENST00000451739.7 ENST00000421577.6 ENST00000443524.6 ENST00000419348.6 |
HTATIP2
|
HIV-1 Tat interactive protein 2 |
| chr4_+_47485268 | 0.98 |
ENST00000273859.8
ENST00000504445.1 |
ATP10D
|
ATPase phospholipid transporting 10D (putative) |
| chr2_-_229923163 | 0.97 |
ENST00000435716.5
|
TRIP12
|
thyroid hormone receptor interactor 12 |
| chr16_-_17470953 | 0.96 |
ENST00000261381.7
|
XYLT1
|
xylosyltransferase 1 |
| chr6_-_32838727 | 0.96 |
ENST00000652259.1
ENST00000374897.4 ENST00000620123.4 ENST00000452392.2 |
TAP2
ENSG00000250264.1
|
transporter 2, ATP binding cassette subfamily B member novel protein, TAP2-HLA-DOB readthrough |
| chrX_-_132413567 | 0.95 |
ENST00000538204.5
ENST00000370849.7 |
MBNL3
|
muscleblind like splicing regulator 3 |
| chr7_-_138001794 | 0.92 |
ENST00000616381.4
ENST00000620715.4 |
CREB3L2
|
cAMP responsive element binding protein 3 like 2 |
| chr2_+_202073282 | 0.92 |
ENST00000459709.5
|
KIAA2012
|
KIAA2012 |
| chr3_-_197749688 | 0.91 |
ENST00000273582.9
|
RUBCN
|
rubicon autophagy regulator |
| chr18_+_32091849 | 0.90 |
ENST00000261593.8
ENST00000578914.1 |
RNF138
|
ring finger protein 138 |
| chr2_+_106487349 | 0.89 |
ENST00000643224.2
ENST00000416057.2 |
CD8B2
|
CD8b2 molecule |
| chr12_+_64497968 | 0.89 |
ENST00000676593.1
ENST00000677093.1 |
TBK1
ENSG00000288665.1
|
TANK binding kinase 1 novel transcript |
| chr22_-_37109703 | 0.89 |
ENST00000406856.7
ENST00000676104.1 |
TMPRSS6
|
transmembrane serine protease 6 |
| chr8_-_115668609 | 0.88 |
ENST00000220888.9
|
TRPS1
|
transcriptional repressor GATA binding 1 |
| chr1_-_231241090 | 0.86 |
ENST00000451322.1
|
C1orf131
|
chromosome 1 open reading frame 131 |
| chr21_-_32279012 | 0.85 |
ENST00000290130.4
|
MIS18A
|
MIS18 kinetochore protein A |
| chr18_-_55588535 | 0.83 |
ENST00000566286.5
ENST00000566279.5 ENST00000626595.2 ENST00000564999.5 ENST00000616053.4 ENST00000356073.8 |
TCF4
|
transcription factor 4 |
| chr16_-_84239750 | 0.82 |
ENST00000568181.1
|
KCNG4
|
potassium voltage-gated channel modifier subfamily G member 4 |
| chr19_+_14433384 | 0.82 |
ENST00000586557.5
ENST00000590097.5 |
PKN1
|
protein kinase N1 |
| chr2_-_207624551 | 0.81 |
ENST00000272839.7
ENST00000426075.5 |
METTL21A
|
methyltransferase like 21A |
| chr10_+_113126670 | 0.80 |
ENST00000369389.6
|
TCF7L2
|
transcription factor 7 like 2 |
| chr3_-_9880250 | 0.79 |
ENST00000423850.5
ENST00000336832.7 ENST00000675828.1 ENST00000618572.4 ENST00000455015.6 |
CIDEC
|
cell death inducing DFFA like effector c |
| chr8_+_32548267 | 0.79 |
ENST00000356819.7
|
NRG1
|
neuregulin 1 |
| chr18_-_55422306 | 0.79 |
ENST00000566777.5
ENST00000626584.2 |
TCF4
|
transcription factor 4 |
| chr11_-_124752187 | 0.78 |
ENST00000403470.1
|
VSIG2
|
V-set and immunoglobulin domain containing 2 |
| chr3_-_142448004 | 0.78 |
ENST00000463916.5
|
XRN1
|
5'-3' exoribonuclease 1 |
| chr8_+_11809135 | 0.77 |
ENST00000528643.5
ENST00000525777.5 |
FDFT1
|
farnesyl-diphosphate farnesyltransferase 1 |
| chr18_+_3448456 | 0.75 |
ENST00000549780.5
|
TGIF1
|
TGFB induced factor homeobox 1 |
| chr11_+_12094008 | 0.74 |
ENST00000532179.5
ENST00000526065.1 |
MICAL2
|
microtubule associated monooxygenase, calponin and LIM domain containing 2 |
| chr15_-_40108704 | 0.74 |
ENST00000560430.1
|
BMF
|
Bcl2 modifying factor |
| chrX_-_132413597 | 0.71 |
ENST00000394311.6
|
MBNL3
|
muscleblind like splicing regulator 3 |
| chr2_-_24328113 | 0.70 |
ENST00000622089.4
|
ITSN2
|
intersectin 2 |
| chr20_-_46364385 | 0.68 |
ENST00000243896.6
ENST00000543605.5 ENST00000372230.10 ENST00000317734.12 |
SLC35C2
|
solute carrier family 35 member C2 |
| chr5_+_163503075 | 0.68 |
ENST00000280969.9
|
MAT2B
|
methionine adenosyltransferase 2B |
| chr7_-_22220226 | 0.67 |
ENST00000420196.5
|
RAPGEF5
|
Rap guanine nucleotide exchange factor 5 |
| chr1_-_231241121 | 0.66 |
ENST00000318906.6
ENST00000366649.7 ENST00000366651.7 |
C1orf131
|
chromosome 1 open reading frame 131 |
| chr2_+_203014721 | 0.66 |
ENST00000683091.1
|
NBEAL1
|
neurobeachin like 1 |
| chr3_+_119579676 | 0.66 |
ENST00000357003.7
|
ADPRH
|
ADP-ribosylarginine hydrolase |
| chr8_-_115668896 | 0.65 |
ENST00000519674.1
|
TRPS1
|
transcriptional repressor GATA binding 1 |
| chr1_-_204494752 | 0.64 |
ENST00000684373.1
|
PIK3C2B
|
phosphatidylinositol-4-phosphate 3-kinase catalytic subunit type 2 beta |
| chr2_+_202073249 | 0.63 |
ENST00000498697.3
|
KIAA2012
|
KIAA2012 |
| chr5_-_55692620 | 0.63 |
ENST00000503817.5
ENST00000512595.5 |
SLC38A9
|
solute carrier family 38 member 9 |
| chr21_+_42514523 | 0.63 |
ENST00000398343.2
|
SLC37A1
|
solute carrier family 37 member 1 |
| chr18_+_75210755 | 0.62 |
ENST00000322038.5
|
TSHZ1
|
teashirt zinc finger homeobox 1 |
| chr11_-_64777751 | 0.62 |
ENST00000433274.6
ENST00000432725.1 |
SF1
|
splicing factor 1 |
| chr18_+_75210789 | 0.61 |
ENST00000580243.3
|
TSHZ1
|
teashirt zinc finger homeobox 1 |
| chr1_-_228406761 | 0.61 |
ENST00000366699.3
ENST00000284551.11 |
TRIM11
|
tripartite motif containing 11 |
| chr11_+_46719193 | 0.60 |
ENST00000311907.10
ENST00000530231.5 ENST00000442468.1 |
F2
|
coagulation factor II, thrombin |
| chr3_-_71583713 | 0.60 |
ENST00000649528.3
ENST00000471386.3 ENST00000493089.7 |
FOXP1
|
forkhead box P1 |
| chr14_+_103928432 | 0.60 |
ENST00000409874.9
|
TDRD9
|
tudor domain containing 9 |
| chr11_+_20363780 | 0.60 |
ENST00000532505.1
|
HTATIP2
|
HIV-1 Tat interactive protein 2 |
| chrX_-_102155790 | 0.60 |
ENST00000543160.5
ENST00000333643.4 |
BEX5
|
brain expressed X-linked 5 |
| chr7_+_66921217 | 0.59 |
ENST00000341567.8
ENST00000607045.5 |
TMEM248
|
transmembrane protein 248 |
| chr1_-_152089062 | 0.58 |
ENST00000368806.2
|
TCHHL1
|
trichohyalin like 1 |
| chr5_+_144205250 | 0.57 |
ENST00000507359.3
|
KCTD16
|
potassium channel tetramerization domain containing 16 |
| chr17_+_75093287 | 0.57 |
ENST00000538213.6
ENST00000584118.1 |
SLC16A5
|
solute carrier family 16 member 5 |
| chr18_+_32190033 | 0.57 |
ENST00000269202.11
|
MEP1B
|
meprin A subunit beta |
| chr17_+_16381083 | 0.56 |
ENST00000535788.1
ENST00000302182.8 |
UBB
|
ubiquitin B |
| chr15_-_34210073 | 0.56 |
ENST00000559515.1
ENST00000560108.5 ENST00000256544.8 ENST00000559462.1 |
KATNBL1
|
katanin regulatory subunit B1 like 1 |
| chrX_+_16946650 | 0.56 |
ENST00000357277.8
|
REPS2
|
RALBP1 associated Eps domain containing 2 |
| chr12_+_861124 | 0.55 |
ENST00000676347.1
|
WNK1
|
WNK lysine deficient protein kinase 1 |
| chr9_-_120914549 | 0.55 |
ENST00000546084.5
|
TRAF1
|
TNF receptor associated factor 1 |
| chr3_+_69084973 | 0.55 |
ENST00000478935.1
|
ARL6IP5
|
ADP ribosylation factor like GTPase 6 interacting protein 5 |
| chr8_+_41490396 | 0.53 |
ENST00000518270.5
ENST00000520817.5 |
GOLGA7
|
golgin A7 |
| chr4_+_94207845 | 0.53 |
ENST00000457823.6
ENST00000354268.9 |
SMARCAD1
|
SWI/SNF-related, matrix-associated actin-dependent regulator of chromatin, subfamily a, containing DEAD/H box 1 |
| chr9_-_120926752 | 0.52 |
ENST00000373887.8
|
TRAF1
|
TNF receptor associated factor 1 |
| chr18_+_32190015 | 0.51 |
ENST00000581447.1
|
MEP1B
|
meprin A subunit beta |
| chr10_-_114768061 | 0.51 |
ENST00000651092.1
|
ABLIM1
|
actin binding LIM protein 1 |
| chr18_-_5396265 | 0.51 |
ENST00000579951.2
|
EPB41L3
|
erythrocyte membrane protein band 4.1 like 3 |
| chr8_-_673547 | 0.50 |
ENST00000522893.1
|
ERICH1
|
glutamate rich 1 |
| chr12_+_116559381 | 0.49 |
ENST00000556529.4
|
MAP1LC3B2
|
microtubule associated protein 1 light chain 3 beta 2 |
| chr4_+_108650644 | 0.49 |
ENST00000512478.2
|
OSTC
|
oligosaccharyltransferase complex non-catalytic subunit |
| chr2_-_85612023 | 0.48 |
ENST00000409734.3
ENST00000306336.6 |
C2orf68
|
chromosome 2 open reading frame 68 |
| chr4_-_175812746 | 0.48 |
ENST00000393658.6
|
GPM6A
|
glycoprotein M6A |
| chr12_-_56752311 | 0.48 |
ENST00000338193.11
ENST00000550770.1 |
PRIM1
|
DNA primase subunit 1 |
| chr16_+_53054973 | 0.47 |
ENST00000447540.6
ENST00000615216.4 ENST00000566029.5 |
CHD9
|
chromodomain helicase DNA binding protein 9 |
| chr18_+_31447732 | 0.46 |
ENST00000257189.5
|
DSG3
|
desmoglein 3 |
| chr5_-_175968280 | 0.45 |
ENST00000513482.1
ENST00000265097.9 ENST00000628318.2 |
THOC3
|
THO complex 3 |
| chr16_-_84240012 | 0.43 |
ENST00000308251.6
|
KCNG4
|
potassium voltage-gated channel modifier subfamily G member 4 |
| chr15_+_80152978 | 0.42 |
ENST00000561421.6
ENST00000684363.1 |
FAH
|
fumarylacetoacetate hydrolase |
| chr10_-_68232108 | 0.41 |
ENST00000373673.5
|
ATOH7
|
atonal bHLH transcription factor 7 |
| chr12_-_16610037 | 0.41 |
ENST00000540590.1
|
LMO3
|
LIM domain only 3 |
| chr11_-_62707331 | 0.40 |
ENST00000533982.1
|
BSCL2
|
BSCL2 lipid droplet biogenesis associated, seipin |
| chr10_+_72893572 | 0.39 |
ENST00000622652.1
|
OIT3
|
oncoprotein induced transcript 3 |
| chr14_-_68793055 | 0.38 |
ENST00000439696.3
|
ZFP36L1
|
ZFP36 ring finger protein like 1 |
| chr1_-_151346806 | 0.37 |
ENST00000392746.7
|
RFX5
|
regulatory factor X5 |
| chr18_-_55422262 | 0.37 |
ENST00000629343.2
|
TCF4
|
transcription factor 4 |
| chr19_+_38289138 | 0.37 |
ENST00000590738.1
ENST00000587519.4 ENST00000591889.2 |
SPINT2
ENSG00000267748.4
|
serine peptidase inhibitor, Kunitz type 2 novel protein |
| chr2_-_179264757 | 0.36 |
ENST00000428443.8
|
SESTD1
|
SEC14 and spectrin domain containing 1 |
| chr5_-_133968578 | 0.36 |
ENST00000231512.5
|
C5orf15
|
chromosome 5 open reading frame 15 |
| chr2_-_207624983 | 0.36 |
ENST00000448007.6
ENST00000432416.5 ENST00000411432.5 ENST00000458426.5 ENST00000406927.6 ENST00000425132.5 |
METTL21A
|
methyltransferase like 21A |
| chr3_-_128153782 | 0.36 |
ENST00000464873.5
|
RUVBL1
|
RuvB like AAA ATPase 1 |
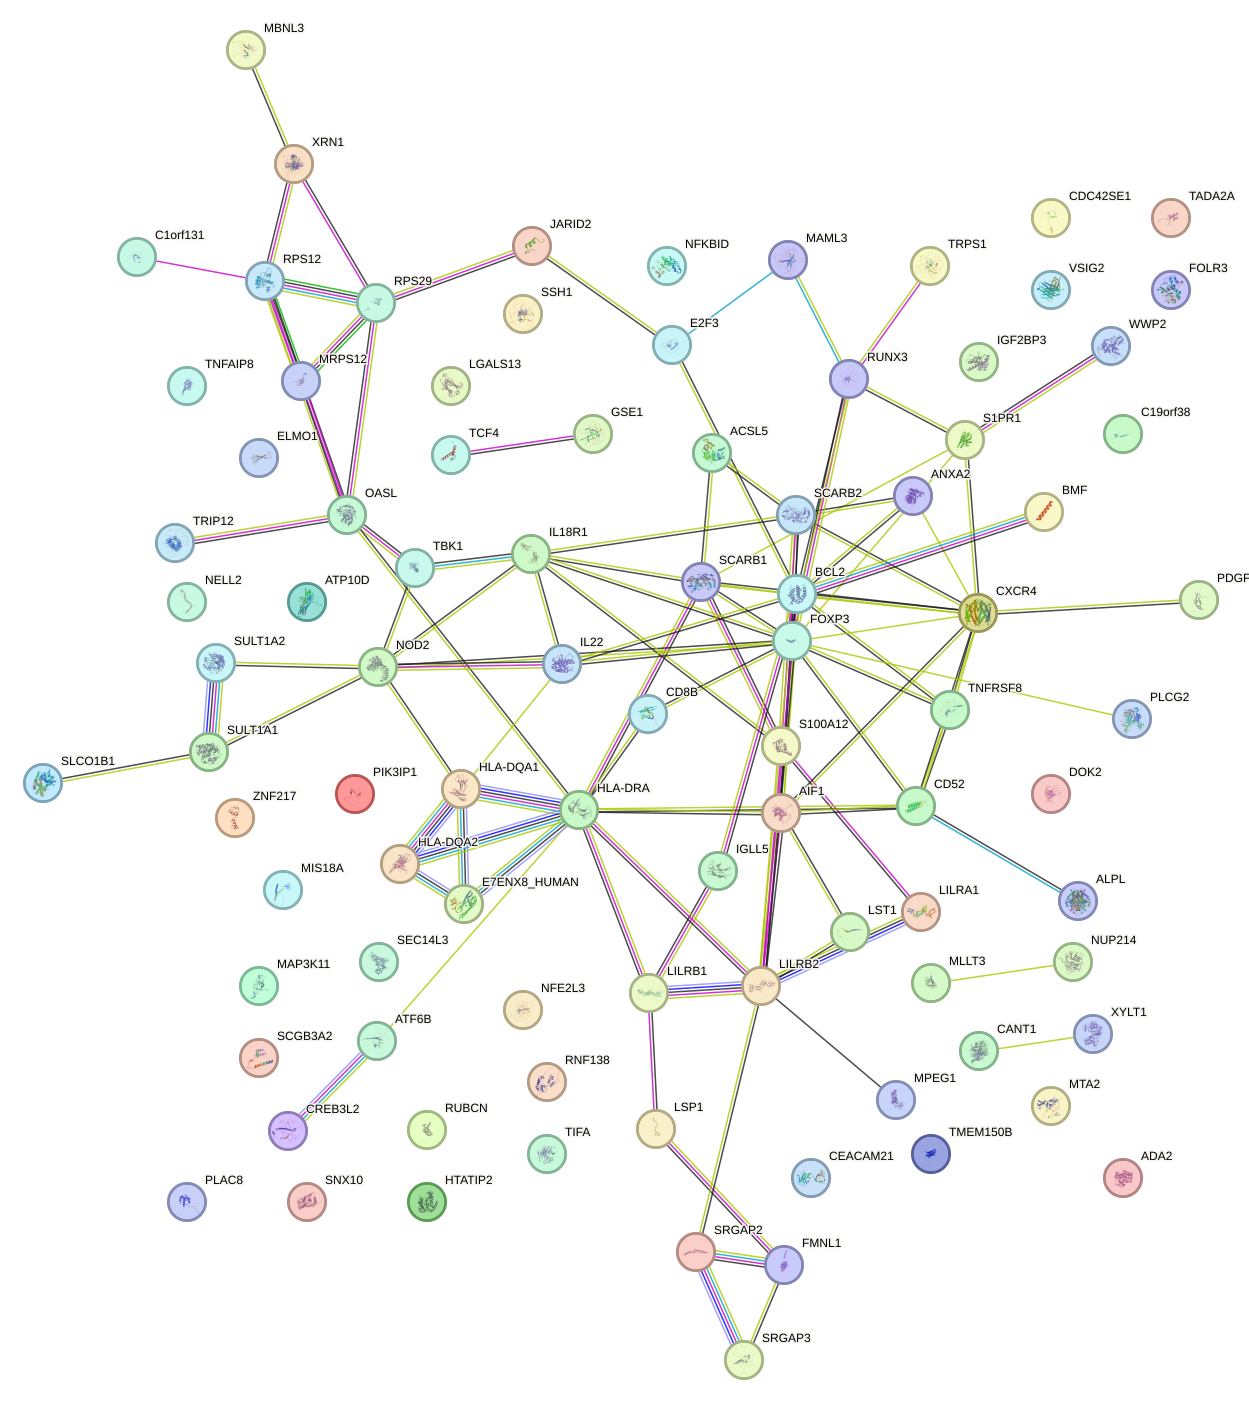
Network of associatons between targets according to the STRING database.
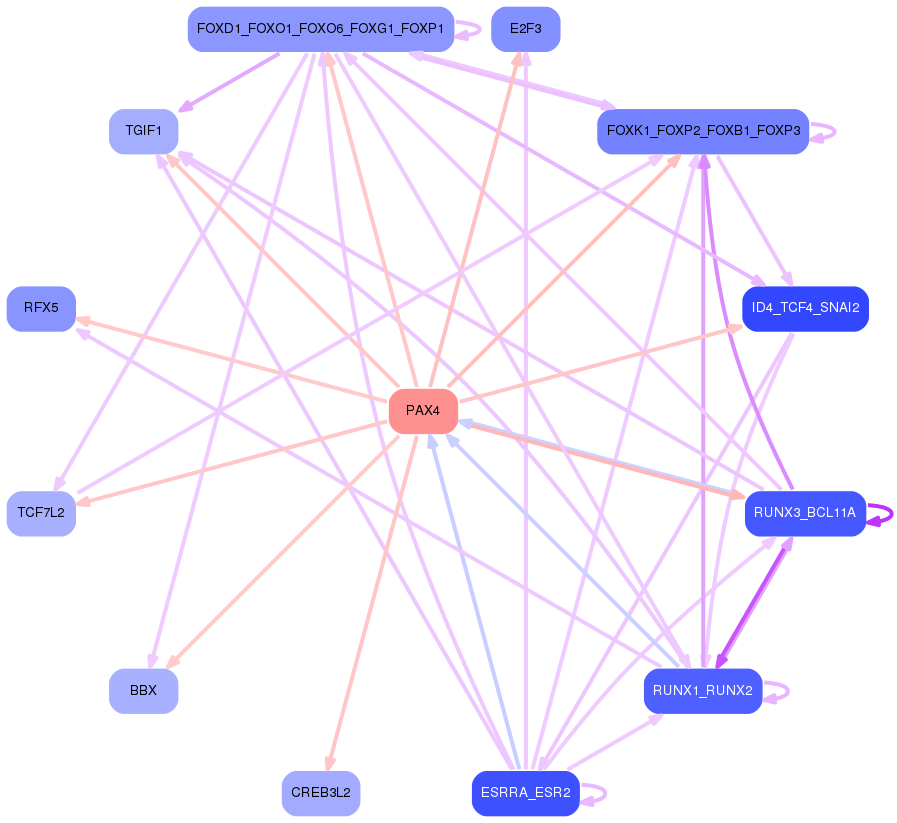
First level regulatory network of PAX4
Gene Ontology Analysis
Gene overrepresentation in biological process category:
| Log-likelihood per target | Total log-likelihood | Term | Description |
|---|---|---|---|
| 2.0 | 10.2 | GO:0003245 | cardiac muscle tissue growth involved in heart morphogenesis(GO:0003245) |
| 1.5 | 11.7 | GO:0002774 | Fc receptor mediated inhibitory signaling pathway(GO:0002774) |
| 1.4 | 4.1 | GO:0002503 | peptide antigen assembly with MHC class II protein complex(GO:0002503) |
| 1.0 | 6.8 | GO:0006154 | adenosine catabolic process(GO:0006154) inosine biosynthetic process(GO:0046103) |
| 0.8 | 8.4 | GO:0044800 | fusion of virus membrane with host plasma membrane(GO:0019064) membrane fusion involved in viral entry into host cell(GO:0039663) multi-organism membrane fusion(GO:0044800) |
| 0.8 | 10.4 | GO:2000334 | response to linoleic acid(GO:0070543) blood microparticle formation(GO:0072564) regulation of blood microparticle formation(GO:2000332) positive regulation of blood microparticle formation(GO:2000334) |
| 0.8 | 2.4 | GO:0002458 | peripheral T cell tolerance induction(GO:0002458) peripheral tolerance induction(GO:0002465) |
| 0.7 | 2.1 | GO:0045553 | TRAIL biosynthetic process(GO:0045553) regulation of TRAIL biosynthetic process(GO:0045554) positive regulation of TRAIL biosynthetic process(GO:0045556) |
| 0.7 | 2.0 | GO:0071529 | cementum mineralization(GO:0071529) |
| 0.7 | 5.3 | GO:0035655 | interleukin-18-mediated signaling pathway(GO:0035655) |
| 0.6 | 3.1 | GO:0071409 | cellular response to cycloheximide(GO:0071409) |
| 0.6 | 3.5 | GO:1903904 | negative regulation of establishment of T cell polarity(GO:1903904) negative regulation of Rho guanyl-nucleotide exchange factor activity(GO:2001107) |
| 0.5 | 2.6 | GO:0046671 | negative regulation of cellular pH reduction(GO:0032848) CD8-positive, alpha-beta T cell lineage commitment(GO:0043375) negative regulation of retinal cell programmed cell death(GO:0046671) |
| 0.5 | 1.9 | GO:0032499 | detection of peptidoglycan(GO:0032499) activation of MAPK activity involved in innate immune response(GO:0035419) regulation of prostaglandin-endoperoxide synthase activity(GO:0060584) positive regulation of prostaglandin-endoperoxide synthase activity(GO:0060585) |
| 0.5 | 8.9 | GO:0070050 | neuron cellular homeostasis(GO:0070050) |
| 0.4 | 1.2 | GO:1904717 | excitatory chemical synaptic transmission(GO:0098976) regulation of AMPA glutamate receptor clustering(GO:1904717) positive regulation of AMPA glutamate receptor clustering(GO:1904719) |
| 0.4 | 10.6 | GO:0006068 | ethanol catabolic process(GO:0006068) |
| 0.4 | 1.2 | GO:0002316 | follicular B cell differentiation(GO:0002316) |
| 0.3 | 3.8 | GO:0043553 | negative regulation of phosphatidylinositol 3-kinase activity(GO:0043553) |
| 0.3 | 1.0 | GO:0002428 | antigen processing and presentation of peptide antigen via MHC class Ib(GO:0002428) cytosol to ER transport(GO:0046967) |
| 0.3 | 1.3 | GO:0044035 | multi-organism catabolic process(GO:0044035) development of symbiont involved in interaction with host(GO:0044115) modulation of development of symbiont involved in interaction with host(GO:0044145) negative regulation of development of symbiont involved in interaction with host(GO:0044147) metabolism of substance in other organism involved in symbiotic interaction(GO:0052214) catabolism of substance in other organism involved in symbiotic interaction(GO:0052227) metabolism of macromolecule in other organism involved in symbiotic interaction(GO:0052229) catabolism by host of symbiont macromolecule(GO:0052360) catabolism by organism of macromolecule in other organism involved in symbiotic interaction(GO:0052361) catabolism by host of symbiont protein(GO:0052362) catabolism by organism of protein in other organism involved in symbiotic interaction(GO:0052363) catabolism by host of substance in symbiont(GO:0052364) metabolism by host of symbiont macromolecule(GO:0052416) metabolism by host of symbiont protein(GO:0052417) metabolism by organism of protein in other organism involved in symbiotic interaction(GO:0052418) metabolism by host of substance in symbiont(GO:0052419) |
| 0.3 | 1.2 | GO:0002901 | mature B cell apoptotic process(GO:0002901) regulation of mature B cell apoptotic process(GO:0002905) negative regulation of mature B cell apoptotic process(GO:0002906) |
| 0.3 | 1.6 | GO:0014738 | regulation of muscle hyperplasia(GO:0014738) |
| 0.3 | 6.7 | GO:0040015 | negative regulation of multicellular organism growth(GO:0040015) |
| 0.2 | 0.7 | GO:0019417 | sulfur oxidation(GO:0019417) |
| 0.2 | 5.8 | GO:0051014 | actin filament severing(GO:0051014) |
| 0.2 | 2.1 | GO:0070345 | negative regulation of fat cell proliferation(GO:0070345) |
| 0.2 | 3.5 | GO:0038129 | directional guidance of interneurons involved in migration from the subpallium to the cortex(GO:0021840) chemorepulsion involved in interneuron migration from the subpallium to the cortex(GO:0021842) ERBB3 signaling pathway(GO:0038129) |
| 0.2 | 1.1 | GO:0035407 | histone H3-T11 phosphorylation(GO:0035407) |
| 0.2 | 1.2 | GO:0060023 | soft palate development(GO:0060023) |
| 0.2 | 1.7 | GO:2001206 | positive regulation of osteoclast development(GO:2001206) |
| 0.2 | 0.7 | GO:0006556 | S-adenosylmethionine biosynthetic process(GO:0006556) |
| 0.2 | 0.7 | GO:0006542 | glutamine biosynthetic process(GO:0006542) |
| 0.2 | 3.4 | GO:2000096 | positive regulation of Wnt signaling pathway, planar cell polarity pathway(GO:2000096) |
| 0.2 | 8.3 | GO:0050832 | defense response to fungus(GO:0050832) |
| 0.2 | 7.1 | GO:0045730 | respiratory burst(GO:0045730) |
| 0.2 | 18.5 | GO:0032945 | negative regulation of mononuclear cell proliferation(GO:0032945) negative regulation of lymphocyte proliferation(GO:0050672) |
| 0.2 | 1.2 | GO:0070245 | positive regulation of thymocyte apoptotic process(GO:0070245) |
| 0.2 | 0.6 | GO:1900738 | positive regulation of phospholipase C-activating G-protein coupled receptor signaling pathway(GO:1900738) |
| 0.2 | 6.2 | GO:0045662 | negative regulation of myoblast differentiation(GO:0045662) |
| 0.1 | 4.1 | GO:0048934 | peripheral nervous system neuron differentiation(GO:0048934) peripheral nervous system neuron development(GO:0048935) |
| 0.1 | 0.8 | GO:0008204 | ergosterol biosynthetic process(GO:0006696) ergosterol metabolic process(GO:0008204) |
| 0.1 | 0.9 | GO:0044565 | dendritic cell proliferation(GO:0044565) |
| 0.1 | 1.4 | GO:0007256 | activation of JNKK activity(GO:0007256) |
| 0.1 | 0.8 | GO:0006269 | DNA replication, synthesis of RNA primer(GO:0006269) |
| 0.1 | 1.0 | GO:1901314 | negative regulation of histone ubiquitination(GO:0033183) regulation of histone H2A K63-linked ubiquitination(GO:1901314) negative regulation of histone H2A K63-linked ubiquitination(GO:1901315) |
| 0.1 | 1.0 | GO:1902527 | positive regulation of intrinsic apoptotic signaling pathway by p53 class mediator(GO:1902255) positive regulation of protein monoubiquitination(GO:1902527) |
| 0.1 | 1.9 | GO:0051574 | positive regulation of histone H3-K9 methylation(GO:0051574) |
| 0.1 | 0.6 | GO:0023016 | signal transduction by trans-phosphorylation(GO:0023016) |
| 0.1 | 0.5 | GO:0002036 | regulation of L-glutamate transport(GO:0002036) |
| 0.1 | 0.9 | GO:0010792 | DNA double-strand break processing involved in repair via single-strand annealing(GO:0010792) |
| 0.1 | 1.6 | GO:0015884 | folic acid transport(GO:0015884) |
| 0.1 | 1.3 | GO:1990440 | positive regulation of transcription from RNA polymerase II promoter in response to endoplasmic reticulum stress(GO:1990440) |
| 0.1 | 0.8 | GO:0018230 | peptidyl-L-cysteine S-palmitoylation(GO:0018230) peptidyl-S-diacylglycerol-L-cysteine biosynthetic process from peptidyl-cysteine(GO:0018231) |
| 0.1 | 0.4 | GO:0097403 | cellular response to raffinose(GO:0097403) response to raffinose(GO:1901545) |
| 0.1 | 0.6 | GO:0046598 | positive regulation of viral entry into host cell(GO:0046598) |
| 0.1 | 0.3 | GO:0090135 | actin filament branching(GO:0090135) protein localization to cell leading edge(GO:1902463) |
| 0.1 | 0.9 | GO:0048625 | myoblast fate commitment(GO:0048625) |
| 0.1 | 0.7 | GO:0006572 | tyrosine catabolic process(GO:0006572) |
| 0.1 | 0.7 | GO:0051725 | protein de-ADP-ribosylation(GO:0051725) |
| 0.1 | 4.6 | GO:0050690 | regulation of defense response to virus by virus(GO:0050690) |
| 0.1 | 2.3 | GO:0032464 | positive regulation of protein homooligomerization(GO:0032464) |
| 0.1 | 0.2 | GO:2000395 | regulation of ubiquitin-dependent endocytosis(GO:2000395) positive regulation of ubiquitin-dependent endocytosis(GO:2000397) |
| 0.1 | 0.3 | GO:0046121 | deoxyribonucleoside catabolic process(GO:0046121) |
| 0.1 | 0.6 | GO:0000389 | mRNA 3'-splice site recognition(GO:0000389) |
| 0.1 | 0.4 | GO:0060672 | epithelial cell differentiation involved in embryonic placenta development(GO:0060671) epithelial cell morphogenesis involved in placental branching(GO:0060672) |
| 0.1 | 0.2 | GO:1902173 | negative regulation of keratinocyte apoptotic process(GO:1902173) |
| 0.1 | 1.0 | GO:0007221 | positive regulation of transcription of Notch receptor target(GO:0007221) |
| 0.1 | 10.4 | GO:0060333 | interferon-gamma-mediated signaling pathway(GO:0060333) |
| 0.0 | 0.7 | GO:0015781 | pyrimidine nucleotide-sugar transport(GO:0015781) |
| 0.0 | 0.3 | GO:2000546 | positive regulation of cell chemotaxis to fibroblast growth factor(GO:1904849) positive regulation of endothelial cell chemotaxis to fibroblast growth factor(GO:2000546) |
| 0.0 | 0.7 | GO:0070777 | D-aspartate transport(GO:0070777) D-aspartate import(GO:0070779) |
| 0.0 | 0.2 | GO:2001271 | negative regulation of cysteine-type endopeptidase activity involved in execution phase of apoptosis(GO:2001271) |
| 0.0 | 3.7 | GO:0034260 | negative regulation of GTPase activity(GO:0034260) |
| 0.0 | 1.2 | GO:0034389 | lipid particle organization(GO:0034389) |
| 0.0 | 2.7 | GO:0006910 | phagocytosis, recognition(GO:0006910) |
| 0.0 | 0.9 | GO:0097264 | self proteolysis(GO:0097264) |
| 0.0 | 0.6 | GO:0046784 | viral mRNA export from host cell nucleus(GO:0046784) |
| 0.0 | 1.4 | GO:0006607 | NLS-bearing protein import into nucleus(GO:0006607) |
| 0.0 | 1.4 | GO:0071539 | protein localization to centrosome(GO:0071539) |
| 0.0 | 0.5 | GO:0002175 | protein localization to paranode region of axon(GO:0002175) |
| 0.0 | 2.0 | GO:0071431 | tRNA export from nucleus(GO:0006409) tRNA-containing ribonucleoprotein complex export from nucleus(GO:0071431) |
| 0.0 | 0.6 | GO:0032625 | interleukin-21 production(GO:0032625) interleukin-21 secretion(GO:0072619) |
| 0.0 | 0.8 | GO:0044030 | regulation of DNA methylation(GO:0044030) |
| 0.0 | 0.1 | GO:0046901 | tetrahydrofolylpolyglutamate biosynthetic process(GO:0046901) |
| 0.0 | 1.5 | GO:0035338 | long-chain fatty-acyl-CoA biosynthetic process(GO:0035338) |
| 0.0 | 4.3 | GO:0006614 | SRP-dependent cotranslational protein targeting to membrane(GO:0006614) |
| 0.0 | 0.6 | GO:0034587 | piRNA metabolic process(GO:0034587) |
| 0.0 | 3.4 | GO:0030166 | proteoglycan biosynthetic process(GO:0030166) |
| 0.0 | 2.7 | GO:0006968 | cellular defense response(GO:0006968) |
| 0.0 | 1.0 | GO:0045332 | phospholipid translocation(GO:0045332) |
| 0.0 | 1.3 | GO:0070534 | protein K63-linked ubiquitination(GO:0070534) |
| 0.0 | 0.2 | GO:0060290 | transdifferentiation(GO:0060290) |
| 0.0 | 0.5 | GO:0006995 | cellular response to nitrogen starvation(GO:0006995) cellular response to nitrogen levels(GO:0043562) |
| 0.0 | 1.1 | GO:0043044 | ATP-dependent chromatin remodeling(GO:0043044) |
| 0.0 | 0.3 | GO:0016554 | cytidine to uridine editing(GO:0016554) |
| 0.0 | 0.5 | GO:0000729 | DNA double-strand break processing(GO:0000729) |
| 0.0 | 0.1 | GO:0048388 | endosomal lumen acidification(GO:0048388) |
| 0.0 | 0.2 | GO:0051684 | maintenance of Golgi location(GO:0051684) |
| 0.0 | 6.1 | GO:0065004 | protein-DNA complex assembly(GO:0065004) |
| 0.0 | 2.9 | GO:0043154 | negative regulation of cysteine-type endopeptidase activity involved in apoptotic process(GO:0043154) |
| 0.0 | 1.1 | GO:1901998 | toxin transport(GO:1901998) |
| 0.0 | 0.2 | GO:0038203 | TORC2 signaling(GO:0038203) |
| 0.0 | 0.4 | GO:0021554 | optic nerve development(GO:0021554) |
| 0.0 | 2.1 | GO:0002062 | chondrocyte differentiation(GO:0002062) |
| 0.0 | 1.4 | GO:0042035 | regulation of cytokine biosynthetic process(GO:0042035) |
| 0.0 | 0.3 | GO:0031293 | membrane protein intracellular domain proteolysis(GO:0031293) |
| 0.0 | 0.1 | GO:0006235 | dTTP biosynthetic process(GO:0006235) pyrimidine deoxyribonucleoside triphosphate biosynthetic process(GO:0009212) |
| 0.0 | 0.2 | GO:0043402 | glucocorticoid mediated signaling pathway(GO:0043402) |
| 0.0 | 0.3 | GO:0070262 | peptidyl-serine dephosphorylation(GO:0070262) |
| 0.0 | 0.1 | GO:2000324 | positive regulation of glucocorticoid receptor signaling pathway(GO:2000324) |
| 0.0 | 0.5 | GO:0032008 | positive regulation of TOR signaling(GO:0032008) |
Gene overrepresentation in cellular component category:
| Log-likelihood per target | Total log-likelihood | Term | Description |
|---|---|---|---|
| 0.5 | 9.2 | GO:0042613 | MHC class II protein complex(GO:0042613) |
| 0.3 | 2.0 | GO:1990876 | cytoplasmic side of nuclear pore(GO:1990876) |
| 0.3 | 3.5 | GO:0060171 | stereocilium membrane(GO:0060171) |
| 0.3 | 1.3 | GO:1990667 | PCSK9-AnxA2 complex(GO:1990667) |
| 0.2 | 0.7 | GO:0048269 | methionine adenosyltransferase complex(GO:0048269) |
| 0.2 | 1.2 | GO:0032449 | CBM complex(GO:0032449) |
| 0.2 | 10.4 | GO:0031092 | platelet alpha granule membrane(GO:0031092) |
| 0.2 | 2.0 | GO:0065010 | extracellular membrane-bounded organelle(GO:0065010) |
| 0.2 | 3.2 | GO:0032059 | bleb(GO:0032059) |
| 0.1 | 1.0 | GO:0042825 | TAP complex(GO:0042825) |
| 0.1 | 1.4 | GO:0031313 | extrinsic component of endosome membrane(GO:0031313) |
| 0.1 | 0.8 | GO:0005658 | alpha DNA polymerase:primase complex(GO:0005658) |
| 0.1 | 0.6 | GO:0071547 | piP-body(GO:0071547) |
| 0.1 | 2.8 | GO:0071682 | endocytic vesicle lumen(GO:0071682) |
| 0.1 | 2.6 | GO:0046930 | pore complex(GO:0046930) |
| 0.1 | 3.0 | GO:0042101 | T cell receptor complex(GO:0042101) |
| 0.1 | 13.6 | GO:0035578 | azurophil granule lumen(GO:0035578) |
| 0.1 | 1.4 | GO:0044327 | dendritic spine head(GO:0044327) |
| 0.1 | 6.3 | GO:0022627 | cytosolic small ribosomal subunit(GO:0022627) |
| 0.1 | 0.2 | GO:0002947 | tumor necrosis factor receptor superfamily complex(GO:0002947) |
| 0.1 | 0.9 | GO:0070369 | beta-catenin-TCF7L2 complex(GO:0070369) |
| 0.1 | 0.6 | GO:0071986 | Ragulator complex(GO:0071986) |
| 0.1 | 1.6 | GO:0032045 | guanyl-nucleotide exchange factor complex(GO:0032045) |
| 0.1 | 4.8 | GO:1904724 | tertiary granule lumen(GO:1904724) |
| 0.1 | 3.8 | GO:0030673 | axolemma(GO:0030673) |
| 0.1 | 6.8 | GO:0101003 | ficolin-1-rich granule membrane(GO:0101003) |
| 0.1 | 1.9 | GO:0035098 | ESC/E(Z) complex(GO:0035098) |
| 0.0 | 2.7 | GO:0042571 | immunoglobulin complex, circulating(GO:0042571) |
| 0.0 | 0.6 | GO:0000445 | THO complex(GO:0000347) THO complex part of transcription export complex(GO:0000445) |
| 0.0 | 1.6 | GO:0001891 | phagocytic cup(GO:0001891) |
| 0.0 | 0.8 | GO:0008250 | oligosaccharyltransferase complex(GO:0008250) |
| 0.0 | 3.4 | GO:0008023 | transcription elongation factor complex(GO:0008023) |
| 0.0 | 0.2 | GO:0000801 | central element(GO:0000801) |
| 0.0 | 1.1 | GO:0016581 | NuRD complex(GO:0016581) CHD-type complex(GO:0090545) |
| 0.0 | 12.1 | GO:0009897 | external side of plasma membrane(GO:0009897) |
| 0.0 | 1.4 | GO:0035861 | site of double-strand break(GO:0035861) |
| 0.0 | 7.1 | GO:0032993 | protein-DNA complex(GO:0032993) |
| 0.0 | 1.9 | GO:0008180 | COP9 signalosome(GO:0008180) |
| 0.0 | 1.0 | GO:0044322 | endoplasmic reticulum quality control compartment(GO:0044322) |
| 0.0 | 0.3 | GO:0070765 | gamma-secretase complex(GO:0070765) |
| 0.0 | 4.9 | GO:0031225 | anchored component of membrane(GO:0031225) |
| 0.0 | 8.1 | GO:0034774 | secretory granule lumen(GO:0034774) |
| 0.0 | 8.8 | GO:0005770 | late endosome(GO:0005770) |
| 0.0 | 2.4 | GO:0000118 | histone deacetylase complex(GO:0000118) |
| 0.0 | 0.5 | GO:0000421 | autophagosome membrane(GO:0000421) |
| 0.0 | 0.7 | GO:0033116 | endoplasmic reticulum-Golgi intermediate compartment membrane(GO:0033116) |
| 0.0 | 0.4 | GO:0000812 | Swr1 complex(GO:0000812) |
| 0.0 | 3.5 | GO:0000932 | cytoplasmic mRNA processing body(GO:0000932) |
| 0.0 | 0.7 | GO:0097386 | glial cell projection(GO:0097386) |
| 0.0 | 0.1 | GO:0070044 | synaptobrevin 2-SNAP-25-syntaxin-1a complex(GO:0070044) |
| 0.0 | 4.0 | GO:0005741 | mitochondrial outer membrane(GO:0005741) |
| 0.0 | 16.7 | GO:0000139 | Golgi membrane(GO:0000139) |
| 0.0 | 0.5 | GO:0030057 | desmosome(GO:0030057) |
| 0.0 | 0.1 | GO:0005672 | transcription factor TFIIA complex(GO:0005672) |
| 0.0 | 0.2 | GO:0061700 | GATOR2 complex(GO:0061700) |
| 0.0 | 0.5 | GO:0044295 | axonal growth cone(GO:0044295) |
| 0.0 | 0.4 | GO:0005942 | phosphatidylinositol 3-kinase complex(GO:0005942) |
| 0.0 | 1.0 | GO:0005811 | lipid particle(GO:0005811) |
| 0.0 | 4.8 | GO:0000790 | nuclear chromatin(GO:0000790) |
| 0.0 | 2.3 | GO:0030496 | midbody(GO:0030496) |
Gene overrepresentation in molecular function category:
| Log-likelihood per target | Total log-likelihood | Term | Description |
|---|---|---|---|
| 1.8 | 10.6 | GO:0047894 | flavonol 3-sulfotransferase activity(GO:0047894) |
| 1.5 | 11.7 | GO:0032396 | inhibitory MHC class I receptor activity(GO:0032396) |
| 1.4 | 4.1 | GO:0042008 | interleukin-18 receptor activity(GO:0042008) |
| 0.9 | 10.4 | GO:0070892 | lipoteichoic acid receptor activity(GO:0070892) |
| 0.6 | 8.4 | GO:0032027 | myosin light chain binding(GO:0032027) |
| 0.6 | 6.8 | GO:0031685 | adenosine receptor binding(GO:0031685) |
| 0.6 | 2.4 | GO:0004382 | guanosine-diphosphatase activity(GO:0004382) |
| 0.5 | 9.2 | GO:0032395 | MHC class II receptor activity(GO:0032395) |
| 0.5 | 10.2 | GO:0038036 | sphingosine-1-phosphate receptor activity(GO:0038036) |
| 0.5 | 3.1 | GO:0004534 | 5'-3' exoribonuclease activity(GO:0004534) |
| 0.4 | 8.1 | GO:0050786 | RAGE receptor binding(GO:0050786) |
| 0.3 | 5.3 | GO:0001730 | 2'-5'-oligoadenylate synthetase activity(GO:0001730) |
| 0.3 | 1.0 | GO:0030158 | protein xylosyltransferase activity(GO:0030158) |
| 0.3 | 2.0 | GO:0004035 | alkaline phosphatase activity(GO:0004035) |
| 0.3 | 6.1 | GO:0005522 | profilin binding(GO:0005522) |
| 0.2 | 1.4 | GO:0004706 | JUN kinase kinase kinase activity(GO:0004706) |
| 0.2 | 1.0 | GO:0015433 | peptide antigen-transporting ATPase activity(GO:0015433) |
| 0.2 | 5.4 | GO:0005068 | transmembrane receptor protein tyrosine kinase adaptor activity(GO:0005068) |
| 0.2 | 5.8 | GO:0001087 | transcription factor activity, sequence-specific DNA binding, RNA polymerase recruiting(GO:0001011) transcription factor activity, TFIIB-class binding(GO:0001087) |
| 0.2 | 2.6 | GO:0051434 | BH3 domain binding(GO:0051434) |
| 0.2 | 1.1 | GO:0035402 | histone kinase activity (H3-T11 specific)(GO:0035402) |
| 0.2 | 2.4 | GO:0051525 | NFAT protein binding(GO:0051525) |
| 0.2 | 0.7 | GO:0016211 | glutamate-ammonia ligase activity(GO:0004356) ammonia ligase activity(GO:0016211) acid-ammonia (or amide) ligase activity(GO:0016880) |
| 0.2 | 3.5 | GO:0043125 | ErbB-3 class receptor binding(GO:0043125) |
| 0.2 | 0.8 | GO:0003896 | DNA primase activity(GO:0003896) |
| 0.2 | 0.6 | GO:0070053 | thrombospondin receptor activity(GO:0070053) |
| 0.1 | 0.7 | GO:0016823 | hydrolase activity, acting on acid carbon-carbon bonds(GO:0016822) hydrolase activity, acting on acid carbon-carbon bonds, in ketonic substances(GO:0016823) |
| 0.1 | 1.3 | GO:0019834 | phospholipase A2 inhibitor activity(GO:0019834) |
| 0.1 | 0.8 | GO:0004310 | farnesyl-diphosphate farnesyltransferase activity(GO:0004310) squalene synthase activity(GO:0051996) |
| 0.1 | 0.6 | GO:0001727 | lipid kinase activity(GO:0001727) |
| 0.1 | 0.6 | GO:0045131 | pre-mRNA branch point binding(GO:0045131) |
| 0.1 | 2.1 | GO:0048406 | nerve growth factor binding(GO:0048406) |
| 0.1 | 3.0 | GO:0042288 | MHC class I protein binding(GO:0042288) |
| 0.1 | 3.7 | GO:0005095 | GTPase inhibitor activity(GO:0005095) |
| 0.1 | 0.7 | GO:0003875 | ADP-ribosylarginine hydrolase activity(GO:0003875) |
| 0.1 | 1.9 | GO:0050700 | CARD domain binding(GO:0050700) |
| 0.1 | 3.4 | GO:0035497 | cAMP response element binding(GO:0035497) |
| 0.1 | 2.0 | GO:0005049 | nuclear export signal receptor activity(GO:0005049) |
| 0.1 | 1.2 | GO:0016176 | superoxide-generating NADPH oxidase activator activity(GO:0016176) |
| 0.1 | 1.6 | GO:0005542 | folic acid binding(GO:0005542) |
| 0.1 | 3.9 | GO:0071889 | 14-3-3 protein binding(GO:0071889) |
| 0.1 | 2.9 | GO:0043548 | phosphatidylinositol 3-kinase binding(GO:0043548) |
| 0.1 | 1.1 | GO:0031996 | thioesterase binding(GO:0031996) |
| 0.1 | 3.3 | GO:0043027 | cysteine-type endopeptidase inhibitor activity involved in apoptotic process(GO:0043027) |
| 0.1 | 0.8 | GO:0004579 | dolichyl-diphosphooligosaccharide-protein glycotransferase activity(GO:0004579) |
| 0.1 | 0.4 | GO:0043141 | ATP-dependent 5'-3' DNA helicase activity(GO:0043141) |
| 0.1 | 1.5 | GO:0102391 | decanoate--CoA ligase activity(GO:0102391) |
| 0.0 | 1.2 | GO:0043422 | protein kinase B binding(GO:0043422) |
| 0.0 | 0.7 | GO:0015501 | glutamate:sodium symporter activity(GO:0015501) |
| 0.0 | 2.7 | GO:0034987 | immunoglobulin receptor binding(GO:0034987) |
| 0.0 | 0.6 | GO:0019869 | chloride channel inhibitor activity(GO:0019869) |
| 0.0 | 0.9 | GO:0045295 | gamma-catenin binding(GO:0045295) armadillo repeat domain binding(GO:0070016) |
| 0.0 | 1.6 | GO:0005545 | 1-phosphatidylinositol binding(GO:0005545) |
| 0.0 | 1.3 | GO:0005251 | delayed rectifier potassium channel activity(GO:0005251) |
| 0.0 | 1.9 | GO:0032452 | histone demethylase activity(GO:0032452) |
| 0.0 | 1.0 | GO:0004012 | phospholipid-translocating ATPase activity(GO:0004012) |
| 0.0 | 0.3 | GO:0071933 | Arp2/3 complex binding(GO:0071933) |
| 0.0 | 0.1 | GO:0008841 | tetrahydrofolylpolyglutamate synthase activity(GO:0004326) dihydrofolate synthase activity(GO:0008841) |
| 0.0 | 1.4 | GO:0048027 | mRNA 5'-UTR binding(GO:0048027) |
| 0.0 | 0.2 | GO:0038051 | glucocorticoid receptor activity(GO:0004883) glucocorticoid-activated RNA polymerase II transcription factor binding transcription factor activity(GO:0038051) |
| 0.0 | 1.2 | GO:0004435 | phosphatidylinositol phospholipase C activity(GO:0004435) |
| 0.0 | 0.1 | GO:0072320 | volume-sensitive chloride channel activity(GO:0072320) |
| 0.0 | 6.2 | GO:0001078 | transcriptional repressor activity, RNA polymerase II core promoter proximal region sequence-specific binding(GO:0001078) |
| 0.0 | 0.7 | GO:0071949 | FAD binding(GO:0071949) |
| 0.0 | 4.2 | GO:0003823 | antigen binding(GO:0003823) |
| 0.0 | 0.1 | GO:0005483 | soluble NSF attachment protein activity(GO:0005483) |
| 0.0 | 1.2 | GO:0030544 | Hsp70 protein binding(GO:0030544) |
| 0.0 | 1.0 | GO:0046966 | thyroid hormone receptor binding(GO:0046966) |
| 0.0 | 1.1 | GO:0031492 | nucleosomal DNA binding(GO:0031492) |
| 0.0 | 4.5 | GO:0003735 | structural constituent of ribosome(GO:0003735) |
| 0.0 | 0.8 | GO:0019707 | protein-cysteine S-palmitoyltransferase activity(GO:0019706) protein-cysteine S-acyltransferase activity(GO:0019707) |
| 0.0 | 0.9 | GO:0031624 | ubiquitin conjugating enzyme binding(GO:0031624) |
| 0.0 | 0.1 | GO:0003987 | acetate-CoA ligase activity(GO:0003987) |
| 0.0 | 0.7 | GO:0051059 | NF-kappaB binding(GO:0051059) |
| 0.0 | 0.7 | GO:0030742 | GTP-dependent protein binding(GO:0030742) |
| 0.0 | 1.2 | GO:0008138 | protein tyrosine/serine/threonine phosphatase activity(GO:0008138) |
| 0.0 | 2.7 | GO:0001085 | RNA polymerase II transcription factor binding(GO:0001085) |
| 0.0 | 2.0 | GO:0004222 | metalloendopeptidase activity(GO:0004222) |
| 0.0 | 0.1 | GO:0061513 | hexose phosphate transmembrane transporter activity(GO:0015119) organophosphate:inorganic phosphate antiporter activity(GO:0015315) hexose-phosphate:inorganic phosphate antiporter activity(GO:0015526) glucose 6-phosphate:inorganic phosphate antiporter activity(GO:0061513) |
| 0.0 | 0.3 | GO:0005104 | fibroblast growth factor receptor binding(GO:0005104) |
| 0.0 | 0.3 | GO:0016832 | aldehyde-lyase activity(GO:0016832) |
Gene overrepresentation in curated gene sets: canonical pathways category:
| Log-likelihood per target | Total log-likelihood | Term | Description |
|---|---|---|---|
| 0.3 | 19.9 | PID S1P S1P3 PATHWAY | S1P3 pathway |
| 0.1 | 3.8 | SA PROGRAMMED CELL DEATH | Programmed cell death, or apoptosis, eliminates damaged or unneeded cells. |
| 0.1 | 8.1 | PID IL12 STAT4 PATHWAY | IL12 signaling mediated by STAT4 |
| 0.1 | 2.4 | PID IL2 STAT5 PATHWAY | IL2 signaling events mediated by STAT5 |
| 0.1 | 3.5 | PID ERBB NETWORK PATHWAY | ErbB receptor signaling network |
| 0.1 | 3.2 | PID P38 MK2 PATHWAY | p38 signaling mediated by MAPKAP kinases |
| 0.1 | 3.0 | PID CD8 TCR DOWNSTREAM PATHWAY | Downstream signaling in naïve CD8+ T cells |
| 0.1 | 5.4 | PID IL2 1PATHWAY | IL2-mediated signaling events |
| 0.1 | 2.1 | SA MMP CYTOKINE CONNECTION | Cytokines can induce activation of matrix metalloproteinases, which degrade extracellular matrix. |
| 0.0 | 1.2 | PID AR NONGENOMIC PATHWAY | Nongenotropic Androgen signaling |
| 0.0 | 2.0 | PID SMAD2 3PATHWAY | Regulation of cytoplasmic and nuclear SMAD2/3 signaling |
| 0.0 | 1.1 | PID P38 GAMMA DELTA PATHWAY | Signaling mediated by p38-gamma and p38-delta |
| 0.0 | 1.9 | PID NFKAPPAB CANONICAL PATHWAY | Canonical NF-kappaB pathway |
| 0.0 | 0.6 | PID THROMBIN PAR4 PATHWAY | PAR4-mediated thrombin signaling events |
| 0.0 | 6.9 | PID BETA CATENIN NUC PATHWAY | Regulation of nuclear beta catenin signaling and target gene transcription |
| 0.0 | 1.1 | PID CD40 PATHWAY | CD40/CD40L signaling |
| 0.0 | 1.6 | PID IL8 CXCR2 PATHWAY | IL8- and CXCR2-mediated signaling events |
| 0.0 | 4.8 | PID SMAD2 3NUCLEAR PATHWAY | Regulation of nuclear SMAD2/3 signaling |
| 0.0 | 1.4 | PID IFNG PATHWAY | IFN-gamma pathway |
| 0.0 | 2.0 | PID RB 1PATHWAY | Regulation of retinoblastoma protein |
| 0.0 | 11.0 | NABA SECRETED FACTORS | Genes encoding secreted soluble factors |
| 0.0 | 1.2 | PID FGF PATHWAY | FGF signaling pathway |
| 0.0 | 0.6 | PID KIT PATHWAY | Signaling events mediated by Stem cell factor receptor (c-Kit) |
| 0.0 | 0.4 | PID MYC PATHWAY | C-MYC pathway |
| 0.0 | 0.3 | PID SYNDECAN 3 PATHWAY | Syndecan-3-mediated signaling events |
| 0.0 | 1.1 | PID HDAC CLASSI PATHWAY | Signaling events mediated by HDAC Class I |
Gene overrepresentation in curated gene sets: REACTOME pathways category:
| Log-likelihood per target | Total log-likelihood | Term | Description |
|---|---|---|---|
| 1.4 | 8.4 | REACTOME BINDING AND ENTRY OF HIV VIRION | Genes involved in Binding and entry of HIV virion |
| 0.4 | 10.6 | REACTOME CYTOSOLIC SULFONATION OF SMALL MOLECULES | Genes involved in Cytosolic sulfonation of small molecules |
| 0.3 | 8.1 | REACTOME ADVANCED GLYCOSYLATION ENDPRODUCT RECEPTOR SIGNALING | Genes involved in Advanced glycosylation endproduct receptor signaling |
| 0.2 | 5.1 | REACTOME TRANSLOCATION OF ZAP 70 TO IMMUNOLOGICAL SYNAPSE | Genes involved in Translocation of ZAP-70 to Immunological synapse |
| 0.2 | 18.8 | REACTOME IMMUNOREGULATORY INTERACTIONS BETWEEN A LYMPHOID AND A NON LYMPHOID CELL | Genes involved in Immunoregulatory interactions between a Lymphoid and a non-Lymphoid cell |
| 0.2 | 4.8 | REACTOME ACTIVATION OF BH3 ONLY PROTEINS | Genes involved in Activation of BH3-only proteins |
| 0.1 | 2.1 | REACTOME CDC6 ASSOCIATION WITH THE ORC ORIGIN COMPLEX | Genes involved in CDC6 association with the ORC:origin complex |
| 0.1 | 3.5 | REACTOME DESTABILIZATION OF MRNA BY BRF1 | Genes involved in Destabilization of mRNA by Butyrate Response Factor 1 (BRF1) |
| 0.1 | 3.5 | REACTOME SHC1 EVENTS IN ERBB4 SIGNALING | Genes involved in SHC1 events in ERBB4 signaling |
| 0.1 | 11.4 | REACTOME ANTIGEN PROCESSING CROSS PRESENTATION | Genes involved in Antigen processing-Cross presentation |
| 0.1 | 1.2 | REACTOME DOWNSTREAM TCR SIGNALING | Genes involved in Downstream TCR signaling |
| 0.1 | 3.8 | REACTOME TIE2 SIGNALING | Genes involved in Tie2 Signaling |
| 0.1 | 6.3 | REACTOME FORMATION OF THE TERNARY COMPLEX AND SUBSEQUENTLY THE 43S COMPLEX | Genes involved in Formation of the ternary complex, and subsequently, the 43S complex |
| 0.1 | 1.9 | REACTOME TAK1 ACTIVATES NFKB BY PHOSPHORYLATION AND ACTIVATION OF IKKS COMPLEX | Genes involved in TAK1 activates NFkB by phosphorylation and activation of IKKs complex |
| 0.1 | 5.8 | REACTOME MYOGENESIS | Genes involved in Myogenesis |
| 0.1 | 0.9 | REACTOME ACTIVATION OF IRF3 IRF7 MEDIATED BY TBK1 IKK EPSILON | Genes involved in Activation of IRF3/IRF7 mediated by TBK1/IKK epsilon |
| 0.0 | 0.8 | REACTOME INHIBITION OF REPLICATION INITIATION OF DAMAGED DNA BY RB1 E2F1 | Genes involved in Inhibition of replication initiation of damaged DNA by RB1/E2F1 |
| 0.0 | 5.3 | REACTOME INTERFERON ALPHA BETA SIGNALING | Genes involved in Interferon alpha/beta signaling |
| 0.0 | 2.0 | REACTOME REGULATION OF GLUCOKINASE BY GLUCOKINASE REGULATORY PROTEIN | Genes involved in Regulation of Glucokinase by Glucokinase Regulatory Protein |
| 0.0 | 1.2 | REACTOME DEPOSITION OF NEW CENPA CONTAINING NUCLEOSOMES AT THE CENTROMERE | Genes involved in Deposition of New CENPA-containing Nucleosomes at the Centromere |
| 0.0 | 1.0 | REACTOME NOTCH HLH TRANSCRIPTION PATHWAY | Genes involved in Notch-HLH transcription pathway |
| 0.0 | 1.5 | REACTOME SYNTHESIS OF VERY LONG CHAIN FATTY ACYL COAS | Genes involved in Synthesis of very long-chain fatty acyl-CoAs |
| 0.0 | 9.7 | REACTOME G ALPHA I SIGNALLING EVENTS | Genes involved in G alpha (i) signalling events |
| 0.0 | 0.6 | REACTOME COMMON PATHWAY | Genes involved in Common Pathway |
| 0.0 | 1.6 | REACTOME THE ROLE OF NEF IN HIV1 REPLICATION AND DISEASE PATHOGENESIS | Genes involved in The role of Nef in HIV-1 replication and disease pathogenesis |
| 0.0 | 1.2 | REACTOME ANTIGEN ACTIVATES B CELL RECEPTOR LEADING TO GENERATION OF SECOND MESSENGERS | Genes involved in Antigen Activates B Cell Receptor Leading to Generation of Second Messengers |
| 0.0 | 0.5 | REACTOME APOPTOTIC CLEAVAGE OF CELL ADHESION PROTEINS | Genes involved in Apoptotic cleavage of cell adhesion proteins |
| 0.0 | 0.3 | REACTOME REGULATED PROTEOLYSIS OF P75NTR | Genes involved in Regulated proteolysis of p75NTR |
| 0.0 | 0.7 | REACTOME AMINO ACID SYNTHESIS AND INTERCONVERSION TRANSAMINATION | Genes involved in Amino acid synthesis and interconversion (transamination) |
| 0.0 | 0.2 | REACTOME MEMBRANE BINDING AND TARGETTING OF GAG PROTEINS | Genes involved in Membrane binding and targetting of GAG proteins |
| 0.0 | 0.8 | REACTOME CHOLESTEROL BIOSYNTHESIS | Genes involved in Cholesterol biosynthesis |
| 0.0 | 0.7 | REACTOME SULFUR AMINO ACID METABOLISM | Genes involved in Sulfur amino acid metabolism |
| 0.0 | 0.8 | REACTOME ION TRANSPORT BY P TYPE ATPASES | Genes involved in Ion transport by P-type ATPases |
| 0.0 | 1.3 | REACTOME VOLTAGE GATED POTASSIUM CHANNELS | Genes involved in Voltage gated Potassium channels |
| 0.0 | 0.5 | REACTOME DCC MEDIATED ATTRACTIVE SIGNALING | Genes involved in DCC mediated attractive signaling |
| 0.0 | 0.8 | REACTOME DOWNREGULATION OF SMAD2 3 SMAD4 TRANSCRIPTIONAL ACTIVITY | Genes involved in Downregulation of SMAD2/3:SMAD4 transcriptional activity |
| 0.0 | 0.8 | REACTOME SIGNALING BY ROBO RECEPTOR | Genes involved in Signaling by Robo receptor |