Project
Illumina Body Map 2 (GSE30611)
Navigation
Downloads
Results for PBX2
Z-value: 0.42
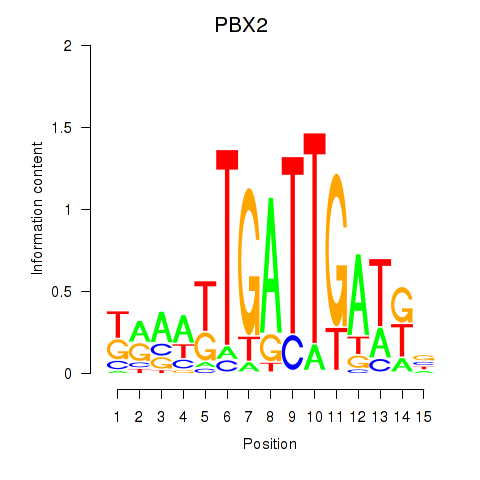
Motif logo
Transcription factors associated with PBX2
| Gene Symbol | Gene ID | Gene Info |
|---|---|---|
|
PBX2
|
ENSG00000204304.12 | PBX homeobox 2 |
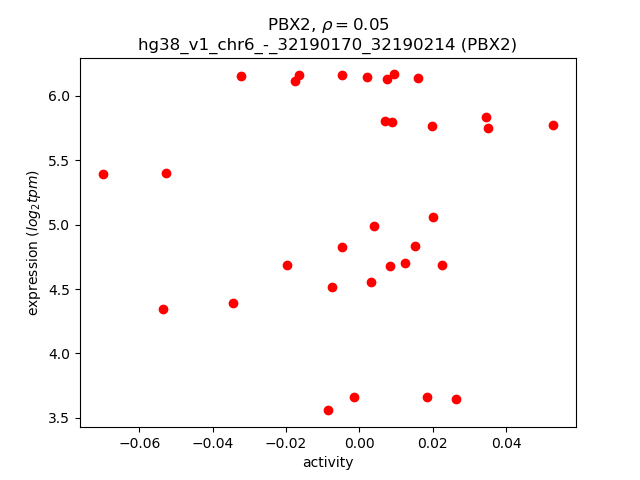
Activity-expression correlation:
| Gene | Promoter | Pearson corr. coef. | P-value | Plot |
|---|---|---|---|---|
| PBX2 | hg38_v1_chr6_-_32190170_32190214 | 0.05 | 7.7e-01 | Click! |
Activity profile of PBX2 motif
Sorted Z-values of PBX2 motif
| Promoter | Log-likelihood | Transcript | Gene | Gene Info |
|---|---|---|---|---|
| chr10_-_44978789 | 1.14 |
ENST00000448778.1
ENST00000298295.4 |
DEPP1
|
DEPP1 autophagy regulator |
| chr8_-_6563409 | 1.11 |
ENST00000325203.9
|
ANGPT2
|
angiopoietin 2 |
| chr17_+_7855055 | 1.04 |
ENST00000574668.1
ENST00000301599.7 |
TMEM88
|
transmembrane protein 88 |
| chr11_-_111923722 | 0.90 |
ENST00000527950.5
|
CRYAB
|
crystallin alpha B |
| chr5_+_55024250 | 0.69 |
ENST00000231009.3
|
GZMK
|
granzyme K |
| chr2_+_203867764 | 0.68 |
ENST00000648405.2
|
CTLA4
|
cytotoxic T-lymphocyte associated protein 4 |
| chr2_+_203867943 | 0.65 |
ENST00000295854.10
ENST00000487393.1 ENST00000472206.1 |
CTLA4
|
cytotoxic T-lymphocyte associated protein 4 |
| chr2_+_233692881 | 0.60 |
ENST00000305139.11
|
UGT1A6
|
UDP glucuronosyltransferase family 1 member A6 |
| chr22_-_30246739 | 0.58 |
ENST00000403987.3
ENST00000249075.4 |
LIF
|
LIF interleukin 6 family cytokine |
| chr2_-_99301195 | 0.53 |
ENST00000308528.9
|
LYG1
|
lysozyme g1 |
| chr7_+_142791635 | 0.52 |
ENST00000633705.1
|
TRBC1
|
T cell receptor beta constant 1 |
| chr2_-_178794944 | 0.51 |
ENST00000436599.1
|
TTN
|
titin |
| chr2_+_233693659 | 0.46 |
ENST00000406651.1
|
UGT1A6
|
UDP glucuronosyltransferase family 1 member A6 |
| chr1_+_101236860 | 0.46 |
ENST00000475821.2
|
S1PR1
|
sphingosine-1-phosphate receptor 1 |
| chr14_-_23155302 | 0.46 |
ENST00000529705.6
|
SLC7A8
|
solute carrier family 7 member 8 |
| chr1_+_101237009 | 0.44 |
ENST00000305352.7
|
S1PR1
|
sphingosine-1-phosphate receptor 1 |
| chr5_-_39462288 | 0.44 |
ENST00000511792.5
|
DAB2
|
DAB adaptor protein 2 |
| chr2_+_33458043 | 0.41 |
ENST00000437184.5
|
RASGRP3
|
RAS guanyl releasing protein 3 |
| chr11_-_104898670 | 0.39 |
ENST00000422698.6
|
CASP12
|
caspase 12 (gene/pseudogene) |
| chr7_+_134843884 | 0.35 |
ENST00000445569.6
|
CALD1
|
caldesmon 1 |
| chr2_+_33436304 | 0.34 |
ENST00000402538.7
|
RASGRP3
|
RAS guanyl releasing protein 3 |
| chr1_+_61952036 | 0.33 |
ENST00000646453.1
ENST00000635137.1 |
PATJ
|
PATJ crumbs cell polarity complex component |
| chr3_-_52830664 | 0.32 |
ENST00000266041.9
ENST00000406595.5 ENST00000485816.5 |
ITIH4
|
inter-alpha-trypsin inhibitor heavy chain 4 |
| chr11_+_68460712 | 0.31 |
ENST00000528635.5
ENST00000533127.5 ENST00000529907.5 ENST00000529344.5 ENST00000534534.5 ENST00000524845.5 ENST00000393800.7 ENST00000265637.8 ENST00000524904.5 ENST00000393801.7 ENST00000265636.9 ENST00000529710.5 |
PPP6R3
|
protein phosphatase 6 regulatory subunit 3 |
| chr16_+_1078781 | 0.31 |
ENST00000293897.5
|
SSTR5
|
somatostatin receptor 5 |
| chr7_-_151519891 | 0.31 |
ENST00000262187.10
|
RHEB
|
Ras homolog, mTORC1 binding |
| chr13_-_106568107 | 0.30 |
ENST00000400198.8
|
ARGLU1
|
arginine and glutamate rich 1 |
| chr14_+_64388296 | 0.28 |
ENST00000554739.5
ENST00000554768.6 ENST00000652179.1 ENST00000652337.1 ENST00000557370.3 |
MTHFD1
|
methylenetetrahydrofolate dehydrogenase, cyclohydrolase and formyltetrahydrofolate synthetase 1 |
| chr7_-_151520080 | 0.27 |
ENST00000496004.5
|
RHEB
|
Ras homolog, mTORC1 binding |
| chr11_+_31816266 | 0.23 |
ENST00000644607.1
ENST00000646221.1 ENST00000643671.1 ENST00000643931.1 ENST00000642614.1 ENST00000642818.1 ENST00000645848.1 ENST00000506388.2 ENST00000645824.1 ENST00000532942.5 |
PAUPAR
ENSG00000285283.1
|
PAX6 upstream antisense RNA novel protein |
| chr6_+_54111409 | 0.23 |
ENST00000503951.5
|
MLIP
|
muscular LMNA interacting protein |
| chr12_-_51814925 | 0.22 |
ENST00000642069.2
|
TMDD1
|
transmembrane and death domain 1 |
| chr2_+_12716893 | 0.21 |
ENST00000381465.2
ENST00000155926.9 |
TRIB2
|
tribbles pseudokinase 2 |
| chr1_+_61952283 | 0.20 |
ENST00000307297.8
|
PATJ
|
PATJ crumbs cell polarity complex component |
| chr2_-_31217511 | 0.20 |
ENST00000403897.4
|
CAPN14
|
calpain 14 |
| chr2_+_20447065 | 0.20 |
ENST00000272233.6
|
RHOB
|
ras homolog family member B |
| chr4_+_37960397 | 0.20 |
ENST00000504686.2
|
PTTG2
|
pituitary tumor-transforming 2 |
| chr3_-_129440007 | 0.19 |
ENST00000503197.5
ENST00000249910.5 ENST00000507208.1 ENST00000393278.6 |
MBD4
|
methyl-CpG binding domain 4, DNA glycosylase |
| chrX_+_120604084 | 0.18 |
ENST00000371317.10
|
MCTS1
|
MCTS1 re-initiation and release factor |
| chr11_+_62665305 | 0.17 |
ENST00000532971.2
|
CSKMT
|
citrate synthase lysine methyltransferase |
| chrM_+_12329 | 0.17 |
ENST00000361567.2
|
MT-ND5
|
mitochondrially encoded NADH:ubiquinone oxidoreductase core subunit 5 |
| chr15_+_67125707 | 0.17 |
ENST00000540846.6
|
SMAD3
|
SMAD family member 3 |
| chr12_+_53441641 | 0.17 |
ENST00000549924.5
|
PRR13
|
proline rich 13 |
| chr9_-_104605627 | 0.16 |
ENST00000542196.2
|
OR13C2
|
olfactory receptor family 13 subfamily C member 2 |
| chr9_+_104694518 | 0.15 |
ENST00000641530.1
|
OR13D1
|
olfactory receptor family 13 subfamily D member 1 |
| chrX_+_56563569 | 0.13 |
ENST00000338222.7
|
UBQLN2
|
ubiquilin 2 |
| chr3_-_129439925 | 0.13 |
ENST00000429544.7
|
MBD4
|
methyl-CpG binding domain 4, DNA glycosylase |
| chr18_-_75208417 | 0.13 |
ENST00000581620.1
ENST00000582437.1 |
ZADH2
|
zinc binding alcohol dehydrogenase domain containing 2 |
| chr12_-_27972725 | 0.12 |
ENST00000545234.6
|
PTHLH
|
parathyroid hormone like hormone |
| chrX_-_31178220 | 0.12 |
ENST00000681026.1
|
DMD
|
dystrophin |
| chrX_+_46837034 | 0.12 |
ENST00000218340.4
|
RP2
|
RP2 activator of ARL3 GTPase |
| chrX_-_31178149 | 0.10 |
ENST00000679437.1
|
DMD
|
dystrophin |
| chr8_+_109086585 | 0.10 |
ENST00000518632.2
|
TRHR
|
thyrotropin releasing hormone receptor |
| chr5_+_141392616 | 0.10 |
ENST00000398604.3
|
PCDHGA8
|
protocadherin gamma subfamily A, 8 |
| chr12_+_53441724 | 0.09 |
ENST00000551003.5
ENST00000429243.7 ENST00000549068.5 ENST00000549740.5 ENST00000546581.5 ENST00000549581.5 ENST00000547368.5 ENST00000379786.8 ENST00000551945.5 ENST00000547717.1 |
PRR13
ENSG00000257379.1
|
proline rich 13 novel transcript |
| chr1_-_114780624 | 0.09 |
ENST00000060969.6
ENST00000369528.9 |
SIKE1
|
suppressor of IKBKE 1 |
| chr2_+_112275588 | 0.08 |
ENST00000409871.6
ENST00000343936.4 |
ZC3H6
|
zinc finger CCCH-type containing 6 |
| chr1_-_158399466 | 0.08 |
ENST00000334438.1
|
OR10T2
|
olfactory receptor family 10 subfamily T member 2 |
| chr6_+_26045374 | 0.08 |
ENST00000612966.3
|
H3C3
|
H3 clustered histone 3 |
| chr9_-_20382448 | 0.07 |
ENST00000491137.5
|
MLLT3
|
MLLT3 super elongation complex subunit |
| chr14_+_58298587 | 0.07 |
ENST00000445108.5
|
ARID4A
|
AT-rich interaction domain 4A |
| chr7_-_33100886 | 0.06 |
ENST00000448915.1
|
RP9
|
RP9 pre-mRNA splicing factor |
| chr13_+_108269629 | 0.05 |
ENST00000430559.5
ENST00000375887.9 |
TNFSF13B
|
TNF superfamily member 13b |
| chr7_-_32490361 | 0.05 |
ENST00000410044.5
ENST00000450169.7 ENST00000409987.5 ENST00000409782.5 |
LSM5
|
LSM5 homolog, U6 small nuclear RNA and mRNA degradation associated |
| chr14_+_58298497 | 0.04 |
ENST00000348476.7
ENST00000355431.8 ENST00000395168.7 |
ARID4A
|
AT-rich interaction domain 4A |
| chr18_-_75209126 | 0.04 |
ENST00000322342.4
|
ZADH2
|
zinc binding alcohol dehydrogenase domain containing 2 |
| chr10_+_68109433 | 0.03 |
ENST00000613327.4
ENST00000358913.10 ENST00000373675.3 |
MYPN
|
myopalladin |
| chr7_-_112939773 | 0.02 |
ENST00000297145.9
|
BMT2
|
base methyltransferase of 25S rRNA 2 homolog |
| chr6_+_159790448 | 0.01 |
ENST00000367034.5
|
MRPL18
|
mitochondrial ribosomal protein L18 |
| chr7_-_112939618 | 0.01 |
ENST00000432572.1
|
BMT2
|
base methyltransferase of 25S rRNA 2 homolog |
| chr17_-_30824665 | 0.01 |
ENST00000324238.7
|
CRLF3
|
cytokine receptor like factor 3 |
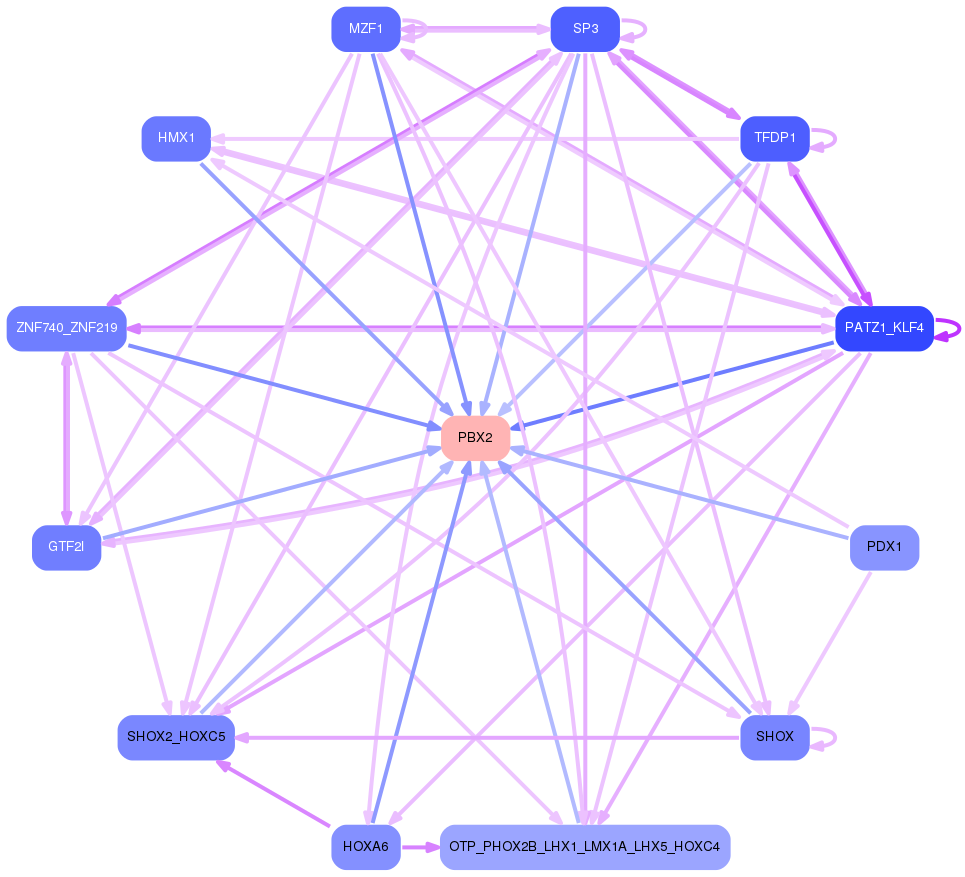
Network of associatons between targets according to the STRING database.

First level regulatory network of PBX2
Gene Ontology Analysis
Gene overrepresentation in biological process category:
| Log-likelihood per target | Total log-likelihood | Term | Description |
|---|---|---|---|
| 0.4 | 1.1 | GO:0050928 | negative regulation of positive chemotaxis(GO:0050928) |
| 0.2 | 1.3 | GO:0045590 | negative regulation of regulatory T cell differentiation(GO:0045590) |
| 0.2 | 0.9 | GO:0003245 | cardiac muscle tissue growth involved in heart morphogenesis(GO:0003245) |
| 0.1 | 0.6 | GO:0060708 | spongiotrophoblast differentiation(GO:0060708) |
| 0.1 | 1.1 | GO:0052696 | flavonoid glucuronidation(GO:0052696) xenobiotic glucuronidation(GO:0052697) |
| 0.1 | 0.4 | GO:0035026 | leading edge cell differentiation(GO:0035026) |
| 0.1 | 0.5 | GO:0030241 | skeletal muscle myosin thick filament assembly(GO:0030241) |
| 0.1 | 0.3 | GO:0038169 | somatostatin receptor signaling pathway(GO:0038169) somatostatin signaling pathway(GO:0038170) |
| 0.1 | 0.5 | GO:0009253 | peptidoglycan metabolic process(GO:0000270) peptidoglycan catabolic process(GO:0009253) |
| 0.1 | 0.3 | GO:0009257 | 10-formyltetrahydrofolate biosynthetic process(GO:0009257) |
| 0.0 | 0.2 | GO:0042091 | interleukin-10 biosynthetic process(GO:0042091) regulation of interleukin-10 biosynthetic process(GO:0045074) |
| 0.0 | 0.9 | GO:0007021 | tubulin complex assembly(GO:0007021) |
| 0.0 | 0.6 | GO:2000074 | regulation of type B pancreatic cell development(GO:2000074) |
| 0.0 | 0.1 | GO:1900186 | negative regulation of clathrin-mediated endocytosis(GO:1900186) |
| 0.0 | 0.1 | GO:0002188 | translation reinitiation(GO:0002188) |
| 0.0 | 0.1 | GO:0007023 | post-chaperonin tubulin folding pathway(GO:0007023) |
| 0.0 | 0.2 | GO:0061767 | negative regulation of lung blood pressure(GO:0061767) |
| 0.0 | 0.3 | GO:0045008 | depyrimidination(GO:0045008) |
| 0.0 | 0.4 | GO:0097264 | self proteolysis(GO:0097264) |
| 0.0 | 0.1 | GO:0097368 | establishment of Sertoli cell barrier(GO:0097368) |
| 0.0 | 0.2 | GO:0014809 | regulation of skeletal muscle contraction by regulation of release of sequestered calcium ion(GO:0014809) |
| 0.0 | 0.0 | GO:0002636 | positive regulation of germinal center formation(GO:0002636) |
| 0.0 | 0.5 | GO:0015695 | organic cation transport(GO:0015695) |
Gene overrepresentation in cellular component category:
| Log-likelihood per target | Total log-likelihood | Term | Description |
|---|---|---|---|
| 0.1 | 0.4 | GO:0097169 | IPAF inflammasome complex(GO:0072557) AIM2 inflammasome complex(GO:0097169) |
| 0.1 | 0.4 | GO:0070022 | transforming growth factor beta receptor homodimeric complex(GO:0070022) |
| 0.1 | 0.9 | GO:0097512 | cardiac myofibril(GO:0097512) |
| 0.0 | 0.1 | GO:1990075 | periciliary membrane compartment(GO:1990075) |
| 0.0 | 0.8 | GO:0032045 | guanyl-nucleotide exchange factor complex(GO:0032045) |
| 0.0 | 0.4 | GO:0030478 | actin cap(GO:0030478) |
| 0.0 | 1.3 | GO:0098636 | protein complex involved in cell adhesion(GO:0098636) |
| 0.0 | 0.3 | GO:0031089 | platelet dense granule lumen(GO:0031089) |
| 0.0 | 0.2 | GO:0016013 | syntrophin complex(GO:0016013) |
| 0.0 | 0.2 | GO:0071144 | SMAD2-SMAD3 protein complex(GO:0071144) |
| 0.0 | 0.5 | GO:0005859 | muscle myosin complex(GO:0005859) |
Gene overrepresentation in molecular function category:
| Log-likelihood per target | Total log-likelihood | Term | Description |
|---|---|---|---|
| 0.1 | 0.3 | GO:0004487 | methylenetetrahydrofolate dehydrogenase (NAD+) activity(GO:0004487) |
| 0.1 | 0.3 | GO:0008263 | pyrimidine-specific mismatch base pair DNA N-glycosylase activity(GO:0008263) |
| 0.1 | 0.3 | GO:0004994 | somatostatin receptor activity(GO:0004994) |
| 0.0 | 0.9 | GO:0038036 | sphingosine-1-phosphate receptor activity(GO:0038036) |
| 0.0 | 0.6 | GO:0001135 | transcription factor activity, RNA polymerase II transcription factor recruiting(GO:0001135) |
| 0.0 | 0.5 | GO:0019534 | toxin transporter activity(GO:0019534) |
| 0.0 | 0.5 | GO:0003796 | lysozyme activity(GO:0003796) |
| 0.0 | 0.5 | GO:0031433 | telethonin binding(GO:0031433) |
| 0.0 | 0.9 | GO:0005212 | structural constituent of eye lens(GO:0005212) |
| 0.0 | 0.8 | GO:0019992 | diacylglycerol binding(GO:0019992) |
| 0.0 | 1.1 | GO:0001972 | retinoic acid binding(GO:0001972) |
| 0.0 | 0.2 | GO:0031962 | mineralocorticoid receptor binding(GO:0031962) |
| 0.0 | 0.2 | GO:0036132 | 13-prostaglandin reductase activity(GO:0036132) 15-oxoprostaglandin 13-oxidase activity(GO:0047522) |
| 0.0 | 0.4 | GO:0035615 | clathrin adaptor activity(GO:0035615) endocytic adaptor activity(GO:0098748) |
| 0.0 | 0.4 | GO:0005523 | tropomyosin binding(GO:0005523) |
| 0.0 | 0.2 | GO:0055106 | ubiquitin-protein transferase regulator activity(GO:0055106) |
| 0.0 | 0.4 | GO:0097153 | cysteine-type endopeptidase activity involved in apoptotic process(GO:0097153) |
Gene overrepresentation in curated gene sets: canonical pathways category:
| Log-likelihood per target | Total log-likelihood | Term | Description |
|---|---|---|---|
| 0.0 | 0.9 | PID S1P META PATHWAY | Sphingosine 1-phosphate (S1P) pathway |
| 0.0 | 2.1 | ST T CELL SIGNAL TRANSDUCTION | T Cell Signal Transduction |
Gene overrepresentation in curated gene sets: REACTOME pathways category:
| Log-likelihood per target | Total log-likelihood | Term | Description |
|---|---|---|---|
| 0.0 | 1.1 | REACTOME GLUCURONIDATION | Genes involved in Glucuronidation |
| 0.0 | 0.6 | REACTOME REGULATION OF RHEB GTPASE ACTIVITY BY AMPK | Genes involved in Regulation of Rheb GTPase activity by AMPK |
| 0.0 | 1.1 | REACTOME TIE2 SIGNALING | Genes involved in Tie2 Signaling |
| 0.0 | 1.3 | REACTOME CTLA4 INHIBITORY SIGNALING | Genes involved in CTLA4 inhibitory signaling |
| 0.0 | 0.4 | REACTOME GAP JUNCTION DEGRADATION | Genes involved in Gap junction degradation |
| 0.0 | 0.3 | REACTOME BASE FREE SUGAR PHOSPHATE REMOVAL VIA THE SINGLE NUCLEOTIDE REPLACEMENT PATHWAY | Genes involved in Base-free sugar-phosphate removal via the single-nucleotide replacement pathway |