Project
Illumina Body Map 2 (GSE30611)
Navigation
Downloads
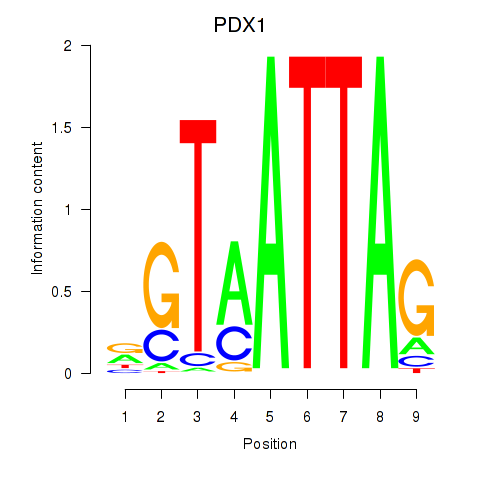
Results for PDX1
Z-value: 1.18
Motif logo
Transcription factors associated with PDX1
| Gene Symbol | Gene ID | Gene Info |
|---|---|---|
|
PDX1
|
ENSG00000139515.6 | pancreatic and duodenal homeobox 1 |
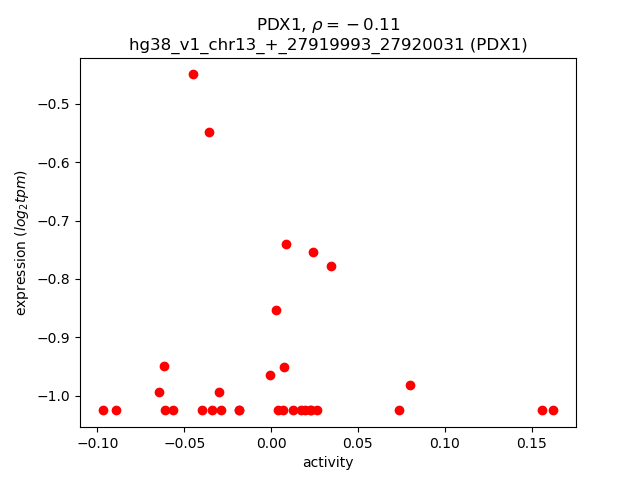
Activity-expression correlation:
| Gene | Promoter | Pearson corr. coef. | P-value | Plot |
|---|---|---|---|---|
| PDX1 | hg38_v1_chr13_+_27919993_27920031 | -0.11 | 5.5e-01 | Click! |
Activity profile of PDX1 motif
Sorted Z-values of PDX1 motif
| Promoter | Log-likelihood | Transcript | Gene | Gene Info |
|---|---|---|---|---|
| chr13_-_46142834 | 4.78 |
ENST00000674665.1
|
LCP1
|
lymphocyte cytosolic protein 1 |
| chr7_+_142300924 | 4.23 |
ENST00000455382.2
|
TRBV2
|
T cell receptor beta variable 2 |
| chr4_-_36243939 | 4.14 |
ENST00000506189.1
|
ARAP2
|
ArfGAP with RhoGAP domain, ankyrin repeat and PH domain 2 |
| chr15_+_74788542 | 4.02 |
ENST00000567571.5
|
CSK
|
C-terminal Src kinase |
| chr7_+_50308672 | 3.75 |
ENST00000439701.2
ENST00000438033.5 ENST00000492782.6 |
IKZF1
|
IKAROS family zinc finger 1 |
| chr1_+_198638968 | 3.69 |
ENST00000348564.11
ENST00000530727.5 ENST00000442510.8 ENST00000645247.1 ENST00000367367.8 ENST00000367364.5 ENST00000413409.6 |
PTPRC
|
protein tyrosine phosphatase receptor type C |
| chr1_+_198638723 | 3.37 |
ENST00000643513.1
|
PTPRC
|
protein tyrosine phosphatase receptor type C |
| chr3_-_39280021 | 3.37 |
ENST00000399220.3
|
CX3CR1
|
C-X3-C motif chemokine receptor 1 |
| chr3_+_108822778 | 3.25 |
ENST00000295756.11
|
TRAT1
|
T cell receptor associated transmembrane adaptor 1 |
| chr1_+_198638457 | 3.22 |
ENST00000367379.6
|
PTPRC
|
protein tyrosine phosphatase receptor type C |
| chr3_+_108822759 | 3.06 |
ENST00000426646.1
|
TRAT1
|
T cell receptor associated transmembrane adaptor 1 |
| chr12_-_44875468 | 3.05 |
ENST00000553120.1
|
NELL2
|
neural EGFL like 2 |
| chr1_+_198639162 | 2.75 |
ENST00000418674.1
|
PTPRC
|
protein tyrosine phosphatase receptor type C |
| chr15_+_28885955 | 2.68 |
ENST00000558402.5
ENST00000683413.1 ENST00000558330.5 |
APBA2
|
amyloid beta precursor protein binding family A member 2 |
| chr14_+_61187544 | 2.51 |
ENST00000555185.5
ENST00000557294.5 ENST00000556778.5 |
PRKCH
|
protein kinase C eta |
| chr12_+_107318395 | 2.48 |
ENST00000420571.6
ENST00000280758.10 |
BTBD11
|
BTB domain containing 11 |
| chr15_+_58138368 | 2.47 |
ENST00000219919.9
ENST00000536493.1 |
AQP9
|
aquaporin 9 |
| chr11_-_118212885 | 2.45 |
ENST00000524477.5
|
JAML
|
junction adhesion molecule like |
| chr14_+_100019375 | 2.40 |
ENST00000544450.6
|
EVL
|
Enah/Vasp-like |
| chr15_+_58138169 | 2.20 |
ENST00000558772.5
|
AQP9
|
aquaporin 9 |
| chr12_+_8513499 | 2.19 |
ENST00000299665.3
|
CLEC4D
|
C-type lectin domain family 4 member D |
| chr6_-_25042003 | 2.16 |
ENST00000510784.8
|
RIPOR2
|
RHO family interacting cell polarization regulator 2 |
| chr7_+_37683733 | 2.16 |
ENST00000334425.2
ENST00000450180.5 |
GPR141
|
G protein-coupled receptor 141 |
| chr15_-_55270280 | 2.15 |
ENST00000564609.5
|
RAB27A
|
RAB27A, member RAS oncogene family |
| chr12_+_55932028 | 2.14 |
ENST00000394147.5
ENST00000551156.5 ENST00000553783.5 ENST00000557080.5 ENST00000432422.7 ENST00000556001.5 |
DGKA
|
diacylglycerol kinase alpha |
| chr15_-_55270874 | 2.13 |
ENST00000567380.5
ENST00000565972.5 ENST00000569493.5 |
RAB27A
|
RAB27A, member RAS oncogene family |
| chr3_+_111999189 | 2.03 |
ENST00000455401.6
|
TAGLN3
|
transgelin 3 |
| chr13_+_77741331 | 2.03 |
ENST00000462234.5
|
SLAIN1
|
SLAIN motif family member 1 |
| chr3_+_111999326 | 2.02 |
ENST00000494932.1
|
TAGLN3
|
transgelin 3 |
| chr15_-_55270383 | 2.01 |
ENST00000396307.6
|
RAB27A
|
RAB27A, member RAS oncogene family |
| chrX_+_123963164 | 1.99 |
ENST00000394478.1
|
STAG2
|
stromal antigen 2 |
| chr13_+_77741393 | 1.99 |
ENST00000496045.5
|
SLAIN1
|
SLAIN motif family member 1 |
| chr6_-_154247630 | 1.94 |
ENST00000519344.5
|
IPCEF1
|
interaction protein for cytohesin exchange factors 1 |
| chr1_-_92486916 | 1.92 |
ENST00000294702.6
|
GFI1
|
growth factor independent 1 transcriptional repressor |
| chr8_+_49911604 | 1.89 |
ENST00000642164.1
ENST00000644093.1 ENST00000643999.1 ENST00000647073.1 ENST00000646880.1 |
SNTG1
|
syntrophin gamma 1 |
| chr21_+_29300111 | 1.87 |
ENST00000451655.5
|
BACH1
|
BTB domain and CNC homolog 1 |
| chr14_+_22096017 | 1.87 |
ENST00000390452.2
|
TRDV1
|
T cell receptor delta variable 1 |
| chr17_-_29140400 | 1.81 |
ENST00000528564.2
|
MYO18A
|
myosin XVIIIA |
| chr3_+_111998739 | 1.77 |
ENST00000393917.6
ENST00000273368.8 |
TAGLN3
|
transgelin 3 |
| chr14_+_71586261 | 1.71 |
ENST00000358550.6
|
SIPA1L1
|
signal induced proliferation associated 1 like 1 |
| chr7_+_129375643 | 1.71 |
ENST00000490911.5
|
AHCYL2
|
adenosylhomocysteinase like 2 |
| chr7_+_142349135 | 1.70 |
ENST00000634383.1
|
TRBV6-2
|
T cell receptor beta variable 6-2 |
| chr3_+_111998915 | 1.68 |
ENST00000478951.6
|
TAGLN3
|
transgelin 3 |
| chr14_+_51847145 | 1.68 |
ENST00000615906.4
|
GNG2
|
G protein subunit gamma 2 |
| chr6_+_167122742 | 1.68 |
ENST00000341935.9
ENST00000349984.6 |
CCR6
|
C-C motif chemokine receptor 6 |
| chr11_-_33892010 | 1.63 |
ENST00000257818.3
|
LMO2
|
LIM domain only 2 |
| chrX_-_20218941 | 1.59 |
ENST00000457145.6
|
RPS6KA3
|
ribosomal protein S6 kinase A3 |
| chr1_+_100538131 | 1.58 |
ENST00000315033.5
|
GPR88
|
G protein-coupled receptor 88 |
| chr10_+_110964125 | 1.58 |
ENST00000265277.9
|
SHOC2
|
SHOC2 leucine rich repeat scaffold protein |
| chr15_-_55270249 | 1.57 |
ENST00000568803.1
|
RAB27A
|
RAB27A, member RAS oncogene family |
| chr18_+_59899988 | 1.54 |
ENST00000316660.7
ENST00000269518.9 |
PMAIP1
|
phorbol-12-myristate-13-acetate-induced protein 1 |
| chr9_+_90827452 | 1.54 |
ENST00000375746.1
|
SYK
|
spleen associated tyrosine kinase |
| chr12_+_55931447 | 1.53 |
ENST00000549368.5
|
DGKA
|
diacylglycerol kinase alpha |
| chr18_+_61333424 | 1.52 |
ENST00000262717.9
|
CDH20
|
cadherin 20 |
| chr2_-_144520006 | 1.50 |
ENST00000303660.8
|
ZEB2
|
zinc finger E-box binding homeobox 2 |
| chr3_+_122055355 | 1.48 |
ENST00000330540.7
ENST00000469710.5 ENST00000493101.5 |
CD86
|
CD86 molecule |
| chr6_+_106360668 | 1.47 |
ENST00000633556.3
|
CRYBG1
|
crystallin beta-gamma domain containing 1 |
| chr13_-_41019289 | 1.45 |
ENST00000239882.7
|
ELF1
|
E74 like ETS transcription factor 1 |
| chr17_-_10026265 | 1.38 |
ENST00000437099.6
ENST00000396115.6 |
GAS7
|
growth arrest specific 7 |
| chr18_-_32772879 | 1.36 |
ENST00000358095.4
ENST00000359358.9 |
KLHL14
|
kelch like family member 14 |
| chr21_-_14546297 | 1.33 |
ENST00000400566.6
ENST00000400564.5 |
SAMSN1
|
SAM domain, SH3 domain and nuclear localization signals 1 |
| chr21_+_29300770 | 1.33 |
ENST00000447177.5
|
BACH1
|
BTB domain and CNC homolog 1 |
| chr4_-_175891691 | 1.32 |
ENST00000507540.1
|
GPM6A
|
glycoprotein M6A |
| chr7_-_24980148 | 1.31 |
ENST00000313367.7
|
OSBPL3
|
oxysterol binding protein like 3 |
| chrX_-_21658324 | 1.27 |
ENST00000379499.3
|
KLHL34
|
kelch like family member 34 |
| chr15_+_90872862 | 1.25 |
ENST00000618099.4
|
FURIN
|
furin, paired basic amino acid cleaving enzyme |
| chr7_+_129375830 | 1.22 |
ENST00000466993.5
|
AHCYL2
|
adenosylhomocysteinase like 2 |
| chr5_-_141619049 | 1.22 |
ENST00000647433.1
ENST00000253811.10 ENST00000389057.9 ENST00000398557.8 |
DIAPH1
|
diaphanous related formin 1 |
| chr11_-_85719313 | 1.22 |
ENST00000526999.5
|
SYTL2
|
synaptotagmin like 2 |
| chr5_-_97142579 | 1.21 |
ENST00000274382.9
|
LIX1
|
limb and CNS expressed 1 |
| chr6_-_32190170 | 1.20 |
ENST00000375050.6
|
PBX2
|
PBX homeobox 2 |
| chr17_+_44957907 | 1.15 |
ENST00000678938.1
|
NMT1
|
N-myristoyltransferase 1 |
| chr2_+_48314637 | 1.14 |
ENST00000413569.5
ENST00000340553.8 |
FOXN2
|
forkhead box N2 |
| chr6_-_41733690 | 1.14 |
ENST00000419396.6
ENST00000678831.1 ENST00000394283.5 |
TFEB
|
transcription factor EB |
| chrX_+_10158448 | 1.10 |
ENST00000380829.5
ENST00000421085.7 ENST00000674669.1 ENST00000454850.1 |
CLCN4
|
chloride voltage-gated channel 4 |
| chr4_-_65670478 | 1.10 |
ENST00000613740.5
ENST00000622150.4 ENST00000511294.1 |
EPHA5
|
EPH receptor A5 |
| chr1_+_50108856 | 1.07 |
ENST00000650764.1
ENST00000494555.2 ENST00000371824.7 ENST00000371823.8 ENST00000652693.1 |
ELAVL4
|
ELAV like RNA binding protein 4 |
| chr7_-_116030750 | 1.06 |
ENST00000265440.12
ENST00000320239.11 |
TFEC
|
transcription factor EC |
| chr2_+_232520384 | 1.05 |
ENST00000617714.2
|
PRSS56
|
serine protease 56 |
| chr1_-_101846957 | 1.05 |
ENST00000338858.9
|
OLFM3
|
olfactomedin 3 |
| chr6_+_156776020 | 1.04 |
ENST00000346085.10
|
ARID1B
|
AT-rich interaction domain 1B |
| chr12_-_16610037 | 1.04 |
ENST00000540590.1
|
LMO3
|
LIM domain only 3 |
| chr18_+_34593392 | 1.03 |
ENST00000684377.1
|
DTNA
|
dystrobrevin alpha |
| chr5_-_141618957 | 1.03 |
ENST00000389054.8
|
DIAPH1
|
diaphanous related formin 1 |
| chr8_+_32721823 | 1.02 |
ENST00000539990.3
ENST00000519240.5 |
NRG1
|
neuregulin 1 |
| chr18_+_34978415 | 1.02 |
ENST00000588349.6
|
MAPRE2
|
microtubule associated protein RP/EB family member 2 |
| chr13_-_20231409 | 1.01 |
ENST00000644236.1
|
GJB6
|
gap junction protein beta 6 |
| chr12_-_55927756 | 0.99 |
ENST00000549939.1
|
PYM1
|
PYM homolog 1, exon junction complex associated factor |
| chr14_+_51847116 | 0.97 |
ENST00000553560.5
|
GNG2
|
G protein subunit gamma 2 |
| chr6_-_41734160 | 0.97 |
ENST00000424495.2
ENST00000420312.6 |
TFEB
|
transcription factor EB |
| chr15_+_28886124 | 0.97 |
ENST00000559709.5
|
APBA2
|
amyloid beta precursor protein binding family A member 2 |
| chr15_+_33968484 | 0.96 |
ENST00000383263.7
|
CHRM5
|
cholinergic receptor muscarinic 5 |
| chr1_+_36155573 | 0.95 |
ENST00000429533.6
|
MAP7D1
|
MAP7 domain containing 1 |
| chr5_-_141618914 | 0.95 |
ENST00000518047.5
|
DIAPH1
|
diaphanous related formin 1 |
| chr19_+_1266653 | 0.92 |
ENST00000586472.5
ENST00000589266.5 |
CIRBP
|
cold inducible RNA binding protein |
| chr10_+_11005301 | 0.90 |
ENST00000416382.6
ENST00000631460.1 ENST00000631816.1 |
CELF2
|
CUGBP Elav-like family member 2 |
| chr7_-_33062750 | 0.90 |
ENST00000610140.7
|
NT5C3A
|
5'-nucleotidase, cytosolic IIIA |
| chr9_-_28670285 | 0.90 |
ENST00000379992.6
ENST00000308675.5 ENST00000613945.3 |
LINGO2
|
leucine rich repeat and Ig domain containing 2 |
| chr5_-_97142753 | 0.89 |
ENST00000512378.1
|
LIX1
|
limb and CNS expressed 1 |
| chr4_-_65670339 | 0.88 |
ENST00000273854.7
|
EPHA5
|
EPH receptor A5 |
| chr11_-_85719160 | 0.87 |
ENST00000389958.7
ENST00000527794.5 |
SYTL2
|
synaptotagmin like 2 |
| chr16_+_6483813 | 0.87 |
ENST00000675653.1
|
RBFOX1
|
RNA binding fox-1 homolog 1 |
| chr17_+_74935892 | 0.86 |
ENST00000328801.6
|
OTOP3
|
otopetrin 3 |
| chr5_-_143400716 | 0.86 |
ENST00000424646.6
ENST00000652686.1 |
NR3C1
|
nuclear receptor subfamily 3 group C member 1 |
| chr11_-_85719111 | 0.85 |
ENST00000529581.5
ENST00000533577.1 |
SYTL2
|
synaptotagmin like 2 |
| chr13_-_83882456 | 0.84 |
ENST00000674365.1
|
SLITRK1
|
SLIT and NTRK like family member 1 |
| chr6_+_158017048 | 0.83 |
ENST00000638626.1
|
SYNJ2
|
synaptojanin 2 |
| chr3_-_132037714 | 0.83 |
ENST00000505957.1
|
CPNE4
|
copine 4 |
| chr8_-_42377227 | 0.82 |
ENST00000220812.3
|
DKK4
|
dickkopf WNT signaling pathway inhibitor 4 |
| chr5_+_127649018 | 0.82 |
ENST00000379445.7
|
CTXN3
|
cortexin 3 |
| chr4_-_115113822 | 0.81 |
ENST00000613194.4
|
NDST4
|
N-deacetylase and N-sulfotransferase 4 |
| chr11_-_85719045 | 0.81 |
ENST00000533057.6
ENST00000533892.5 |
SYTL2
|
synaptotagmin like 2 |
| chr12_+_49750598 | 0.80 |
ENST00000552370.5
|
TMBIM6
|
transmembrane BAX inhibitor motif containing 6 |
| chr6_-_110815096 | 0.80 |
ENST00000457688.5
|
CDK19
|
cyclin dependent kinase 19 |
| chr18_-_34224871 | 0.79 |
ENST00000261592.10
|
NOL4
|
nucleolar protein 4 |
| chr13_-_83882390 | 0.77 |
ENST00000377084.3
|
SLITRK1
|
SLIT and NTRK like family member 1 |
| chr16_+_6483728 | 0.77 |
ENST00000675459.1
ENST00000551752.5 |
RBFOX1
|
RNA binding fox-1 homolog 1 |
| chr5_-_135399863 | 0.77 |
ENST00000510038.1
ENST00000304332.8 |
MACROH2A1
|
macroH2A.1 histone |
| chr3_-_108529322 | 0.76 |
ENST00000273353.4
|
MYH15
|
myosin heavy chain 15 |
| chr1_-_1778790 | 0.76 |
ENST00000341991.7
|
NADK
|
NAD kinase |
| chr16_-_18868218 | 0.75 |
ENST00000566328.2
|
SMG1
|
SMG1 nonsense mediated mRNA decay associated PI3K related kinase |
| chr16_-_77431553 | 0.75 |
ENST00000562345.1
|
ADAMTS18
|
ADAM metallopeptidase with thrombospondin type 1 motif 18 |
| chr1_-_37554277 | 0.74 |
ENST00000296215.8
|
SNIP1
|
Smad nuclear interacting protein 1 |
| chr19_-_3557563 | 0.74 |
ENST00000389395.7
ENST00000355415.7 |
MFSD12
|
major facilitator superfamily domain containing 12 |
| chr3_+_35643621 | 0.73 |
ENST00000419330.5
|
ARPP21
|
cAMP regulated phosphoprotein 21 |
| chr6_+_13272709 | 0.73 |
ENST00000379335.8
|
PHACTR1
|
phosphatase and actin regulator 1 |
| chr7_-_116030735 | 0.73 |
ENST00000393485.5
|
TFEC
|
transcription factor EC |
| chr6_-_154247422 | 0.73 |
ENST00000519190.1
|
IPCEF1
|
interaction protein for cytohesin exchange factors 1 |
| chr5_+_136058849 | 0.73 |
ENST00000508076.5
|
TGFBI
|
transforming growth factor beta induced |
| chr16_-_30445865 | 0.71 |
ENST00000478753.5
|
SEPHS2
|
selenophosphate synthetase 2 |
| chr3_+_35680994 | 0.71 |
ENST00000441454.5
|
ARPP21
|
cAMP regulated phosphoprotein 21 |
| chr7_-_111784448 | 0.71 |
ENST00000450156.6
|
DOCK4
|
dedicator of cytokinesis 4 |
| chr1_-_1778399 | 0.71 |
ENST00000341426.9
|
NADK
|
NAD kinase |
| chr7_+_8433602 | 0.71 |
ENST00000405863.6
|
NXPH1
|
neurexophilin 1 |
| chr2_-_174915283 | 0.70 |
ENST00000490654.1
ENST00000652756.1 |
CHN1
|
chimerin 1 |
| chrX_-_18672101 | 0.70 |
ENST00000379984.4
|
RS1
|
retinoschisin 1 |
| chr18_+_34978244 | 0.70 |
ENST00000436190.6
|
MAPRE2
|
microtubule associated protein RP/EB family member 2 |
| chr6_-_110815152 | 0.69 |
ENST00000413605.6
|
CDK19
|
cyclin dependent kinase 19 |
| chr1_+_28259473 | 0.69 |
ENST00000253063.4
|
SESN2
|
sestrin 2 |
| chr4_-_138242325 | 0.68 |
ENST00000280612.9
|
SLC7A11
|
solute carrier family 7 member 11 |
| chr8_+_22987400 | 0.68 |
ENST00000519685.5
|
RHOBTB2
|
Rho related BTB domain containing 2 |
| chr12_+_42331787 | 0.68 |
ENST00000546750.5
ENST00000547847.1 |
PPHLN1
|
periphilin 1 |
| chr16_-_69356306 | 0.67 |
ENST00000563634.1
|
ENSG00000260371.1
|
novel protein |
| chr1_+_66330711 | 0.67 |
ENST00000528771.5
|
PDE4B
|
phosphodiesterase 4B |
| chr6_+_63521738 | 0.67 |
ENST00000648894.1
ENST00000639568.2 |
PTP4A1
|
protein tyrosine phosphatase 4A1 |
| chr12_+_47216531 | 0.66 |
ENST00000548348.1
ENST00000549500.1 |
PCED1B
|
PC-esterase domain containing 1B |
| chr7_-_81770122 | 0.65 |
ENST00000423064.7
|
HGF
|
hepatocyte growth factor |
| chr8_+_32721802 | 0.65 |
ENST00000522402.5
|
NRG1
|
neuregulin 1 |
| chr16_+_53099100 | 0.64 |
ENST00000565832.5
|
CHD9
|
chromodomain helicase DNA binding protein 9 |
| chr12_+_53954870 | 0.64 |
ENST00000243103.4
|
HOXC12
|
homeobox C12 |
| chr17_-_40772162 | 0.63 |
ENST00000335552.4
|
KRT26
|
keratin 26 |
| chr8_+_32721753 | 0.63 |
ENST00000518084.5
|
NRG1
|
neuregulin 1 |
| chr6_-_116545658 | 0.63 |
ENST00000368602.4
|
TRAPPC3L
|
trafficking protein particle complex 3 like |
| chr12_-_53335737 | 0.62 |
ENST00000303846.3
|
SP7
|
Sp7 transcription factor |
| chr17_-_7080275 | 0.62 |
ENST00000571664.1
ENST00000254868.8 |
CLEC10A
|
C-type lectin domain containing 10A |
| chr15_+_51377315 | 0.62 |
ENST00000558426.5
|
GLDN
|
gliomedin |
| chr19_+_49513353 | 0.62 |
ENST00000596975.5
|
FCGRT
|
Fc fragment of IgG receptor and transporter |
| chr3_+_115623502 | 0.61 |
ENST00000305124.11
ENST00000393780.3 |
GAP43
|
growth associated protein 43 |
| chr6_+_150599861 | 0.61 |
ENST00000367326.1
|
PLEKHG1
|
pleckstrin homology and RhoGEF domain containing G1 |
| chr16_-_29899245 | 0.60 |
ENST00000537485.5
|
SEZ6L2
|
seizure related 6 homolog like 2 |
| chr8_+_10095704 | 0.60 |
ENST00000382490.9
|
MSRA
|
methionine sulfoxide reductase A |
| chr4_-_115113614 | 0.60 |
ENST00000264363.7
|
NDST4
|
N-deacetylase and N-sulfotransferase 4 |
| chr8_+_10095551 | 0.60 |
ENST00000522907.5
ENST00000528246.5 |
MSRA
|
methionine sulfoxide reductase A |
| chr10_-_54801262 | 0.59 |
ENST00000373965.6
ENST00000616114.4 ENST00000621708.4 ENST00000495484.5 ENST00000395440.5 ENST00000395442.5 ENST00000617271.4 ENST00000395446.5 ENST00000409834.5 ENST00000361849.7 ENST00000373957.7 ENST00000395430.5 ENST00000395433.5 ENST00000437009.5 |
PCDH15
|
protocadherin related 15 |
| chr17_-_59151794 | 0.59 |
ENST00000584089.1
|
SKA2
|
spindle and kinetochore associated complex subunit 2 |
| chr5_-_116554858 | 0.59 |
ENST00000509665.1
|
SEMA6A
|
semaphorin 6A |
| chr17_-_7080231 | 0.58 |
ENST00000576617.5
ENST00000416562.7 |
CLEC10A
|
C-type lectin domain containing 10A |
| chr8_+_49911396 | 0.58 |
ENST00000642720.2
|
SNTG1
|
syntrophin gamma 1 |
| chr12_+_15546344 | 0.58 |
ENST00000674388.1
ENST00000542557.5 ENST00000445537.6 ENST00000544244.5 ENST00000442921.7 |
PTPRO
|
protein tyrosine phosphatase receptor type O |
| chr1_+_152947154 | 0.58 |
ENST00000636302.1
|
SPRR5
|
small proline rich protein 5 |
| chr7_-_111784406 | 0.57 |
ENST00000664131.1
ENST00000437129.5 |
DOCK4
|
dedicator of cytokinesis 4 |
| chr5_-_55692620 | 0.57 |
ENST00000503817.5
ENST00000512595.5 |
SLC38A9
|
solute carrier family 38 member 9 |
| chr11_-_8268716 | 0.56 |
ENST00000428101.6
|
LMO1
|
LIM domain only 1 |
| chr4_+_56907876 | 0.56 |
ENST00000640168.2
ENST00000309042.12 |
REST
|
RE1 silencing transcription factor |
| chr11_-_129192198 | 0.56 |
ENST00000310343.13
|
ARHGAP32
|
Rho GTPase activating protein 32 |
| chr10_+_102644990 | 0.55 |
ENST00000645961.1
|
TRIM8
|
tripartite motif containing 8 |
| chr4_-_122456725 | 0.54 |
ENST00000226730.5
|
IL2
|
interleukin 2 |
| chr19_-_46634685 | 0.54 |
ENST00000300873.4
|
GNG8
|
G protein subunit gamma 8 |
| chr7_-_81770039 | 0.53 |
ENST00000222390.11
ENST00000453411.6 ENST00000457544.7 ENST00000444829.7 |
HGF
|
hepatocyte growth factor |
| chr2_-_144518261 | 0.52 |
ENST00000392861.6
|
ZEB2
|
zinc finger E-box binding homeobox 2 |
| chr2_-_144517663 | 0.52 |
ENST00000427902.5
ENST00000462355.2 ENST00000470879.5 ENST00000409487.7 ENST00000435831.5 ENST00000630572.2 |
ZEB2
|
zinc finger E-box binding homeobox 2 |
| chr21_-_30881572 | 0.52 |
ENST00000332378.6
|
KRTAP11-1
|
keratin associated protein 11-1 |
| chr11_-_55969945 | 0.52 |
ENST00000641071.2
|
OR10AG1
|
olfactory receptor family 10 subfamily AG member 1 |
| chr12_+_64405046 | 0.51 |
ENST00000540203.5
|
XPOT
|
exportin for tRNA |
| chr1_+_177170916 | 0.51 |
ENST00000361539.5
|
BRINP2
|
BMP/retinoic acid inducible neural specific 2 |
| chr2_+_209579598 | 0.51 |
ENST00000445941.5
ENST00000673860.1 |
MAP2
|
microtubule associated protein 2 |
| chr6_+_49499916 | 0.51 |
ENST00000371197.9
|
GLYATL3
|
glycine-N-acyltransferase like 3 |
| chr15_+_51377410 | 0.50 |
ENST00000612989.1
|
GLDN
|
gliomedin |
| chr8_+_22987482 | 0.50 |
ENST00000524077.5
|
RHOBTB2
|
Rho related BTB domain containing 2 |
| chrX_-_134797134 | 0.49 |
ENST00000370790.5
ENST00000493333.5 ENST00000611027.2 ENST00000343004.10 ENST00000298090.10 |
PABIR2
|
PABIR family member 2 |
| chr3_+_35680932 | 0.49 |
ENST00000396481.6
|
ARPP21
|
cAMP regulated phosphoprotein 21 |
| chr6_-_110815408 | 0.49 |
ENST00000368911.8
|
CDK19
|
cyclin dependent kinase 19 |
| chr16_+_6483379 | 0.49 |
ENST00000552089.5
|
RBFOX1
|
RNA binding fox-1 homolog 1 |
| chr14_-_56805648 | 0.48 |
ENST00000554788.5
ENST00000554845.1 ENST00000408990.8 |
OTX2
|
orthodenticle homeobox 2 |
| chr5_+_90640718 | 0.47 |
ENST00000640403.1
|
ADGRV1
|
adhesion G protein-coupled receptor V1 |
| chr10_-_54801221 | 0.47 |
ENST00000644397.2
ENST00000395445.6 ENST00000613657.5 ENST00000320301.11 |
PCDH15
|
protocadherin related 15 |
| chr12_-_55927865 | 0.47 |
ENST00000454792.2
ENST00000408946.7 |
PYM1
|
PYM homolog 1, exon junction complex associated factor |
| chr1_+_36155930 | 0.47 |
ENST00000316156.8
|
MAP7D1
|
MAP7 domain containing 1 |
| chr10_-_1737516 | 0.46 |
ENST00000381312.6
|
ADARB2
|
adenosine deaminase RNA specific B2 (inactive) |
| chr1_-_244862381 | 0.46 |
ENST00000640001.1
ENST00000639628.1 |
HNRNPU
|
heterogeneous nuclear ribonucleoprotein U |
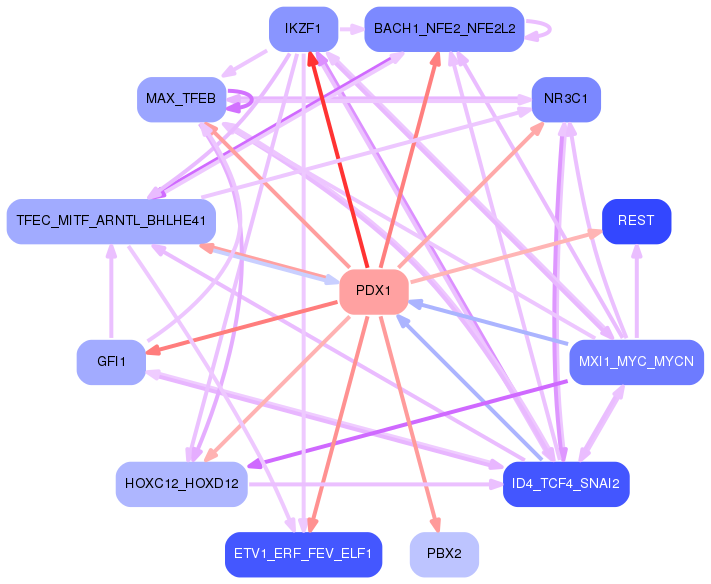
Network of associatons between targets according to the STRING database.

First level regulatory network of PDX1
Gene Ontology Analysis
Gene overrepresentation in biological process category:
| Log-likelihood per target | Total log-likelihood | Term | Description |
|---|---|---|---|
| 2.6 | 13.0 | GO:2000473 | regulation of hematopoietic stem cell migration(GO:2000471) positive regulation of hematopoietic stem cell migration(GO:2000473) |
| 1.1 | 7.9 | GO:1903435 | positive regulation of constitutive secretory pathway(GO:1903435) |
| 0.9 | 4.7 | GO:0015855 | pyrimidine nucleobase transport(GO:0015855) purine nucleobase transmembrane transport(GO:1904823) |
| 0.9 | 6.3 | GO:0001920 | negative regulation of receptor recycling(GO:0001920) |
| 0.8 | 3.4 | GO:0002881 | negative regulation of chronic inflammatory response to non-antigenic stimulus(GO:0002881) |
| 0.6 | 1.9 | GO:0070105 | positive regulation of interleukin-6-mediated signaling pathway(GO:0070105) |
| 0.6 | 4.0 | GO:0010989 | negative regulation of low-density lipoprotein particle clearance(GO:0010989) |
| 0.5 | 3.2 | GO:0000117 | regulation of transcription involved in G2/M transition of mitotic cell cycle(GO:0000117) |
| 0.5 | 1.5 | GO:0032681 | negative regulation of T cell tolerance induction(GO:0002665) negative regulation of T cell anergy(GO:0002668) negative regulation of lymphocyte anergy(GO:0002912) regulation of lymphotoxin A production(GO:0032681) positive regulation of lymphotoxin A production(GO:0032761) regulation of lymphotoxin A biosynthetic process(GO:0043016) positive regulation of lymphotoxin A biosynthetic process(GO:0043017) |
| 0.5 | 1.5 | GO:1903259 | exon-exon junction complex disassembly(GO:1903259) |
| 0.4 | 1.5 | GO:0042223 | response to molecule of fungal origin(GO:0002238) positive regulation of interleukin-3 production(GO:0032752) interleukin-3 biosynthetic process(GO:0042223) regulation of interleukin-3 biosynthetic process(GO:0045399) positive regulation of interleukin-3 biosynthetic process(GO:0045401) cellular response to molecule of fungal origin(GO:0071226) |
| 0.4 | 2.9 | GO:0033353 | S-adenosylmethionine cycle(GO:0033353) |
| 0.4 | 1.8 | GO:1903028 | positive regulation of opsonization(GO:1903028) |
| 0.4 | 2.2 | GO:1903904 | negative regulation of establishment of T cell polarity(GO:1903904) negative regulation of Rho guanyl-nucleotide exchange factor activity(GO:2001107) |
| 0.3 | 1.7 | GO:0060474 | positive regulation of sperm motility involved in capacitation(GO:0060474) |
| 0.3 | 1.2 | GO:0032903 | viral protein processing(GO:0019082) regulation of nerve growth factor production(GO:0032903) negative regulation of nerve growth factor production(GO:0032904) dibasic protein processing(GO:0090472) |
| 0.3 | 2.5 | GO:0035696 | monocyte extravasation(GO:0035696) |
| 0.3 | 1.2 | GO:0018008 | N-terminal peptidyl-glycine N-myristoylation(GO:0018008) |
| 0.2 | 3.8 | GO:0070257 | positive regulation of mucus secretion(GO:0070257) |
| 0.2 | 0.7 | GO:0090526 | regulation of gluconeogenesis involved in cellular glucose homeostasis(GO:0090526) |
| 0.2 | 0.6 | GO:0002416 | IgG immunoglobulin transcytosis in epithelial cells mediated by FcRn immunoglobulin receptor(GO:0002416) |
| 0.2 | 1.6 | GO:0061743 | motor learning(GO:0061743) |
| 0.2 | 2.5 | GO:1902748 | positive regulation of lens fiber cell differentiation(GO:1902748) |
| 0.2 | 2.5 | GO:0034350 | regulation of glial cell apoptotic process(GO:0034350) negative regulation of glial cell apoptotic process(GO:0034351) |
| 0.2 | 3.2 | GO:0035372 | protein localization to microtubule(GO:0035372) |
| 0.2 | 0.6 | GO:2000798 | amniotic stem cell differentiation(GO:0097086) negative regulation of dense core granule biogenesis(GO:2000706) negative regulation of mesenchymal stem cell differentiation(GO:2000740) regulation of amniotic stem cell differentiation(GO:2000797) negative regulation of amniotic stem cell differentiation(GO:2000798) |
| 0.2 | 1.5 | GO:0006741 | NADP biosynthetic process(GO:0006741) |
| 0.2 | 1.3 | GO:1904694 | negative regulation of vascular smooth muscle contraction(GO:1904694) |
| 0.2 | 4.6 | GO:0071803 | positive regulation of podosome assembly(GO:0071803) |
| 0.2 | 0.7 | GO:0016259 | selenocysteine metabolic process(GO:0016259) |
| 0.2 | 0.5 | GO:0042309 | octopamine biosynthetic process(GO:0006589) homoiothermy(GO:0042309) octopamine metabolic process(GO:0046333) |
| 0.2 | 0.9 | GO:0046013 | regulation of T cell homeostatic proliferation(GO:0046013) |
| 0.2 | 0.7 | GO:0036367 | adaptation of rhodopsin mediated signaling(GO:0016062) light adaption(GO:0036367) |
| 0.2 | 3.1 | GO:0070050 | neuron cellular homeostasis(GO:0070050) |
| 0.2 | 2.4 | GO:1900028 | negative regulation of ruffle assembly(GO:1900028) |
| 0.2 | 0.8 | GO:0051758 | homologous chromosome movement towards spindle pole involved in homologous chromosome segregation(GO:0051758) |
| 0.1 | 0.4 | GO:1904717 | excitatory chemical synaptic transmission(GO:0098976) regulation of AMPA glutamate receptor clustering(GO:1904717) positive regulation of AMPA glutamate receptor clustering(GO:1904719) |
| 0.1 | 0.6 | GO:0036060 | filtration diaphragm assembly(GO:0036058) slit diaphragm assembly(GO:0036060) |
| 0.1 | 0.4 | GO:0014016 | neuroblast differentiation(GO:0014016) |
| 0.1 | 0.8 | GO:0051799 | negative regulation of hair follicle development(GO:0051799) |
| 0.1 | 2.3 | GO:0038129 | directional guidance of interneurons involved in migration from the subpallium to the cortex(GO:0021840) chemorepulsion involved in interneuron migration from the subpallium to the cortex(GO:0021842) ERBB3 signaling pathway(GO:0038129) |
| 0.1 | 1.0 | GO:0097026 | dendritic cell dendrite assembly(GO:0097026) |
| 0.1 | 2.0 | GO:0032876 | negative regulation of DNA endoreduplication(GO:0032876) |
| 0.1 | 0.4 | GO:0070175 | positive regulation of enamel mineralization(GO:0070175) |
| 0.1 | 0.8 | GO:1904721 | negative regulation of mRNA cleavage(GO:0031438) negative regulation of mRNA endonucleolytic cleavage involved in unfolded protein response(GO:1904721) |
| 0.1 | 1.4 | GO:0060665 | regulation of branching involved in salivary gland morphogenesis by mesenchymal-epithelial signaling(GO:0060665) |
| 0.1 | 1.0 | GO:0007197 | adenylate cyclase-inhibiting G-protein coupled acetylcholine receptor signaling pathway(GO:0007197) |
| 0.1 | 0.3 | GO:0071626 | mastication(GO:0071626) learned vocalization behavior(GO:0098583) |
| 0.1 | 3.7 | GO:0046339 | diacylglycerol metabolic process(GO:0046339) |
| 0.1 | 1.2 | GO:0050957 | equilibrioception(GO:0050957) |
| 0.1 | 0.4 | GO:0034445 | regulation of plasma lipoprotein particle oxidation(GO:0034444) negative regulation of plasma lipoprotein particle oxidation(GO:0034445) |
| 0.1 | 1.2 | GO:0030091 | protein repair(GO:0030091) |
| 0.1 | 1.5 | GO:0010917 | negative regulation of mitochondrial membrane potential(GO:0010917) |
| 0.1 | 2.7 | GO:0015671 | oxygen transport(GO:0015671) |
| 0.1 | 0.3 | GO:0042427 | serotonin biosynthetic process(GO:0042427) |
| 0.1 | 0.5 | GO:0006409 | tRNA export from nucleus(GO:0006409) tRNA-containing ribonucleoprotein complex export from nucleus(GO:0071431) |
| 0.1 | 0.3 | GO:0010133 | proline catabolic process to glutamate(GO:0010133) |
| 0.1 | 1.3 | GO:0007213 | G-protein coupled acetylcholine receptor signaling pathway(GO:0007213) |
| 0.1 | 2.7 | GO:0071380 | cellular response to prostaglandin E stimulus(GO:0071380) |
| 0.1 | 1.4 | GO:0030202 | heparin metabolic process(GO:0030202) heparin biosynthetic process(GO:0030210) |
| 0.1 | 0.4 | GO:0071918 | urea transmembrane transport(GO:0071918) |
| 0.1 | 0.2 | GO:0060266 | negative regulation of NAD(P)H oxidase activity(GO:0033861) negative regulation of respiratory burst involved in inflammatory response(GO:0060266) |
| 0.1 | 1.4 | GO:0045162 | clustering of voltage-gated sodium channels(GO:0045162) |
| 0.1 | 0.5 | GO:0019236 | response to pheromone(GO:0019236) |
| 0.1 | 2.0 | GO:0032793 | positive regulation of CREB transcription factor activity(GO:0032793) |
| 0.1 | 0.4 | GO:0060023 | soft palate development(GO:0060023) |
| 0.1 | 0.3 | GO:0097403 | cellular response to raffinose(GO:0097403) response to raffinose(GO:1901545) |
| 0.1 | 0.1 | GO:0014034 | neural crest cell fate commitment(GO:0014034) |
| 0.1 | 0.4 | GO:0089712 | L-aspartate transport(GO:0070778) L-aspartate transmembrane transport(GO:0089712) |
| 0.1 | 0.9 | GO:0043402 | glucocorticoid mediated signaling pathway(GO:0043402) |
| 0.0 | 1.6 | GO:0042789 | mRNA transcription from RNA polymerase II promoter(GO:0042789) |
| 0.0 | 0.6 | GO:0016198 | axon choice point recognition(GO:0016198) |
| 0.0 | 0.9 | GO:0046085 | adenosine metabolic process(GO:0046085) |
| 0.0 | 0.3 | GO:0051970 | negative regulation of transmission of nerve impulse(GO:0051970) |
| 0.0 | 0.7 | GO:1901078 | negative regulation of relaxation of muscle(GO:1901078) |
| 0.0 | 1.1 | GO:0007064 | mitotic sister chromatid cohesion(GO:0007064) |
| 0.0 | 1.4 | GO:0050860 | negative regulation of T cell receptor signaling pathway(GO:0050860) |
| 0.0 | 1.5 | GO:0043555 | regulation of translation in response to stress(GO:0043555) |
| 0.0 | 0.4 | GO:0051835 | positive regulation of synapse structural plasticity(GO:0051835) |
| 0.0 | 0.2 | GO:0043353 | enucleate erythrocyte differentiation(GO:0043353) |
| 0.0 | 0.2 | GO:0010814 | substance P catabolic process(GO:0010814) calcitonin catabolic process(GO:0010816) endothelin maturation(GO:0034959) |
| 0.0 | 0.2 | GO:0050916 | sensory perception of sweet taste(GO:0050916) |
| 0.0 | 2.1 | GO:0097352 | autophagosome maturation(GO:0097352) |
| 0.0 | 0.5 | GO:0070934 | CRD-mediated mRNA stabilization(GO:0070934) |
| 0.0 | 0.2 | GO:0070562 | regulation of vitamin D receptor signaling pathway(GO:0070562) |
| 0.0 | 0.5 | GO:2000543 | positive regulation of gastrulation(GO:2000543) |
| 0.0 | 0.9 | GO:0034063 | stress granule assembly(GO:0034063) |
| 0.0 | 0.5 | GO:1902187 | negative regulation of viral release from host cell(GO:1902187) |
| 0.0 | 0.2 | GO:0043249 | erythrocyte maturation(GO:0043249) |
| 0.0 | 1.3 | GO:0050869 | negative regulation of B cell activation(GO:0050869) |
| 0.0 | 0.7 | GO:0089711 | L-glutamate transmembrane transport(GO:0089711) |
| 0.0 | 0.7 | GO:0090331 | negative regulation of platelet aggregation(GO:0090331) |
| 0.0 | 0.2 | GO:0030579 | ubiquitin-dependent SMAD protein catabolic process(GO:0030579) |
| 0.0 | 2.1 | GO:0000381 | regulation of alternative mRNA splicing, via spliceosome(GO:0000381) |
| 0.0 | 1.3 | GO:0051491 | positive regulation of filopodium assembly(GO:0051491) |
| 0.0 | 1.2 | GO:0009954 | proximal/distal pattern formation(GO:0009954) |
| 0.0 | 0.2 | GO:0006600 | creatine metabolic process(GO:0006600) |
| 0.0 | 0.6 | GO:2001224 | positive regulation of neuron migration(GO:2001224) |
| 0.0 | 1.3 | GO:0006699 | bile acid biosynthetic process(GO:0006699) |
| 0.0 | 2.2 | GO:0002292 | T cell differentiation involved in immune response(GO:0002292) |
| 0.0 | 1.0 | GO:0042462 | eye photoreceptor cell development(GO:0042462) |
| 0.0 | 5.3 | GO:0035264 | multicellular organism growth(GO:0035264) |
| 0.0 | 1.7 | GO:0061001 | regulation of dendritic spine morphogenesis(GO:0061001) |
| 0.0 | 0.3 | GO:0097118 | neuroligin clustering involved in postsynaptic membrane assembly(GO:0097118) |
| 0.0 | 0.3 | GO:0019532 | oxalate transport(GO:0019532) |
| 0.0 | 0.7 | GO:0045494 | photoreceptor cell maintenance(GO:0045494) |
| 0.0 | 0.1 | GO:0035726 | common myeloid progenitor cell proliferation(GO:0035726) |
| 0.0 | 3.4 | GO:0051291 | protein heterooligomerization(GO:0051291) |
| 0.0 | 1.5 | GO:0046579 | positive regulation of Ras protein signal transduction(GO:0046579) |
| 0.0 | 0.9 | GO:0006376 | mRNA splice site selection(GO:0006376) |
| 0.0 | 0.2 | GO:2000620 | positive regulation of histone H4-K16 acetylation(GO:2000620) |
| 0.0 | 0.4 | GO:0031069 | hair follicle morphogenesis(GO:0031069) |
| 0.0 | 0.8 | GO:0046856 | phosphatidylinositol dephosphorylation(GO:0046856) |
| 0.0 | 1.1 | GO:1903959 | regulation of anion transmembrane transport(GO:1903959) |
| 0.0 | 3.7 | GO:0034605 | cellular response to heat(GO:0034605) |
| 0.0 | 1.9 | GO:0001892 | embryonic placenta development(GO:0001892) |
| 0.0 | 0.2 | GO:0030949 | positive regulation of vascular endothelial growth factor receptor signaling pathway(GO:0030949) |
| 0.0 | 0.7 | GO:0008045 | motor neuron axon guidance(GO:0008045) |
| 0.0 | 0.2 | GO:1900625 | monocyte aggregation(GO:0070487) regulation of monocyte aggregation(GO:1900623) positive regulation of monocyte aggregation(GO:1900625) |
| 0.0 | 1.7 | GO:0060218 | hematopoietic stem cell differentiation(GO:0060218) |
| 0.0 | 0.2 | GO:0090160 | Golgi to lysosome transport(GO:0090160) |
Gene overrepresentation in cellular component category:
| Log-likelihood per target | Total log-likelihood | Term | Description |
|---|---|---|---|
| 0.3 | 1.5 | GO:0019815 | B cell receptor complex(GO:0019815) |
| 0.3 | 7.9 | GO:0033162 | melanosome membrane(GO:0033162) chitosome(GO:0045009) |
| 0.2 | 3.7 | GO:0031618 | nuclear pericentric heterochromatin(GO:0031618) |
| 0.2 | 6.3 | GO:0042101 | T cell receptor complex(GO:0042101) |
| 0.2 | 2.2 | GO:0060171 | stereocilium membrane(GO:0060171) |
| 0.2 | 2.8 | GO:0016013 | syntrophin complex(GO:0016013) |
| 0.1 | 0.4 | GO:0005592 | collagen type XI trimer(GO:0005592) |
| 0.1 | 1.7 | GO:0097524 | sperm plasma membrane(GO:0097524) |
| 0.1 | 4.8 | GO:0001891 | phagocytic cup(GO:0001891) |
| 0.1 | 0.4 | GO:0034365 | discoidal high-density lipoprotein particle(GO:0034365) |
| 0.1 | 4.6 | GO:0044298 | neuronal cell body membrane(GO:0032809) cell body membrane(GO:0044298) |
| 0.1 | 0.2 | GO:0034657 | GID complex(GO:0034657) |
| 0.1 | 0.4 | GO:0000444 | MIS12/MIND type complex(GO:0000444) |
| 0.1 | 0.6 | GO:0032584 | growth cone membrane(GO:0032584) |
| 0.1 | 1.5 | GO:0000164 | protein phosphatase type 1 complex(GO:0000164) |
| 0.1 | 0.2 | GO:0071062 | alphav-beta3 integrin-vitronectin complex(GO:0071062) |
| 0.1 | 0.7 | GO:1990316 | ATG1/ULK1 kinase complex(GO:1990316) |
| 0.1 | 0.6 | GO:0071986 | Ragulator complex(GO:0071986) |
| 0.1 | 5.8 | GO:0031463 | Cul3-RING ubiquitin ligase complex(GO:0031463) |
| 0.0 | 1.3 | GO:0032433 | filopodium tip(GO:0032433) |
| 0.0 | 0.5 | GO:0097442 | CA3 pyramidal cell dendrite(GO:0097442) |
| 0.0 | 0.2 | GO:0005726 | perichromatin fibrils(GO:0005726) |
| 0.0 | 3.4 | GO:0005834 | heterotrimeric G-protein complex(GO:0005834) |
| 0.0 | 4.7 | GO:0101003 | ficolin-1-rich granule membrane(GO:0101003) |
| 0.0 | 18.6 | GO:0009897 | external side of plasma membrane(GO:0009897) |
| 0.0 | 0.6 | GO:0030008 | TRAPP complex(GO:0030008) |
| 0.0 | 0.5 | GO:0042584 | chromaffin granule membrane(GO:0042584) |
| 0.0 | 0.6 | GO:0000940 | condensed chromosome outer kinetochore(GO:0000940) |
| 0.0 | 1.7 | GO:0035371 | microtubule plus-end(GO:0035371) |
| 0.0 | 2.0 | GO:0016592 | mediator complex(GO:0016592) |
| 0.0 | 1.3 | GO:0044295 | axonal growth cone(GO:0044295) |
| 0.0 | 2.5 | GO:0019005 | SCF ubiquitin ligase complex(GO:0019005) |
| 0.0 | 1.0 | GO:0035145 | exon-exon junction complex(GO:0035145) |
| 0.0 | 0.4 | GO:0042622 | photoreceptor outer segment membrane(GO:0042622) |
| 0.0 | 0.4 | GO:0070938 | contractile ring(GO:0070938) |
| 0.0 | 1.8 | GO:0032420 | stereocilium(GO:0032420) |
| 0.0 | 6.2 | GO:0019897 | extrinsic component of plasma membrane(GO:0019897) |
| 0.0 | 0.5 | GO:0070937 | CRD-mediated mRNA stability complex(GO:0070937) |
| 0.0 | 0.8 | GO:0032982 | myosin filament(GO:0032982) |
| 0.0 | 1.0 | GO:0071565 | nBAF complex(GO:0071565) |
| 0.0 | 0.2 | GO:0000801 | central element(GO:0000801) |
| 0.0 | 0.7 | GO:0000930 | gamma-tubulin complex(GO:0000930) |
| 0.0 | 1.0 | GO:0032281 | AMPA glutamate receptor complex(GO:0032281) |
| 0.0 | 0.2 | GO:0035692 | macrophage migration inhibitory factor receptor complex(GO:0035692) |
| 0.0 | 6.0 | GO:0043209 | myelin sheath(GO:0043209) |
| 0.0 | 5.9 | GO:0005802 | trans-Golgi network(GO:0005802) |
| 0.0 | 2.8 | GO:0017053 | transcriptional repressor complex(GO:0017053) |
| 0.0 | 4.0 | GO:0008021 | synaptic vesicle(GO:0008021) |
| 0.0 | 0.2 | GO:0000813 | ESCRT I complex(GO:0000813) |
| 0.0 | 1.1 | GO:0045095 | keratin filament(GO:0045095) |
Gene overrepresentation in molecular function category:
| Log-likelihood per target | Total log-likelihood | Term | Description |
|---|---|---|---|
| 0.9 | 4.7 | GO:0005350 | pyrimidine nucleobase transmembrane transporter activity(GO:0005350) |
| 0.8 | 3.4 | GO:0016495 | C-X3-C chemokine receptor activity(GO:0016495) |
| 0.4 | 2.9 | GO:0016802 | adenosylhomocysteinase activity(GO:0004013) trialkylsulfonium hydrolase activity(GO:0016802) |
| 0.3 | 13.6 | GO:0019198 | transmembrane receptor protein tyrosine phosphatase activity(GO:0005001) transmembrane receptor protein phosphatase activity(GO:0019198) |
| 0.3 | 1.2 | GO:0004379 | glycylpeptide N-tetradecanoyltransferase activity(GO:0004379) myristoyltransferase activity(GO:0019107) |
| 0.3 | 2.5 | GO:0004699 | calcium-independent protein kinase C activity(GO:0004699) |
| 0.2 | 7.9 | GO:0031489 | myosin V binding(GO:0031489) |
| 0.2 | 0.9 | GO:0008665 | 2'-phosphotransferase activity(GO:0008665) |
| 0.2 | 6.3 | GO:0005068 | transmembrane receptor protein tyrosine kinase adaptor activity(GO:0005068) |
| 0.2 | 1.2 | GO:0008113 | peptide-methionine (S)-S-oxide reductase activity(GO:0008113) |
| 0.2 | 0.5 | GO:0004500 | dopamine beta-monooxygenase activity(GO:0004500) |
| 0.2 | 0.6 | GO:0019770 | IgG receptor activity(GO:0019770) |
| 0.2 | 3.2 | GO:0001206 | transcriptional repressor activity, RNA polymerase II distal enhancer sequence-specific binding(GO:0001206) |
| 0.2 | 2.0 | GO:0005005 | transmembrane-ephrin receptor activity(GO:0005005) |
| 0.1 | 1.4 | GO:0015016 | [heparan sulfate]-glucosamine N-sulfotransferase activity(GO:0015016) |
| 0.1 | 0.7 | GO:0005294 | neutral L-amino acid secondary active transmembrane transporter activity(GO:0005294) |
| 0.1 | 3.7 | GO:0004143 | diacylglycerol kinase activity(GO:0004143) |
| 0.1 | 2.7 | GO:0031681 | G-protein beta-subunit binding(GO:0031681) |
| 0.1 | 2.7 | GO:0005344 | oxygen transporter activity(GO:0005344) |
| 0.1 | 4.0 | GO:0034236 | protein kinase A catalytic subunit binding(GO:0034236) |
| 0.1 | 0.5 | GO:0052829 | inositol-1,4-bisphosphate 1-phosphatase activity(GO:0004441) inositol-1,3,4-trisphosphate 1-phosphatase activity(GO:0052829) |
| 0.1 | 0.9 | GO:0038051 | glucocorticoid receptor activity(GO:0004883) glucocorticoid-activated RNA polymerase II transcription factor binding transcription factor activity(GO:0038051) |
| 0.1 | 1.0 | GO:0016907 | G-protein coupled acetylcholine receptor activity(GO:0016907) |
| 0.1 | 2.3 | GO:0043125 | transmembrane receptor protein tyrosine kinase activator activity(GO:0030297) ErbB-3 class receptor binding(GO:0043125) |
| 0.1 | 2.4 | GO:0005522 | profilin binding(GO:0005522) |
| 0.1 | 0.8 | GO:0060698 | endoribonuclease inhibitor activity(GO:0060698) |
| 0.1 | 1.7 | GO:0019957 | C-C chemokine binding(GO:0019957) |
| 0.1 | 1.5 | GO:0004716 | receptor signaling protein tyrosine kinase activity(GO:0004716) |
| 0.1 | 0.9 | GO:0047961 | glycine N-acyltransferase activity(GO:0047961) |
| 0.1 | 0.4 | GO:0015265 | urea channel activity(GO:0015265) |
| 0.1 | 0.8 | GO:0043813 | phosphatidylinositol-3,5-bisphosphate 5-phosphatase activity(GO:0043813) |
| 0.1 | 0.5 | GO:0043208 | glycosphingolipid binding(GO:0043208) |
| 0.1 | 1.5 | GO:0003951 | NAD+ kinase activity(GO:0003951) |
| 0.1 | 0.7 | GO:0070728 | leucine binding(GO:0070728) |
| 0.1 | 0.9 | GO:0070181 | small ribosomal subunit rRNA binding(GO:0070181) |
| 0.1 | 1.2 | GO:0048406 | nerve growth factor binding(GO:0048406) |
| 0.1 | 0.6 | GO:0035727 | lysophosphatidic acid binding(GO:0035727) |
| 0.1 | 4.5 | GO:0005547 | phosphatidylinositol-3,4,5-trisphosphate binding(GO:0005547) |
| 0.1 | 0.4 | GO:0015183 | L-aspartate transmembrane transporter activity(GO:0015183) |
| 0.1 | 1.4 | GO:0086080 | protein binding involved in heterotypic cell-cell adhesion(GO:0086080) |
| 0.0 | 2.3 | GO:0008157 | protein phosphatase 1 binding(GO:0008157) |
| 0.0 | 1.1 | GO:0017151 | DEAD/H-box RNA helicase binding(GO:0017151) |
| 0.0 | 3.6 | GO:0001786 | phosphatidylserine binding(GO:0001786) |
| 0.0 | 2.4 | GO:0046875 | ephrin receptor binding(GO:0046875) |
| 0.0 | 1.1 | GO:0005247 | voltage-gated chloride channel activity(GO:0005247) |
| 0.0 | 3.0 | GO:0001205 | transcriptional activator activity, RNA polymerase II distal enhancer sequence-specific binding(GO:0001205) |
| 0.0 | 0.4 | GO:0016714 | oxidoreductase activity, acting on paired donors, with incorporation or reduction of molecular oxygen, reduced pteridine as one donor, and incorporation of one atom of oxygen(GO:0016714) |
| 0.0 | 3.7 | GO:0001540 | beta-amyloid binding(GO:0001540) |
| 0.0 | 0.1 | GO:0090555 | phosphatidylethanolamine-translocating ATPase activity(GO:0090555) |
| 0.0 | 0.1 | GO:0004773 | steryl-sulfatase activity(GO:0004773) |
| 0.0 | 2.2 | GO:0034987 | immunoglobulin receptor binding(GO:0034987) |
| 0.0 | 1.3 | GO:0001784 | phosphotyrosine binding(GO:0001784) |
| 0.0 | 0.4 | GO:0030020 | extracellular matrix structural constituent conferring tensile strength(GO:0030020) |
| 0.0 | 1.6 | GO:0043027 | cysteine-type endopeptidase inhibitor activity involved in apoptotic process(GO:0043027) |
| 0.0 | 1.4 | GO:0017091 | AU-rich element binding(GO:0017091) |
| 0.0 | 1.3 | GO:0015248 | sterol transporter activity(GO:0015248) |
| 0.0 | 2.0 | GO:0004693 | cyclin-dependent protein serine/threonine kinase activity(GO:0004693) |
| 0.0 | 1.8 | GO:0043531 | ADP binding(GO:0043531) |
| 0.0 | 0.2 | GO:0004111 | creatine kinase activity(GO:0004111) |
| 0.0 | 2.3 | GO:0046934 | phosphatidylinositol-4,5-bisphosphate 3-kinase activity(GO:0046934) |
| 0.0 | 0.2 | GO:0032184 | SUMO polymer binding(GO:0032184) |
| 0.0 | 1.7 | GO:0001102 | RNA polymerase II activating transcription factor binding(GO:0001102) |
| 0.0 | 0.6 | GO:0015271 | outward rectifier potassium channel activity(GO:0015271) |
| 0.0 | 0.2 | GO:0034056 | estrogen response element binding(GO:0034056) |
| 0.0 | 0.3 | GO:0019531 | oxalate transmembrane transporter activity(GO:0019531) |
| 0.0 | 0.5 | GO:0004000 | adenosine deaminase activity(GO:0004000) |
| 0.0 | 3.4 | GO:0017048 | Rho GTPase binding(GO:0017048) |
| 0.0 | 5.0 | GO:0051015 | actin filament binding(GO:0051015) |
| 0.0 | 1.5 | GO:0043022 | ribosome binding(GO:0043022) |
| 0.0 | 0.5 | GO:0008190 | eukaryotic initiation factor 4E binding(GO:0008190) |
| 0.0 | 0.5 | GO:0002162 | dystroglycan binding(GO:0002162) |
| 0.0 | 0.2 | GO:0043184 | vascular endothelial growth factor receptor 2 binding(GO:0043184) |
| 0.0 | 0.9 | GO:0036002 | pre-mRNA binding(GO:0036002) |
| 0.0 | 1.1 | GO:0008138 | protein tyrosine/serine/threonine phosphatase activity(GO:0008138) |
| 0.0 | 0.6 | GO:0070577 | lysine-acetylated histone binding(GO:0070577) |
| 0.0 | 0.7 | GO:0004115 | 3',5'-cyclic-AMP phosphodiesterase activity(GO:0004115) |
| 0.0 | 2.3 | GO:0003774 | motor activity(GO:0003774) |
| 0.0 | 0.3 | GO:0097109 | neuroligin family protein binding(GO:0097109) |
| 0.0 | 0.5 | GO:0004003 | ATP-dependent DNA helicase activity(GO:0004003) |
Gene overrepresentation in curated gene sets: canonical pathways category:
| Log-likelihood per target | Total log-likelihood | Term | Description |
|---|---|---|---|
| 0.2 | 14.1 | SIG PIP3 SIGNALING IN B LYMPHOCYTES | Genes related to PIP3 signaling in B lymphocytes |
| 0.1 | 2.7 | PID THROMBIN PAR4 PATHWAY | PAR4-mediated thrombin signaling events |
| 0.1 | 8.1 | PID ARF6 PATHWAY | Arf6 signaling events |
| 0.1 | 8.0 | PID NFAT TFPATHWAY | Calcineurin-regulated NFAT-dependent transcription in lymphocytes |
| 0.1 | 4.0 | ST B CELL ANTIGEN RECEPTOR | B Cell Antigen Receptor |
| 0.1 | 2.3 | PID ERBB NETWORK PATHWAY | ErbB receptor signaling network |
| 0.0 | 2.5 | PID TXA2PATHWAY | Thromboxane A2 receptor signaling |
| 0.0 | 2.0 | PID EPHA FWDPATHWAY | EPHA forward signaling |
| 0.0 | 3.2 | PID RHOA PATHWAY | RhoA signaling pathway |
| 0.0 | 0.6 | PID NCADHERIN PATHWAY | N-cadherin signaling events |
| 0.0 | 1.5 | PID IL12 STAT4 PATHWAY | IL12 signaling mediated by STAT4 |
| 0.0 | 1.4 | PID IL2 STAT5 PATHWAY | IL2 signaling events mediated by STAT5 |
| 0.0 | 2.0 | PID PLK1 PATHWAY | PLK1 signaling events |
| 0.0 | 0.6 | PID KIT PATHWAY | Signaling events mediated by Stem cell factor receptor (c-Kit) |
| 0.0 | 1.1 | PID INTEGRIN2 PATHWAY | Beta2 integrin cell surface interactions |
| 0.0 | 0.7 | PID PRL SIGNALING EVENTS PATHWAY | Signaling events mediated by PRL |
| 0.0 | 1.4 | PID TAP63 PATHWAY | Validated transcriptional targets of TAp63 isoforms |
| 0.0 | 0.2 | PID LYMPH ANGIOGENESIS PATHWAY | VEGFR3 signaling in lymphatic endothelium |
| 0.0 | 1.1 | PID HNF3B PATHWAY | FOXA2 and FOXA3 transcription factor networks |
| 0.0 | 1.2 | PID NOTCH PATHWAY | Notch signaling pathway |
Gene overrepresentation in curated gene sets: REACTOME pathways category:
| Log-likelihood per target | Total log-likelihood | Term | Description |
|---|---|---|---|
| 0.6 | 17.0 | REACTOME PHOSPHORYLATION OF CD3 AND TCR ZETA CHAINS | Genes involved in Phosphorylation of CD3 and TCR zeta chains |
| 0.3 | 4.7 | REACTOME PASSIVE TRANSPORT BY AQUAPORINS | Genes involved in Passive Transport by Aquaporins |
| 0.2 | 8.1 | REACTOME INSULIN SYNTHESIS AND PROCESSING | Genes involved in Insulin Synthesis and Processing |
| 0.1 | 6.3 | REACTOME DOWNSTREAM TCR SIGNALING | Genes involved in Downstream TCR signaling |
| 0.1 | 6.2 | REACTOME EFFECTS OF PIP2 HYDROLYSIS | Genes involved in Effects of PIP2 hydrolysis |
| 0.1 | 3.2 | REACTOME G BETA GAMMA SIGNALLING THROUGH PLC BETA | Genes involved in G beta:gamma signalling through PLC beta |
| 0.1 | 1.5 | REACTOME REGULATION OF SIGNALING BY CBL | Genes involved in Regulation of signaling by CBL |
| 0.1 | 2.0 | REACTOME SIGNALING BY FGFR1 FUSION MUTANTS | Genes involved in Signaling by FGFR1 fusion mutants |
| 0.1 | 2.3 | REACTOME GENERATION OF SECOND MESSENGER MOLECULES | Genes involved in Generation of second messenger molecules |
| 0.1 | 5.0 | REACTOME CHEMOKINE RECEPTORS BIND CHEMOKINES | Genes involved in Chemokine receptors bind chemokines |
| 0.1 | 1.4 | REACTOME IL 7 SIGNALING | Genes involved in Interleukin-7 signaling |
| 0.1 | 1.5 | REACTOME CD28 DEPENDENT VAV1 PATHWAY | Genes involved in CD28 dependent Vav1 pathway |
| 0.1 | 1.2 | REACTOME GAMMA CARBOXYLATION TRANSPORT AND AMINO TERMINAL CLEAVAGE OF PROTEINS | Genes involved in Gamma-carboxylation, transport, and amino-terminal cleavage of proteins |
| 0.1 | 1.5 | REACTOME ACTIVATION OF BH3 ONLY PROTEINS | Genes involved in Activation of BH3-only proteins |
| 0.0 | 2.3 | REACTOME DOWNREGULATION OF ERBB2 ERBB3 SIGNALING | Genes involved in Downregulation of ERBB2:ERBB3 signaling |
| 0.0 | 1.2 | REACTOME INTRINSIC PATHWAY FOR APOPTOSIS | Genes involved in Intrinsic Pathway for Apoptosis |
| 0.0 | 1.4 | REACTOME HS GAG BIOSYNTHESIS | Genes involved in HS-GAG biosynthesis |
| 0.0 | 0.9 | REACTOME BMAL1 CLOCK NPAS2 ACTIVATES CIRCADIAN EXPRESSION | Genes involved in BMAL1:CLOCK/NPAS2 Activates Circadian Expression |
| 0.0 | 1.2 | REACTOME AMYLOIDS | Genes involved in Amyloids |
| 0.0 | 2.0 | REACTOME MEIOTIC SYNAPSIS | Genes involved in Meiotic Synapsis |
| 0.0 | 0.5 | REACTOME AMINE DERIVED HORMONES | Genes involved in Amine-derived hormones |
| 0.0 | 1.0 | REACTOME AMINE LIGAND BINDING RECEPTORS | Genes involved in Amine ligand-binding receptors |
| 0.0 | 0.8 | REACTOME SYNTHESIS OF PIPS AT THE PLASMA MEMBRANE | Genes involved in Synthesis of PIPs at the plasma membrane |
| 0.0 | 0.5 | REACTOME IL RECEPTOR SHC SIGNALING | Genes involved in Interleukin receptor SHC signaling |
| 0.0 | 0.6 | REACTOME OTHER SEMAPHORIN INTERACTIONS | Genes involved in Other semaphorin interactions |
| 0.0 | 4.1 | REACTOME SIGNALING BY RHO GTPASES | Genes involved in Signaling by Rho GTPases |
| 0.0 | 0.3 | REACTOME DESTABILIZATION OF MRNA BY BRF1 | Genes involved in Destabilization of mRNA by Butyrate Response Factor 1 (BRF1) |
| 0.0 | 2.0 | REACTOME TRANSCRIPTIONAL REGULATION OF WHITE ADIPOCYTE DIFFERENTIATION | Genes involved in Transcriptional Regulation of White Adipocyte Differentiation |
| 0.0 | 0.7 | REACTOME BASIGIN INTERACTIONS | Genes involved in Basigin interactions |