Project
Illumina Body Map 2 (GSE30611)
Navigation
Downloads
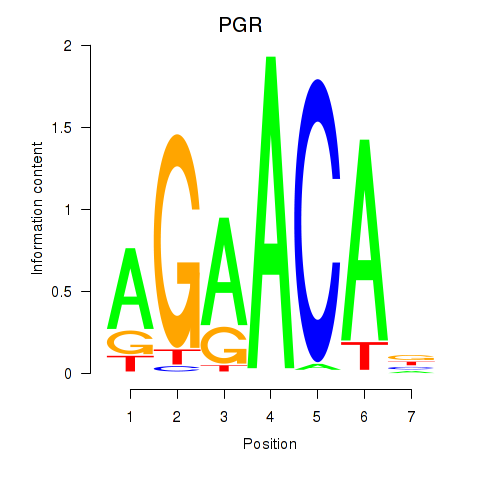
Results for PGR
Z-value: 0.97
Motif logo
Transcription factors associated with PGR
| Gene Symbol | Gene ID | Gene Info |
|---|---|---|
|
PGR
|
ENSG00000082175.15 | progesterone receptor |
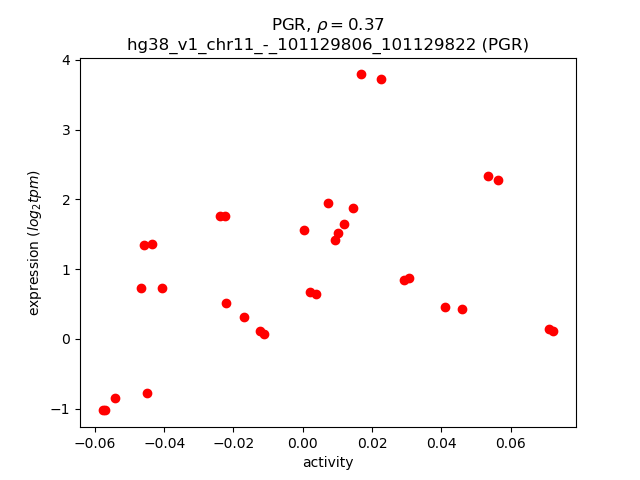
Activity-expression correlation:
| Gene | Promoter | Pearson corr. coef. | P-value | Plot |
|---|---|---|---|---|
| PGR | hg38_v1_chr11_-_101129806_101129822 | 0.37 | 3.5e-02 | Click! |
Activity profile of PGR motif
Sorted Z-values of PGR motif
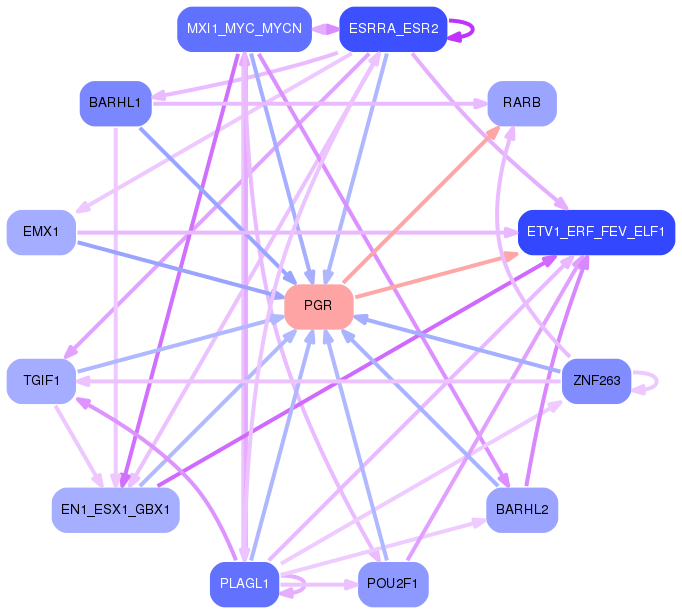
Network of associatons between targets according to the STRING database.

First level regulatory network of PGR
Gene Ontology Analysis
Gene overrepresentation in biological process category:
| Log-likelihood per target | Total log-likelihood | Term | Description |
|---|---|---|---|
| 0.6 | 3.6 | GO:0098746 | fast, calcium ion-dependent exocytosis of neurotransmitter(GO:0098746) |
| 0.5 | 1.4 | GO:0033024 | mast cell homeostasis(GO:0033023) mast cell apoptotic process(GO:0033024) regulation of mast cell apoptotic process(GO:0033025) mast cell proliferation(GO:0070662) |
| 0.4 | 1.1 | GO:1903422 | negative regulation of synaptic vesicle recycling(GO:1903422) negative regulation of membrane invagination(GO:1905154) calcium ion regulated lysosome exocytosis(GO:1990927) |
| 0.3 | 1.2 | GO:0060024 | rhythmic synaptic transmission(GO:0060024) |
| 0.2 | 1.0 | GO:1990637 | response to prolactin(GO:1990637) |
| 0.2 | 0.7 | GO:1904235 | regulation of substrate-dependent cell migration, cell attachment to substrate(GO:1904235) positive regulation of substrate-dependent cell migration, cell attachment to substrate(GO:1904237) |
| 0.2 | 1.7 | GO:0071918 | urea transmembrane transport(GO:0071918) |
| 0.2 | 0.4 | GO:0001794 | type IIa hypersensitivity(GO:0001794) regulation of type IIa hypersensitivity(GO:0001796) type II hypersensitivity(GO:0002445) regulation of type II hypersensitivity(GO:0002892) |
| 0.2 | 0.6 | GO:1903033 | regulation of microtubule plus-end binding(GO:1903031) positive regulation of microtubule plus-end binding(GO:1903033) |
| 0.2 | 1.4 | GO:0018032 | protein amidation(GO:0018032) |
| 0.2 | 1.0 | GO:1901202 | negative regulation of extracellular matrix assembly(GO:1901202) |
| 0.2 | 1.7 | GO:0016560 | protein import into peroxisome matrix, docking(GO:0016560) |
| 0.2 | 0.8 | GO:0072675 | osteoclast fusion(GO:0072675) |
| 0.2 | 0.2 | GO:0044335 | canonical Wnt signaling pathway involved in neural crest cell differentiation(GO:0044335) |
| 0.2 | 1.1 | GO:1904862 | inhibitory synapse assembly(GO:1904862) |
| 0.1 | 0.7 | GO:0003219 | cardiac right ventricle formation(GO:0003219) |
| 0.1 | 1.0 | GO:0019236 | response to pheromone(GO:0019236) |
| 0.1 | 0.6 | GO:1904566 | response to 1-oleoyl-sn-glycerol 3-phosphate(GO:1904565) cellular response to 1-oleoyl-sn-glycerol 3-phosphate(GO:1904566) |
| 0.1 | 0.7 | GO:0051620 | negative regulation of dopamine uptake involved in synaptic transmission(GO:0051585) norepinephrine uptake(GO:0051620) regulation of norepinephrine uptake(GO:0051621) negative regulation of norepinephrine uptake(GO:0051622) negative regulation of catecholamine uptake involved in synaptic transmission(GO:0051945) regulation of glutathione peroxidase activity(GO:1903282) positive regulation of glutathione peroxidase activity(GO:1903284) positive regulation of hydrogen peroxide catabolic process(GO:1903285) positive regulation of peroxidase activity(GO:2000470) |
| 0.1 | 0.5 | GO:0098957 | anterograde axonal transport of mitochondrion(GO:0098957) |
| 0.1 | 0.3 | GO:0015882 | L-ascorbic acid transport(GO:0015882) transepithelial L-ascorbic acid transport(GO:0070904) |
| 0.1 | 0.3 | GO:0043396 | corticotropin-releasing hormone secretion(GO:0043396) regulation of corticotropin-releasing hormone secretion(GO:0043397) regulation of fever generation by regulation of prostaglandin secretion(GO:0071810) positive regulation of fever generation by positive regulation of prostaglandin secretion(GO:0071812) positive regulation of ERK1 and ERK2 cascade via TNFSF11-mediated signaling(GO:0071848) regulation of fever generation by prostaglandin secretion(GO:0100009) |
| 0.1 | 1.8 | GO:0030043 | actin filament fragmentation(GO:0030043) |
| 0.1 | 0.4 | GO:0035054 | atrial septum secundum morphogenesis(GO:0003290) embryonic heart tube anterior/posterior pattern specification(GO:0035054) |
| 0.1 | 0.6 | GO:0014846 | esophagus smooth muscle contraction(GO:0014846) |
| 0.1 | 0.7 | GO:0015015 | heparan sulfate proteoglycan biosynthetic process, enzymatic modification(GO:0015015) |
| 0.1 | 0.3 | GO:0031550 | positive regulation of brain-derived neurotrophic factor receptor signaling pathway(GO:0031550) |
| 0.1 | 0.4 | GO:0036071 | N-glycan fucosylation(GO:0036071) |
| 0.1 | 1.6 | GO:0006032 | chitin metabolic process(GO:0006030) chitin catabolic process(GO:0006032) |
| 0.1 | 0.7 | GO:0051414 | response to cortisol(GO:0051414) |
| 0.1 | 0.5 | GO:0002317 | plasma cell differentiation(GO:0002317) |
| 0.1 | 1.0 | GO:1903421 | regulation of synaptic vesicle recycling(GO:1903421) |
| 0.1 | 4.9 | GO:0008045 | motor neuron axon guidance(GO:0008045) |
| 0.1 | 0.3 | GO:2000588 | positive regulation of platelet-derived growth factor receptor-beta signaling pathway(GO:2000588) |
| 0.1 | 0.2 | GO:0036323 | vascular endothelial growth factor receptor-1 signaling pathway(GO:0036323) |
| 0.1 | 0.8 | GO:0097105 | presynaptic membrane assembly(GO:0097105) |
| 0.1 | 0.6 | GO:0051012 | microtubule sliding(GO:0051012) |
| 0.1 | 0.3 | GO:0032185 | septin cytoskeleton organization(GO:0032185) |
| 0.1 | 2.1 | GO:0051901 | positive regulation of mitochondrial depolarization(GO:0051901) |
| 0.1 | 0.7 | GO:0000395 | mRNA 5'-splice site recognition(GO:0000395) |
| 0.1 | 0.5 | GO:1904800 | regulation of neuron remodeling(GO:1904799) negative regulation of neuron remodeling(GO:1904800) negative regulation of branching morphogenesis of a nerve(GO:2000173) |
| 0.1 | 1.7 | GO:0001542 | ovulation from ovarian follicle(GO:0001542) |
| 0.1 | 1.7 | GO:0048387 | negative regulation of retinoic acid receptor signaling pathway(GO:0048387) |
| 0.1 | 1.1 | GO:0070327 | thyroid hormone transport(GO:0070327) |
| 0.1 | 2.2 | GO:0034390 | smooth muscle cell apoptotic process(GO:0034390) regulation of smooth muscle cell apoptotic process(GO:0034391) |
| 0.1 | 0.4 | GO:0007206 | phospholipase C-activating G-protein coupled glutamate receptor signaling pathway(GO:0007206) |
| 0.1 | 0.2 | GO:0002194 | hepatocyte cell migration(GO:0002194) otic placode formation(GO:0043049) branching involved in pancreas morphogenesis(GO:0061114) acinar cell differentiation(GO:0090425) positive regulation of forebrain neuron differentiation(GO:2000979) |
| 0.1 | 1.0 | GO:0003406 | retinal pigment epithelium development(GO:0003406) |
| 0.1 | 0.2 | GO:1990641 | response to iron ion starvation(GO:1990641) |
| 0.1 | 1.1 | GO:0006707 | cholesterol catabolic process(GO:0006707) sterol catabolic process(GO:0016127) |
| 0.1 | 0.2 | GO:0042418 | epinephrine biosynthetic process(GO:0042418) |
| 0.1 | 1.2 | GO:0090360 | platelet-derived growth factor production(GO:0090360) regulation of platelet-derived growth factor production(GO:0090361) |
| 0.1 | 0.6 | GO:0032914 | positive regulation of transforming growth factor beta1 production(GO:0032914) |
| 0.1 | 1.3 | GO:0031915 | positive regulation of synaptic plasticity(GO:0031915) |
| 0.1 | 1.1 | GO:0030388 | fructose 1,6-bisphosphate metabolic process(GO:0030388) |
| 0.1 | 0.4 | GO:0048861 | leukemia inhibitory factor signaling pathway(GO:0048861) |
| 0.1 | 0.6 | GO:0071073 | positive regulation of phospholipid biosynthetic process(GO:0071073) |
| 0.1 | 1.5 | GO:0032060 | bleb assembly(GO:0032060) |
| 0.1 | 0.3 | GO:0019075 | virus maturation(GO:0019075) |
| 0.1 | 0.2 | GO:0060448 | dichotomous subdivision of terminal units involved in lung branching(GO:0060448) |
| 0.1 | 1.5 | GO:0048935 | peripheral nervous system neuron differentiation(GO:0048934) peripheral nervous system neuron development(GO:0048935) |
| 0.1 | 2.7 | GO:1903861 | positive regulation of dendrite extension(GO:1903861) |
| 0.1 | 0.8 | GO:0043950 | positive regulation of cAMP-mediated signaling(GO:0043950) |
| 0.1 | 0.4 | GO:0061709 | reticulophagy(GO:0061709) |
| 0.0 | 0.4 | GO:2001206 | positive regulation of osteoclast development(GO:2001206) |
| 0.0 | 0.2 | GO:0046462 | monoacylglycerol metabolic process(GO:0046462) monoacylglycerol catabolic process(GO:0052651) |
| 0.0 | 1.3 | GO:0070262 | peptidyl-serine dephosphorylation(GO:0070262) |
| 0.0 | 0.3 | GO:0097498 | endothelial tube lumen extension(GO:0097498) |
| 0.0 | 0.2 | GO:1904381 | Golgi apparatus mannose trimming(GO:1904381) |
| 0.0 | 0.2 | GO:1902683 | regulation of receptor localization to synapse(GO:1902683) |
| 0.0 | 0.1 | GO:2000657 | regulation of apolipoprotein binding(GO:2000656) negative regulation of apolipoprotein binding(GO:2000657) |
| 0.0 | 2.0 | GO:0003301 | physiological muscle hypertrophy(GO:0003298) physiological cardiac muscle hypertrophy(GO:0003301) cell growth involved in cardiac muscle cell development(GO:0061049) |
| 0.0 | 0.5 | GO:0008343 | adult feeding behavior(GO:0008343) |
| 0.0 | 1.4 | GO:0007130 | synaptonemal complex assembly(GO:0007130) |
| 0.0 | 0.5 | GO:0097113 | AMPA glutamate receptor clustering(GO:0097113) glutamate receptor clustering(GO:0097688) |
| 0.0 | 1.4 | GO:0090129 | positive regulation of synapse maturation(GO:0090129) |
| 0.0 | 0.6 | GO:0015871 | choline transport(GO:0015871) |
| 0.0 | 0.3 | GO:1904694 | negative regulation of vascular smooth muscle contraction(GO:1904694) |
| 0.0 | 0.7 | GO:0061302 | smooth muscle cell-matrix adhesion(GO:0061302) |
| 0.0 | 1.8 | GO:0002026 | regulation of the force of heart contraction(GO:0002026) |
| 0.0 | 0.1 | GO:0060178 | regulation of exocyst assembly(GO:0001928) regulation of exocyst localization(GO:0060178) |
| 0.0 | 0.2 | GO:0035604 | fibroblast growth factor receptor signaling pathway involved in negative regulation of apoptotic process in bone marrow(GO:0035602) fibroblast growth factor receptor signaling pathway involved in hemopoiesis(GO:0035603) fibroblast growth factor receptor signaling pathway involved in positive regulation of cell proliferation in bone marrow(GO:0035604) |
| 0.0 | 0.4 | GO:0060068 | vagina development(GO:0060068) |
| 0.0 | 0.3 | GO:1903361 | protein localization to basolateral plasma membrane(GO:1903361) |
| 0.0 | 0.4 | GO:0000160 | phosphorelay signal transduction system(GO:0000160) |
| 0.0 | 0.6 | GO:0045725 | positive regulation of glycogen biosynthetic process(GO:0045725) |
| 0.0 | 0.9 | GO:2001135 | regulation of endocytic recycling(GO:2001135) |
| 0.0 | 0.1 | GO:0002582 | positive regulation of antigen processing and presentation of peptide or polysaccharide antigen via MHC class II(GO:0002582) positive regulation of antigen processing and presentation of peptide antigen(GO:0002585) positive regulation of antigen processing and presentation of peptide antigen via MHC class II(GO:0002588) |
| 0.0 | 0.2 | GO:1904116 | response to vasopressin(GO:1904116) cellular response to vasopressin(GO:1904117) |
| 0.0 | 0.6 | GO:1902004 | positive regulation of beta-amyloid formation(GO:1902004) |
| 0.0 | 0.4 | GO:0070294 | renal sodium ion absorption(GO:0070294) |
| 0.0 | 1.9 | GO:0007274 | neuromuscular synaptic transmission(GO:0007274) |
| 0.0 | 0.7 | GO:0034315 | regulation of Arp2/3 complex-mediated actin nucleation(GO:0034315) |
| 0.0 | 0.3 | GO:0060267 | positive regulation of respiratory burst(GO:0060267) |
| 0.0 | 0.1 | GO:1903634 | regulation of calcium-dependent ATPase activity(GO:1903610) negative regulation of calcium-dependent ATPase activity(GO:1903611) regulation of dUTP diphosphatase activity(GO:1903627) positive regulation of dUTP diphosphatase activity(GO:1903629) negative regulation of aminoacyl-tRNA ligase activity(GO:1903631) regulation of leucine-tRNA ligase activity(GO:1903633) negative regulation of leucine-tRNA ligase activity(GO:1903634) |
| 0.0 | 0.2 | GO:0045986 | negative regulation of smooth muscle contraction(GO:0045986) |
| 0.0 | 0.6 | GO:0015816 | glycine transport(GO:0015816) |
| 0.0 | 0.6 | GO:0032287 | peripheral nervous system myelin maintenance(GO:0032287) |
| 0.0 | 0.5 | GO:0030422 | production of siRNA involved in RNA interference(GO:0030422) |
| 0.0 | 0.6 | GO:0008090 | retrograde axonal transport(GO:0008090) |
| 0.0 | 0.4 | GO:0001867 | complement activation, lectin pathway(GO:0001867) |
| 0.0 | 2.2 | GO:0030195 | negative regulation of blood coagulation(GO:0030195) negative regulation of hemostasis(GO:1900047) |
| 0.0 | 0.9 | GO:0089711 | L-glutamate transmembrane transport(GO:0089711) |
| 0.0 | 0.9 | GO:0010667 | negative regulation of cardiac muscle cell apoptotic process(GO:0010667) |
| 0.0 | 2.1 | GO:0015701 | bicarbonate transport(GO:0015701) |
| 0.0 | 0.4 | GO:1903071 | positive regulation of ER-associated ubiquitin-dependent protein catabolic process(GO:1903071) |
| 0.0 | 1.7 | GO:0051491 | positive regulation of filopodium assembly(GO:0051491) |
| 0.0 | 0.1 | GO:0032223 | negative regulation of synaptic transmission, cholinergic(GO:0032223) neurotransmitter receptor biosynthetic process(GO:0045212) |
| 0.0 | 0.9 | GO:2000651 | positive regulation of sodium ion transmembrane transporter activity(GO:2000651) |
| 0.0 | 0.1 | GO:1903566 | positive regulation of protein localization to cilium(GO:1903566) |
| 0.0 | 3.4 | GO:0006958 | complement activation, classical pathway(GO:0006958) |
| 0.0 | 0.3 | GO:0006527 | arginine catabolic process(GO:0006527) |
| 0.0 | 0.4 | GO:0035878 | nail development(GO:0035878) |
| 0.0 | 1.0 | GO:0008089 | anterograde axonal transport(GO:0008089) |
| 0.0 | 1.3 | GO:0048247 | lymphocyte chemotaxis(GO:0048247) |
| 0.0 | 4.1 | GO:0046718 | viral entry into host cell(GO:0046718) |
| 0.0 | 0.2 | GO:0045023 | G0 to G1 transition(GO:0045023) |
| 0.0 | 0.1 | GO:0007538 | primary sex determination(GO:0007538) |
| 0.0 | 0.6 | GO:0016048 | detection of temperature stimulus(GO:0016048) |
| 0.0 | 1.1 | GO:0019228 | neuronal action potential(GO:0019228) |
| 0.0 | 14.3 | GO:0043687 | post-translational protein modification(GO:0043687) |
| 0.0 | 0.1 | GO:0046726 | positive regulation by virus of viral protein levels in host cell(GO:0046726) |
| 0.0 | 0.1 | GO:1905232 | cellular response to L-glutamate(GO:1905232) |
| 0.0 | 0.4 | GO:0032793 | positive regulation of CREB transcription factor activity(GO:0032793) |
| 0.0 | 0.3 | GO:0030208 | dermatan sulfate biosynthetic process(GO:0030208) |
| 0.0 | 0.8 | GO:0035338 | long-chain fatty-acyl-CoA biosynthetic process(GO:0035338) |
| 0.0 | 0.3 | GO:0031146 | SCF-dependent proteasomal ubiquitin-dependent protein catabolic process(GO:0031146) |
| 0.0 | 0.9 | GO:0042462 | eye photoreceptor cell development(GO:0042462) |
| 0.0 | 0.4 | GO:0019511 | peptidyl-proline hydroxylation(GO:0019511) |
| 0.0 | 0.5 | GO:1901663 | ubiquinone biosynthetic process(GO:0006744) quinone biosynthetic process(GO:1901663) |
| 0.0 | 0.3 | GO:0030903 | notochord development(GO:0030903) |
| 0.0 | 0.2 | GO:0010578 | regulation of adenylate cyclase activity involved in G-protein coupled receptor signaling pathway(GO:0010578) positive regulation of adenylate cyclase activity involved in G-protein coupled receptor signaling pathway(GO:0010579) |
| 0.0 | 0.1 | GO:1903525 | regulation of membrane tubulation(GO:1903525) positive regulation of membrane tubulation(GO:1903527) |
| 0.0 | 0.1 | GO:0071896 | protein localization to adherens junction(GO:0071896) |
| 0.0 | 0.3 | GO:0006776 | vitamin A metabolic process(GO:0006776) |
| 0.0 | 0.3 | GO:0002003 | angiotensin maturation(GO:0002003) |
| 0.0 | 0.2 | GO:0001833 | inner cell mass cell proliferation(GO:0001833) |
| 0.0 | 0.2 | GO:0019375 | galactosylceramide biosynthetic process(GO:0006682) galactolipid biosynthetic process(GO:0019375) |
| 0.0 | 0.3 | GO:0010990 | regulation of SMAD protein complex assembly(GO:0010990) negative regulation of SMAD protein complex assembly(GO:0010991) |
| 0.0 | 0.1 | GO:0071802 | negative regulation of podosome assembly(GO:0071802) |
| 0.0 | 0.2 | GO:0045647 | negative regulation of erythrocyte differentiation(GO:0045647) |
| 0.0 | 0.1 | GO:0038163 | thrombopoietin-mediated signaling pathway(GO:0038163) |
| 0.0 | 0.3 | GO:0048169 | regulation of long-term neuronal synaptic plasticity(GO:0048169) |
| 0.0 | 1.0 | GO:0019933 | cAMP-mediated signaling(GO:0019933) |
| 0.0 | 0.1 | GO:0090234 | regulation of kinetochore assembly(GO:0090234) |
| 0.0 | 0.2 | GO:0048251 | elastic fiber assembly(GO:0048251) |
| 0.0 | 0.5 | GO:0014047 | glutamate secretion(GO:0014047) |
| 0.0 | 0.4 | GO:0006182 | cGMP biosynthetic process(GO:0006182) |
| 0.0 | 0.5 | GO:0071108 | protein K48-linked deubiquitination(GO:0071108) |
| 0.0 | 1.0 | GO:0032418 | lysosome localization(GO:0032418) |
| 0.0 | 0.1 | GO:0045329 | carnitine biosynthetic process(GO:0045329) |
| 0.0 | 0.3 | GO:0043162 | ubiquitin-dependent protein catabolic process via the multivesicular body sorting pathway(GO:0043162) |
Gene overrepresentation in cellular component category:
| Log-likelihood per target | Total log-likelihood | Term | Description |
|---|---|---|---|
| 0.4 | 3.6 | GO:0060200 | clathrin-sculpted acetylcholine transport vesicle(GO:0060200) clathrin-sculpted acetylcholine transport vesicle membrane(GO:0060201) |
| 0.3 | 1.7 | GO:0005927 | muscle tendon junction(GO:0005927) |
| 0.3 | 0.6 | GO:0005583 | fibrillar collagen trimer(GO:0005583) banded collagen fibril(GO:0098643) |
| 0.2 | 1.4 | GO:0034991 | nuclear meiotic cohesin complex(GO:0034991) |
| 0.2 | 2.7 | GO:0033269 | internode region of axon(GO:0033269) |
| 0.2 | 1.0 | GO:0005896 | interleukin-6 receptor complex(GO:0005896) |
| 0.2 | 1.3 | GO:0070554 | synaptobrevin 2-SNAP-25-syntaxin-3-complexin complex(GO:0070554) |
| 0.1 | 1.1 | GO:0048787 | presynaptic active zone membrane(GO:0048787) |
| 0.1 | 0.5 | GO:0005899 | insulin receptor complex(GO:0005899) |
| 0.1 | 0.3 | GO:0071757 | hexameric IgM immunoglobulin complex(GO:0071757) |
| 0.1 | 0.3 | GO:0071149 | TEAD-2-YAP complex(GO:0071149) |
| 0.1 | 0.6 | GO:0031673 | H zone(GO:0031673) |
| 0.1 | 0.2 | GO:0000811 | GINS complex(GO:0000811) |
| 0.1 | 0.4 | GO:1990037 | Lewy body core(GO:1990037) |
| 0.1 | 0.3 | GO:1990769 | proximal neuron projection(GO:1990769) |
| 0.0 | 1.1 | GO:0060077 | inhibitory synapse(GO:0060077) |
| 0.0 | 0.3 | GO:0098843 | postsynaptic endocytic zone(GO:0098843) |
| 0.0 | 0.2 | GO:0071821 | FANCM-MHF complex(GO:0071821) |
| 0.0 | 0.6 | GO:0000813 | ESCRT I complex(GO:0000813) |
| 0.0 | 1.1 | GO:0030128 | clathrin coat of endocytic vesicle(GO:0030128) |
| 0.0 | 0.9 | GO:0001518 | voltage-gated sodium channel complex(GO:0001518) |
| 0.0 | 0.2 | GO:0005595 | collagen type XII trimer(GO:0005595) |
| 0.0 | 0.3 | GO:0042719 | mitochondrial intermembrane space protein transporter complex(GO:0042719) |
| 0.0 | 14.8 | GO:0005788 | endoplasmic reticulum lumen(GO:0005788) |
| 0.0 | 1.0 | GO:0043218 | compact myelin(GO:0043218) |
| 0.0 | 0.4 | GO:0030478 | actin cap(GO:0030478) |
| 0.0 | 0.3 | GO:0005610 | laminin-5 complex(GO:0005610) |
| 0.0 | 0.1 | GO:0000333 | telomerase catalytic core complex(GO:0000333) |
| 0.0 | 0.5 | GO:0008074 | guanylate cyclase complex, soluble(GO:0008074) |
| 0.0 | 1.3 | GO:0005640 | nuclear outer membrane(GO:0005640) |
| 0.0 | 0.5 | GO:0098839 | postsynaptic density membrane(GO:0098839) |
| 0.0 | 0.5 | GO:0070578 | RISC-loading complex(GO:0070578) |
| 0.0 | 0.7 | GO:0035327 | transcriptionally active chromatin(GO:0035327) |
| 0.0 | 1.2 | GO:0042571 | immunoglobulin complex, circulating(GO:0042571) |
| 0.0 | 1.1 | GO:0031527 | filopodium membrane(GO:0031527) |
| 0.0 | 4.8 | GO:0031225 | anchored component of membrane(GO:0031225) |
| 0.0 | 0.4 | GO:0030130 | clathrin coat of trans-Golgi network vesicle(GO:0030130) |
| 0.0 | 2.3 | GO:0031903 | peroxisomal membrane(GO:0005778) microbody membrane(GO:0031903) |
| 0.0 | 1.5 | GO:1904115 | axon cytoplasm(GO:1904115) |
| 0.0 | 0.6 | GO:0035371 | microtubule plus-end(GO:0035371) |
| 0.0 | 0.7 | GO:0071564 | npBAF complex(GO:0071564) |
| 0.0 | 3.7 | GO:0043204 | perikaryon(GO:0043204) |
| 0.0 | 3.8 | GO:0016363 | nuclear matrix(GO:0016363) |
| 0.0 | 0.3 | GO:0000124 | SAGA complex(GO:0000124) |
| 0.0 | 0.4 | GO:0030056 | hemidesmosome(GO:0030056) |
| 0.0 | 0.1 | GO:1990578 | perinuclear endoplasmic reticulum membrane(GO:1990578) |
| 0.0 | 1.4 | GO:0005791 | rough endoplasmic reticulum(GO:0005791) |
| 0.0 | 1.5 | GO:0005604 | basement membrane(GO:0005604) |
| 0.0 | 0.1 | GO:0097025 | MPP7-DLG1-LIN7 complex(GO:0097025) |
| 0.0 | 1.0 | GO:0043198 | dendritic shaft(GO:0043198) |
| 0.0 | 0.3 | GO:0017146 | NMDA selective glutamate receptor complex(GO:0017146) |
| 0.0 | 1.0 | GO:0031941 | filamentous actin(GO:0031941) |
Gene overrepresentation in molecular function category:
| Log-likelihood per target | Total log-likelihood | Term | Description |
|---|---|---|---|
| 0.4 | 3.6 | GO:0030348 | syntaxin-3 binding(GO:0030348) |
| 0.4 | 2.2 | GO:0048101 | calcium- and calmodulin-regulated 3',5'-cyclic-GMP phosphodiesterase activity(GO:0048101) |
| 0.3 | 1.8 | GO:0032038 | myosin II heavy chain binding(GO:0032038) |
| 0.3 | 1.4 | GO:0005173 | stem cell factor receptor binding(GO:0005173) |
| 0.2 | 1.7 | GO:0015265 | urea channel activity(GO:0015265) |
| 0.2 | 1.4 | GO:0004598 | peptidylglycine monooxygenase activity(GO:0004504) peptidylamidoglycolate lyase activity(GO:0004598) |
| 0.2 | 1.7 | GO:0005052 | peroxisome matrix targeting signal-1 binding(GO:0005052) |
| 0.2 | 0.9 | GO:0005294 | neutral L-amino acid secondary active transmembrane transporter activity(GO:0005294) |
| 0.2 | 0.9 | GO:0004157 | dihydropyrimidinase activity(GO:0004157) |
| 0.2 | 2.3 | GO:0044323 | retinoic acid-responsive element binding(GO:0044323) |
| 0.2 | 0.8 | GO:0048248 | CXCR3 chemokine receptor binding(GO:0048248) |
| 0.1 | 1.2 | GO:0004771 | sterol esterase activity(GO:0004771) |
| 0.1 | 0.7 | GO:0017095 | heparan sulfate 6-O-sulfotransferase activity(GO:0017095) |
| 0.1 | 0.4 | GO:0008294 | calcium- and calmodulin-responsive adenylate cyclase activity(GO:0008294) |
| 0.1 | 0.4 | GO:0099530 | G-protein coupled receptor activity involved in regulation of postsynaptic membrane potential(GO:0099530) |
| 0.1 | 0.7 | GO:0060961 | phospholipase D inhibitor activity(GO:0060961) |
| 0.1 | 0.4 | GO:0004923 | leukemia inhibitory factor receptor activity(GO:0004923) |
| 0.1 | 1.7 | GO:0035374 | chondroitin sulfate binding(GO:0035374) |
| 0.1 | 0.3 | GO:0010348 | lithium:proton antiporter activity(GO:0010348) |
| 0.1 | 0.3 | GO:0015229 | L-ascorbate:sodium symporter activity(GO:0008520) L-ascorbic acid transporter activity(GO:0015229) sodium-dependent L-ascorbate transmembrane transporter activity(GO:0070890) |
| 0.1 | 3.4 | GO:0042043 | neurexin family protein binding(GO:0042043) |
| 0.1 | 2.1 | GO:0004089 | carbonate dehydratase activity(GO:0004089) |
| 0.1 | 12.8 | GO:0050840 | extracellular matrix binding(GO:0050840) |
| 0.1 | 0.4 | GO:0046921 | glycoprotein 6-alpha-L-fucosyltransferase activity(GO:0008424) alpha-(1->6)-fucosyltransferase activity(GO:0046921) |
| 0.1 | 1.6 | GO:0004568 | chitinase activity(GO:0004568) |
| 0.1 | 1.0 | GO:0005138 | interleukin-6 receptor binding(GO:0005138) |
| 0.1 | 0.3 | GO:0008511 | sodium:potassium:chloride symporter activity(GO:0008511) |
| 0.1 | 1.1 | GO:0004332 | fructose-bisphosphate aldolase activity(GO:0004332) |
| 0.1 | 0.5 | GO:0016807 | cysteine-type carboxypeptidase activity(GO:0016807) cysteine-type exopeptidase activity(GO:0070004) |
| 0.1 | 0.2 | GO:0036326 | VEGF-A-activated receptor activity(GO:0036326) VEGF-B-activated receptor activity(GO:0036327) placental growth factor-activated receptor activity(GO:0036332) |
| 0.1 | 0.4 | GO:0019797 | procollagen-proline 3-dioxygenase activity(GO:0019797) |
| 0.1 | 0.3 | GO:0005169 | neurotrophin TRKB receptor binding(GO:0005169) |
| 0.1 | 0.6 | GO:0035727 | lysophosphatidic acid binding(GO:0035727) |
| 0.1 | 0.6 | GO:0015220 | choline transmembrane transporter activity(GO:0015220) |
| 0.1 | 4.4 | GO:0046875 | ephrin receptor binding(GO:0046875) |
| 0.1 | 0.6 | GO:0008449 | N-acetylglucosamine-6-sulfatase activity(GO:0008449) |
| 0.1 | 0.5 | GO:0038132 | neuregulin binding(GO:0038132) |
| 0.1 | 0.2 | GO:0004948 | calcitonin receptor activity(GO:0004948) |
| 0.1 | 1.0 | GO:0003708 | retinoic acid receptor activity(GO:0003708) |
| 0.1 | 1.9 | GO:0097109 | neuroligin family protein binding(GO:0097109) |
| 0.1 | 0.3 | GO:0004441 | inositol-1,4-bisphosphate 1-phosphatase activity(GO:0004441) inositol-1,3,4-trisphosphate 1-phosphatase activity(GO:0052829) |
| 0.1 | 0.7 | GO:0097100 | supercoiled DNA binding(GO:0097100) |
| 0.1 | 1.1 | GO:0070324 | thyroid hormone binding(GO:0070324) |
| 0.0 | 2.1 | GO:0008093 | cytoskeletal adaptor activity(GO:0008093) |
| 0.0 | 0.3 | GO:0016427 | tRNA (cytosine) methyltransferase activity(GO:0016427) |
| 0.0 | 0.4 | GO:0005250 | A-type (transient outward) potassium channel activity(GO:0005250) |
| 0.0 | 0.3 | GO:0019862 | IgA binding(GO:0019862) |
| 0.0 | 0.5 | GO:0048039 | ubiquinone binding(GO:0048039) |
| 0.0 | 0.3 | GO:0005005 | transmembrane-ephrin receptor activity(GO:0005005) |
| 0.0 | 0.6 | GO:0015187 | glycine transmembrane transporter activity(GO:0015187) |
| 0.0 | 0.3 | GO:0016403 | dimethylargininase activity(GO:0016403) |
| 0.0 | 5.2 | GO:0001618 | virus receptor activity(GO:0001618) |
| 0.0 | 0.5 | GO:0070883 | pre-miRNA binding(GO:0070883) |
| 0.0 | 0.4 | GO:0000155 | phosphorelay sensor kinase activity(GO:0000155) |
| 0.0 | 0.1 | GO:0008336 | gamma-butyrobetaine dioxygenase activity(GO:0008336) |
| 0.0 | 0.8 | GO:0005520 | insulin-like growth factor binding(GO:0005520) |
| 0.0 | 0.2 | GO:0004517 | nitric-oxide synthase activity(GO:0004517) |
| 0.0 | 1.3 | GO:0048020 | CCR chemokine receptor binding(GO:0048020) |
| 0.0 | 0.4 | GO:0051525 | NFAT protein binding(GO:0051525) |
| 0.0 | 0.1 | GO:0004341 | gluconolactonase activity(GO:0004341) |
| 0.0 | 0.5 | GO:0038062 | protein tyrosine kinase collagen receptor activity(GO:0038062) |
| 0.0 | 1.3 | GO:0017075 | syntaxin-1 binding(GO:0017075) |
| 0.0 | 0.8 | GO:0102391 | decanoate--CoA ligase activity(GO:0102391) |
| 0.0 | 1.0 | GO:1905030 | voltage-gated sodium channel activity(GO:0005248) voltage-gated ion channel activity involved in regulation of postsynaptic membrane potential(GO:1905030) |
| 0.0 | 0.6 | GO:0008035 | high-density lipoprotein particle binding(GO:0008035) |
| 0.0 | 0.1 | GO:0043849 | Ras palmitoyltransferase activity(GO:0043849) |
| 0.0 | 0.1 | GO:0046933 | proton-transporting ATP synthase activity, rotational mechanism(GO:0046933) |
| 0.0 | 1.6 | GO:0004864 | protein phosphatase inhibitor activity(GO:0004864) |
| 0.0 | 0.2 | GO:0050692 | DBD domain binding(GO:0050692) |
| 0.0 | 0.2 | GO:0004571 | mannosyl-oligosaccharide 1,2-alpha-mannosidase activity(GO:0004571) |
| 0.0 | 0.7 | GO:0016805 | dipeptidase activity(GO:0016805) |
| 0.0 | 0.2 | GO:0016907 | G-protein coupled acetylcholine receptor activity(GO:0016907) |
| 0.0 | 0.3 | GO:0004971 | AMPA glutamate receptor activity(GO:0004971) |
| 0.0 | 1.7 | GO:0005518 | collagen binding(GO:0005518) |
| 0.0 | 4.4 | GO:0003823 | antigen binding(GO:0003823) |
| 0.0 | 1.1 | GO:0031369 | translation initiation factor binding(GO:0031369) |
| 0.0 | 0.2 | GO:0033130 | acetylcholine receptor binding(GO:0033130) |
| 0.0 | 0.1 | GO:0102345 | 3-hydroxy-behenoyl-CoA dehydratase activity(GO:0102344) 3-hydroxy-lignoceroyl-CoA dehydratase activity(GO:0102345) |
| 0.0 | 0.7 | GO:0070273 | phosphatidylinositol-4-phosphate binding(GO:0070273) |
| 0.0 | 0.5 | GO:0005035 | tumor necrosis factor-activated receptor activity(GO:0005031) death receptor activity(GO:0005035) |
| 0.0 | 0.3 | GO:0032051 | clathrin light chain binding(GO:0032051) AP-2 adaptor complex binding(GO:0035612) |
| 0.0 | 0.5 | GO:0050811 | GABA receptor binding(GO:0050811) |
| 0.0 | 0.1 | GO:0019784 | NEDD8-specific protease activity(GO:0019784) |
| 0.0 | 2.1 | GO:0030165 | PDZ domain binding(GO:0030165) |
| 0.0 | 0.1 | GO:0004340 | glucokinase activity(GO:0004340) hexokinase activity(GO:0004396) fructokinase activity(GO:0008865) mannokinase activity(GO:0019158) |
| 0.0 | 0.2 | GO:0005007 | fibroblast growth factor-activated receptor activity(GO:0005007) |
| 0.0 | 0.4 | GO:0005523 | tropomyosin binding(GO:0005523) |
| 0.0 | 0.2 | GO:0043138 | 3'-5' DNA helicase activity(GO:0043138) |
| 0.0 | 0.1 | GO:0043559 | insulin binding(GO:0043559) |
| 0.0 | 0.3 | GO:0001134 | transcription factor activity, transcription factor recruiting(GO:0001134) |
| 0.0 | 0.2 | GO:0050694 | galactosylceramide sulfotransferase activity(GO:0001733) galactose 3-O-sulfotransferase activity(GO:0050694) |
| 0.0 | 0.1 | GO:0004991 | parathyroid hormone receptor activity(GO:0004991) |
| 0.0 | 0.4 | GO:0005212 | structural constituent of eye lens(GO:0005212) |
| 0.0 | 0.1 | GO:0004797 | thymidine kinase activity(GO:0004797) |
| 0.0 | 0.8 | GO:0030552 | cAMP binding(GO:0030552) |
| 0.0 | 0.3 | GO:0050431 | transforming growth factor beta binding(GO:0050431) |
| 0.0 | 0.1 | GO:0033857 | diphosphoinositol-pentakisphosphate kinase activity(GO:0033857) |
| 0.0 | 0.2 | GO:0019841 | retinol binding(GO:0019841) |
| 0.0 | 0.3 | GO:0017049 | GTP-Rho binding(GO:0017049) |
| 0.0 | 1.9 | GO:0005178 | integrin binding(GO:0005178) |
| 0.0 | 0.5 | GO:0005158 | insulin receptor binding(GO:0005158) |
| 0.0 | 0.2 | GO:0047372 | acylglycerol lipase activity(GO:0047372) |
| 0.0 | 0.1 | GO:0070891 | lipoteichoic acid binding(GO:0070891) |
Gene overrepresentation in curated gene sets: canonical pathways category:
| Log-likelihood per target | Total log-likelihood | Term | Description |
|---|---|---|---|
| 0.1 | 0.4 | PID INTEGRIN4 PATHWAY | Alpha6 beta4 integrin-ligand interactions |
| 0.0 | 3.9 | SIG CD40PATHWAYMAP | Genes related to CD40 signaling |
| 0.0 | 6.2 | PID RAC1 REG PATHWAY | Regulation of RAC1 activity |
| 0.0 | 1.0 | ST STAT3 PATHWAY | STAT3 Pathway |
| 0.0 | 14.8 | NABA ECM GLYCOPROTEINS | Genes encoding structural ECM glycoproteins |
| 0.0 | 1.0 | PID ANTHRAX PATHWAY | Cellular roles of Anthrax toxin |
| 0.0 | 3.5 | PID FGF PATHWAY | FGF signaling pathway |
| 0.0 | 1.4 | PID P38 MK2 PATHWAY | p38 signaling mediated by MAPKAP kinases |
| 0.0 | 0.7 | PID ARF 3PATHWAY | Arf1 pathway |
| 0.0 | 0.5 | PID LPA4 PATHWAY | LPA4-mediated signaling events |
| 0.0 | 0.6 | PID HIF1A PATHWAY | Hypoxic and oxygen homeostasis regulation of HIF-1-alpha |
| 0.0 | 0.9 | PID RETINOIC ACID PATHWAY | Retinoic acid receptors-mediated signaling |
| 0.0 | 0.8 | PID IL23 PATHWAY | IL23-mediated signaling events |
| 0.0 | 0.4 | PID ERB GENOMIC PATHWAY | Validated nuclear estrogen receptor beta network |
| 0.0 | 1.7 | SIG CHEMOTAXIS | Genes related to chemotaxis |
| 0.0 | 1.2 | PID ATR PATHWAY | ATR signaling pathway |
| 0.0 | 0.6 | PID PI3K PLC TRK PATHWAY | Trk receptor signaling mediated by PI3K and PLC-gamma |
| 0.0 | 0.7 | PID ALPHA SYNUCLEIN PATHWAY | Alpha-synuclein signaling |
| 0.0 | 0.3 | PID EPHA FWDPATHWAY | EPHA forward signaling |
| 0.0 | 0.4 | PID VEGFR1 PATHWAY | VEGFR1 specific signals |
| 0.0 | 0.5 | ST MYOCYTE AD PATHWAY | Myocyte Adrenergic Pathway is a specific case of the generalized Adrenergic Pathway. |
| 0.0 | 0.4 | PID A6B1 A6B4 INTEGRIN PATHWAY | a6b1 and a6b4 Integrin signaling |
| 0.0 | 0.9 | PID TAP63 PATHWAY | Validated transcriptional targets of TAp63 isoforms |
Gene overrepresentation in curated gene sets: REACTOME pathways category:
| Log-likelihood per target | Total log-likelihood | Term | Description |
|---|---|---|---|
| 0.1 | 3.6 | REACTOME NOREPINEPHRINE NEUROTRANSMITTER RELEASE CYCLE | Genes involved in Norepinephrine Neurotransmitter Release Cycle |
| 0.1 | 2.1 | REACTOME REVERSIBLE HYDRATION OF CARBON DIOXIDE | Genes involved in Reversible Hydration of Carbon Dioxide |
| 0.1 | 2.6 | REACTOME CRMPS IN SEMA3A SIGNALING | Genes involved in CRMPs in Sema3A signaling |
| 0.1 | 0.7 | REACTOME APOBEC3G MEDIATED RESISTANCE TO HIV1 INFECTION | Genes involved in APOBEC3G mediated resistance to HIV-1 infection |
| 0.1 | 1.4 | REACTOME REGULATION OF KIT SIGNALING | Genes involved in Regulation of KIT signaling |
| 0.0 | 1.0 | REACTOME IL 6 SIGNALING | Genes involved in Interleukin-6 signaling |
| 0.0 | 1.9 | REACTOME AMYLOIDS | Genes involved in Amyloids |
| 0.0 | 2.7 | REACTOME CA DEPENDENT EVENTS | Genes involved in Ca-dependent events |
| 0.0 | 3.5 | REACTOME NCAM1 INTERACTIONS | Genes involved in NCAM1 interactions |
| 0.0 | 0.8 | REACTOME INITIAL TRIGGERING OF COMPLEMENT | Genes involved in Initial triggering of complement |
| 0.0 | 1.7 | REACTOME AMINE COMPOUND SLC TRANSPORTERS | Genes involved in Amine compound SLC transporters |
| 0.0 | 1.1 | REACTOME OTHER SEMAPHORIN INTERACTIONS | Genes involved in Other semaphorin interactions |
| 0.0 | 0.6 | REACTOME KERATAN SULFATE DEGRADATION | Genes involved in Keratan sulfate degradation |
| 0.0 | 1.5 | REACTOME AMINO ACID TRANSPORT ACROSS THE PLASMA MEMBRANE | Genes involved in Amino acid transport across the plasma membrane |
| 0.0 | 0.8 | REACTOME RAP1 SIGNALLING | Genes involved in Rap1 signalling |
| 0.0 | 0.9 | REACTOME YAP1 AND WWTR1 TAZ STIMULATED GENE EXPRESSION | Genes involved in YAP1- and WWTR1 (TAZ)-stimulated gene expression |
| 0.0 | 0.8 | REACTOME SYNTHESIS OF VERY LONG CHAIN FATTY ACYL COAS | Genes involved in Synthesis of very long-chain fatty acyl-CoAs |
| 0.0 | 1.0 | REACTOME INTERACTION BETWEEN L1 AND ANKYRINS | Genes involved in Interaction between L1 and Ankyrins |
| 0.0 | 0.6 | REACTOME TRAFFICKING OF AMPA RECEPTORS | Genes involved in Trafficking of AMPA receptors |
| 0.0 | 5.2 | REACTOME SIGNALING BY RHO GTPASES | Genes involved in Signaling by Rho GTPases |
| 0.0 | 1.3 | REACTOME MEIOTIC SYNAPSIS | Genes involved in Meiotic Synapsis |
| 0.0 | 1.1 | REACTOME GLYCOLYSIS | Genes involved in Glycolysis |
| 0.0 | 0.7 | REACTOME HS GAG BIOSYNTHESIS | Genes involved in HS-GAG biosynthesis |
| 0.0 | 0.6 | REACTOME TRAFFICKING OF GLUR2 CONTAINING AMPA RECEPTORS | Genes involved in Trafficking of GluR2-containing AMPA receptors |
| 0.0 | 0.2 | REACTOME TETRAHYDROBIOPTERIN BH4 SYNTHESIS RECYCLING SALVAGE AND REGULATION | Genes involved in Tetrahydrobiopterin (BH4) synthesis, recycling, salvage and regulation |
| 0.0 | 0.1 | REACTOME RNA POL I PROMOTER OPENING | Genes involved in RNA Polymerase I Promoter Opening |
| 0.0 | 0.2 | REACTOME UNWINDING OF DNA | Genes involved in Unwinding of DNA |
| 0.0 | 0.5 | REACTOME OXYGEN DEPENDENT PROLINE HYDROXYLATION OF HYPOXIA INDUCIBLE FACTOR ALPHA | Genes involved in Oxygen-dependent Proline Hydroxylation of Hypoxia-inducible Factor Alpha |
| 0.0 | 0.5 | REACTOME FORMATION OF TUBULIN FOLDING INTERMEDIATES BY CCT TRIC | Genes involved in Formation of tubulin folding intermediates by CCT/TriC |
| 0.0 | 0.4 | REACTOME IONOTROPIC ACTIVITY OF KAINATE RECEPTORS | Genes involved in Ionotropic activity of Kainate Receptors |
| 0.0 | 0.8 | REACTOME ION TRANSPORT BY P TYPE ATPASES | Genes involved in Ion transport by P-type ATPases |
| 0.0 | 0.4 | REACTOME N GLYCAN ANTENNAE ELONGATION IN THE MEDIAL TRANS GOLGI | Genes involved in N-glycan antennae elongation in the medial/trans-Golgi |
| 0.0 | 0.4 | REACTOME SYNTHESIS SECRETION AND INACTIVATION OF GIP | Genes involved in Synthesis, Secretion, and Inactivation of Glucose-dependent Insulinotropic Polypeptide (GIP) |
| 0.0 | 0.3 | REACTOME CS DS DEGRADATION | Genes involved in CS/DS degradation |
| 0.0 | 0.4 | REACTOME ASSOCIATION OF TRIC CCT WITH TARGET PROTEINS DURING BIOSYNTHESIS | Genes involved in Association of TriC/CCT with target proteins during biosynthesis |