Project
Illumina Body Map 2 (GSE30611)
Navigation
Downloads
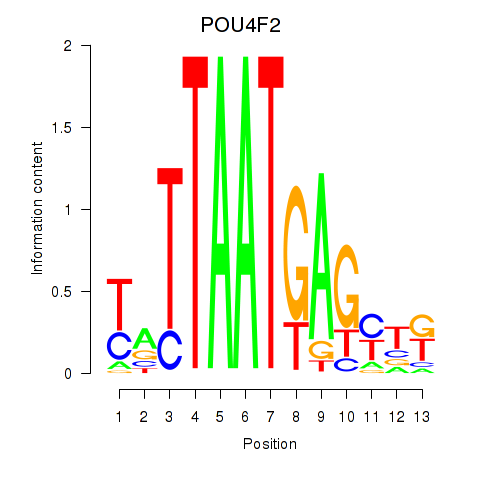
Results for POU4F2
Z-value: 0.95
Motif logo
Transcription factors associated with POU4F2
| Gene Symbol | Gene ID | Gene Info |
|---|---|---|
|
POU4F2
|
ENSG00000151615.3 | POU class 4 homeobox 2 |
Activity-expression correlation:
| Gene | Promoter | Pearson corr. coef. | P-value | Plot |
|---|---|---|---|---|
| POU4F2 | hg38_v1_chr4_+_146638890_146638894 | -0.04 | 8.2e-01 | Click! |
Activity profile of POU4F2 motif
Sorted Z-values of POU4F2 motif
| Promoter | Log-likelihood | Transcript | Gene | Gene Info |
|---|---|---|---|---|
| chr10_-_72088533 | 4.32 |
ENST00000373109.7
|
SPOCK2
|
SPARC (osteonectin), cwcv and kazal like domains proteoglycan 2 |
| chr10_-_72088504 | 3.76 |
ENST00000536168.2
|
SPOCK2
|
SPARC (osteonectin), cwcv and kazal like domains proteoglycan 2 |
| chr14_+_21887848 | 3.44 |
ENST00000390437.2
|
TRAV12-2
|
T cell receptor alpha variable 12-2 |
| chr1_+_198638968 | 2.81 |
ENST00000348564.11
ENST00000530727.5 ENST00000442510.8 ENST00000645247.1 ENST00000367367.8 ENST00000367364.5 ENST00000413409.6 |
PTPRC
|
protein tyrosine phosphatase receptor type C |
| chr9_+_122371014 | 2.69 |
ENST00000362012.7
|
PTGS1
|
prostaglandin-endoperoxide synthase 1 |
| chr11_+_31650024 | 2.68 |
ENST00000638317.1
|
ELP4
|
elongator acetyltransferase complex subunit 4 |
| chr3_+_108822778 | 2.61 |
ENST00000295756.11
|
TRAT1
|
T cell receptor associated transmembrane adaptor 1 |
| chr11_+_118304721 | 2.57 |
ENST00000361763.9
|
CD3E
|
CD3e molecule |
| chr2_-_157444044 | 2.56 |
ENST00000264192.8
|
CYTIP
|
cytohesin 1 interacting protein |
| chr3_+_108822759 | 2.51 |
ENST00000426646.1
|
TRAT1
|
T cell receptor associated transmembrane adaptor 1 |
| chr9_+_122371036 | 2.47 |
ENST00000619306.5
ENST00000426608.6 ENST00000223423.8 |
PTGS1
|
prostaglandin-endoperoxide synthase 1 |
| chr1_+_198638457 | 2.43 |
ENST00000367379.6
|
PTPRC
|
protein tyrosine phosphatase receptor type C |
| chr7_-_81770039 | 2.39 |
ENST00000222390.11
ENST00000453411.6 ENST00000457544.7 ENST00000444829.7 |
HGF
|
hepatocyte growth factor |
| chr12_-_89352395 | 2.38 |
ENST00000308385.6
|
DUSP6
|
dual specificity phosphatase 6 |
| chr9_+_122370523 | 2.33 |
ENST00000643810.1
ENST00000540753.6 |
PTGS1
|
prostaglandin-endoperoxide synthase 1 |
| chr12_-_89352487 | 2.31 |
ENST00000548755.1
ENST00000279488.8 |
DUSP6
|
dual specificity phosphatase 6 |
| chr1_+_198638723 | 2.25 |
ENST00000643513.1
|
PTPRC
|
protein tyrosine phosphatase receptor type C |
| chr14_+_22422371 | 2.10 |
ENST00000390469.2
|
TRDV2
|
T cell receptor delta variable 2 |
| chr3_+_122055355 | 1.92 |
ENST00000330540.7
ENST00000469710.5 ENST00000493101.5 |
CD86
|
CD86 molecule |
| chr1_+_198639162 | 1.88 |
ENST00000418674.1
|
PTPRC
|
protein tyrosine phosphatase receptor type C |
| chr17_-_10026265 | 1.63 |
ENST00000437099.6
ENST00000396115.6 |
GAS7
|
growth arrest specific 7 |
| chr6_-_110815152 | 1.44 |
ENST00000413605.6
|
CDK19
|
cyclin dependent kinase 19 |
| chr11_-_31509569 | 1.36 |
ENST00000526776.5
|
IMMP1L
|
inner mitochondrial membrane peptidase subunit 1 |
| chr7_-_81770122 | 1.30 |
ENST00000423064.7
|
HGF
|
hepatocyte growth factor |
| chr6_-_110815096 | 1.26 |
ENST00000457688.5
|
CDK19
|
cyclin dependent kinase 19 |
| chr14_+_22096017 | 1.23 |
ENST00000390452.2
|
TRDV1
|
T cell receptor delta variable 1 |
| chr16_+_28494634 | 1.22 |
ENST00000564831.6
ENST00000431282.2 |
APOBR
|
apolipoprotein B receptor |
| chr6_-_110815408 | 1.20 |
ENST00000368911.8
|
CDK19
|
cyclin dependent kinase 19 |
| chr1_+_40040720 | 1.18 |
ENST00000414893.5
ENST00000372792.7 ENST00000372805.8 ENST00000414281.5 ENST00000420216.5 ENST00000372798.5 ENST00000340450.7 ENST00000435719.5 ENST00000427843.5 ENST00000417287.5 ENST00000424977.1 |
CAP1
|
cyclase associated actin cytoskeleton regulatory protein 1 |
| chr18_-_28036585 | 1.10 |
ENST00000399380.7
|
CDH2
|
cadherin 2 |
| chr17_-_81656532 | 1.08 |
ENST00000331056.10
|
PDE6G
|
phosphodiesterase 6G |
| chr2_+_190927649 | 1.06 |
ENST00000409428.5
ENST00000409215.5 |
GLS
|
glutaminase |
| chr4_-_36243939 | 1.04 |
ENST00000506189.1
|
ARAP2
|
ArfGAP with RhoGAP domain, ankyrin repeat and PH domain 2 |
| chr1_+_40040788 | 1.02 |
ENST00000446031.1
|
CAP1
|
cyclase associated actin cytoskeleton regulatory protein 1 |
| chr1_+_50108856 | 0.98 |
ENST00000650764.1
ENST00000494555.2 ENST00000371824.7 ENST00000371823.8 ENST00000652693.1 |
ELAVL4
|
ELAV like RNA binding protein 4 |
| chr6_+_10521337 | 0.94 |
ENST00000495262.7
|
GCNT2
|
glucosaminyl (N-acetyl) transferase 2 (I blood group) |
| chr6_+_12717660 | 0.93 |
ENST00000674637.1
|
PHACTR1
|
phosphatase and actin regulator 1 |
| chr1_+_40040583 | 0.87 |
ENST00000421589.5
|
CAP1
|
cyclase associated actin cytoskeleton regulatory protein 1 |
| chr11_+_73787853 | 0.85 |
ENST00000310614.12
ENST00000497094.6 ENST00000411840.6 ENST00000535277.5 ENST00000398483.7 ENST00000542303.5 |
MRPL48
|
mitochondrial ribosomal protein L48 |
| chr2_+_17816458 | 0.84 |
ENST00000281047.4
|
MSGN1
|
mesogenin 1 |
| chr11_-_107858777 | 0.83 |
ENST00000525815.6
|
SLC35F2
|
solute carrier family 35 member F2 |
| chr5_-_141619049 | 0.76 |
ENST00000647433.1
ENST00000253811.10 ENST00000389057.9 ENST00000398557.8 |
DIAPH1
|
diaphanous related formin 1 |
| chr14_+_94026314 | 0.75 |
ENST00000203664.10
ENST00000553723.1 |
OTUB2
|
OTU deubiquitinase, ubiquitin aldehyde binding 2 |
| chr4_-_168480477 | 0.74 |
ENST00000514748.5
ENST00000512371.1 ENST00000505890.5 ENST00000682922.1 ENST00000511577.5 |
DDX60L
|
DExD/H-box 60 like |
| chr13_+_45464901 | 0.72 |
ENST00000349995.10
|
COG3
|
component of oligomeric golgi complex 3 |
| chr1_+_66354375 | 0.70 |
ENST00000480109.2
|
PDE4B
|
phosphodiesterase 4B |
| chr3_-_11568764 | 0.64 |
ENST00000424529.6
|
VGLL4
|
vestigial like family member 4 |
| chrX_-_134797134 | 0.63 |
ENST00000370790.5
ENST00000493333.5 ENST00000611027.2 ENST00000343004.10 ENST00000298090.10 |
PABIR2
|
PABIR family member 2 |
| chr2_+_44275457 | 0.61 |
ENST00000611973.4
ENST00000409387.5 |
SLC3A1
|
solute carrier family 3 member 1 |
| chr2_-_69643152 | 0.59 |
ENST00000606389.7
|
AAK1
|
AP2 associated kinase 1 |
| chr8_-_48921735 | 0.57 |
ENST00000396822.6
|
SNAI2
|
snail family transcriptional repressor 2 |
| chr17_-_40799939 | 0.56 |
ENST00000306658.8
|
KRT28
|
keratin 28 |
| chr19_-_35812838 | 0.54 |
ENST00000653904.2
|
PRODH2
|
proline dehydrogenase 2 |
| chr8_-_18683932 | 0.53 |
ENST00000615573.4
|
PSD3
|
pleckstrin and Sec7 domain containing 3 |
| chr2_+_171453122 | 0.53 |
ENST00000611110.4
ENST00000339506.7 |
DCAF17
|
DDB1 and CUL4 associated factor 17 |
| chr4_+_158521714 | 0.53 |
ENST00000613319.4
ENST00000423548.5 ENST00000448688.6 |
RXFP1
|
relaxin family peptide receptor 1 |
| chr6_+_106461464 | 0.52 |
ENST00000651520.1
|
CRYBG1
|
crystallin beta-gamma domain containing 1 |
| chr17_+_74935892 | 0.52 |
ENST00000328801.6
|
OTOP3
|
otopetrin 3 |
| chr8_-_18684093 | 0.52 |
ENST00000428502.6
|
PSD3
|
pleckstrin and Sec7 domain containing 3 |
| chr12_-_118359105 | 0.51 |
ENST00000541186.5
ENST00000539872.5 |
TAOK3
|
TAO kinase 3 |
| chr2_+_44275491 | 0.51 |
ENST00000410056.7
ENST00000409741.5 ENST00000409229.7 |
SLC3A1
|
solute carrier family 3 member 1 |
| chrX_-_40096190 | 0.51 |
ENST00000679513.1
|
BCOR
|
BCL6 corepressor |
| chr19_+_45498439 | 0.50 |
ENST00000451287.7
|
PPM1N
|
protein phosphatase, Mg2+/Mn2+ dependent 1N (putative) |
| chr4_+_168497113 | 0.50 |
ENST00000511948.1
|
PALLD
|
palladin, cytoskeletal associated protein |
| chr12_+_53954870 | 0.49 |
ENST00000243103.4
|
HOXC12
|
homeobox C12 |
| chr19_-_7633713 | 0.48 |
ENST00000311069.6
|
PCP2
|
Purkinje cell protein 2 |
| chr7_-_81769971 | 0.47 |
ENST00000354224.10
ENST00000643024.1 |
HGF
|
hepatocyte growth factor |
| chr20_+_6007245 | 0.47 |
ENST00000378868.4
|
CRLS1
|
cardiolipin synthase 1 |
| chr5_-_141618957 | 0.46 |
ENST00000389054.8
|
DIAPH1
|
diaphanous related formin 1 |
| chr2_-_70553440 | 0.45 |
ENST00000450929.5
|
TGFA
|
transforming growth factor alpha |
| chr11_+_72114840 | 0.44 |
ENST00000622388.4
|
FOLR3
|
folate receptor gamma |
| chr11_-_107858561 | 0.43 |
ENST00000375682.8
|
SLC35F2
|
solute carrier family 35 member F2 |
| chr4_+_158521872 | 0.40 |
ENST00000307765.10
|
RXFP1
|
relaxin family peptide receptor 1 |
| chr6_-_25874212 | 0.40 |
ENST00000361703.10
ENST00000397060.8 |
SLC17A3
|
solute carrier family 17 member 3 |
| chr17_+_75543258 | 0.39 |
ENST00000581713.5
|
LLGL2
|
LLGL scribble cell polarity complex component 2 |
| chr8_-_18684033 | 0.39 |
ENST00000614430.3
|
PSD3
|
pleckstrin and Sec7 domain containing 3 |
| chr12_+_56116623 | 0.39 |
ENST00000546591.6
|
RPL41
|
ribosomal protein L41 |
| chr6_-_73521783 | 0.39 |
ENST00000331523.7
ENST00000356303.7 |
EEF1A1
|
eukaryotic translation elongation factor 1 alpha 1 |
| chr5_+_135579193 | 0.37 |
ENST00000646290.1
|
SLC25A48
|
solute carrier family 25 member 48 |
| chr6_+_130018565 | 0.36 |
ENST00000361794.7
ENST00000526087.5 ENST00000533560.5 |
L3MBTL3
|
L3MBTL histone methyl-lysine binding protein 3 |
| chr2_+_44275473 | 0.34 |
ENST00000260649.11
|
SLC3A1
|
solute carrier family 3 member 1 |
| chr1_-_182672232 | 0.34 |
ENST00000508450.5
|
RGS8
|
regulator of G protein signaling 8 |
| chr12_+_56116584 | 0.32 |
ENST00000501597.3
|
RPL41
|
ribosomal protein L41 |
| chr1_-_182671853 | 0.31 |
ENST00000367556.5
|
RGS8
|
regulator of G protein signaling 8 |
| chr4_+_158521937 | 0.30 |
ENST00000343542.9
ENST00000470033.2 |
RXFP1
|
relaxin family peptide receptor 1 |
| chr4_-_122621011 | 0.30 |
ENST00000611104.2
ENST00000648588.1 |
IL21
|
interleukin 21 |
| chr12_-_52385649 | 0.28 |
ENST00000257951.3
|
KRT84
|
keratin 84 |
| chr7_-_81770013 | 0.28 |
ENST00000465234.2
|
HGF
|
hepatocyte growth factor |
| chr8_-_48921419 | 0.27 |
ENST00000020945.4
|
SNAI2
|
snail family transcriptional repressor 2 |
| chr10_+_18260715 | 0.27 |
ENST00000615785.4
ENST00000617363.4 ENST00000396576.6 |
CACNB2
|
calcium voltage-gated channel auxiliary subunit beta 2 |
| chr10_+_97584347 | 0.26 |
ENST00000370649.3
ENST00000370646.9 |
ENSG00000249967.1
HOGA1
|
novel protein 4-hydroxy-2-oxoglutarate aldolase 1 |
| chr12_-_30735014 | 0.25 |
ENST00000433722.6
|
CAPRIN2
|
caprin family member 2 |
| chr2_-_49973939 | 0.21 |
ENST00000630656.1
|
NRXN1
|
neurexin 1 |
| chr11_-_96343170 | 0.21 |
ENST00000524717.6
|
MAML2
|
mastermind like transcriptional coactivator 2 |
| chr11_-_31509588 | 0.19 |
ENST00000534812.5
ENST00000529749.5 ENST00000532287.6 ENST00000278200.5 ENST00000530023.5 ENST00000533642.1 |
IMMP1L
|
inner mitochondrial membrane peptidase subunit 1 |
| chr5_-_141618914 | 0.18 |
ENST00000518047.5
|
DIAPH1
|
diaphanous related formin 1 |
| chrX_+_134796758 | 0.18 |
ENST00000414371.6
|
PABIR3
|
PABIR family member 3 |
| chr15_+_45252228 | 0.18 |
ENST00000560438.5
ENST00000347644.8 |
SLC28A2
|
solute carrier family 28 member 2 |
| chr12_+_53454718 | 0.17 |
ENST00000552819.5
ENST00000455667.7 |
PCBP2
|
poly(rC) binding protein 2 |
| chr6_-_138987640 | 0.16 |
ENST00000529597.5
ENST00000415951.6 ENST00000367663.8 ENST00000409812.6 |
REPS1
|
RALBP1 associated Eps domain containing 1 |
| chr1_+_193059587 | 0.16 |
ENST00000400968.7
ENST00000415442.2 ENST00000506303.1 |
RO60
|
Ro60, Y RNA binding protein |
| chr12_+_64405046 | 0.16 |
ENST00000540203.5
|
XPOT
|
exportin for tRNA |
| chrX_+_69616067 | 0.15 |
ENST00000338901.4
ENST00000525810.5 ENST00000527388.5 ENST00000374553.6 ENST00000374552.9 ENST00000524573.5 |
EDA
|
ectodysplasin A |
| chr1_+_193059448 | 0.15 |
ENST00000432079.5
|
RO60
|
Ro60, Y RNA binding protein |
| chr1_-_193059489 | 0.14 |
ENST00000367455.8
ENST00000421683.1 |
UCHL5
|
ubiquitin C-terminal hydrolase L5 |
| chr12_-_118359166 | 0.13 |
ENST00000542902.5
|
TAOK3
|
TAO kinase 3 |
| chr9_+_74615582 | 0.13 |
ENST00000396204.2
|
RORB
|
RAR related orphan receptor B |
| chr6_-_111483700 | 0.13 |
ENST00000435970.5
ENST00000358835.7 |
REV3L
|
REV3 like, DNA directed polymerase zeta catalytic subunit |
| chr4_-_175812236 | 0.13 |
ENST00000505375.5
|
GPM6A
|
glycoprotein M6A |
| chr1_-_182671902 | 0.12 |
ENST00000483095.6
|
RGS8
|
regulator of G protein signaling 8 |
| chr6_-_89217339 | 0.11 |
ENST00000454853.7
|
GABRR1
|
gamma-aminobutyric acid type A receptor subunit rho1 |
| chr12_+_53454764 | 0.10 |
ENST00000439930.7
ENST00000548933.5 |
PCBP2
|
poly(rC) binding protein 2 |
| chr1_-_44017296 | 0.10 |
ENST00000357730.6
ENST00000360584.6 ENST00000528803.1 |
SLC6A9
|
solute carrier family 6 member 9 |
| chr16_-_77431553 | 0.09 |
ENST00000562345.1
|
ADAMTS18
|
ADAM metallopeptidase with thrombospondin type 1 motif 18 |
| chr15_-_34583592 | 0.09 |
ENST00000683415.1
|
GOLGA8B
|
golgin A8 family member B |
| chr5_-_58999885 | 0.08 |
ENST00000317118.12
|
PDE4D
|
phosphodiesterase 4D |
| chr12_-_118359639 | 0.08 |
ENST00000541786.5
ENST00000419821.6 ENST00000541878.5 |
TAOK3
|
TAO kinase 3 |
| chr1_-_193059296 | 0.07 |
ENST00000367450.7
ENST00000367451.8 ENST00000367454.6 ENST00000367448.5 ENST00000367449.5 |
UCHL5
|
ubiquitin C-terminal hydrolase L5 |
| chr19_-_7632971 | 0.06 |
ENST00000598935.5
|
PCP2
|
Purkinje cell protein 2 |
| chr7_-_42152444 | 0.06 |
ENST00000479210.1
|
GLI3
|
GLI family zinc finger 3 |
| chr5_+_67004618 | 0.06 |
ENST00000261569.11
ENST00000436277.5 |
MAST4
|
microtubule associated serine/threonine kinase family member 4 |
| chr17_-_41467386 | 0.05 |
ENST00000225899.4
|
KRT32
|
keratin 32 |
| chr10_+_93612532 | 0.04 |
ENST00000371447.4
|
PDE6C
|
phosphodiesterase 6C |
| chr12_+_78977785 | 0.04 |
ENST00000551304.5
|
SYT1
|
synaptotagmin 1 |
| chr1_-_244862381 | 0.03 |
ENST00000640001.1
ENST00000639628.1 |
HNRNPU
|
heterogeneous nuclear ribonucleoprotein U |
| chr14_-_70416973 | 0.02 |
ENST00000555276.5
ENST00000617124.4 |
COX16
SYNJ2BP-COX16
|
cytochrome c oxidase assembly factor COX16 SYNJ2BP-COX16 readthrough |
| chr4_+_143433491 | 0.01 |
ENST00000512843.1
|
GAB1
|
GRB2 associated binding protein 1 |
| chr1_-_31919093 | 0.01 |
ENST00000602683.5
ENST00000470404.5 |
PTP4A2
|
protein tyrosine phosphatase 4A2 |
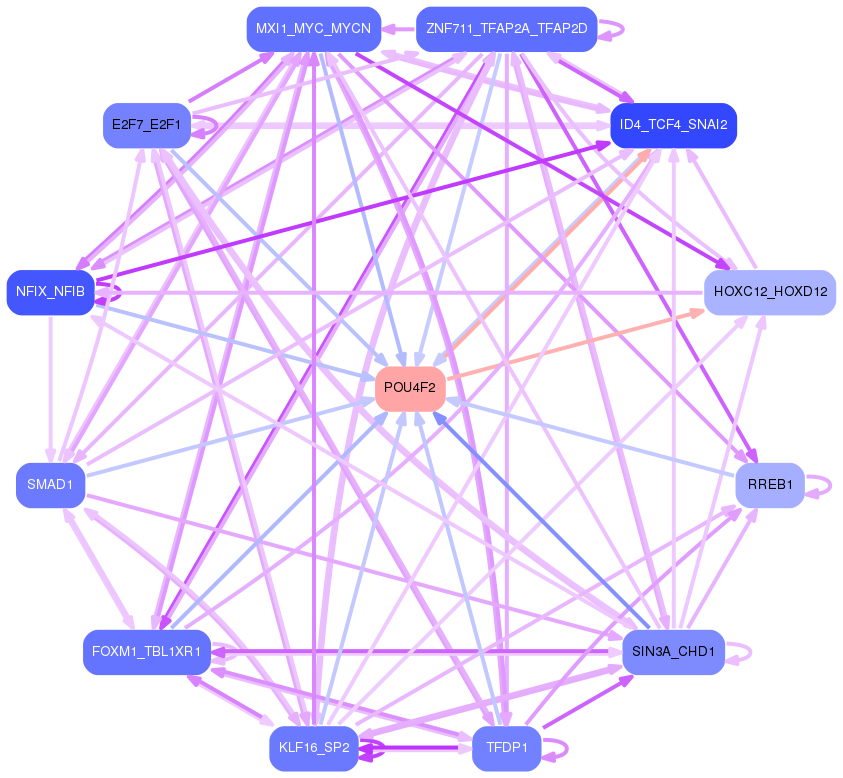
Network of associatons between targets according to the STRING database.

First level regulatory network of POU4F2
Gene Ontology Analysis
Gene overrepresentation in biological process category:
| Log-likelihood per target | Total log-likelihood | Term | Description |
|---|---|---|---|
| 1.9 | 9.4 | GO:2000471 | regulation of hematopoietic stem cell migration(GO:2000471) positive regulation of hematopoietic stem cell migration(GO:2000473) |
| 0.9 | 4.7 | GO:0042663 | regulation of endodermal cell fate specification(GO:0042663) |
| 0.7 | 5.1 | GO:0001920 | negative regulation of receptor recycling(GO:0001920) |
| 0.6 | 1.9 | GO:0002665 | negative regulation of T cell tolerance induction(GO:0002665) negative regulation of T cell anergy(GO:0002668) negative regulation of lymphocyte anergy(GO:0002912) regulation of lymphotoxin A production(GO:0032681) positive regulation of lymphotoxin A production(GO:0032761) regulation of lymphotoxin A biosynthetic process(GO:0043016) positive regulation of lymphotoxin A biosynthetic process(GO:0043017) |
| 0.5 | 2.6 | GO:0002913 | positive regulation of T cell anergy(GO:0002669) positive regulation of lymphocyte anergy(GO:0002913) |
| 0.4 | 4.4 | GO:0060665 | regulation of branching involved in salivary gland morphogenesis by mesenchymal-epithelial signaling(GO:0060665) |
| 0.4 | 8.1 | GO:0019800 | peptide cross-linking via chondroitin 4-sulfate glycosaminoglycan(GO:0019800) |
| 0.3 | 7.5 | GO:0019371 | cyclooxygenase pathway(GO:0019371) |
| 0.3 | 0.8 | GO:0070563 | negative regulation of vitamin D receptor signaling pathway(GO:0070563) |
| 0.2 | 1.5 | GO:0015811 | L-cystine transport(GO:0015811) |
| 0.2 | 1.1 | GO:0006543 | glutamine catabolic process(GO:0006543) |
| 0.1 | 0.5 | GO:0010133 | proline catabolic process to glutamate(GO:0010133) |
| 0.1 | 1.6 | GO:0006627 | protein processing involved in protein targeting to mitochondrion(GO:0006627) |
| 0.1 | 0.9 | GO:0036438 | maintenance of lens transparency(GO:0036438) |
| 0.1 | 0.5 | GO:0000415 | negative regulation of histone H3-K36 methylation(GO:0000415) |
| 0.1 | 1.1 | GO:1902897 | regulation of postsynaptic density protein 95 clustering(GO:1902897) |
| 0.1 | 1.4 | GO:0035372 | protein localization to microtubule(GO:0035372) |
| 0.1 | 1.2 | GO:0034447 | very-low-density lipoprotein particle clearance(GO:0034447) |
| 0.1 | 0.7 | GO:0035871 | protein K11-linked deubiquitination(GO:0035871) |
| 0.0 | 0.8 | GO:1901898 | negative regulation of relaxation of cardiac muscle(GO:1901898) |
| 0.0 | 3.1 | GO:0007190 | activation of adenylate cyclase activity(GO:0007190) |
| 0.0 | 0.5 | GO:0097068 | response to thyroxine(GO:0097068) response to L-phenylalanine derivative(GO:1904386) |
| 0.0 | 0.4 | GO:0000066 | mitochondrial ornithine transport(GO:0000066) |
| 0.0 | 0.4 | GO:0015712 | hexose phosphate transport(GO:0015712) glucose-6-phosphate transport(GO:0015760) |
| 0.0 | 0.8 | GO:0060159 | regulation of dopamine receptor signaling pathway(GO:0060159) |
| 0.0 | 0.1 | GO:0061536 | glycine secretion(GO:0061536) glycine secretion, neurotransmission(GO:0061537) |
| 0.0 | 1.4 | GO:0032012 | regulation of ARF protein signal transduction(GO:0032012) |
| 0.0 | 0.8 | GO:0007379 | segment specification(GO:0007379) |
| 0.0 | 1.1 | GO:0045745 | positive regulation of G-protein coupled receptor protein signaling pathway(GO:0045745) |
| 0.0 | 0.4 | GO:0043249 | erythrocyte maturation(GO:0043249) |
| 0.0 | 0.3 | GO:1904879 | positive regulation of calcium ion transmembrane transport via high voltage-gated calcium channel(GO:1904879) |
| 0.0 | 4.2 | GO:0050729 | positive regulation of inflammatory response(GO:0050729) |
| 0.0 | 0.4 | GO:0015884 | folic acid transport(GO:0015884) |
| 0.0 | 0.1 | GO:0061153 | trachea submucosa development(GO:0061152) trachea gland development(GO:0061153) |
| 0.0 | 2.7 | GO:0043966 | histone H3 acetylation(GO:0043966) |
| 0.0 | 0.4 | GO:0045741 | positive regulation of epidermal growth factor-activated receptor activity(GO:0045741) |
| 0.0 | 0.2 | GO:0015860 | purine nucleoside transmembrane transport(GO:0015860) |
| 0.0 | 0.3 | GO:0035878 | nail development(GO:0035878) |
| 0.0 | 0.4 | GO:1904714 | regulation of chaperone-mediated autophagy(GO:1904714) |
| 0.0 | 0.6 | GO:2000369 | regulation of clathrin-mediated endocytosis(GO:2000369) |
| 0.0 | 0.7 | GO:0046329 | negative regulation of JNK cascade(GO:0046329) |
| 0.0 | 0.3 | GO:0075522 | IRES-dependent viral translational initiation(GO:0075522) |
| 0.0 | 0.2 | GO:0007221 | positive regulation of transcription of Notch receptor target(GO:0007221) |
| 0.0 | 0.2 | GO:0042670 | retinal cone cell differentiation(GO:0042670) retinal cone cell development(GO:0046549) |
Gene overrepresentation in cellular component category:
| Log-likelihood per target | Total log-likelihood | Term | Description |
|---|---|---|---|
| 0.4 | 1.6 | GO:0042720 | mitochondrial inner membrane peptidase complex(GO:0042720) |
| 0.2 | 2.6 | GO:0042105 | alpha-beta T cell receptor complex(GO:0042105) |
| 0.2 | 5.1 | GO:0042101 | T cell receptor complex(GO:0042101) |
| 0.2 | 2.7 | GO:0033588 | Elongator holoenzyme complex(GO:0033588) |
| 0.1 | 3.5 | GO:0016592 | mediator complex(GO:0016592) |
| 0.1 | 7.6 | GO:0001750 | photoreceptor outer segment(GO:0001750) |
| 0.0 | 0.7 | GO:0017119 | Golgi transport complex(GO:0017119) |
| 0.0 | 1.2 | GO:0034362 | low-density lipoprotein particle(GO:0034362) |
| 0.0 | 1.1 | GO:0016342 | catenin complex(GO:0016342) |
| 0.0 | 0.4 | GO:0005853 | eukaryotic translation elongation factor 1 complex(GO:0005853) |
| 0.0 | 11.3 | GO:0009897 | external side of plasma membrane(GO:0009897) |
| 0.0 | 1.8 | GO:0031526 | brush border membrane(GO:0031526) |
| 0.0 | 0.1 | GO:0016035 | zeta DNA polymerase complex(GO:0016035) |
| 0.0 | 0.7 | GO:0000930 | gamma-tubulin complex(GO:0000930) |
| 0.0 | 3.1 | GO:0030864 | cortical actin cytoskeleton(GO:0030864) |
| 0.0 | 0.8 | GO:0044298 | neuronal cell body membrane(GO:0032809) cell body membrane(GO:0044298) |
| 0.0 | 8.0 | GO:0005578 | proteinaceous extracellular matrix(GO:0005578) |
| 0.0 | 2.6 | GO:0032587 | ruffle membrane(GO:0032587) |
| 0.0 | 0.9 | GO:0005762 | organellar large ribosomal subunit(GO:0000315) mitochondrial large ribosomal subunit(GO:0005762) |
| 0.0 | 1.5 | GO:0031093 | platelet alpha granule lumen(GO:0031093) |
| 0.0 | 0.5 | GO:0080008 | Cul4-RING E3 ubiquitin ligase complex(GO:0080008) |
| 0.0 | 0.3 | GO:1990454 | L-type voltage-gated calcium channel complex(GO:1990454) |
Gene overrepresentation in molecular function category:
| Log-likelihood per target | Total log-likelihood | Term | Description |
|---|---|---|---|
| 1.5 | 7.5 | GO:0004666 | prostaglandin-endoperoxide synthase activity(GO:0004666) |
| 0.3 | 8.1 | GO:0008191 | metalloendopeptidase inhibitor activity(GO:0008191) |
| 0.2 | 4.7 | GO:0017017 | MAP kinase tyrosine/serine/threonine phosphatase activity(GO:0017017) |
| 0.2 | 2.7 | GO:0008607 | phosphorylase kinase regulator activity(GO:0008607) |
| 0.2 | 9.4 | GO:0005001 | transmembrane receptor protein tyrosine phosphatase activity(GO:0005001) transmembrane receptor protein phosphatase activity(GO:0019198) |
| 0.2 | 5.1 | GO:0005068 | transmembrane receptor protein tyrosine kinase adaptor activity(GO:0005068) |
| 0.2 | 1.5 | GO:0015184 | L-cystine transmembrane transporter activity(GO:0015184) |
| 0.2 | 1.2 | GO:0030229 | very-low-density lipoprotein particle receptor activity(GO:0030229) |
| 0.2 | 2.6 | GO:0042608 | T cell receptor binding(GO:0042608) |
| 0.1 | 1.1 | GO:0004359 | glutaminase activity(GO:0004359) |
| 0.1 | 3.1 | GO:0008179 | adenylate cyclase binding(GO:0008179) |
| 0.1 | 0.9 | GO:0008109 | N-acetyllactosaminide beta-1,6-N-acetylglucosaminyltransferase activity(GO:0008109) |
| 0.1 | 4.4 | GO:0042056 | chemoattractant activity(GO:0042056) |
| 0.1 | 0.7 | GO:0019784 | NEDD8-specific protease activity(GO:0019784) |
| 0.1 | 0.4 | GO:0015562 | efflux transmembrane transporter activity(GO:0015562) |
| 0.1 | 3.9 | GO:0004693 | cyclin-dependent protein serine/threonine kinase activity(GO:0004693) |
| 0.0 | 0.4 | GO:0000064 | L-ornithine transmembrane transporter activity(GO:0000064) |
| 0.0 | 0.2 | GO:0005415 | nucleoside:sodium symporter activity(GO:0005415) |
| 0.0 | 0.6 | GO:0035612 | AP-2 adaptor complex binding(GO:0035612) |
| 0.0 | 1.1 | GO:0045294 | alpha-catenin binding(GO:0045294) |
| 0.0 | 0.3 | GO:0005134 | interleukin-2 receptor binding(GO:0005134) |
| 0.0 | 1.1 | GO:0047555 | 3',5'-cyclic-GMP phosphodiesterase activity(GO:0047555) |
| 0.0 | 0.5 | GO:0047144 | 2-acylglycerol-3-phosphate O-acyltransferase activity(GO:0047144) |
| 0.0 | 0.3 | GO:1990829 | C-rich single-stranded DNA binding(GO:1990829) |
| 0.0 | 1.4 | GO:0005086 | ARF guanyl-nucleotide exchange factor activity(GO:0005086) |
| 0.0 | 1.9 | GO:0015026 | coreceptor activity(GO:0015026) |
| 0.0 | 0.1 | GO:0015375 | glycine:sodium symporter activity(GO:0015375) |
| 0.0 | 0.8 | GO:0004115 | 3',5'-cyclic-AMP phosphodiesterase activity(GO:0004115) |
| 0.0 | 0.3 | GO:0030280 | structural constituent of epidermis(GO:0030280) |
| 0.0 | 1.0 | GO:0017091 | AU-rich element binding(GO:0017091) |
| 0.0 | 0.4 | GO:0005542 | folic acid binding(GO:0005542) |
| 0.0 | 0.9 | GO:0008157 | protein phosphatase 1 binding(GO:0008157) |
| 0.0 | 0.3 | GO:0086056 | voltage-gated calcium channel activity involved in AV node cell action potential(GO:0086056) |
| 0.0 | 0.5 | GO:0071949 | FAD binding(GO:0071949) |
| 0.0 | 0.7 | GO:0004709 | MAP kinase kinase kinase activity(GO:0004709) |
| 0.0 | 0.7 | GO:0048027 | mRNA 5'-UTR binding(GO:0048027) |
| 0.0 | 0.4 | GO:0003746 | translation elongation factor activity(GO:0003746) |
Gene overrepresentation in curated gene sets: canonical pathways category:
| Log-likelihood per target | Total log-likelihood | Term | Description |
|---|---|---|---|
| 0.1 | 8.1 | NABA PROTEOGLYCANS | Genes encoding proteoglycans |
| 0.1 | 13.9 | PID CD8 TCR PATHWAY | TCR signaling in naïve CD8+ T cells |
| 0.1 | 4.7 | ST ERK1 ERK2 MAPK PATHWAY | ERK1/ERK2 MAPK Pathway |
| 0.1 | 5.5 | PID ARF6 PATHWAY | Arf6 signaling events |
| 0.0 | 3.1 | SIG INSULIN RECEPTOR PATHWAY IN CARDIAC MYOCYTES | Genes related to the insulin receptor pathway |
| 0.0 | 1.1 | ST WNT CA2 CYCLIC GMP PATHWAY | Wnt/Ca2+/cyclic GMP signaling. |
| 0.0 | 1.4 | PID ECADHERIN STABILIZATION PATHWAY | Stabilization and expansion of the E-cadherin adherens junction |
| 0.0 | 1.1 | PID NCADHERIN PATHWAY | N-cadherin signaling events |
| 0.0 | 0.7 | PID P38 MKK3 6PATHWAY | p38 MAPK signaling pathway |
| 0.0 | 0.9 | PID KIT PATHWAY | Signaling events mediated by Stem cell factor receptor (c-Kit) |
| 0.0 | 0.4 | PID ERBB NETWORK PATHWAY | ErbB receptor signaling network |
Gene overrepresentation in curated gene sets: REACTOME pathways category:
| Log-likelihood per target | Total log-likelihood | Term | Description |
|---|---|---|---|
| 0.4 | 11.9 | REACTOME PHOSPHORYLATION OF CD3 AND TCR ZETA CHAINS | Genes involved in Phosphorylation of CD3 and TCR zeta chains |
| 0.2 | 4.7 | REACTOME ERKS ARE INACTIVATED | Genes involved in ERKs are inactivated |
| 0.1 | 5.1 | REACTOME DOWNSTREAM TCR SIGNALING | Genes involved in Downstream TCR signaling |
| 0.1 | 4.4 | REACTOME IL 7 SIGNALING | Genes involved in Interleukin-7 signaling |
| 0.1 | 7.5 | REACTOME PHASE1 FUNCTIONALIZATION OF COMPOUNDS | Genes involved in Phase 1 - Functionalization of compounds |
| 0.1 | 1.9 | REACTOME CD28 DEPENDENT VAV1 PATHWAY | Genes involved in CD28 dependent Vav1 pathway |
| 0.0 | 1.1 | REACTOME AMINO ACID SYNTHESIS AND INTERCONVERSION TRANSAMINATION | Genes involved in Amino acid synthesis and interconversion (transamination) |
| 0.0 | 2.1 | REACTOME SIGNALING BY ROBO RECEPTOR | Genes involved in Signaling by Robo receptor |
| 0.0 | 0.5 | REACTOME ACYL CHAIN REMODELLING OF PG | Genes involved in Acyl chain remodelling of PG |
| 0.0 | 1.1 | REACTOME CGMP EFFECTS | Genes involved in cGMP effects |
| 0.0 | 1.5 | REACTOME AMINO ACID TRANSPORT ACROSS THE PLASMA MEMBRANE | Genes involved in Amino acid transport across the plasma membrane |
| 0.0 | 3.9 | REACTOME PPARA ACTIVATES GENE EXPRESSION | Genes involved in PPARA Activates Gene Expression |
| 0.0 | 0.9 | REACTOME ADHERENS JUNCTIONS INTERACTIONS | Genes involved in Adherens junctions interactions |
| 0.0 | 0.3 | REACTOME INHIBITION OF INSULIN SECRETION BY ADRENALINE NORADRENALINE | Genes involved in Inhibition of Insulin Secretion by Adrenaline/Noradrenaline |
| 0.0 | 0.8 | REACTOME DARPP 32 EVENTS | Genes involved in DARPP-32 events |