Project
Illumina Body Map 2 (GSE30611)
Navigation
Downloads
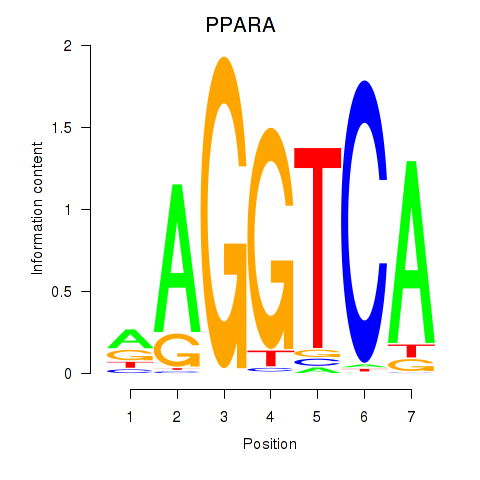
Results for PPARA
Z-value: 1.74
Motif logo
Transcription factors associated with PPARA
| Gene Symbol | Gene ID | Gene Info |
|---|---|---|
|
PPARA
|
ENSG00000186951.16 | peroxisome proliferator activated receptor alpha |
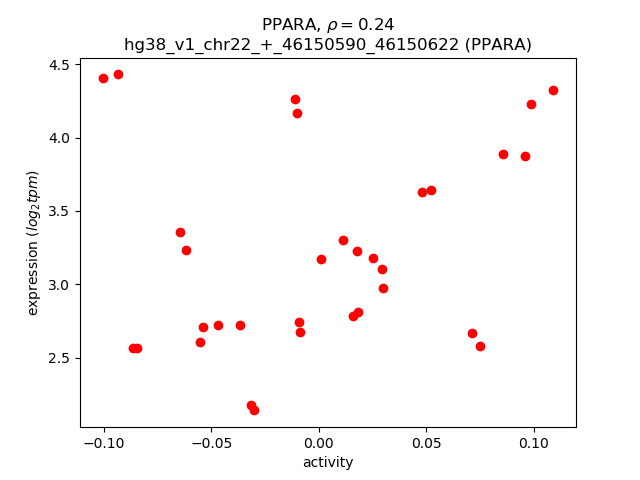
Activity-expression correlation:
| Gene | Promoter | Pearson corr. coef. | P-value | Plot |
|---|---|---|---|---|
| PPARA | hg38_v1_chr22_+_46150590_46150622 | 0.24 | 2.0e-01 | Click! |
Activity profile of PPARA motif
Sorted Z-values of PPARA motif
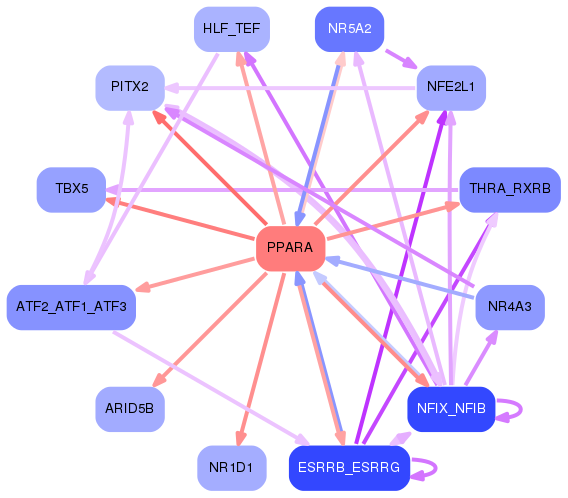
Network of associatons between targets according to the STRING database.

First level regulatory network of PPARA
Gene Ontology Analysis
Gene overrepresentation in biological process category:
| Log-likelihood per target | Total log-likelihood | Term | Description |
|---|---|---|---|
| 8.0 | 32.0 | GO:0060254 | regulation of N-terminal protein palmitoylation(GO:0060254) negative regulation of N-terminal protein palmitoylation(GO:0060262) negative regulation of protein lipidation(GO:1903060) |
| 7.0 | 20.9 | GO:0051695 | actin filament uncapping(GO:0051695) |
| 2.7 | 8.0 | GO:1903280 | negative regulation of calcium:sodium antiporter activity(GO:1903280) |
| 1.5 | 17.0 | GO:2000324 | positive regulation of glucocorticoid receptor signaling pathway(GO:2000324) |
| 1.4 | 5.6 | GO:1903279 | regulation of calcium:sodium antiporter activity(GO:1903279) positive regulation of calcium:sodium antiporter activity(GO:1903281) |
| 1.2 | 3.5 | GO:1901899 | positive regulation of relaxation of cardiac muscle(GO:1901899) |
| 1.1 | 6.4 | GO:0090131 | mesenchyme migration(GO:0090131) |
| 1.0 | 4.0 | GO:0006781 | succinyl-CoA pathway(GO:0006781) |
| 1.0 | 2.9 | GO:0021763 | subthalamic nucleus development(GO:0021763) prolactin secreting cell differentiation(GO:0060127) superior vena cava morphogenesis(GO:0060578) |
| 0.8 | 3.3 | GO:0061763 | multivesicular body-lysosome fusion(GO:0061763) |
| 0.8 | 22.1 | GO:1904714 | regulation of chaperone-mediated autophagy(GO:1904714) |
| 0.8 | 2.4 | GO:0003218 | cardiac left ventricle formation(GO:0003218) |
| 0.8 | 2.3 | GO:0043438 | acetoacetic acid metabolic process(GO:0043438) |
| 0.6 | 1.9 | GO:0080033 | cellular response to nitrite(GO:0071250) response to nitrite(GO:0080033) glomerular visceral epithelial cell apoptotic process(GO:1903210) regulation of glomerular visceral epithelial cell apoptotic process(GO:1904633) positive regulation of glomerular visceral epithelial cell apoptotic process(GO:1904635) response to resveratrol(GO:1904638) cellular response to resveratrol(GO:1904639) positive regulation of progesterone biosynthetic process(GO:2000184) |
| 0.6 | 1.9 | GO:0060086 | circadian temperature homeostasis(GO:0060086) |
| 0.6 | 4.3 | GO:0051012 | microtubule sliding(GO:0051012) |
| 0.6 | 2.4 | GO:0000961 | negative regulation of mitochondrial RNA catabolic process(GO:0000961) |
| 0.6 | 11.2 | GO:0090361 | platelet-derived growth factor production(GO:0090360) regulation of platelet-derived growth factor production(GO:0090361) |
| 0.6 | 8.8 | GO:0060316 | positive regulation of ryanodine-sensitive calcium-release channel activity(GO:0060316) |
| 0.6 | 2.3 | GO:0098971 | anterograde dendritic transport of neurotransmitter receptor complex(GO:0098971) |
| 0.6 | 7.4 | GO:0086036 | regulation of cardiac muscle cell membrane potential(GO:0086036) |
| 0.6 | 4.5 | GO:0010961 | cellular magnesium ion homeostasis(GO:0010961) |
| 0.5 | 2.1 | GO:1990926 | short-term synaptic potentiation(GO:1990926) |
| 0.5 | 8.9 | GO:0006122 | mitochondrial electron transport, ubiquinol to cytochrome c(GO:0006122) |
| 0.5 | 6.3 | GO:0072592 | oxygen metabolic process(GO:0072592) |
| 0.5 | 3.1 | GO:1904049 | negative regulation of spontaneous neurotransmitter secretion(GO:1904049) |
| 0.5 | 3.6 | GO:0021590 | cerebellum maturation(GO:0021590) cerebellar cortex maturation(GO:0021699) |
| 0.5 | 2.8 | GO:0097498 | endothelial tube lumen extension(GO:0097498) |
| 0.5 | 6.3 | GO:0014722 | regulation of skeletal muscle contraction by calcium ion signaling(GO:0014722) |
| 0.5 | 2.3 | GO:1903070 | negative regulation of ER-associated ubiquitin-dependent protein catabolic process(GO:1903070) |
| 0.4 | 2.1 | GO:1903028 | positive regulation of opsonization(GO:1903028) |
| 0.4 | 0.4 | GO:0046668 | regulation of retinal cell programmed cell death(GO:0046668) |
| 0.4 | 4.1 | GO:1901098 | positive regulation of autophagosome maturation(GO:1901098) |
| 0.4 | 1.6 | GO:0038060 | nitric oxide-cGMP-mediated signaling pathway(GO:0038060) |
| 0.4 | 1.2 | GO:0070079 | peptidyl-lysine hydroxylation to 5-hydroxy-L-lysine(GO:0018395) histone arginine demethylation(GO:0070077) histone H3-R2 demethylation(GO:0070078) histone H4-R3 demethylation(GO:0070079) |
| 0.4 | 1.6 | GO:0032972 | diaphragm contraction(GO:0002086) regulation of muscle filament sliding speed(GO:0032972) |
| 0.4 | 2.0 | GO:1902261 | positive regulation of delayed rectifier potassium channel activity(GO:1902261) |
| 0.4 | 6.3 | GO:0006600 | creatine metabolic process(GO:0006600) |
| 0.4 | 6.5 | GO:1901387 | positive regulation of voltage-gated calcium channel activity(GO:1901387) |
| 0.4 | 1.5 | GO:1903984 | regulation of transcription from RNA polymerase II promoter in response to arsenic-containing substance(GO:0061394) positive regulation of TRAIL-activated apoptotic signaling pathway(GO:1903984) |
| 0.4 | 1.4 | GO:0070681 | glutaminyl-tRNAGln biosynthesis via transamidation(GO:0070681) |
| 0.4 | 1.4 | GO:0045763 | negative regulation of cellular amino acid metabolic process(GO:0045763) |
| 0.3 | 0.3 | GO:1901856 | negative regulation of cellular respiration(GO:1901856) |
| 0.3 | 24.1 | GO:0006120 | mitochondrial electron transport, NADH to ubiquinone(GO:0006120) |
| 0.3 | 8.1 | GO:0042761 | very long-chain fatty acid biosynthetic process(GO:0042761) |
| 0.3 | 0.9 | GO:2000984 | regulation of ATP citrate synthase activity(GO:2000983) negative regulation of ATP citrate synthase activity(GO:2000984) |
| 0.3 | 1.2 | GO:0048789 | cytoskeletal matrix organization at active zone(GO:0048789) neurexin clustering involved in presynaptic membrane assembly(GO:0097115) retrograde trans-synaptic signaling by trans-synaptic protein complex(GO:0098942) |
| 0.3 | 4.8 | GO:0042407 | cristae formation(GO:0042407) |
| 0.3 | 2.7 | GO:0097167 | circadian regulation of translation(GO:0097167) |
| 0.3 | 2.1 | GO:0070966 | nuclear-transcribed mRNA catabolic process, no-go decay(GO:0070966) |
| 0.3 | 2.1 | GO:2001295 | malonyl-CoA biosynthetic process(GO:2001295) |
| 0.3 | 5.9 | GO:0050812 | regulation of acetyl-CoA biosynthetic process from pyruvate(GO:0010510) regulation of acyl-CoA biosynthetic process(GO:0050812) |
| 0.3 | 7.6 | GO:0001976 | neurological system process involved in regulation of systemic arterial blood pressure(GO:0001976) |
| 0.3 | 2.0 | GO:0035610 | protein side chain deglutamylation(GO:0035610) |
| 0.3 | 0.8 | GO:1904106 | protein localization to microvillus(GO:1904106) |
| 0.3 | 0.6 | GO:0098935 | dendritic transport(GO:0098935) anterograde dendritic transport(GO:0098937) |
| 0.3 | 1.1 | GO:0007499 | ectoderm and mesoderm interaction(GO:0007499) |
| 0.3 | 3.8 | GO:2000291 | regulation of myoblast proliferation(GO:2000291) |
| 0.3 | 1.6 | GO:0017055 | negative regulation of RNA polymerase II transcriptional preinitiation complex assembly(GO:0017055) |
| 0.3 | 1.9 | GO:0070358 | actin polymerization-dependent cell motility(GO:0070358) |
| 0.3 | 0.8 | GO:0007518 | myoblast fate determination(GO:0007518) |
| 0.3 | 0.8 | GO:0098884 | postsynaptic neurotransmitter receptor internalization(GO:0098884) |
| 0.2 | 0.7 | GO:0070676 | intralumenal vesicle formation(GO:0070676) |
| 0.2 | 0.7 | GO:0014034 | neural crest cell fate commitment(GO:0014034) canonical Wnt signaling pathway involved in neural crest cell differentiation(GO:0044335) |
| 0.2 | 1.2 | GO:0072365 | regulation of cellular ketone metabolic process by negative regulation of transcription from RNA polymerase II promoter(GO:0072365) |
| 0.2 | 1.6 | GO:0006102 | isocitrate metabolic process(GO:0006102) response to isolation stress(GO:0035900) |
| 0.2 | 1.1 | GO:0019918 | peptidyl-arginine methylation, to symmetrical-dimethyl arginine(GO:0019918) |
| 0.2 | 0.9 | GO:0021893 | regulation of transcription from RNA polymerase II promoter involved in forebrain neuron fate commitment(GO:0021882) cerebral cortex GABAergic interneuron fate commitment(GO:0021893) positive regulation of neural retina development(GO:0061075) positive regulation of retina development in camera-type eye(GO:1902868) positive regulation of amacrine cell differentiation(GO:1902871) |
| 0.2 | 0.9 | GO:0097252 | oligodendrocyte apoptotic process(GO:0097252) |
| 0.2 | 1.7 | GO:0061709 | reticulophagy(GO:0061709) |
| 0.2 | 0.2 | GO:0010615 | positive regulation of cardiac muscle adaptation(GO:0010615) positive regulation of cardiac muscle hypertrophy in response to stress(GO:1903244) |
| 0.2 | 0.9 | GO:0006740 | NADPH regeneration(GO:0006740) |
| 0.2 | 0.8 | GO:0021849 | neuroblast division in subventricular zone(GO:0021849) |
| 0.2 | 0.8 | GO:0019355 | nicotinamide nucleotide biosynthetic process from aspartate(GO:0019355) 'de novo' NAD biosynthetic process from aspartate(GO:0034628) |
| 0.2 | 1.0 | GO:1904428 | negative regulation of tubulin deacetylation(GO:1904428) |
| 0.2 | 6.1 | GO:0031115 | negative regulation of microtubule polymerization(GO:0031115) |
| 0.2 | 0.8 | GO:0035606 | peptidyl-cysteine S-trans-nitrosylation(GO:0035606) |
| 0.2 | 0.6 | GO:1904717 | excitatory chemical synaptic transmission(GO:0098976) regulation of AMPA glutamate receptor clustering(GO:1904717) positive regulation of AMPA glutamate receptor clustering(GO:1904719) |
| 0.2 | 3.4 | GO:0000338 | protein deneddylation(GO:0000338) |
| 0.2 | 0.6 | GO:0070563 | negative regulation of vitamin D receptor signaling pathway(GO:0070563) |
| 0.2 | 4.9 | GO:0006123 | mitochondrial electron transport, cytochrome c to oxygen(GO:0006123) |
| 0.2 | 1.2 | GO:1901355 | cellular response to rapamycin(GO:0072752) response to rapamycin(GO:1901355) |
| 0.2 | 0.8 | GO:0006663 | platelet activating factor biosynthetic process(GO:0006663) |
| 0.2 | 0.7 | GO:1905150 | regulation of voltage-gated sodium channel activity(GO:1905150) |
| 0.2 | 0.4 | GO:0000255 | allantoin metabolic process(GO:0000255) |
| 0.2 | 1.2 | GO:0006196 | AMP catabolic process(GO:0006196) |
| 0.2 | 16.3 | GO:0000381 | regulation of alternative mRNA splicing, via spliceosome(GO:0000381) |
| 0.2 | 1.5 | GO:1900169 | regulation of glucocorticoid mediated signaling pathway(GO:1900169) |
| 0.2 | 0.5 | GO:0071676 | negative regulation of mononuclear cell migration(GO:0071676) |
| 0.2 | 4.8 | GO:0097031 | NADH dehydrogenase complex assembly(GO:0010257) mitochondrial respiratory chain complex I assembly(GO:0032981) mitochondrial respiratory chain complex I biogenesis(GO:0097031) |
| 0.2 | 5.0 | GO:1900745 | positive regulation of p38MAPK cascade(GO:1900745) |
| 0.2 | 1.8 | GO:0015793 | glycerol transport(GO:0015793) |
| 0.2 | 0.5 | GO:0061033 | secretion by lung epithelial cell involved in lung growth(GO:0061033) |
| 0.2 | 1.3 | GO:0033353 | S-adenosylmethionine cycle(GO:0033353) |
| 0.2 | 4.7 | GO:0071420 | cellular response to histamine(GO:0071420) |
| 0.2 | 1.8 | GO:0071963 | establishment or maintenance of cell polarity regulating cell shape(GO:0071963) |
| 0.2 | 0.6 | GO:0035964 | COPI-coated vesicle budding(GO:0035964) Golgi transport vesicle coating(GO:0048200) COPI coating of Golgi vesicle(GO:0048205) |
| 0.2 | 0.5 | GO:0061027 | umbilical cord morphogenesis(GO:0036304) umbilical cord development(GO:0061027) negative regulation of transcription from RNA polymerase II promoter involved in smooth muscle cell differentiation(GO:2000820) |
| 0.1 | 3.0 | GO:0030150 | protein import into mitochondrial matrix(GO:0030150) |
| 0.1 | 0.4 | GO:0031999 | negative regulation of fatty acid beta-oxidation(GO:0031999) |
| 0.1 | 0.4 | GO:0002184 | cytoplasmic translational termination(GO:0002184) |
| 0.1 | 0.4 | GO:0051939 | gamma-aminobutyric acid import(GO:0051939) |
| 0.1 | 0.4 | GO:0006106 | fumarate metabolic process(GO:0006106) |
| 0.1 | 2.3 | GO:0042090 | interleukin-12 biosynthetic process(GO:0042090) regulation of interleukin-12 biosynthetic process(GO:0045075) |
| 0.1 | 2.5 | GO:0001514 | selenocysteine incorporation(GO:0001514) translational readthrough(GO:0006451) |
| 0.1 | 1.0 | GO:0061589 | calcium activated phosphatidylserine scrambling(GO:0061589) |
| 0.1 | 2.3 | GO:0043374 | CD8-positive, alpha-beta T cell differentiation(GO:0043374) |
| 0.1 | 0.4 | GO:0036323 | vascular endothelial growth factor receptor-1 signaling pathway(GO:0036323) |
| 0.1 | 0.5 | GO:0035519 | protein K29-linked ubiquitination(GO:0035519) |
| 0.1 | 2.1 | GO:0003322 | pancreatic A cell development(GO:0003322) |
| 0.1 | 2.4 | GO:0051386 | regulation of neurotrophin TRK receptor signaling pathway(GO:0051386) |
| 0.1 | 2.9 | GO:0033539 | fatty acid beta-oxidation using acyl-CoA dehydrogenase(GO:0033539) |
| 0.1 | 1.8 | GO:0007258 | JUN phosphorylation(GO:0007258) |
| 0.1 | 6.9 | GO:0035025 | positive regulation of Rho protein signal transduction(GO:0035025) |
| 0.1 | 0.4 | GO:0035573 | N-terminal peptidyl-alanine methylation(GO:0018011) N-terminal peptidyl-alanine trimethylation(GO:0018012) N-terminal peptidyl-glycine methylation(GO:0018013) N-terminal peptidyl-proline dimethylation(GO:0018016) peptidyl-alanine modification(GO:0018194) N-terminal peptidyl-proline methylation(GO:0035568) N-terminal peptidyl-serine methylation(GO:0035570) N-terminal peptidyl-serine dimethylation(GO:0035572) N-terminal peptidyl-serine trimethylation(GO:0035573) |
| 0.1 | 8.7 | GO:0030049 | muscle filament sliding(GO:0030049) actin-myosin filament sliding(GO:0033275) |
| 0.1 | 0.6 | GO:1900039 | positive regulation of cellular response to hypoxia(GO:1900039) |
| 0.1 | 0.3 | GO:0042144 | vacuole fusion, non-autophagic(GO:0042144) |
| 0.1 | 2.0 | GO:0019532 | oxalate transport(GO:0019532) |
| 0.1 | 0.6 | GO:1904491 | protein localization to ciliary transition zone(GO:1904491) |
| 0.1 | 0.4 | GO:0042335 | cuticle development(GO:0042335) |
| 0.1 | 0.8 | GO:0042264 | peptidyl-aspartic acid modification(GO:0018197) peptidyl-aspartic acid hydroxylation(GO:0042264) |
| 0.1 | 2.7 | GO:2000651 | positive regulation of sodium ion transmembrane transporter activity(GO:2000651) |
| 0.1 | 0.4 | GO:1903565 | negative regulation of protein localization to cilium(GO:1903565) regulation of protein localization to ciliary membrane(GO:1903567) negative regulation of protein localization to ciliary membrane(GO:1903568) |
| 0.1 | 2.3 | GO:0014733 | regulation of skeletal muscle adaptation(GO:0014733) |
| 0.1 | 1.0 | GO:0060770 | negative regulation of epithelial cell proliferation involved in prostate gland development(GO:0060770) |
| 0.1 | 1.3 | GO:0048312 | intracellular distribution of mitochondria(GO:0048312) |
| 0.1 | 3.5 | GO:0014850 | response to muscle activity(GO:0014850) |
| 0.1 | 2.0 | GO:0090292 | nuclear matrix anchoring at nuclear membrane(GO:0090292) |
| 0.1 | 1.9 | GO:0045475 | locomotor rhythm(GO:0045475) |
| 0.1 | 0.4 | GO:0032747 | positive regulation of interleukin-23 production(GO:0032747) |
| 0.1 | 1.4 | GO:0035095 | behavioral response to nicotine(GO:0035095) |
| 0.1 | 1.4 | GO:1903690 | negative regulation of wound healing, spreading of epidermal cells(GO:1903690) |
| 0.1 | 0.5 | GO:1904849 | positive regulation of cell chemotaxis to fibroblast growth factor(GO:1904849) positive regulation of endothelial cell chemotaxis to fibroblast growth factor(GO:2000546) |
| 0.1 | 1.6 | GO:0035269 | protein O-linked mannosylation(GO:0035269) |
| 0.1 | 1.7 | GO:0070102 | interleukin-6-mediated signaling pathway(GO:0070102) |
| 0.1 | 1.2 | GO:0097688 | AMPA glutamate receptor clustering(GO:0097113) glutamate receptor clustering(GO:0097688) |
| 0.1 | 4.0 | GO:0032012 | regulation of ARF protein signal transduction(GO:0032012) |
| 0.1 | 1.5 | GO:0016559 | peroxisome fission(GO:0016559) |
| 0.1 | 2.1 | GO:0006388 | tRNA splicing, via endonucleolytic cleavage and ligation(GO:0006388) |
| 0.1 | 1.5 | GO:0048227 | plasma membrane to endosome transport(GO:0048227) |
| 0.1 | 0.8 | GO:0003190 | atrioventricular valve formation(GO:0003190) |
| 0.1 | 1.0 | GO:0017183 | peptidyl-diphthamide metabolic process(GO:0017182) peptidyl-diphthamide biosynthetic process from peptidyl-histidine(GO:0017183) |
| 0.1 | 1.5 | GO:0070584 | mitochondrion morphogenesis(GO:0070584) |
| 0.1 | 1.2 | GO:0035524 | proline transmembrane transport(GO:0035524) |
| 0.1 | 3.8 | GO:0032958 | inositol phosphate biosynthetic process(GO:0032958) |
| 0.1 | 1.5 | GO:0033601 | positive regulation of mammary gland epithelial cell proliferation(GO:0033601) |
| 0.1 | 2.2 | GO:0007016 | cytoskeletal anchoring at plasma membrane(GO:0007016) |
| 0.1 | 2.6 | GO:0090005 | negative regulation of establishment of protein localization to plasma membrane(GO:0090005) |
| 0.1 | 1.1 | GO:1903764 | regulation of potassium ion export across plasma membrane(GO:1903764) |
| 0.1 | 0.6 | GO:0061767 | negative regulation of lung blood pressure(GO:0061767) |
| 0.1 | 0.6 | GO:0007296 | vitellogenesis(GO:0007296) |
| 0.1 | 0.4 | GO:0038098 | sequestering of BMP from receptor via BMP binding(GO:0038098) |
| 0.1 | 3.0 | GO:0003298 | physiological muscle hypertrophy(GO:0003298) physiological cardiac muscle hypertrophy(GO:0003301) cell growth involved in cardiac muscle cell development(GO:0061049) |
| 0.1 | 0.5 | GO:0031161 | phosphatidylinositol catabolic process(GO:0031161) |
| 0.1 | 0.8 | GO:0099566 | regulation of postsynaptic cytosolic calcium ion concentration(GO:0099566) |
| 0.1 | 1.4 | GO:0060973 | cell migration involved in heart development(GO:0060973) |
| 0.1 | 0.6 | GO:0090074 | negative regulation of protein homodimerization activity(GO:0090074) |
| 0.1 | 1.7 | GO:0071044 | histone mRNA catabolic process(GO:0071044) |
| 0.1 | 1.4 | GO:0006853 | carnitine shuttle(GO:0006853) |
| 0.1 | 0.5 | GO:0051835 | positive regulation of synapse structural plasticity(GO:0051835) |
| 0.1 | 0.2 | GO:0061300 | cerebellum vasculature development(GO:0061300) |
| 0.1 | 0.2 | GO:0006883 | cellular sodium ion homeostasis(GO:0006883) |
| 0.1 | 5.2 | GO:0015701 | bicarbonate transport(GO:0015701) |
| 0.1 | 0.5 | GO:0032483 | regulation of Rab protein signal transduction(GO:0032483) |
| 0.1 | 0.3 | GO:1900118 | negative regulation of execution phase of apoptosis(GO:1900118) |
| 0.1 | 0.7 | GO:0021633 | optic nerve structural organization(GO:0021633) |
| 0.1 | 0.9 | GO:0006105 | succinate metabolic process(GO:0006105) |
| 0.1 | 1.2 | GO:0016576 | histone dephosphorylation(GO:0016576) |
| 0.1 | 0.4 | GO:0009236 | cobalamin biosynthetic process(GO:0009236) |
| 0.1 | 1.8 | GO:0046069 | smooth muscle cell apoptotic process(GO:0034390) regulation of smooth muscle cell apoptotic process(GO:0034391) cGMP catabolic process(GO:0046069) |
| 0.1 | 1.0 | GO:0015866 | ADP transport(GO:0015866) |
| 0.1 | 0.5 | GO:0019255 | glucose 1-phosphate metabolic process(GO:0019255) |
| 0.1 | 0.3 | GO:2001271 | negative regulation of cysteine-type endopeptidase activity involved in execution phase of apoptosis(GO:2001271) |
| 0.1 | 1.2 | GO:1900078 | positive regulation of cellular response to insulin stimulus(GO:1900078) |
| 0.1 | 1.3 | GO:0070072 | proton-transporting V-type ATPase complex assembly(GO:0070070) vacuolar proton-transporting V-type ATPase complex assembly(GO:0070072) |
| 0.1 | 0.8 | GO:0072502 | cellular phosphate ion homeostasis(GO:0030643) cellular trivalent inorganic anion homeostasis(GO:0072502) |
| 0.1 | 0.5 | GO:0070940 | dephosphorylation of RNA polymerase II C-terminal domain(GO:0070940) |
| 0.1 | 0.2 | GO:0090310 | negative regulation of methylation-dependent chromatin silencing(GO:0090310) |
| 0.1 | 0.8 | GO:0048251 | elastic fiber assembly(GO:0048251) |
| 0.1 | 0.2 | GO:0009644 | response to high light intensity(GO:0009644) |
| 0.1 | 0.5 | GO:1903593 | regulation of histamine secretion by mast cell(GO:1903593) |
| 0.1 | 0.4 | GO:0014846 | esophagus smooth muscle contraction(GO:0014846) |
| 0.1 | 4.1 | GO:0043268 | positive regulation of potassium ion transport(GO:0043268) |
| 0.1 | 0.3 | GO:0048861 | leukemia inhibitory factor signaling pathway(GO:0048861) |
| 0.1 | 0.2 | GO:0061002 | negative regulation of dendritic spine morphogenesis(GO:0061002) |
| 0.1 | 1.3 | GO:1901642 | nucleoside transmembrane transport(GO:1901642) |
| 0.1 | 0.2 | GO:0046379 | extracellular polysaccharide biosynthetic process(GO:0045226) extracellular polysaccharide metabolic process(GO:0046379) |
| 0.1 | 1.7 | GO:0006851 | mitochondrial calcium ion transport(GO:0006851) |
| 0.1 | 0.6 | GO:0072553 | terminal button organization(GO:0072553) |
| 0.1 | 0.7 | GO:0001886 | endothelial cell morphogenesis(GO:0001886) |
| 0.1 | 0.6 | GO:0071688 | striated muscle myosin thick filament assembly(GO:0071688) |
| 0.1 | 1.0 | GO:0007097 | nuclear migration(GO:0007097) |
| 0.1 | 5.1 | GO:0051865 | protein autoubiquitination(GO:0051865) |
| 0.1 | 0.5 | GO:0006499 | N-terminal protein myristoylation(GO:0006499) |
| 0.1 | 1.1 | GO:0019371 | cyclooxygenase pathway(GO:0019371) |
| 0.1 | 7.9 | GO:1900034 | regulation of cellular response to heat(GO:1900034) |
| 0.1 | 10.8 | GO:0006941 | striated muscle contraction(GO:0006941) |
| 0.1 | 2.5 | GO:0010107 | potassium ion import(GO:0010107) |
| 0.1 | 1.4 | GO:0031581 | hemidesmosome assembly(GO:0031581) |
| 0.1 | 1.1 | GO:0034497 | protein localization to pre-autophagosomal structure(GO:0034497) |
| 0.1 | 0.6 | GO:0006013 | mannose metabolic process(GO:0006013) |
| 0.0 | 2.3 | GO:0030262 | apoptotic nuclear changes(GO:0030262) |
| 0.0 | 1.2 | GO:0045292 | mRNA cis splicing, via spliceosome(GO:0045292) |
| 0.0 | 0.4 | GO:1901727 | positive regulation of histone deacetylase activity(GO:1901727) |
| 0.0 | 1.6 | GO:0019430 | removal of superoxide radicals(GO:0019430) |
| 0.0 | 0.3 | GO:0015015 | heparan sulfate proteoglycan biosynthetic process, enzymatic modification(GO:0015015) |
| 0.0 | 0.3 | GO:0060800 | regulation of cell differentiation involved in embryonic placenta development(GO:0060800) |
| 0.0 | 0.3 | GO:0033133 | positive regulation of glucokinase activity(GO:0033133) |
| 0.0 | 0.3 | GO:0016584 | nucleosome positioning(GO:0016584) |
| 0.0 | 3.3 | GO:0051693 | actin filament capping(GO:0051693) |
| 0.0 | 2.6 | GO:0007340 | acrosome reaction(GO:0007340) |
| 0.0 | 0.9 | GO:0033141 | positive regulation of peptidyl-serine phosphorylation of STAT protein(GO:0033141) |
| 0.0 | 0.9 | GO:0070986 | left/right axis specification(GO:0070986) |
| 0.0 | 0.7 | GO:0045176 | apical protein localization(GO:0045176) |
| 0.0 | 1.0 | GO:0014887 | muscle hypertrophy in response to stress(GO:0003299) cardiac muscle adaptation(GO:0014887) cardiac muscle hypertrophy in response to stress(GO:0014898) |
| 0.0 | 0.2 | GO:0018262 | isopeptide cross-linking via N6-(L-isoglutamyl)-L-lysine(GO:0018153) isopeptide cross-linking(GO:0018262) |
| 0.0 | 0.6 | GO:0030091 | protein repair(GO:0030091) |
| 0.0 | 0.8 | GO:0051531 | NFAT protein import into nucleus(GO:0051531) |
| 0.0 | 3.6 | GO:0035987 | endodermal cell differentiation(GO:0035987) |
| 0.0 | 2.5 | GO:0048488 | synaptic vesicle endocytosis(GO:0048488) |
| 0.0 | 2.5 | GO:0032007 | negative regulation of TOR signaling(GO:0032007) |
| 0.0 | 0.4 | GO:0010571 | positive regulation of nuclear cell cycle DNA replication(GO:0010571) |
| 0.0 | 0.4 | GO:0001672 | regulation of chromatin assembly or disassembly(GO:0001672) |
| 0.0 | 0.6 | GO:0097237 | cellular response to toxic substance(GO:0097237) |
| 0.0 | 1.8 | GO:0006783 | heme biosynthetic process(GO:0006783) |
| 0.0 | 1.4 | GO:0061157 | mRNA destabilization(GO:0061157) |
| 0.0 | 0.8 | GO:0022904 | respiratory electron transport chain(GO:0022904) |
| 0.0 | 1.1 | GO:1900037 | regulation of cellular response to hypoxia(GO:1900037) |
| 0.0 | 1.2 | GO:0000042 | protein targeting to Golgi(GO:0000042) |
| 0.0 | 0.6 | GO:1900227 | positive regulation of NLRP3 inflammasome complex assembly(GO:1900227) |
| 0.0 | 0.3 | GO:0070995 | NADPH oxidation(GO:0070995) |
| 0.0 | 2.0 | GO:0045739 | positive regulation of DNA repair(GO:0045739) |
| 0.0 | 0.7 | GO:0007253 | cytoplasmic sequestering of NF-kappaB(GO:0007253) |
| 0.0 | 0.4 | GO:0048672 | positive regulation of collateral sprouting(GO:0048672) |
| 0.0 | 0.5 | GO:0046784 | viral mRNA export from host cell nucleus(GO:0046784) |
| 0.0 | 0.8 | GO:0035435 | phosphate ion transmembrane transport(GO:0035435) |
| 0.0 | 0.7 | GO:0035589 | G-protein coupled purinergic nucleotide receptor signaling pathway(GO:0035589) |
| 0.0 | 1.4 | GO:0048268 | clathrin coat assembly(GO:0048268) |
| 0.0 | 0.4 | GO:1904354 | negative regulation of telomere capping(GO:1904354) |
| 0.0 | 1.4 | GO:0006376 | mRNA splice site selection(GO:0006376) |
| 0.0 | 1.0 | GO:2000052 | positive regulation of non-canonical Wnt signaling pathway(GO:2000052) |
| 0.0 | 0.1 | GO:0006556 | S-adenosylmethionine biosynthetic process(GO:0006556) |
| 0.0 | 4.1 | GO:0006334 | nucleosome assembly(GO:0006334) |
| 0.0 | 4.5 | GO:0035308 | negative regulation of protein dephosphorylation(GO:0035308) |
| 0.0 | 0.3 | GO:1901315 | negative regulation of histone ubiquitination(GO:0033183) histone H2A K63-linked ubiquitination(GO:0070535) negative regulation of protein K63-linked ubiquitination(GO:1900045) regulation of histone H2A K63-linked ubiquitination(GO:1901314) negative regulation of histone H2A K63-linked ubiquitination(GO:1901315) negative regulation of protein polyubiquitination(GO:1902915) |
| 0.0 | 1.0 | GO:0099601 | regulation of neurotransmitter receptor activity(GO:0099601) |
| 0.0 | 0.3 | GO:0097369 | sodium ion import(GO:0097369) sodium ion import across plasma membrane(GO:0098719) sodium ion import into cell(GO:1990118) |
| 0.0 | 0.2 | GO:0035965 | cardiolipin acyl-chain remodeling(GO:0035965) |
| 0.0 | 0.8 | GO:0006750 | glutathione biosynthetic process(GO:0006750) |
| 0.0 | 0.9 | GO:0045947 | negative regulation of translational initiation(GO:0045947) |
| 0.0 | 0.3 | GO:0032020 | ISG15-protein conjugation(GO:0032020) |
| 0.0 | 1.1 | GO:0030252 | growth hormone secretion(GO:0030252) |
| 0.0 | 0.5 | GO:0006099 | tricarboxylic acid cycle(GO:0006099) |
| 0.0 | 0.5 | GO:0030903 | notochord development(GO:0030903) |
| 0.0 | 1.1 | GO:0032728 | positive regulation of interferon-beta production(GO:0032728) |
| 0.0 | 1.0 | GO:0009303 | rRNA transcription(GO:0009303) |
| 0.0 | 0.4 | GO:0036148 | phosphatidylglycerol acyl-chain remodeling(GO:0036148) |
| 0.0 | 0.9 | GO:0016339 | calcium-dependent cell-cell adhesion via plasma membrane cell adhesion molecules(GO:0016339) |
| 0.0 | 0.9 | GO:0022011 | myelination in peripheral nervous system(GO:0022011) peripheral nervous system axon ensheathment(GO:0032292) |
| 0.0 | 1.3 | GO:0032006 | regulation of TOR signaling(GO:0032006) |
| 0.0 | 1.4 | GO:0048168 | regulation of neuronal synaptic plasticity(GO:0048168) |
| 0.0 | 2.0 | GO:0030032 | lamellipodium assembly(GO:0030032) |
| 0.0 | 0.1 | GO:0060382 | release from viral latency(GO:0019046) regulation of DNA strand elongation(GO:0060382) |
| 0.0 | 1.1 | GO:0046326 | positive regulation of glucose import(GO:0046326) |
| 0.0 | 0.5 | GO:0089711 | L-glutamate transmembrane transport(GO:0089711) |
| 0.0 | 0.3 | GO:2001214 | positive regulation of vasculogenesis(GO:2001214) |
| 0.0 | 0.5 | GO:0030208 | dermatan sulfate biosynthetic process(GO:0030208) |
| 0.0 | 0.6 | GO:0043949 | regulation of cAMP-mediated signaling(GO:0043949) |
| 0.0 | 0.3 | GO:1900121 | negative regulation of receptor binding(GO:1900121) |
| 0.0 | 1.4 | GO:0035914 | skeletal muscle cell differentiation(GO:0035914) |
| 0.0 | 3.5 | GO:0071805 | cellular potassium ion transport(GO:0071804) potassium ion transmembrane transport(GO:0071805) |
| 0.0 | 0.3 | GO:2000369 | regulation of clathrin-mediated endocytosis(GO:2000369) |
| 0.0 | 0.1 | GO:2001206 | positive regulation of osteoclast development(GO:2001206) |
| 0.0 | 0.1 | GO:0090500 | endocardial cushion to mesenchymal transition(GO:0090500) |
| 0.0 | 0.7 | GO:0046655 | folic acid metabolic process(GO:0046655) |
| 0.0 | 0.4 | GO:0045161 | neuronal ion channel clustering(GO:0045161) |
| 0.0 | 1.1 | GO:0048384 | retinoic acid receptor signaling pathway(GO:0048384) |
| 0.0 | 0.1 | GO:2000297 | negative regulation of synapse maturation(GO:2000297) |
| 0.0 | 0.3 | GO:0072583 | clathrin-mediated endocytosis(GO:0072583) |
| 0.0 | 1.1 | GO:0006937 | regulation of muscle contraction(GO:0006937) |
| 0.0 | 0.9 | GO:0035249 | synaptic transmission, glutamatergic(GO:0035249) |
| 0.0 | 0.2 | GO:0014052 | regulation of gamma-aminobutyric acid secretion(GO:0014052) |
| 0.0 | 0.5 | GO:0007194 | negative regulation of adenylate cyclase activity(GO:0007194) |
| 0.0 | 0.2 | GO:0015889 | cobalamin transport(GO:0015889) |
| 0.0 | 0.4 | GO:1901685 | glutathione derivative metabolic process(GO:1901685) glutathione derivative biosynthetic process(GO:1901687) |
| 0.0 | 0.2 | GO:0001696 | gastric acid secretion(GO:0001696) |
| 0.0 | 0.6 | GO:0014047 | glutamate secretion(GO:0014047) |
| 0.0 | 0.1 | GO:1902037 | negative regulation of hematopoietic stem cell differentiation(GO:1902037) |
| 0.0 | 0.2 | GO:1903392 | negative regulation of focal adhesion assembly(GO:0051895) negative regulation of adherens junction organization(GO:1903392) |
| 0.0 | 0.0 | GO:2000646 | negative regulation of PERK-mediated unfolded protein response(GO:1903898) positive regulation of receptor catabolic process(GO:2000646) |
| 0.0 | 0.5 | GO:0002209 | behavioral fear response(GO:0001662) behavioral defense response(GO:0002209) |
| 0.0 | 0.1 | GO:1900245 | positive regulation of MDA-5 signaling pathway(GO:1900245) |
Gene overrepresentation in cellular component category:
| Log-likelihood per target | Total log-likelihood | Term | Description |
|---|---|---|---|
| 1.8 | 11.0 | GO:0005927 | muscle tendon junction(GO:0005927) |
| 1.7 | 8.6 | GO:0045272 | plasma membrane respiratory chain complex I(GO:0045272) |
| 1.3 | 18.2 | GO:0005853 | eukaryotic translation elongation factor 1 complex(GO:0005853) |
| 0.9 | 5.4 | GO:1990584 | cardiac Troponin complex(GO:1990584) |
| 0.9 | 7.8 | GO:0044326 | dendritic spine neck(GO:0044326) |
| 0.8 | 11.7 | GO:0033018 | sarcoplasmic reticulum lumen(GO:0033018) |
| 0.8 | 0.8 | GO:0070470 | plasma membrane respiratory chain(GO:0070470) |
| 0.8 | 6.5 | GO:0030314 | junctional membrane complex(GO:0030314) |
| 0.7 | 2.8 | GO:0005745 | m-AAA complex(GO:0005745) |
| 0.7 | 24.1 | GO:0031143 | pseudopodium(GO:0031143) |
| 0.7 | 15.6 | GO:0005890 | sodium:potassium-exchanging ATPase complex(GO:0005890) |
| 0.6 | 1.9 | GO:1990844 | subsarcolemmal mitochondrion(GO:1990843) interfibrillar mitochondrion(GO:1990844) |
| 0.6 | 8.9 | GO:0045275 | mitochondrial respiratory chain complex III(GO:0005750) respiratory chain complex III(GO:0045275) |
| 0.5 | 1.5 | GO:1990622 | CHOP-ATF3 complex(GO:1990622) |
| 0.5 | 2.3 | GO:0014701 | junctional sarcoplasmic reticulum membrane(GO:0014701) |
| 0.4 | 2.2 | GO:0005899 | insulin receptor complex(GO:0005899) |
| 0.4 | 2.6 | GO:0070032 | synaptobrevin 2-SNAP-25-syntaxin-1a-complexin I complex(GO:0070032) |
| 0.4 | 6.3 | GO:0005862 | muscle thin filament tropomyosin(GO:0005862) |
| 0.4 | 1.4 | GO:0030956 | glutamyl-tRNA(Gln) amidotransferase complex(GO:0030956) |
| 0.3 | 1.8 | GO:0005967 | mitochondrial pyruvate dehydrogenase complex(GO:0005967) |
| 0.3 | 2.0 | GO:0061617 | MICOS complex(GO:0061617) |
| 0.3 | 3.9 | GO:0005751 | mitochondrial respiratory chain complex IV(GO:0005751) |
| 0.3 | 7.7 | GO:0005865 | striated muscle thin filament(GO:0005865) |
| 0.3 | 1.3 | GO:0001405 | presequence translocase-associated import motor(GO:0001405) |
| 0.3 | 0.8 | GO:0098844 | postsynaptic endocytic zone membrane(GO:0098844) |
| 0.2 | 4.0 | GO:0016013 | syntrophin complex(GO:0016013) |
| 0.2 | 0.9 | GO:0097598 | sperm cytoplasmic droplet(GO:0097598) |
| 0.2 | 2.2 | GO:0061574 | ASAP complex(GO:0061574) |
| 0.2 | 1.3 | GO:0043291 | RAVE complex(GO:0043291) |
| 0.2 | 1.5 | GO:0097513 | myosin II filament(GO:0097513) |
| 0.2 | 4.8 | GO:0005832 | chaperonin-containing T-complex(GO:0005832) |
| 0.2 | 1.2 | GO:0070069 | cytochrome complex(GO:0070069) |
| 0.2 | 11.6 | GO:0030964 | mitochondrial respiratory chain complex I(GO:0005747) NADH dehydrogenase complex(GO:0030964) respiratory chain complex I(GO:0045271) |
| 0.2 | 1.0 | GO:0036398 | TCR signalosome(GO:0036398) |
| 0.2 | 3.3 | GO:0000815 | ESCRT III complex(GO:0000815) |
| 0.2 | 2.0 | GO:0070552 | BRISC complex(GO:0070552) |
| 0.1 | 1.7 | GO:1990316 | ATG1/ULK1 kinase complex(GO:1990316) |
| 0.1 | 0.4 | GO:0018444 | translation release factor complex(GO:0018444) |
| 0.1 | 3.1 | GO:0008091 | spectrin(GO:0008091) |
| 0.1 | 2.6 | GO:0097451 | glial limiting end-foot(GO:0097451) |
| 0.1 | 0.9 | GO:0045254 | pyruvate dehydrogenase complex(GO:0045254) |
| 0.1 | 2.7 | GO:0070469 | respiratory chain(GO:0070469) |
| 0.1 | 14.1 | GO:0016529 | sarcoplasmic reticulum(GO:0016529) |
| 0.1 | 0.5 | GO:0098855 | HCN channel complex(GO:0098855) |
| 0.1 | 3.1 | GO:0017146 | NMDA selective glutamate receptor complex(GO:0017146) |
| 0.1 | 0.8 | GO:0044308 | axonal spine(GO:0044308) |
| 0.1 | 1.6 | GO:0097512 | cardiac myofibril(GO:0097512) |
| 0.1 | 1.1 | GO:1990578 | perinuclear endoplasmic reticulum membrane(GO:1990578) |
| 0.1 | 1.1 | GO:1990130 | Iml1 complex(GO:1990130) |
| 0.1 | 2.0 | GO:0031931 | TORC1 complex(GO:0031931) |
| 0.1 | 2.1 | GO:0035253 | ciliary rootlet(GO:0035253) |
| 0.1 | 4.4 | GO:0005640 | nuclear outer membrane(GO:0005640) |
| 0.1 | 4.6 | GO:1902711 | GABA-A receptor complex(GO:1902711) |
| 0.1 | 1.5 | GO:0070937 | CRD-mediated mRNA stability complex(GO:0070937) |
| 0.1 | 1.1 | GO:0097442 | CA3 pyramidal cell dendrite(GO:0097442) |
| 0.1 | 0.4 | GO:0000333 | telomerase catalytic core complex(GO:0000333) |
| 0.1 | 1.4 | GO:0005828 | kinetochore microtubule(GO:0005828) |
| 0.1 | 0.5 | GO:0038039 | G-protein coupled receptor heterodimeric complex(GO:0038039) |
| 0.1 | 0.8 | GO:0097452 | GAIT complex(GO:0097452) |
| 0.1 | 0.3 | GO:0002947 | tumor necrosis factor receptor superfamily complex(GO:0002947) |
| 0.1 | 2.3 | GO:0031305 | intrinsic component of mitochondrial inner membrane(GO:0031304) integral component of mitochondrial inner membrane(GO:0031305) |
| 0.1 | 1.2 | GO:0098839 | postsynaptic density membrane(GO:0098839) |
| 0.1 | 2.4 | GO:0005665 | DNA-directed RNA polymerase II, core complex(GO:0005665) |
| 0.1 | 2.2 | GO:0045009 | melanosome membrane(GO:0033162) chitosome(GO:0045009) |
| 0.1 | 0.4 | GO:0097058 | CRLF-CLCF1 complex(GO:0097058) |
| 0.1 | 0.6 | GO:1990393 | 3M complex(GO:1990393) |
| 0.1 | 4.7 | GO:0008305 | integrin complex(GO:0008305) |
| 0.1 | 8.7 | GO:0005811 | lipid particle(GO:0005811) |
| 0.1 | 0.5 | GO:0005851 | eukaryotic translation initiation factor 2B complex(GO:0005851) |
| 0.1 | 1.4 | GO:0016528 | sarcoplasm(GO:0016528) |
| 0.1 | 0.1 | GO:0030981 | cortical microtubule cytoskeleton(GO:0030981) |
| 0.1 | 0.6 | GO:0097449 | astrocyte projection(GO:0097449) |
| 0.1 | 5.0 | GO:0043198 | dendritic shaft(GO:0043198) |
| 0.1 | 0.3 | GO:1990131 | Gtr1-Gtr2 GTPase complex(GO:1990131) |
| 0.1 | 2.7 | GO:0044298 | neuronal cell body membrane(GO:0032809) cell body membrane(GO:0044298) |
| 0.1 | 0.5 | GO:0031314 | extrinsic component of mitochondrial inner membrane(GO:0031314) |
| 0.1 | 1.5 | GO:0032585 | multivesicular body membrane(GO:0032585) |
| 0.1 | 3.4 | GO:0008180 | COP9 signalosome(GO:0008180) |
| 0.1 | 0.2 | GO:0031232 | extrinsic component of external side of plasma membrane(GO:0031232) |
| 0.1 | 0.5 | GO:0072669 | tRNA-splicing ligase complex(GO:0072669) |
| 0.1 | 1.1 | GO:0097025 | MPP7-DLG1-LIN7 complex(GO:0097025) |
| 0.1 | 4.7 | GO:0031672 | A band(GO:0031672) |
| 0.1 | 2.0 | GO:0042629 | mast cell granule(GO:0042629) |
| 0.0 | 1.2 | GO:0005686 | U2 snRNP(GO:0005686) |
| 0.0 | 0.6 | GO:0071144 | SMAD2-SMAD3 protein complex(GO:0071144) |
| 0.0 | 11.9 | GO:0030017 | sarcomere(GO:0030017) |
| 0.0 | 1.8 | GO:0030137 | COPI-coated vesicle(GO:0030137) |
| 0.0 | 0.9 | GO:0016281 | eukaryotic translation initiation factor 4F complex(GO:0016281) |
| 0.0 | 0.3 | GO:1990031 | pinceau fiber(GO:1990031) |
| 0.0 | 0.2 | GO:0071001 | U4/U6 snRNP(GO:0071001) |
| 0.0 | 0.9 | GO:0032045 | guanyl-nucleotide exchange factor complex(GO:0032045) |
| 0.0 | 0.5 | GO:0042584 | chromaffin granule membrane(GO:0042584) |
| 0.0 | 0.3 | GO:0033263 | CORVET complex(GO:0033263) |
| 0.0 | 0.1 | GO:0048269 | methionine adenosyltransferase complex(GO:0048269) |
| 0.0 | 0.8 | GO:0005845 | mRNA cap binding complex(GO:0005845) |
| 0.0 | 0.4 | GO:0044233 | ER-mitochondrion membrane contact site(GO:0044233) |
| 0.0 | 11.9 | GO:0030427 | site of polarized growth(GO:0030427) |
| 0.0 | 0.2 | GO:0036396 | MIS complex(GO:0036396) mRNA editing complex(GO:0045293) |
| 0.0 | 0.8 | GO:0097427 | microtubule bundle(GO:0097427) |
| 0.0 | 0.5 | GO:0000445 | THO complex(GO:0000347) THO complex part of transcription export complex(GO:0000445) |
| 0.0 | 2.2 | GO:0042645 | nucleoid(GO:0009295) mitochondrial nucleoid(GO:0042645) |
| 0.0 | 0.6 | GO:0031254 | uropod(GO:0001931) cell trailing edge(GO:0031254) |
| 0.0 | 1.0 | GO:0016327 | apicolateral plasma membrane(GO:0016327) |
| 0.0 | 0.9 | GO:0001527 | microfibril(GO:0001527) fibril(GO:0043205) |
| 0.0 | 4.1 | GO:0072686 | mitotic spindle(GO:0072686) |
| 0.0 | 0.3 | GO:0016589 | NURF complex(GO:0016589) |
| 0.0 | 0.6 | GO:0034045 | pre-autophagosomal structure membrane(GO:0034045) |
| 0.0 | 10.7 | GO:0005802 | trans-Golgi network(GO:0005802) |
| 0.0 | 1.2 | GO:0005614 | interstitial matrix(GO:0005614) |
| 0.0 | 0.3 | GO:0097470 | ribbon synapse(GO:0097470) |
| 0.0 | 5.7 | GO:0016605 | PML body(GO:0016605) |
| 0.0 | 3.3 | GO:0031463 | Cul3-RING ubiquitin ligase complex(GO:0031463) |
| 0.0 | 0.6 | GO:0043194 | axon initial segment(GO:0043194) |
| 0.0 | 30.7 | GO:0048471 | perinuclear region of cytoplasm(GO:0048471) |
| 0.0 | 0.8 | GO:0071782 | endoplasmic reticulum tubular network(GO:0071782) endoplasmic reticulum subcompartment(GO:0098827) |
| 0.0 | 0.1 | GO:0044307 | dendritic branch(GO:0044307) |
| 0.0 | 0.6 | GO:0032839 | dendrite cytoplasm(GO:0032839) |
| 0.0 | 0.7 | GO:0031011 | Ino80 complex(GO:0031011) DNA helicase complex(GO:0033202) |
| 0.0 | 1.2 | GO:0071565 | nBAF complex(GO:0071565) |
| 0.0 | 3.5 | GO:0008076 | voltage-gated potassium channel complex(GO:0008076) |
| 0.0 | 0.7 | GO:0030867 | rough endoplasmic reticulum membrane(GO:0030867) |
| 0.0 | 0.3 | GO:0070652 | HAUS complex(GO:0070652) |
| 0.0 | 2.8 | GO:0043197 | dendritic spine(GO:0043197) neuron spine(GO:0044309) |
| 0.0 | 3.7 | GO:0031901 | early endosome membrane(GO:0031901) |
| 0.0 | 0.7 | GO:0005790 | smooth endoplasmic reticulum(GO:0005790) |
| 0.0 | 0.6 | GO:0036038 | MKS complex(GO:0036038) |
| 0.0 | 0.3 | GO:0098799 | outer mitochondrial membrane protein complex(GO:0098799) |
| 0.0 | 4.1 | GO:0008021 | synaptic vesicle(GO:0008021) |
| 0.0 | 0.5 | GO:0031588 | nucleotide-activated protein kinase complex(GO:0031588) |
| 0.0 | 7.5 | GO:0030425 | dendrite(GO:0030425) |
| 0.0 | 2.0 | GO:0005637 | nuclear inner membrane(GO:0005637) |
| 0.0 | 0.2 | GO:0071986 | Ragulator complex(GO:0071986) |
| 0.0 | 0.5 | GO:0035145 | exon-exon junction complex(GO:0035145) |
| 0.0 | 4.7 | GO:0045211 | postsynaptic membrane(GO:0045211) |
| 0.0 | 0.3 | GO:0005666 | DNA-directed RNA polymerase III complex(GO:0005666) |
| 0.0 | 0.9 | GO:0005834 | heterotrimeric G-protein complex(GO:0005834) |
| 0.0 | 0.3 | GO:0005583 | fibrillar collagen trimer(GO:0005583) banded collagen fibril(GO:0098643) |
| 0.0 | 0.3 | GO:0005671 | Ada2/Gcn5/Ada3 transcription activator complex(GO:0005671) |
| 0.0 | 3.0 | GO:0032993 | protein-DNA complex(GO:0032993) |
| 0.0 | 14.9 | GO:0044429 | mitochondrial part(GO:0044429) |
Gene overrepresentation in molecular function category:
| Log-likelihood per target | Total log-likelihood | Term | Description |
|---|---|---|---|
| 3.4 | 20.3 | GO:0010861 | thyroid hormone receptor activator activity(GO:0010861) thyroid hormone receptor coactivator activity(GO:0030375) |
| 1.0 | 3.0 | GO:1990175 | EH domain binding(GO:1990175) |
| 0.8 | 17.6 | GO:0005391 | sodium:potassium-exchanging ATPase activity(GO:0005391) |
| 0.8 | 4.0 | GO:0004775 | succinate-CoA ligase (ADP-forming) activity(GO:0004775) |
| 0.8 | 6.3 | GO:0004111 | creatine kinase activity(GO:0004111) |
| 0.8 | 5.4 | GO:0004471 | malate dehydrogenase (decarboxylating) (NAD+) activity(GO:0004471) malate dehydrogenase (decarboxylating) (NADP+) activity(GO:0004473) |
| 0.8 | 3.8 | GO:0052836 | inositol 5-diphosphate pentakisphosphate 5-kinase activity(GO:0052836) inositol diphosphate tetrakisphosphate kinase activity(GO:0052839) |
| 0.7 | 4.5 | GO:0031708 | endothelin B receptor binding(GO:0031708) |
| 0.6 | 3.9 | GO:0030172 | troponin C binding(GO:0030172) |
| 0.6 | 2.6 | GO:0032427 | GBD domain binding(GO:0032427) |
| 0.6 | 1.8 | GO:0004174 | electron-transferring-flavoprotein dehydrogenase activity(GO:0004174) oxidoreductase activity, acting on the CH-NH group of donors, quinone or similar compound as acceptor(GO:0016649) |
| 0.6 | 2.3 | GO:0016716 | oxidoreductase activity, acting on paired donors, with incorporation or reduction of molecular oxygen, another compound as one donor, and incorporation of one atom of oxygen(GO:0016716) |
| 0.5 | 4.7 | GO:0016681 | ubiquinol-cytochrome-c reductase activity(GO:0008121) oxidoreductase activity, acting on diphenols and related substances as donors, cytochrome as acceptor(GO:0016681) |
| 0.5 | 3.1 | GO:0004741 | [pyruvate dehydrogenase (lipoamide)] phosphatase activity(GO:0004741) |
| 0.5 | 18.2 | GO:0003746 | translation elongation factor activity(GO:0003746) |
| 0.5 | 1.0 | GO:0031177 | phosphopantetheine binding(GO:0031177) |
| 0.5 | 1.8 | GO:0016418 | S-acetyltransferase activity(GO:0016418) |
| 0.4 | 1.7 | GO:0051538 | 3 iron, 4 sulfur cluster binding(GO:0051538) |
| 0.4 | 1.6 | GO:0004449 | isocitrate dehydrogenase (NAD+) activity(GO:0004449) |
| 0.4 | 1.6 | GO:0030379 | neurotensin receptor activity, non-G-protein coupled(GO:0030379) |
| 0.4 | 1.2 | GO:0033749 | histone demethylase activity (H3-R2 specific)(GO:0033746) histone demethylase activity (H4-R3 specific)(GO:0033749) |
| 0.4 | 5.4 | GO:0004445 | inositol-polyphosphate 5-phosphatase activity(GO:0004445) |
| 0.4 | 1.1 | GO:0003955 | NAD(P)H dehydrogenase (quinone) activity(GO:0003955) |
| 0.4 | 1.8 | GO:0072590 | N-acetyl-L-aspartate-L-glutamate ligase activity(GO:0072590) |
| 0.4 | 1.4 | GO:0050567 | glutaminyl-tRNA synthase (glutamine-hydrolyzing) activity(GO:0050567) |
| 0.4 | 22.2 | GO:0050136 | NADH dehydrogenase (ubiquinone) activity(GO:0008137) NADH dehydrogenase (quinone) activity(GO:0050136) |
| 0.3 | 1.0 | GO:0052816 | medium-chain acyl-CoA hydrolase activity(GO:0052815) long-chain acyl-CoA hydrolase activity(GO:0052816) |
| 0.3 | 1.7 | GO:0001884 | pyrimidine nucleoside binding(GO:0001884) UTP binding(GO:0002134) pyrimidine ribonucleoside binding(GO:0032551) |
| 0.3 | 6.5 | GO:0010314 | phosphatidylinositol-5-phosphate binding(GO:0010314) |
| 0.3 | 1.6 | GO:0008267 | poly-glutamine tract binding(GO:0008267) |
| 0.3 | 0.9 | GO:0050613 | delta14-sterol reductase activity(GO:0050613) |
| 0.3 | 2.1 | GO:0003989 | acetyl-CoA carboxylase activity(GO:0003989) |
| 0.3 | 1.8 | GO:0048101 | calcium- and calmodulin-regulated 3',5'-cyclic-GMP phosphodiesterase activity(GO:0048101) |
| 0.3 | 0.9 | GO:0016652 | NAD(P)+ transhydrogenase activity(GO:0008746) oxidoreductase activity, acting on NAD(P)H, NAD(P) as acceptor(GO:0016652) |
| 0.3 | 2.3 | GO:1904288 | BAT3 complex binding(GO:1904288) |
| 0.3 | 0.8 | GO:0035605 | peptidyl-cysteine S-nitrosylase activity(GO:0035605) |
| 0.3 | 2.4 | GO:0099529 | neurotransmitter receptor activity involved in regulation of postsynaptic membrane potential(GO:0099529) transmitter-gated ion channel activity involved in regulation of postsynaptic membrane potential(GO:1904315) |
| 0.3 | 1.6 | GO:0031013 | troponin I binding(GO:0031013) |
| 0.3 | 1.8 | GO:0015254 | glycerol channel activity(GO:0015254) |
| 0.3 | 0.8 | GO:0031798 | type 1 metabotropic glutamate receptor binding(GO:0031798) |
| 0.3 | 2.5 | GO:0050682 | AF-2 domain binding(GO:0050682) |
| 0.3 | 0.3 | GO:0047025 | 3-oxoacyl-[acyl-carrier-protein] reductase (NADH) activity(GO:0047025) |
| 0.2 | 1.0 | GO:0042134 | rRNA primary transcript binding(GO:0042134) |
| 0.2 | 0.9 | GO:0004487 | methylenetetrahydrofolate dehydrogenase (NAD+) activity(GO:0004487) |
| 0.2 | 1.5 | GO:0004800 | thyroxine 5'-deiodinase activity(GO:0004800) |
| 0.2 | 0.8 | GO:0000309 | nicotinamide-nucleotide adenylyltransferase activity(GO:0000309) |
| 0.2 | 1.2 | GO:0005298 | proline:sodium symporter activity(GO:0005298) |
| 0.2 | 6.5 | GO:0044548 | S100 protein binding(GO:0044548) |
| 0.2 | 10.0 | GO:0008157 | protein phosphatase 1 binding(GO:0008157) |
| 0.2 | 1.0 | GO:0050220 | prostaglandin-E synthase activity(GO:0050220) |
| 0.2 | 0.7 | GO:0008665 | 2'-phosphotransferase activity(GO:0008665) |
| 0.2 | 1.3 | GO:0004013 | adenosylhomocysteinase activity(GO:0004013) trialkylsulfonium hydrolase activity(GO:0016802) |
| 0.2 | 6.5 | GO:0002162 | dystroglycan binding(GO:0002162) |
| 0.2 | 5.2 | GO:0008510 | sodium:bicarbonate symporter activity(GO:0008510) |
| 0.2 | 1.0 | GO:0008241 | peptidyl-dipeptidase activity(GO:0008241) |
| 0.2 | 0.6 | GO:0052810 | 1-phosphatidylinositol-5-kinase activity(GO:0052810) |
| 0.2 | 1.7 | GO:0015288 | porin activity(GO:0015288) |
| 0.2 | 1.4 | GO:0000213 | tRNA-intron endonuclease activity(GO:0000213) |
| 0.1 | 5.0 | GO:0004129 | cytochrome-c oxidase activity(GO:0004129) heme-copper terminal oxidase activity(GO:0015002) oxidoreductase activity, acting on a heme group of donors, oxygen as acceptor(GO:0016676) |
| 0.1 | 2.0 | GO:0000268 | peroxisome targeting sequence binding(GO:0000268) |
| 0.1 | 1.1 | GO:0044020 | protein-arginine omega-N symmetric methyltransferase activity(GO:0035243) histone methyltransferase activity (H4-R3 specific)(GO:0044020) |
| 0.1 | 1.8 | GO:0016909 | JUN kinase activity(GO:0004705) SAP kinase activity(GO:0016909) |
| 0.1 | 2.3 | GO:0004723 | calcium-dependent protein serine/threonine phosphatase activity(GO:0004723) |
| 0.1 | 0.9 | GO:0004738 | pyruvate dehydrogenase activity(GO:0004738) pyruvate dehydrogenase [NAD(P)+] activity(GO:0034603) pyruvate dehydrogenase (NAD+) activity(GO:0034604) |
| 0.1 | 0.7 | GO:0005111 | type 2 fibroblast growth factor receptor binding(GO:0005111) |
| 0.1 | 0.4 | GO:0036326 | VEGF-A-activated receptor activity(GO:0036326) VEGF-B-activated receptor activity(GO:0036327) placental growth factor-activated receptor activity(GO:0036332) |
| 0.1 | 2.4 | GO:0008503 | benzodiazepine receptor activity(GO:0008503) |
| 0.1 | 0.8 | GO:0004597 | peptide-aspartate beta-dioxygenase activity(GO:0004597) |
| 0.1 | 1.2 | GO:0003876 | AMP deaminase activity(GO:0003876) adenosine-phosphate deaminase activity(GO:0047623) |
| 0.1 | 1.2 | GO:0031014 | troponin T binding(GO:0031014) |
| 0.1 | 8.9 | GO:0043531 | ADP binding(GO:0043531) |
| 0.1 | 0.6 | GO:0004572 | mannosyl-oligosaccharide 1,3-1,6-alpha-mannosidase activity(GO:0004572) |
| 0.1 | 1.2 | GO:0031811 | G-protein coupled nucleotide receptor binding(GO:0031811) P2Y1 nucleotide receptor binding(GO:0031812) |
| 0.1 | 2.0 | GO:0019531 | oxalate transmembrane transporter activity(GO:0019531) |
| 0.1 | 2.1 | GO:0005078 | MAP-kinase scaffold activity(GO:0005078) |
| 0.1 | 0.5 | GO:0035939 | microsatellite binding(GO:0035939) |
| 0.1 | 3.5 | GO:1990381 | ubiquitin-specific protease binding(GO:1990381) |
| 0.1 | 9.4 | GO:0016627 | oxidoreductase activity, acting on the CH-CH group of donors(GO:0016627) |
| 0.1 | 1.0 | GO:0008379 | thioredoxin peroxidase activity(GO:0008379) |
| 0.1 | 0.8 | GO:0004095 | carnitine O-palmitoyltransferase activity(GO:0004095) |
| 0.1 | 1.5 | GO:1990247 | N6-methyladenosine-containing RNA binding(GO:1990247) |
| 0.1 | 2.6 | GO:0015467 | G-protein activated inward rectifier potassium channel activity(GO:0015467) |
| 0.1 | 1.8 | GO:0070324 | thyroid hormone binding(GO:0070324) |
| 0.1 | 4.5 | GO:0030506 | ankyrin binding(GO:0030506) |
| 0.1 | 0.3 | GO:0004980 | melanocyte-stimulating hormone receptor activity(GO:0004980) |
| 0.1 | 2.3 | GO:0008179 | adenylate cyclase binding(GO:0008179) |
| 0.1 | 4.7 | GO:0005086 | ARF guanyl-nucleotide exchange factor activity(GO:0005086) |
| 0.1 | 0.5 | GO:0032557 | UTP:glucose-1-phosphate uridylyltransferase activity(GO:0003983) pyrimidine ribonucleotide binding(GO:0032557) UTP-monosaccharide-1-phosphate uridylyltransferase activity(GO:0051748) |
| 0.1 | 10.1 | GO:0008307 | structural constituent of muscle(GO:0008307) |
| 0.1 | 0.8 | GO:0004727 | prenylated protein tyrosine phosphatase activity(GO:0004727) |
| 0.1 | 0.7 | GO:0045029 | UDP-activated nucleotide receptor activity(GO:0045029) |
| 0.1 | 0.4 | GO:0005006 | epidermal growth factor-activated receptor activity(GO:0005006) |
| 0.1 | 1.5 | GO:0030898 | actin-dependent ATPase activity(GO:0030898) |
| 0.1 | 2.8 | GO:0005251 | delayed rectifier potassium channel activity(GO:0005251) |
| 0.1 | 0.8 | GO:0016812 | hydrolase activity, acting on carbon-nitrogen (but not peptide) bonds, in cyclic amides(GO:0016812) |
| 0.1 | 0.6 | GO:0031962 | mineralocorticoid receptor binding(GO:0031962) |
| 0.1 | 1.4 | GO:0032051 | clathrin light chain binding(GO:0032051) |
| 0.1 | 0.7 | GO:0005127 | ciliary neurotrophic factor receptor binding(GO:0005127) |
| 0.1 | 1.1 | GO:0046935 | 1-phosphatidylinositol-3-kinase regulator activity(GO:0046935) |
| 0.1 | 3.7 | GO:0004435 | phosphatidylinositol phospholipase C activity(GO:0004435) |
| 0.1 | 0.5 | GO:0004965 | G-protein coupled GABA receptor activity(GO:0004965) |
| 0.1 | 3.0 | GO:0005521 | lamin binding(GO:0005521) |
| 0.1 | 0.2 | GO:0010698 | acetyltransferase activator activity(GO:0010698) |
| 0.1 | 1.1 | GO:0097371 | MDM2/MDM4 family protein binding(GO:0097371) |
| 0.1 | 0.6 | GO:0004468 | lysine N-acetyltransferase activity, acting on acetyl phosphate as donor(GO:0004468) |
| 0.1 | 0.7 | GO:0004839 | ubiquitin activating enzyme activity(GO:0004839) |
| 0.1 | 2.9 | GO:0004550 | nucleoside diphosphate kinase activity(GO:0004550) |
| 0.1 | 0.3 | GO:0070095 | fructose-6-phosphate binding(GO:0070095) |
| 0.1 | 1.0 | GO:0015217 | ATP transmembrane transporter activity(GO:0005347) ADP transmembrane transporter activity(GO:0015217) |
| 0.1 | 1.1 | GO:0030548 | acetylcholine receptor regulator activity(GO:0030548) neurotransmitter receptor regulator activity(GO:0099602) |
| 0.1 | 3.0 | GO:0015269 | calcium-activated potassium channel activity(GO:0015269) |
| 0.1 | 1.7 | GO:0051537 | 2 iron, 2 sulfur cluster binding(GO:0051537) |
| 0.1 | 0.3 | GO:0017095 | heparan sulfate 6-O-sulfotransferase activity(GO:0017095) |
| 0.1 | 0.5 | GO:0005222 | intracellular cAMP activated cation channel activity(GO:0005222) |
| 0.1 | 1.4 | GO:0001222 | transcription corepressor binding(GO:0001222) |
| 0.1 | 2.1 | GO:0008190 | eukaryotic initiation factor 4E binding(GO:0008190) |
| 0.1 | 0.8 | GO:0047498 | calcium-dependent phospholipase A2 activity(GO:0047498) |
| 0.1 | 0.9 | GO:0005132 | type I interferon receptor binding(GO:0005132) |
| 0.1 | 1.3 | GO:0043225 | anion transmembrane-transporting ATPase activity(GO:0043225) |
| 0.1 | 0.6 | GO:0033743 | peptide-methionine (R)-S-oxide reductase activity(GO:0033743) |
| 0.1 | 1.3 | GO:0005337 | nucleoside transmembrane transporter activity(GO:0005337) |
| 0.1 | 1.1 | GO:0097016 | L27 domain binding(GO:0097016) |
| 0.1 | 0.5 | GO:0015450 | P-P-bond-hydrolysis-driven protein transmembrane transporter activity(GO:0015450) |
| 0.1 | 0.6 | GO:0005237 | inhibitory extracellular ligand-gated ion channel activity(GO:0005237) |
| 0.1 | 0.6 | GO:0015271 | outward rectifier potassium channel activity(GO:0015271) |
| 0.1 | 4.3 | GO:0019894 | kinesin binding(GO:0019894) |
| 0.1 | 0.5 | GO:0048495 | Roundabout binding(GO:0048495) |
| 0.1 | 1.6 | GO:0015459 | potassium channel regulator activity(GO:0015459) |
| 0.1 | 0.6 | GO:1904929 | coreceptor activity involved in Wnt signaling pathway, planar cell polarity pathway(GO:1904929) |
| 0.1 | 1.6 | GO:0015114 | phosphate ion transmembrane transporter activity(GO:0015114) |
| 0.1 | 0.4 | GO:0008079 | translation release factor activity(GO:0003747) translation termination factor activity(GO:0008079) |
| 0.1 | 0.7 | GO:0030274 | LIM domain binding(GO:0030274) |
| 0.1 | 2.6 | GO:0017075 | syntaxin-1 binding(GO:0017075) |
| 0.1 | 3.3 | GO:0005158 | insulin receptor binding(GO:0005158) |
| 0.0 | 0.4 | GO:0016015 | morphogen activity(GO:0016015) |
| 0.0 | 0.9 | GO:0031821 | G-protein coupled serotonin receptor binding(GO:0031821) |
| 0.0 | 2.3 | GO:0044183 | protein binding involved in protein folding(GO:0044183) |
| 0.0 | 2.0 | GO:0032266 | phosphatidylinositol-3-phosphate binding(GO:0032266) |
| 0.0 | 0.5 | GO:0042835 | BRE binding(GO:0042835) |
| 0.0 | 0.2 | GO:0004556 | alpha-amylase activity(GO:0004556) |
| 0.0 | 1.5 | GO:0005112 | Notch binding(GO:0005112) |
| 0.0 | 1.3 | GO:0008242 | omega peptidase activity(GO:0008242) |
| 0.0 | 0.4 | GO:0005332 | gamma-aminobutyric acid:sodium symporter activity(GO:0005332) |
| 0.0 | 0.2 | GO:0071885 | N-terminal protein N-methyltransferase activity(GO:0071885) |
| 0.0 | 0.5 | GO:0043533 | inositol 1,3,4,5 tetrakisphosphate binding(GO:0043533) |
| 0.0 | 0.4 | GO:0086008 | voltage-gated potassium channel activity involved in cardiac muscle cell action potential repolarization(GO:0086008) |
| 0.0 | 1.9 | GO:0071855 | neuropeptide receptor binding(GO:0071855) |
| 0.0 | 2.0 | GO:0043014 | alpha-tubulin binding(GO:0043014) |
| 0.0 | 0.4 | GO:0008449 | N-acetylglucosamine-6-sulfatase activity(GO:0008449) |
| 0.0 | 0.5 | GO:0052832 | inositol monophosphate 1-phosphatase activity(GO:0008934) inositol monophosphate 3-phosphatase activity(GO:0052832) inositol monophosphate 4-phosphatase activity(GO:0052833) inositol monophosphate phosphatase activity(GO:0052834) |
| 0.0 | 1.7 | GO:0048487 | beta-tubulin binding(GO:0048487) |
| 0.0 | 0.2 | GO:0001588 | dopamine neurotransmitter receptor activity, coupled via Gs(GO:0001588) |
| 0.0 | 3.0 | GO:0001102 | RNA polymerase II activating transcription factor binding(GO:0001102) |
| 0.0 | 1.2 | GO:0042043 | neurexin family protein binding(GO:0042043) |
| 0.0 | 2.2 | GO:0030332 | cyclin binding(GO:0030332) |
| 0.0 | 7.1 | GO:0004222 | metalloendopeptidase activity(GO:0004222) |
| 0.0 | 1.3 | GO:0008656 | cysteine-type endopeptidase activator activity involved in apoptotic process(GO:0008656) |
| 0.0 | 1.0 | GO:0017128 | phospholipid scramblase activity(GO:0017128) |
| 0.0 | 1.2 | GO:0005545 | 1-phosphatidylinositol binding(GO:0005545) |
| 0.0 | 3.4 | GO:0016651 | oxidoreductase activity, acting on NAD(P)H(GO:0016651) |
| 0.0 | 3.0 | GO:0017080 | sodium channel regulator activity(GO:0017080) |
| 0.0 | 0.3 | GO:0016618 | hydroxypyruvate reductase activity(GO:0016618) glyoxylate reductase (NADP) activity(GO:0030267) |
| 0.0 | 0.4 | GO:0019870 | potassium channel inhibitor activity(GO:0019870) |
| 0.0 | 1.1 | GO:0048018 | receptor agonist activity(GO:0048018) |
| 0.0 | 0.5 | GO:0042809 | vitamin D receptor binding(GO:0042809) |
| 0.0 | 0.3 | GO:0042296 | ISG15 transferase activity(GO:0042296) |
| 0.0 | 0.4 | GO:0030976 | thiamine pyrophosphate binding(GO:0030976) |
| 0.0 | 12.3 | GO:0008022 | protein C-terminus binding(GO:0008022) |
| 0.0 | 1.0 | GO:0016881 | acid-amino acid ligase activity(GO:0016881) |
| 0.0 | 0.8 | GO:0008200 | ion channel inhibitor activity(GO:0008200) |
| 0.0 | 0.8 | GO:0030507 | spectrin binding(GO:0030507) |
| 0.0 | 0.6 | GO:0033038 | bitter taste receptor activity(GO:0033038) |
| 0.0 | 18.8 | GO:0004842 | ubiquitin-protein transferase activity(GO:0004842) |
| 0.0 | 0.3 | GO:0005068 | transmembrane receptor protein tyrosine kinase adaptor activity(GO:0005068) |
| 0.0 | 1.9 | GO:0030145 | manganese ion binding(GO:0030145) |
| 0.0 | 0.2 | GO:0031419 | cobalamin binding(GO:0031419) |
| 0.0 | 1.0 | GO:0030742 | GTP-dependent protein binding(GO:0030742) |
| 0.0 | 3.3 | GO:0019888 | protein phosphatase regulator activity(GO:0019888) |
| 0.0 | 1.1 | GO:0051879 | Hsp90 protein binding(GO:0051879) |
| 0.0 | 0.1 | GO:0046933 | proton-transporting ATP synthase activity, rotational mechanism(GO:0046933) |
| 0.0 | 1.8 | GO:0004177 | aminopeptidase activity(GO:0004177) |
| 0.0 | 0.1 | GO:0004667 | prostaglandin-D synthase activity(GO:0004667) |
| 0.0 | 0.2 | GO:0019784 | NEDD8-specific protease activity(GO:0019784) |
| 0.0 | 0.3 | GO:0015386 | potassium:proton antiporter activity(GO:0015386) |
| 0.0 | 1.5 | GO:0004407 | histone deacetylase activity(GO:0004407) |
| 0.0 | 1.1 | GO:0004364 | glutathione transferase activity(GO:0004364) |
| 0.0 | 1.1 | GO:0070888 | E-box binding(GO:0070888) |
| 0.0 | 1.8 | GO:0048365 | Rac GTPase binding(GO:0048365) |
| 0.0 | 3.7 | GO:0005200 | structural constituent of cytoskeleton(GO:0005200) |
| 0.0 | 0.2 | GO:0070679 | inositol 1,4,5 trisphosphate binding(GO:0070679) |
| 0.0 | 0.8 | GO:0004693 | cyclin-dependent protein serine/threonine kinase activity(GO:0004693) |
| 0.0 | 3.1 | GO:0044325 | ion channel binding(GO:0044325) |
| 0.0 | 1.4 | GO:0031491 | nucleosome binding(GO:0031491) |
| 0.0 | 0.5 | GO:0022848 | acetylcholine-gated cation channel activity(GO:0022848) |
| 0.0 | 0.7 | GO:0051959 | dynein light intermediate chain binding(GO:0051959) |
| 0.0 | 0.3 | GO:0009931 | calcium-dependent protein serine/threonine kinase activity(GO:0009931) |
| 0.0 | 0.5 | GO:0015172 | L-glutamate transmembrane transporter activity(GO:0005313) acidic amino acid transmembrane transporter activity(GO:0015172) |
| 0.0 | 0.1 | GO:0005499 | vitamin D binding(GO:0005499) |
| 0.0 | 0.4 | GO:0008266 | poly(U) RNA binding(GO:0008266) |
| 0.0 | 0.2 | GO:1901611 | phosphatidylglycerol binding(GO:1901611) |
| 0.0 | 0.3 | GO:0005104 | fibroblast growth factor receptor binding(GO:0005104) |
| 0.0 | 0.6 | GO:0005504 | fatty acid binding(GO:0005504) |
| 0.0 | 0.3 | GO:0070064 | proline-rich region binding(GO:0070064) |
| 0.0 | 5.7 | GO:0015631 | tubulin binding(GO:0015631) |
| 0.0 | 0.9 | GO:0005549 | odorant binding(GO:0005549) |
| 0.0 | 5.4 | GO:0005525 | GTP binding(GO:0005525) |
| 0.0 | 0.6 | GO:0017091 | AU-rich element binding(GO:0017091) |
| 0.0 | 0.1 | GO:0016361 | activin receptor activity, type I(GO:0016361) BMP receptor activity(GO:0098821) |
| 0.0 | 0.4 | GO:0070034 | telomerase RNA binding(GO:0070034) |
| 0.0 | 0.3 | GO:0030275 | LRR domain binding(GO:0030275) |
| 0.0 | 2.1 | GO:0005089 | Rho guanyl-nucleotide exchange factor activity(GO:0005089) |
Gene overrepresentation in curated gene sets: canonical pathways category:
| Log-likelihood per target | Total log-likelihood | Term | Description |
|---|---|---|---|
| 0.2 | 5.5 | PID CIRCADIAN PATHWAY | Circadian rhythm pathway |
| 0.1 | 1.4 | ST T CELL SIGNAL TRANSDUCTION | T Cell Signal Transduction |
| 0.1 | 5.0 | PID P38 MKK3 6PATHWAY | p38 MAPK signaling pathway |
| 0.1 | 5.2 | ST MYOCYTE AD PATHWAY | Myocyte Adrenergic Pathway is a specific case of the generalized Adrenergic Pathway. |
| 0.1 | 4.5 | PID INSULIN GLUCOSE PATHWAY | Insulin-mediated glucose transport |
| 0.1 | 7.3 | PID RHOA PATHWAY | RhoA signaling pathway |
| 0.1 | 4.7 | PID INTEGRIN CS PATHWAY | Integrin family cell surface interactions |
| 0.1 | 2.7 | PID WNT SIGNALING PATHWAY | Wnt signaling network |
| 0.1 | 10.1 | PID MYC REPRESS PATHWAY | Validated targets of C-MYC transcriptional repression |
| 0.1 | 1.8 | ST GRANULE CELL SURVIVAL PATHWAY | Granule Cell Survival Pathway is a specific case of more general PAC1 Receptor Pathway. |
| 0.1 | 3.6 | PID NCADHERIN PATHWAY | N-cadherin signaling events |
| 0.0 | 2.8 | PID RET PATHWAY | Signaling events regulated by Ret tyrosine kinase |
| 0.0 | 4.9 | PID ERBB1 INTERNALIZATION PATHWAY | Internalization of ErbB1 |
| 0.0 | 1.9 | PID HDAC CLASSIII PATHWAY | Signaling events mediated by HDAC Class III |
| 0.0 | 3.6 | PID CDC42 REG PATHWAY | Regulation of CDC42 activity |
| 0.0 | 2.2 | PID AJDISS 2PATHWAY | Posttranslational regulation of adherens junction stability and dissassembly |
| 0.0 | 3.3 | PID ENDOTHELIN PATHWAY | Endothelins |
| 0.0 | 0.4 | PID P38 GAMMA DELTA PATHWAY | Signaling mediated by p38-gamma and p38-delta |
| 0.0 | 0.9 | PID ARF 3PATHWAY | Arf1 pathway |
| 0.0 | 2.1 | PID LKB1 PATHWAY | LKB1 signaling events |
| 0.0 | 0.8 | PID PRL SIGNALING EVENTS PATHWAY | Signaling events mediated by PRL |
| 0.0 | 1.4 | PID MTOR 4PATHWAY | mTOR signaling pathway |
| 0.0 | 0.7 | PID FAK PATHWAY | Signaling events mediated by focal adhesion kinase |
| 0.0 | 2.1 | PID HEDGEHOG GLI PATHWAY | Hedgehog signaling events mediated by Gli proteins |
| 0.0 | 1.0 | PID INSULIN PATHWAY | Insulin Pathway |
| 0.0 | 0.6 | PID ARF6 TRAFFICKING PATHWAY | Arf6 trafficking events |
| 0.0 | 2.0 | PID P75 NTR PATHWAY | p75(NTR)-mediated signaling |
| 0.0 | 2.6 | PID CASPASE PATHWAY | Caspase cascade in apoptosis |
| 0.0 | 0.4 | PID S1P S1P3 PATHWAY | S1P3 pathway |
| 0.0 | 1.8 | PID CDC42 PATHWAY | CDC42 signaling events |
| 0.0 | 1.1 | PID P53 REGULATION PATHWAY | p53 pathway |
| 0.0 | 1.8 | PID AP1 PATHWAY | AP-1 transcription factor network |
| 0.0 | 1.0 | PID TGFBR PATHWAY | TGF-beta receptor signaling |
| 0.0 | 0.2 | PID FRA PATHWAY | Validated transcriptional targets of AP1 family members Fra1 and Fra2 |
| 0.0 | 1.5 | PID RHOA REG PATHWAY | Regulation of RhoA activity |
| 0.0 | 0.6 | PID IFNG PATHWAY | IFN-gamma pathway |
| 0.0 | 0.2 | ST G ALPHA I PATHWAY | G alpha i Pathway |
| 0.0 | 1.3 | PID P53 DOWNSTREAM PATHWAY | Direct p53 effectors |
| 0.0 | 0.4 | PID IL23 PATHWAY | IL23-mediated signaling events |
| 0.0 | 0.2 | PID PI3K PLC TRK PATHWAY | Trk receptor signaling mediated by PI3K and PLC-gamma |
| 0.0 | 0.6 | PID CXCR4 PATHWAY | CXCR4-mediated signaling events |
| 0.0 | 0.3 | WNT SIGNALING | Genes related to Wnt-mediated signal transduction |
| 0.0 | 0.3 | PID IL2 PI3K PATHWAY | IL2 signaling events mediated by PI3K |
Gene overrepresentation in curated gene sets: REACTOME pathways category:
| Log-likelihood per target | Total log-likelihood | Term | Description |
|---|---|---|---|
| 0.5 | 39.0 | REACTOME STRIATED MUSCLE CONTRACTION | Genes involved in Striated Muscle Contraction |
| 0.3 | 31.5 | REACTOME RESPIRATORY ELECTRON TRANSPORT | Genes involved in Respiratory electron transport |
| 0.3 | 8.5 | REACTOME CITRIC ACID CYCLE TCA CYCLE | Genes involved in Citric acid cycle (TCA cycle) |
| 0.3 | 5.9 | REACTOME REGULATION OF PYRUVATE DEHYDROGENASE PDH COMPLEX | Genes involved in Regulation of pyruvate dehydrogenase (PDH) complex |
| 0.2 | 16.8 | REACTOME ION TRANSPORT BY P TYPE ATPASES | Genes involved in Ion transport by P-type ATPases |
| 0.2 | 3.6 | REACTOME YAP1 AND WWTR1 TAZ STIMULATED GENE EXPRESSION | Genes involved in YAP1- and WWTR1 (TAZ)-stimulated gene expression |
| 0.1 | 5.5 | REACTOME GABA A RECEPTOR ACTIVATION | Genes involved in GABA A receptor activation |
| 0.1 | 1.7 | REACTOME CREATION OF C4 AND C2 ACTIVATORS | Genes involved in Creation of C4 and C2 activators |
| 0.1 | 3.5 | REACTOME NOREPINEPHRINE NEUROTRANSMITTER RELEASE CYCLE | Genes involved in Norepinephrine Neurotransmitter Release Cycle |
| 0.1 | 1.8 | REACTOME PASSIVE TRANSPORT BY AQUAPORINS | Genes involved in Passive Transport by Aquaporins |
| 0.1 | 4.5 | REACTOME ACTIVATED AMPK STIMULATES FATTY ACID OXIDATION IN MUSCLE | Genes involved in Activated AMPK stimulates fatty-acid oxidation in muscle |
| 0.1 | 1.1 | REACTOME REGULATION OF ORNITHINE DECARBOXYLASE ODC | Genes involved in Regulation of ornithine decarboxylase (ODC) |
| 0.1 | 3.3 | REACTOME ENDOSOMAL SORTING COMPLEX REQUIRED FOR TRANSPORT ESCRT | Genes involved in Endosomal Sorting Complex Required For Transport (ESCRT) |
| 0.1 | 5.5 | REACTOME SYNTHESIS OF PIPS AT THE PLASMA MEMBRANE | Genes involved in Synthesis of PIPs at the plasma membrane |
| 0.1 | 4.1 | REACTOME INHIBITION OF VOLTAGE GATED CA2 CHANNELS VIA GBETA GAMMA SUBUNITS | Genes involved in Inhibition of voltage gated Ca2+ channels via Gbeta/gamma subunits |
| 0.1 | 2.6 | REACTOME SYNTHESIS SECRETION AND INACTIVATION OF GIP | Genes involved in Synthesis, Secretion, and Inactivation of Glucose-dependent Insulinotropic Polypeptide (GIP) |
| 0.1 | 1.2 | REACTOME ACYL CHAIN REMODELLING OF PS | Genes involved in Acyl chain remodelling of PS |
| 0.1 | 2.8 | REACTOME CELL EXTRACELLULAR MATRIX INTERACTIONS | Genes involved in Cell-extracellular matrix interactions |
| 0.1 | 0.9 | REACTOME ADP SIGNALLING THROUGH P2RY12 | Genes involved in ADP signalling through P2Y purinoceptor 12 |
| 0.1 | 1.4 | REACTOME ALPHA LINOLENIC ACID ALA METABOLISM | Genes involved in alpha-linolenic acid (ALA) metabolism |
| 0.1 | 2.4 | REACTOME SIGNALING BY FGFR1 FUSION MUTANTS | Genes involved in Signaling by FGFR1 fusion mutants |
| 0.1 | 1.8 | REACTOME ACTIVATION OF THE AP1 FAMILY OF TRANSCRIPTION FACTORS | Genes involved in Activation of the AP-1 family of transcription factors |
| 0.1 | 3.3 | REACTOME INTERACTION BETWEEN L1 AND ANKYRINS | Genes involved in Interaction between L1 and Ankyrins |
| 0.1 | 3.9 | REACTOME VOLTAGE GATED POTASSIUM CHANNELS | Genes involved in Voltage gated Potassium channels |
| 0.0 | 1.8 | REACTOME IONOTROPIC ACTIVITY OF KAINATE RECEPTORS | Genes involved in Ionotropic activity of Kainate Receptors |
| 0.0 | 1.2 | REACTOME PURINE SALVAGE | Genes involved in Purine salvage |
| 0.0 | 0.6 | REACTOME COPI MEDIATED TRANSPORT | Genes involved in COPI Mediated Transport |
| 0.0 | 2.9 | REACTOME BMAL1 CLOCK NPAS2 ACTIVATES CIRCADIAN EXPRESSION | Genes involved in BMAL1:CLOCK/NPAS2 Activates Circadian Expression |
| 0.0 | 1.4 | REACTOME NA CL DEPENDENT NEUROTRANSMITTER TRANSPORTERS | Genes involved in Na+/Cl- dependent neurotransmitter transporters |
| 0.0 | 0.7 | REACTOME SIGNAL ATTENUATION | Genes involved in Signal attenuation |
| 0.0 | 1.5 | REACTOME CASPASE MEDIATED CLEAVAGE OF CYTOSKELETAL PROTEINS | Genes involved in Caspase-mediated cleavage of cytoskeletal proteins |
| 0.0 | 1.1 | REACTOME ACTIVATED POINT MUTANTS OF FGFR2 | Genes involved in Activated point mutants of FGFR2 |
| 0.0 | 2.3 | REACTOME APOPTOTIC CLEAVAGE OF CELLULAR PROTEINS | Genes involved in Apoptotic cleavage of cellular proteins |
| 0.0 | 1.8 | REACTOME CGMP EFFECTS | Genes involved in cGMP effects |
| 0.0 | 6.5 | REACTOME TRANSPORT OF INORGANIC CATIONS ANIONS AND AMINO ACIDS OLIGOPEPTIDES | Genes involved in Transport of inorganic cations/anions and amino acids/oligopeptides |
| 0.0 | 0.4 | REACTOME ROLE OF SECOND MESSENGERS IN NETRIN1 SIGNALING | Genes involved in Role of second messengers in netrin-1 signaling |
| 0.0 | 1.3 | REACTOME DCC MEDIATED ATTRACTIVE SIGNALING | Genes involved in DCC mediated attractive signaling |
| 0.0 | 0.7 | REACTOME P2Y RECEPTORS | Genes involved in P2Y receptors |
| 0.0 | 1.4 | REACTOME P75 NTR RECEPTOR MEDIATED SIGNALLING | Genes involved in p75 NTR receptor-mediated signalling |
| 0.0 | 10.6 | REACTOME ANTIGEN PROCESSING UBIQUITINATION PROTEASOME DEGRADATION | Genes involved in Antigen processing: Ubiquitination & Proteasome degradation |
| 0.0 | 1.0 | REACTOME CIRCADIAN CLOCK | Genes involved in Circadian Clock |
| 0.0 | 3.0 | REACTOME TRAF6 MEDIATED INDUCTION OF NFKB AND MAP KINASES UPON TLR7 8 OR 9 ACTIVATION | Genes involved in TRAF6 mediated induction of NFkB and MAP kinases upon TLR7/8 or 9 activation |
| 0.0 | 2.0 | REACTOME MEIOTIC SYNAPSIS | Genes involved in Meiotic Synapsis |
| 0.0 | 1.1 | REACTOME TRAFFICKING OF GLUR2 CONTAINING AMPA RECEPTORS | Genes involved in Trafficking of GluR2-containing AMPA receptors |
| 0.0 | 1.1 | REACTOME ACTIVATION OF GENES BY ATF4 | Genes involved in Activation of Genes by ATF4 |
| 0.0 | 0.6 | REACTOME TANDEM PORE DOMAIN POTASSIUM CHANNELS | Genes involved in Tandem pore domain potassium channels |
| 0.0 | 1.3 | REACTOME ABC FAMILY PROTEINS MEDIATED TRANSPORT | Genes involved in ABC-family proteins mediated transport |
| 0.0 | 1.2 | REACTOME GLUTATHIONE CONJUGATION | Genes involved in Glutathione conjugation |
| 0.0 | 1.0 | REACTOME SEMA4D INDUCED CELL MIGRATION AND GROWTH CONE COLLAPSE | Genes involved in Sema4D induced cell migration and growth-cone collapse |
| 0.0 | 0.9 | REACTOME CHOLESTEROL BIOSYNTHESIS | Genes involved in Cholesterol biosynthesis |
| 0.0 | 0.9 | REACTOME SYNTHESIS AND INTERCONVERSION OF NUCLEOTIDE DI AND TRIPHOSPHATES | Genes involved in Synthesis and interconversion of nucleotide di- and triphosphates |
| 0.0 | 0.5 | REACTOME BOTULINUM NEUROTOXICITY | Genes involved in Botulinum neurotoxicity |
| 0.0 | 0.5 | REACTOME POTASSIUM CHANNELS | Genes involved in Potassium Channels |
| 0.0 | 0.4 | REACTOME MITOCHONDRIAL FATTY ACID BETA OXIDATION | Genes involved in Mitochondrial Fatty Acid Beta-Oxidation |
| 0.0 | 0.4 | REACTOME VEGF LIGAND RECEPTOR INTERACTIONS | Genes involved in VEGF ligand-receptor interactions |
| 0.0 | 0.2 | REACTOME DIGESTION OF DIETARY CARBOHYDRATE | Genes involved in Digestion of dietary carbohydrate |
| 0.0 | 0.5 | REACTOME ANTIGEN PRESENTATION FOLDING ASSEMBLY AND PEPTIDE LOADING OF CLASS I MHC | Genes involved in Antigen Presentation: Folding, assembly and peptide loading of class I MHC |
| 0.0 | 0.4 | REACTOME AMINE DERIVED HORMONES | Genes involved in Amine-derived hormones |
| 0.0 | 1.1 | REACTOME MHC CLASS II ANTIGEN PRESENTATION | Genes involved in MHC class II antigen presentation |
| 0.0 | 0.5 | REACTOME HS GAG DEGRADATION | Genes involved in HS-GAG degradation |
| 0.0 | 0.3 | REACTOME ACTIVATION OF RAC | Genes involved in Activation of Rac |
| 0.0 | 2.7 | REACTOME METABOLISM OF AMINO ACIDS AND DERIVATIVES | Genes involved in Metabolism of amino acids and derivatives |
| 0.0 | 0.3 | REACTOME SIGNALING BY HIPPO | Genes involved in Signaling by Hippo |
| 0.0 | 0.5 | REACTOME DOWNREGULATION OF SMAD2 3 SMAD4 TRANSCRIPTIONAL ACTIVITY | Genes involved in Downregulation of SMAD2/3:SMAD4 transcriptional activity |
| 0.0 | 0.3 | REACTOME RNA POL III CHAIN ELONGATION | Genes involved in RNA Polymerase III Chain Elongation |
| 0.0 | 0.2 | REACTOME ACTIVATION OF BH3 ONLY PROTEINS | Genes involved in Activation of BH3-only proteins |
| 0.0 | 0.3 | REACTOME REGULATION OF IFNA SIGNALING | Genes involved in Regulation of IFNA signaling |
| 0.0 | 0.3 | REACTOME DEPOSITION OF NEW CENPA CONTAINING NUCLEOSOMES AT THE CENTROMERE | Genes involved in Deposition of New CENPA-containing Nucleosomes at the Centromere |