Project
Illumina Body Map 2 (GSE30611)
Navigation
Downloads
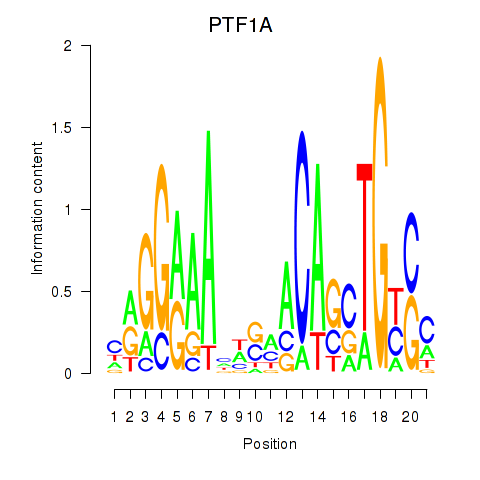
Results for PTF1A
Z-value: 0.76
Motif logo
Transcription factors associated with PTF1A
| Gene Symbol | Gene ID | Gene Info |
|---|---|---|
|
PTF1A
|
ENSG00000168267.7 | pancreas associated transcription factor 1a |
Activity-expression correlation:
| Gene | Promoter | Pearson corr. coef. | P-value | Plot |
|---|---|---|---|---|
| PTF1A | hg38_v1_chr10_+_23192306_23192320 | -0.11 | 5.6e-01 | Click! |
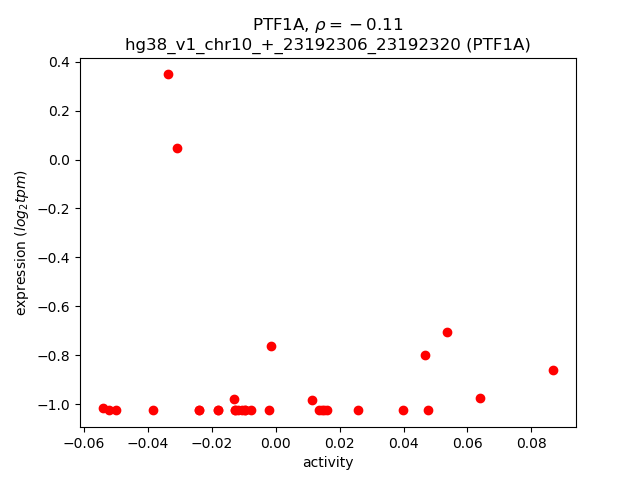
Activity profile of PTF1A motif
Sorted Z-values of PTF1A motif
| Promoter | Log-likelihood | Transcript | Gene | Gene Info |
|---|---|---|---|---|
| chr12_-_57251169 | 1.61 |
ENST00000554578.5
ENST00000546246.2 ENST00000332782.7 ENST00000553489.1 |
STAC3
|
SH3 and cysteine rich domain 3 |
| chr8_+_11494367 | 1.58 |
ENST00000259089.9
ENST00000529894.1 |
BLK
|
BLK proto-oncogene, Src family tyrosine kinase |
| chr3_+_35679690 | 1.56 |
ENST00000413378.5
ENST00000417925.5 |
ARPP21
|
cAMP regulated phosphoprotein 21 |
| chr3_+_35679614 | 1.50 |
ENST00000474696.5
ENST00000412048.5 ENST00000396482.6 ENST00000432682.5 |
ARPP21
|
cAMP regulated phosphoprotein 21 |
| chr1_-_9069608 | 1.44 |
ENST00000377424.9
|
SLC2A5
|
solute carrier family 2 member 5 |
| chr2_-_89213917 | 1.28 |
ENST00000498435.1
|
IGKV1-27
|
immunoglobulin kappa variable 1-27 |
| chr17_+_69502397 | 1.28 |
ENST00000613873.4
ENST00000589647.5 |
MAP2K6
|
mitogen-activated protein kinase kinase 6 |
| chr14_-_106875069 | 1.18 |
ENST00000390639.2
|
IGHV7-81
|
immunoglobulin heavy variable 7-81 (non-functional) |
| chr4_+_40196907 | 1.17 |
ENST00000622175.4
ENST00000619474.4 ENST00000615083.4 ENST00000610353.4 ENST00000614836.1 |
RHOH
|
ras homolog family member H |
| chr3_-_155293665 | 1.17 |
ENST00000489090.2
|
STRIT1
|
small transmembrane regulator of ion transport 1 |
| chr6_-_159045010 | 1.15 |
ENST00000338313.5
|
TAGAP
|
T cell activation RhoGTPase activating protein |
| chr14_-_106025628 | 1.10 |
ENST00000631943.1
|
IGHV7-4-1
|
immunoglobulin heavy variable 7-4-1 |
| chr3_+_35639515 | 1.08 |
ENST00000684406.1
|
ARPP21
|
cAMP regulated phosphoprotein 21 |
| chr2_+_88897230 | 1.06 |
ENST00000390244.2
|
IGKV5-2
|
immunoglobulin kappa variable 5-2 |
| chr6_-_159044980 | 1.06 |
ENST00000367066.8
|
TAGAP
|
T cell activation RhoGTPase activating protein |
| chr6_-_159045104 | 1.01 |
ENST00000326965.7
|
TAGAP
|
T cell activation RhoGTPase activating protein |
| chr3_+_35639589 | 0.97 |
ENST00000428373.5
|
ARPP21
|
cAMP regulated phosphoprotein 21 |
| chr1_-_9069572 | 0.97 |
ENST00000377414.7
|
SLC2A5
|
solute carrier family 2 member 5 |
| chr14_-_106470788 | 0.96 |
ENST00000434710.1
|
IGHV3-43
|
immunoglobulin heavy variable 3-43 |
| chr11_-_1598294 | 0.92 |
ENST00000412090.2
|
KRTAP5-2
|
keratin associated protein 5-2 |
| chr11_+_73646558 | 0.92 |
ENST00000536527.5
ENST00000354190.10 |
PLEKHB1
|
pleckstrin homology domain containing B1 |
| chr11_-_45665578 | 0.90 |
ENST00000308064.7
|
CHST1
|
carbohydrate sulfotransferase 1 |
| chr6_-_24877262 | 0.85 |
ENST00000378023.8
ENST00000540914.5 |
RIPOR2
|
RHO family interacting cell polarization regulator 2 |
| chr1_-_9069797 | 0.84 |
ENST00000473209.1
|
SLC2A5
|
solute carrier family 2 member 5 |
| chr1_-_230978796 | 0.84 |
ENST00000522821.5
ENST00000366662.8 ENST00000366661.9 ENST00000522399.1 |
TTC13
|
tetratricopeptide repeat domain 13 |
| chr2_-_70768175 | 0.80 |
ENST00000355733.7
ENST00000447731.6 ENST00000430656.5 ENST00000264436.9 ENST00000413157.6 |
ADD2
|
adducin 2 |
| chr17_+_69502154 | 0.79 |
ENST00000589295.5
|
MAP2K6
|
mitogen-activated protein kinase kinase 6 |
| chr22_-_50085378 | 0.79 |
ENST00000442311.1
|
MLC1
|
modulator of VRAC current 1 |
| chr4_+_40197023 | 0.78 |
ENST00000381799.10
|
RHOH
|
ras homolog family member H |
| chr17_+_69502255 | 0.76 |
ENST00000588110.5
|
MAP2K6
|
mitogen-activated protein kinase kinase 6 |
| chr22_-_50085331 | 0.76 |
ENST00000395876.6
|
MLC1
|
modulator of VRAC current 1 |
| chr17_-_75896911 | 0.73 |
ENST00000540128.1
ENST00000269383.8 |
TRIM65
|
tripartite motif containing 65 |
| chr19_+_29665444 | 0.69 |
ENST00000592810.1
ENST00000436066.4 |
PLEKHF1
|
pleckstrin homology and FYVE domain containing 1 |
| chr3_+_35679638 | 0.67 |
ENST00000432450.5
|
ARPP21
|
cAMP regulated phosphoprotein 21 |
| chr8_-_22232020 | 0.63 |
ENST00000454243.7
ENST00000321613.7 |
PHYHIP
|
phytanoyl-CoA 2-hydroxylase interacting protein |
| chr22_+_22668286 | 0.58 |
ENST00000390304.2
|
IGLV3-27
|
immunoglobulin lambda variable 3-27 |
| chr3_+_167735238 | 0.58 |
ENST00000472941.5
|
SERPINI1
|
serpin family I member 1 |
| chr12_-_75209814 | 0.57 |
ENST00000549446.6
|
KCNC2
|
potassium voltage-gated channel subfamily C member 2 |
| chr12_-_75209701 | 0.56 |
ENST00000350228.6
ENST00000298972.5 |
KCNC2
|
potassium voltage-gated channel subfamily C member 2 |
| chr1_+_26529745 | 0.55 |
ENST00000374168.7
ENST00000374166.8 |
RPS6KA1
|
ribosomal protein S6 kinase A1 |
| chr15_+_90903731 | 0.54 |
ENST00000559965.5
|
MAN2A2
|
mannosidase alpha class 2A member 2 |
| chr1_-_113905020 | 0.54 |
ENST00000432415.5
ENST00000369571.2 ENST00000256658.8 ENST00000369564.5 |
AP4B1
|
adaptor related protein complex 4 subunit beta 1 |
| chr19_+_29665493 | 0.53 |
ENST00000588833.1
|
PLEKHF1
|
pleckstrin homology and FYVE domain containing 1 |
| chr3_+_167735704 | 0.50 |
ENST00000446050.7
ENST00000295777.9 ENST00000472747.2 |
SERPINI1
|
serpin family I member 1 |
| chr3_+_35638847 | 0.49 |
ENST00000450234.5
|
ARPP21
|
cAMP regulated phosphoprotein 21 |
| chrX_-_21658324 | 0.48 |
ENST00000379499.3
|
KLHL34
|
kelch like family member 34 |
| chr13_-_31162341 | 0.48 |
ENST00000445273.6
ENST00000630972.2 |
HSPH1
|
heat shock protein family H (Hsp110) member 1 |
| chr6_-_62286161 | 0.48 |
ENST00000281156.5
|
KHDRBS2
|
KH RNA binding domain containing, signal transduction associated 2 |
| chr10_+_48684859 | 0.47 |
ENST00000360890.6
ENST00000325239.11 |
WDFY4
|
WDFY family member 4 |
| chr2_+_85695368 | 0.47 |
ENST00000526018.1
|
GNLY
|
granulysin |
| chr3_-_112133218 | 0.47 |
ENST00000488580.5
ENST00000308910.9 ENST00000460387.6 ENST00000484193.5 ENST00000487901.1 |
GCSAM
|
germinal center associated signaling and motility |
| chr15_-_89221558 | 0.47 |
ENST00000268125.10
|
RLBP1
|
retinaldehyde binding protein 1 |
| chr20_-_63216102 | 0.46 |
ENST00000370339.8
ENST00000370334.4 |
YTHDF1
|
YTH N6-methyladenosine RNA binding protein 1 |
| chr7_+_142380781 | 0.45 |
ENST00000390360.3
|
TRBV6-4
|
T cell receptor beta variable 6-4 |
| chr17_-_3557798 | 0.44 |
ENST00000301365.8
ENST00000572519.1 ENST00000576742.6 |
TRPV3
|
transient receptor potential cation channel subfamily V member 3 |
| chr6_-_127459364 | 0.44 |
ENST00000487331.2
ENST00000483725.8 |
KIAA0408
|
KIAA0408 |
| chr2_+_172735838 | 0.42 |
ENST00000397081.8
|
RAPGEF4
|
Rap guanine nucleotide exchange factor 4 |
| chr3_-_69200711 | 0.42 |
ENST00000478263.5
ENST00000462512.1 |
FRMD4B
|
FERM domain containing 4B |
| chr2_-_71227055 | 0.41 |
ENST00000244221.9
|
PAIP2B
|
poly(A) binding protein interacting protein 2B |
| chr19_-_7700074 | 0.41 |
ENST00000593418.1
|
FCER2
|
Fc fragment of IgE receptor II |
| chr17_+_42844573 | 0.40 |
ENST00000253799.8
ENST00000452774.2 |
AOC2
|
amine oxidase copper containing 2 |
| chr11_+_64340191 | 0.40 |
ENST00000356786.10
|
CCDC88B
|
coiled-coil domain containing 88B |
| chr15_+_80933358 | 0.39 |
ENST00000560027.1
|
CEMIP
|
cell migration inducing hyaluronidase 1 |
| chr1_+_113905156 | 0.39 |
ENST00000650596.1
|
DCLRE1B
|
DNA cross-link repair 1B |
| chr10_+_122980448 | 0.38 |
ENST00000405485.2
|
PSTK
|
phosphoseryl-tRNA kinase |
| chr20_+_46008900 | 0.36 |
ENST00000372330.3
|
MMP9
|
matrix metallopeptidase 9 |
| chr1_-_45491150 | 0.36 |
ENST00000372086.4
|
TESK2
|
testis associated actin remodelling kinase 2 |
| chr16_+_46884675 | 0.36 |
ENST00000562132.5
ENST00000440783.2 |
GPT2
|
glutamic--pyruvic transaminase 2 |
| chr3_+_48989876 | 0.36 |
ENST00000343546.8
|
P4HTM
|
prolyl 4-hydroxylase, transmembrane |
| chr4_-_82798735 | 0.35 |
ENST00000273908.4
ENST00000319540.9 |
SCD5
|
stearoyl-CoA desaturase 5 |
| chr8_-_109648825 | 0.34 |
ENST00000533895.5
ENST00000446070.6 ENST00000528331.5 ENST00000526302.5 ENST00000408908.6 ENST00000433638.1 ENST00000524720.5 |
SYBU
|
syntabulin |
| chr13_-_31161890 | 0.34 |
ENST00000320027.10
|
HSPH1
|
heat shock protein family H (Hsp110) member 1 |
| chr10_-_122845850 | 0.33 |
ENST00000392790.6
|
CUZD1
|
CUB and zona pellucida like domains 1 |
| chr2_+_218880844 | 0.33 |
ENST00000258411.8
|
WNT10A
|
Wnt family member 10A |
| chr2_+_218125276 | 0.32 |
ENST00000453237.5
|
CXCR2
|
C-X-C motif chemokine receptor 2 |
| chr3_-_12841527 | 0.32 |
ENST00000396953.6
ENST00000457131.1 ENST00000435983.5 ENST00000273223.10 ENST00000429711.7 ENST00000396957.5 |
RPL32
|
ribosomal protein L32 |
| chr19_-_10380454 | 0.32 |
ENST00000530829.1
ENST00000529370.5 |
TYK2
|
tyrosine kinase 2 |
| chr8_-_109648746 | 0.31 |
ENST00000528045.5
|
SYBU
|
syntabulin |
| chr2_-_159904668 | 0.30 |
ENST00000504764.5
ENST00000505052.1 ENST00000263636.5 |
LY75-CD302
LY75
|
LY75-CD302 readthrough lymphocyte antigen 75 |
| chr10_+_122980392 | 0.29 |
ENST00000406217.8
|
PSTK
|
phosphoseryl-tRNA kinase |
| chr11_-_84166998 | 0.28 |
ENST00000398299.1
|
DLG2
|
discs large MAGUK scaffold protein 2 |
| chr16_-_1954682 | 0.28 |
ENST00000268661.8
|
RPL3L
|
ribosomal protein L3 like |
| chr3_+_48990338 | 0.28 |
ENST00000475629.5
ENST00000444213.5 |
P4HTM
|
prolyl 4-hydroxylase, transmembrane |
| chr8_-_38269157 | 0.28 |
ENST00000531823.5
ENST00000534339.5 ENST00000524616.5 ENST00000422581.6 ENST00000424479.7 ENST00000419686.2 |
PLPP5
|
phospholipid phosphatase 5 |
| chr10_+_75111595 | 0.27 |
ENST00000671800.1
ENST00000542569.6 ENST00000372687.4 |
SAMD8
|
sterile alpha motif domain containing 8 |
| chr1_-_113904789 | 0.27 |
ENST00000369569.6
ENST00000369567.5 |
AP4B1
|
adaptor related protein complex 4 subunit beta 1 |
| chr11_+_57181945 | 0.27 |
ENST00000497933.3
|
LRRC55
|
leucine rich repeat containing 55 |
| chr12_+_1820558 | 0.26 |
ENST00000299194.6
|
LRTM2
|
leucine rich repeats and transmembrane domains 2 |
| chr14_-_23572975 | 0.26 |
ENST00000544177.1
|
JPH4
|
junctophilin 4 |
| chr19_+_17952266 | 0.26 |
ENST00000609922.2
|
KCNN1
|
potassium calcium-activated channel subfamily N member 1 |
| chr3_+_101827982 | 0.25 |
ENST00000461724.5
ENST00000483180.5 ENST00000394054.6 |
NFKBIZ
|
NFKB inhibitor zeta |
| chr3_-_52834901 | 0.25 |
ENST00000486659.5
|
MUSTN1
|
musculoskeletal, embryonic nuclear protein 1 |
| chr12_+_50057548 | 0.25 |
ENST00000228468.8
ENST00000447966.7 |
ASIC1
|
acid sensing ion channel subunit 1 |
| chr2_+_201258103 | 0.25 |
ENST00000413726.5
|
CASP8
|
caspase 8 |
| chr17_-_38343810 | 0.25 |
ENST00000621958.1
ENST00000616987.5 |
GPR179
|
G protein-coupled receptor 179 |
| chr16_+_89630263 | 0.25 |
ENST00000261615.5
|
DPEP1
|
dipeptidase 1 |
| chr7_-_5513738 | 0.24 |
ENST00000453700.7
ENST00000382368.8 |
FBXL18
|
F-box and leucine rich repeat protein 18 |
| chr9_-_111036207 | 0.24 |
ENST00000541779.5
|
LPAR1
|
lysophosphatidic acid receptor 1 |
| chr19_-_9219589 | 0.24 |
ENST00000641244.1
ENST00000641669.1 |
OR7D4
|
olfactory receptor family 7 subfamily D member 4 |
| chr20_+_18145083 | 0.24 |
ENST00000489634.2
|
KAT14
|
lysine acetyltransferase 14 |
| chr8_-_134712962 | 0.24 |
ENST00000523399.5
ENST00000377838.8 |
ZFAT
|
zinc finger and AT-hook domain containing |
| chr12_+_1820255 | 0.22 |
ENST00000543818.5
|
LRTM2
|
leucine rich repeats and transmembrane domains 2 |
| chr1_+_113905290 | 0.22 |
ENST00000650450.2
|
DCLRE1B
|
DNA cross-link repair 1B |
| chr3_+_48990219 | 0.22 |
ENST00000383729.9
|
P4HTM
|
prolyl 4-hydroxylase, transmembrane |
| chr9_+_33795551 | 0.21 |
ENST00000379405.4
|
PRSS3
|
serine protease 3 |
| chr5_+_132813283 | 0.21 |
ENST00000378693.4
|
SOWAHA
|
sosondowah ankyrin repeat domain family member A |
| chr8_+_49911396 | 0.21 |
ENST00000642720.2
|
SNTG1
|
syntrophin gamma 1 |
| chr2_-_106160376 | 0.20 |
ENST00000479621.5
|
UXS1
|
UDP-glucuronate decarboxylase 1 |
| chr7_-_22356914 | 0.20 |
ENST00000344041.10
|
RAPGEF5
|
Rap guanine nucleotide exchange factor 5 |
| chr7_-_22357112 | 0.20 |
ENST00000405243.1
ENST00000665637.1 |
RAPGEF5
|
Rap guanine nucleotide exchange factor 5 |
| chr8_+_32548303 | 0.20 |
ENST00000650967.1
|
NRG1
|
neuregulin 1 |
| chr8_-_38269116 | 0.20 |
ENST00000529359.5
|
PLPP5
|
phospholipid phosphatase 5 |
| chr5_+_126465144 | 0.20 |
ENST00000511134.1
|
GRAMD2B
|
GRAM domain containing 2B |
| chr12_+_120446418 | 0.19 |
ENST00000551765.6
ENST00000229384.5 |
GATC
|
glutamyl-tRNA amidotransferase subunit C |
| chr14_+_69879408 | 0.19 |
ENST00000361956.8
ENST00000381280.4 |
SMOC1
|
SPARC related modular calcium binding 1 |
| chr19_+_17215716 | 0.19 |
ENST00000593597.1
|
USE1
|
unconventional SNARE in the ER 1 |
| chr16_-_75535247 | 0.18 |
ENST00000565039.1
|
CHST5
|
carbohydrate sulfotransferase 5 |
| chr4_-_174829212 | 0.18 |
ENST00000340217.5
ENST00000274093.8 |
GLRA3
|
glycine receptor alpha 3 |
| chr7_+_143052341 | 0.18 |
ENST00000418316.2
|
OR6V1
|
olfactory receptor family 6 subfamily V member 1 |
| chrX_+_15790446 | 0.18 |
ENST00000380308.7
ENST00000307771.8 |
ZRSR2
|
zinc finger CCCH-type, RNA binding motif and serine/arginine rich 2 |
| chr6_-_2962123 | 0.18 |
ENST00000644875.1
|
SERPINB6
|
serpin family B member 6 |
| chr2_+_201257980 | 0.17 |
ENST00000447616.5
ENST00000358485.8 ENST00000392266.7 |
CASP8
|
caspase 8 |
| chr3_-_52835011 | 0.17 |
ENST00000446157.3
|
MUSTN1
|
musculoskeletal, embryonic nuclear protein 1 |
| chr2_-_27211742 | 0.16 |
ENST00000408041.5
ENST00000401463.5 |
SLC5A6
|
solute carrier family 5 member 6 |
| chr19_+_9178979 | 0.16 |
ENST00000642043.1
ENST00000641288.2 |
OR7D2
|
olfactory receptor family 7 subfamily D member 2 |
| chr12_-_57846686 | 0.15 |
ENST00000548823.1
ENST00000398073.7 |
CTDSP2
|
CTD small phosphatase 2 |
| chr12_-_121534651 | 0.15 |
ENST00000545022.5
|
KDM2B
|
lysine demethylase 2B |
| chr19_+_15082211 | 0.15 |
ENST00000641398.1
|
OR1I1
|
olfactory receptor family 1 subfamily I member 1 |
| chr2_-_236503688 | 0.15 |
ENST00000418802.2
ENST00000431676.6 |
IQCA1
|
IQ motif containing with AAA domain 1 |
| chr11_+_96389985 | 0.15 |
ENST00000332349.5
|
JRKL
|
JRK like |
| chr15_-_72231583 | 0.15 |
ENST00000566809.1
ENST00000567087.5 ENST00000569050.1 ENST00000568883.5 |
PKM
|
pyruvate kinase M1/2 |
| chr12_+_109154661 | 0.15 |
ENST00000544726.2
|
ACACB
|
acetyl-CoA carboxylase beta |
| chr20_+_43916142 | 0.14 |
ENST00000423191.6
ENST00000372999.5 |
TOX2
|
TOX high mobility group box family member 2 |
| chr2_-_106160106 | 0.13 |
ENST00000479774.5
|
UXS1
|
UDP-glucuronate decarboxylase 1 |
| chr9_+_104504263 | 0.13 |
ENST00000334726.3
|
OR13F1
|
olfactory receptor family 13 subfamily F member 1 |
| chr7_+_142760398 | 0.13 |
ENST00000632998.1
|
PRSS2
|
serine protease 2 |
| chr8_+_32548210 | 0.13 |
ENST00000523079.5
ENST00000650919.1 |
NRG1
|
neuregulin 1 |
| chr5_-_163460067 | 0.13 |
ENST00000302764.9
|
NUDCD2
|
NudC domain containing 2 |
| chr11_-_102705737 | 0.13 |
ENST00000260229.5
|
MMP27
|
matrix metallopeptidase 27 |
| chr19_+_54573781 | 0.13 |
ENST00000391738.8
ENST00000251376.7 ENST00000391737.3 ENST00000629481.1 |
LILRA2
|
leukocyte immunoglobulin like receptor A2 |
| chrX_+_155881306 | 0.12 |
ENST00000286448.12
ENST00000262640.11 ENST00000460621.6 |
VAMP7
|
vesicle associated membrane protein 7 |
| chr11_+_8683201 | 0.12 |
ENST00000526562.5
ENST00000525981.1 |
RPL27A
|
ribosomal protein L27a |
| chr15_-_72231113 | 0.12 |
ENST00000565154.6
ENST00000565184.6 ENST00000335181.10 |
PKM
|
pyruvate kinase M1/2 |
| chr3_-_56977354 | 0.12 |
ENST00000473779.5
|
ARHGEF3
|
Rho guanine nucleotide exchange factor 3 |
| chr12_-_120446372 | 0.11 |
ENST00000546954.2
|
TRIAP1
|
TP53 regulated inhibitor of apoptosis 1 |
| chr11_-_61967127 | 0.11 |
ENST00000532601.1
|
FTH1
|
ferritin heavy chain 1 |
| chr11_+_6863057 | 0.11 |
ENST00000641461.1
|
OR10A2
|
olfactory receptor family 10 subfamily A member 2 |
| chr1_-_20119527 | 0.11 |
ENST00000375105.8
ENST00000617227.1 |
PLA2G2D
|
phospholipase A2 group IID |
| chr7_-_101200912 | 0.11 |
ENST00000440203.6
ENST00000379423.3 ENST00000223114.9 |
MOGAT3
|
monoacylglycerol O-acyltransferase 3 |
| chr11_+_64291285 | 0.11 |
ENST00000422670.7
ENST00000538767.1 |
KCNK4
|
potassium two pore domain channel subfamily K member 4 |
| chr19_-_39840671 | 0.11 |
ENST00000597224.5
|
FBL
|
fibrillarin |
| chr2_+_43838963 | 0.11 |
ENST00000272286.4
|
ABCG8
|
ATP binding cassette subfamily G member 8 |
| chr17_+_51165435 | 0.11 |
ENST00000514264.6
|
NME2
|
NME/NM23 nucleoside diphosphate kinase 2 |
| chr16_-_85112390 | 0.10 |
ENST00000629253.1
ENST00000539556.6 |
CIBAR2
|
CBY1 interacting BAR domain containing 2 |
| chr1_+_12125892 | 0.10 |
ENST00000413146.6
|
TNFRSF8
|
TNF receptor superfamily member 8 |
| chr3_+_40477107 | 0.10 |
ENST00000314686.9
ENST00000447116.6 ENST00000429348.6 ENST00000432264.4 ENST00000456778.5 |
ZNF619
|
zinc finger protein 619 |
| chr12_+_2803197 | 0.09 |
ENST00000544366.1
|
FKBP4
|
FKBP prolyl isomerase 4 |
| chr13_+_112979306 | 0.09 |
ENST00000421756.5
|
MCF2L
|
MCF.2 cell line derived transforming sequence like |
| chr12_+_56996151 | 0.09 |
ENST00000556850.1
|
GPR182
|
G protein-coupled receptor 182 |
| chr13_-_79405784 | 0.08 |
ENST00000267229.11
|
RBM26
|
RNA binding motif protein 26 |
| chr10_-_27243019 | 0.08 |
ENST00000679293.1
|
ACBD5
|
acyl-CoA binding domain containing 5 |
| chr6_-_159788439 | 0.08 |
ENST00000539948.5
|
TCP1
|
t-complex 1 |
| chr2_-_27211888 | 0.08 |
ENST00000426119.5
ENST00000412471.5 |
SLC5A6
|
solute carrier family 5 member 6 |
| chr1_-_204685700 | 0.08 |
ENST00000367177.4
|
LRRN2
|
leucine rich repeat neuronal 2 |
| chr11_-_96389857 | 0.07 |
ENST00000680532.1
ENST00000681014.1 ENST00000679708.1 ENST00000645439.1 ENST00000645366.1 ENST00000680728.1 ENST00000680859.1 ENST00000679788.1 ENST00000681164.1 ENST00000646818.2 ENST00000680171.1 ENST00000679696.1 ENST00000681200.1 ENST00000679960.1 ENST00000647080.1 ENST00000646050.1 ENST00000681451.1 ENST00000644686.1 ENST00000680052.1 ENST00000679616.1 ENST00000530203.2 |
CCDC82
|
coiled-coil domain containing 82 |
| chr10_-_73096974 | 0.07 |
ENST00000440381.5
ENST00000263556.3 |
P4HA1
|
prolyl 4-hydroxylase subunit alpha 1 |
| chr18_-_26546990 | 0.07 |
ENST00000578973.1
|
KCTD1
|
potassium channel tetramerization domain containing 1 |
| chr12_+_53295506 | 0.06 |
ENST00000549759.2
ENST00000628881.2 ENST00000351500.7 ENST00000550846.5 ENST00000334478.9 ENST00000547130.6 ENST00000552742.6 |
PFDN5
|
prefoldin subunit 5 |
| chr7_+_142111739 | 0.06 |
ENST00000550469.6
ENST00000477922.3 |
MGAM2
|
maltase-glucoamylase 2 (putative) |
| chr17_+_12789697 | 0.06 |
ENST00000262444.13
|
ARHGAP44
|
Rho GTPase activating protein 44 |
| chr3_-_50359480 | 0.06 |
ENST00000266025.4
|
TMEM115
|
transmembrane protein 115 |
| chr3_+_130929998 | 0.06 |
ENST00000508297.2
|
ATP2C1
|
ATPase secretory pathway Ca2+ transporting 1 |
| chr14_-_58427114 | 0.05 |
ENST00000556007.6
|
TIMM9
|
translocase of inner mitochondrial membrane 9 |
| chr8_-_124565699 | 0.05 |
ENST00000519168.5
|
MTSS1
|
MTSS I-BAR domain containing 1 |
| chr11_-_1585283 | 0.05 |
ENST00000382171.2
|
KRTAP5-1
|
keratin associated protein 5-1 |
| chr20_-_3663399 | 0.05 |
ENST00000290417.7
ENST00000319242.8 |
GFRA4
|
GDNF family receptor alpha 4 |
| chr15_+_68631988 | 0.05 |
ENST00000543950.3
|
CORO2B
|
coronin 2B |
| chr2_+_3389681 | 0.05 |
ENST00000457845.4
ENST00000441983.5 |
TRAPPC12
|
trafficking protein particle complex 12 |
| chr14_-_58427134 | 0.04 |
ENST00000555930.6
|
TIMM9
|
translocase of inner mitochondrial membrane 9 |
| chr15_+_51341648 | 0.04 |
ENST00000335449.11
ENST00000560215.5 |
GLDN
|
gliomedin |
| chr2_+_96760857 | 0.04 |
ENST00000377075.3
|
CNNM4
|
cyclin and CBS domain divalent metal cation transport mediator 4 |
| chr16_+_71358713 | 0.04 |
ENST00000349553.9
ENST00000302628.9 ENST00000562305.5 |
CALB2
|
calbindin 2 |
| chr11_-_96389936 | 0.04 |
ENST00000680763.1
ENST00000679856.1 ENST00000643839.1 ENST00000645500.1 ENST00000530106.2 |
CCDC82
|
coiled-coil domain containing 82 |
| chr5_-_75717368 | 0.04 |
ENST00000514838.6
ENST00000506164.5 ENST00000502826.5 ENST00000428202.7 ENST00000503835.5 |
POC5
|
POC5 centriolar protein |
| chr6_-_24489565 | 0.04 |
ENST00000230036.2
|
GPLD1
|
glycosylphosphatidylinositol specific phospholipase D1 |
| chr11_-_61829281 | 0.04 |
ENST00000448607.1
ENST00000421879.5 |
FADS1
|
fatty acid desaturase 1 |
| chr17_-_7211808 | 0.04 |
ENST00000648658.1
|
DLG4
|
discs large MAGUK scaffold protein 4 |
| chr8_+_32548267 | 0.04 |
ENST00000356819.7
|
NRG1
|
neuregulin 1 |
| chr2_+_227728335 | 0.03 |
ENST00000641700.1
|
SCYGR7
|
small cysteine and glycine repeat containing 7 |
| chr19_-_1169138 | 0.03 |
ENST00000587655.2
|
SBNO2
|
strawberry notch homolog 2 |
| chr20_+_56248732 | 0.03 |
ENST00000243911.2
|
MC3R
|
melanocortin 3 receptor |
| chr9_-_101383558 | 0.03 |
ENST00000674556.1
|
BAAT
|
bile acid-CoA:amino acid N-acyltransferase |
| chr11_-_89876017 | 0.03 |
ENST00000329862.6
|
TRIM64B
|
tripartite motif containing 64B |
| chr12_+_30926428 | 0.03 |
ENST00000545802.1
|
TSPAN11
|
tetraspanin 11 |
| chr1_+_39738866 | 0.03 |
ENST00000324379.10
ENST00000356511.6 ENST00000497370.5 ENST00000470213.5 ENST00000372835.9 ENST00000372830.5 |
PPIE
|
peptidylprolyl isomerase E |
| chr21_+_33205279 | 0.03 |
ENST00000683941.1
|
IFNAR2
|
interferon alpha and beta receptor subunit 2 |
| chr6_+_167271163 | 0.03 |
ENST00000503433.5
|
UNC93A
|
unc-93 homolog A |
| chr10_-_73096850 | 0.03 |
ENST00000307116.6
ENST00000373008.6 ENST00000394890.7 |
P4HA1
|
prolyl 4-hydroxylase subunit alpha 1 |
| chr11_+_193078 | 0.02 |
ENST00000342878.3
|
SCGB1C1
|
secretoglobin family 1C member 1 |
| chr12_+_51238724 | 0.02 |
ENST00000449723.7
ENST00000549555.5 ENST00000439799.6 ENST00000412716.8 ENST00000425012.6 |
DAZAP2
|
DAZ associated protein 2 |
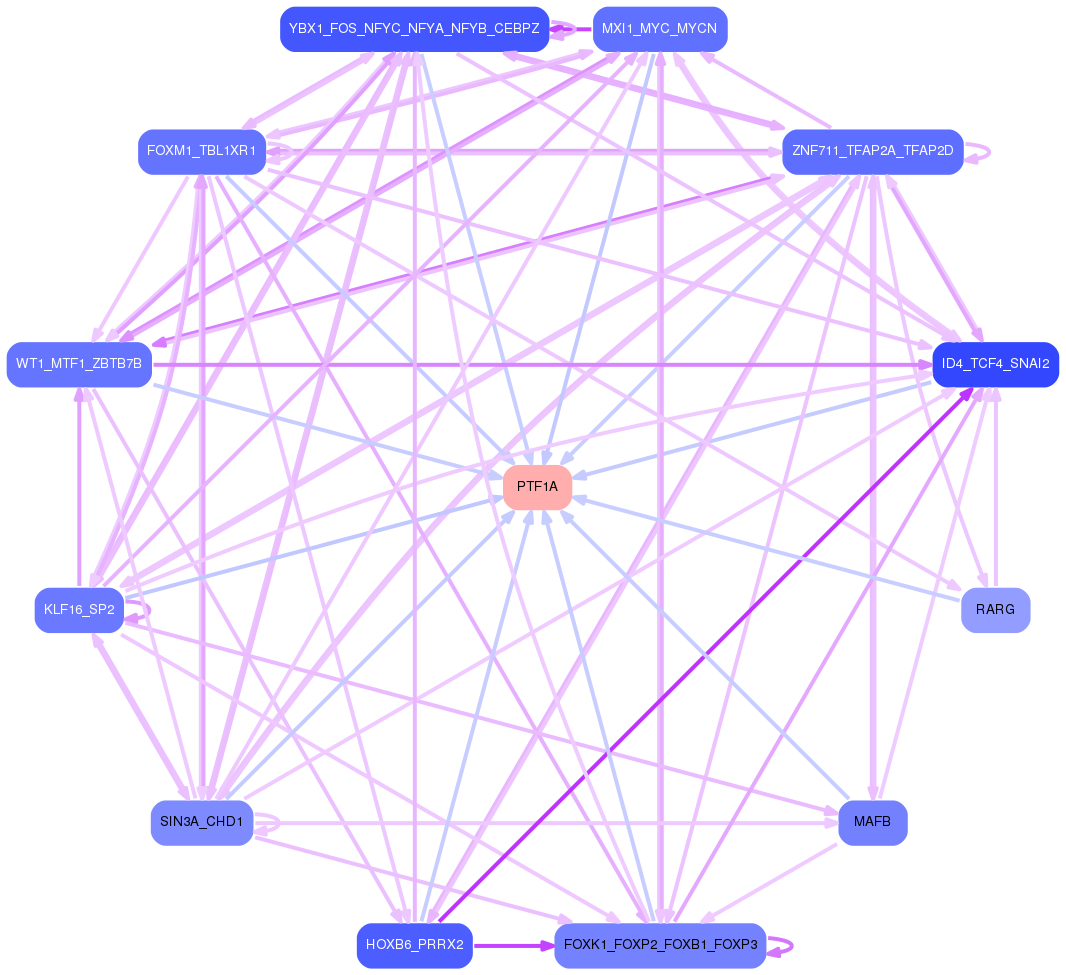
Network of associatons between targets according to the STRING database.

First level regulatory network of PTF1A
Gene Ontology Analysis
Gene overrepresentation in biological process category:
| Log-likelihood per target | Total log-likelihood | Term | Description |
|---|---|---|---|
| 0.6 | 2.8 | GO:0072709 | cellular response to sorbitol(GO:0072709) |
| 0.5 | 3.3 | GO:0097319 | fructose import(GO:0032445) carbohydrate import into cell(GO:0097319) carbohydrate import across plasma membrane(GO:0098704) fructose import across plasma membrane(GO:1990539) |
| 0.3 | 1.1 | GO:0038060 | nitric oxide-cGMP-mediated signaling pathway(GO:0038060) |
| 0.2 | 0.5 | GO:0002818 | intracellular defense response(GO:0002818) |
| 0.1 | 0.8 | GO:1903904 | negative regulation of establishment of T cell polarity(GO:1903904) negative regulation of Rho guanyl-nucleotide exchange factor activity(GO:2001107) |
| 0.1 | 0.7 | GO:0097056 | selenocysteinyl-tRNA(Sec) biosynthetic process(GO:0097056) |
| 0.1 | 0.8 | GO:1903750 | regulation of intrinsic apoptotic signaling pathway in response to hydrogen peroxide(GO:1903750) negative regulation of intrinsic apoptotic signaling pathway in response to hydrogen peroxide(GO:1903751) |
| 0.1 | 0.6 | GO:0031627 | telomeric loop formation(GO:0031627) |
| 0.1 | 0.4 | GO:0039513 | modulation by virus of host molecular function(GO:0039506) suppression by virus of host molecular function(GO:0039507) suppression by virus of host catalytic activity(GO:0039513) modulation by virus of host catalytic activity(GO:0039516) suppression by virus of host cysteine-type endopeptidase activity involved in apoptotic process(GO:0039650) negative regulation by symbiont of host catalytic activity(GO:0052053) negative regulation by symbiont of host molecular function(GO:0052056) modulation by symbiont of host catalytic activity(GO:0052148) |
| 0.1 | 0.2 | GO:0016999 | antibiotic metabolic process(GO:0016999) |
| 0.1 | 0.4 | GO:0042636 | negative regulation of hair cycle(GO:0042636) |
| 0.1 | 0.4 | GO:0042853 | L-alanine metabolic process(GO:0042851) L-alanine catabolic process(GO:0042853) |
| 0.1 | 0.5 | GO:2000402 | negative regulation of lymphocyte migration(GO:2000402) |
| 0.1 | 1.6 | GO:0071397 | cellular response to cholesterol(GO:0071397) |
| 0.1 | 0.6 | GO:2000491 | positive regulation of hepatic stellate cell activation(GO:2000491) |
| 0.1 | 0.3 | GO:0038112 | interleukin-8-mediated signaling pathway(GO:0038112) |
| 0.1 | 0.4 | GO:0002925 | positive regulation of humoral immune response mediated by circulating immunoglobulin(GO:0002925) |
| 0.0 | 0.2 | GO:0015878 | biotin transport(GO:0015878) pantothenate transmembrane transport(GO:0015887) |
| 0.0 | 0.2 | GO:0070681 | glutaminyl-tRNAGln biosynthesis via transamidation(GO:0070681) |
| 0.0 | 0.2 | GO:1904565 | response to 1-oleoyl-sn-glycerol 3-phosphate(GO:1904565) cellular response to 1-oleoyl-sn-glycerol 3-phosphate(GO:1904566) |
| 0.0 | 0.5 | GO:0006013 | mannose metabolic process(GO:0006013) |
| 0.0 | 0.3 | GO:0050915 | sensory perception of sour taste(GO:0050915) |
| 0.0 | 0.3 | GO:0006931 | substrate-dependent cell migration, cell attachment to substrate(GO:0006931) |
| 0.0 | 0.1 | GO:1903595 | positive regulation of histamine secretion by mast cell(GO:1903595) protein localization to vacuolar membrane(GO:1903778) |
| 0.0 | 0.2 | GO:0033320 | UDP-D-xylose metabolic process(GO:0033319) UDP-D-xylose biosynthetic process(GO:0033320) |
| 0.0 | 0.4 | GO:1900019 | regulation of protein kinase C activity(GO:1900019) positive regulation of protein kinase C activity(GO:1900020) |
| 0.0 | 0.1 | GO:0050976 | detection of mechanical stimulus involved in sensory perception of touch(GO:0050976) cellular response to alkaline pH(GO:0071469) |
| 0.0 | 0.1 | GO:0000494 | box C/D snoRNA 3'-end processing(GO:0000494) box C/D snoRNA metabolic process(GO:0033967) box C/D snoRNA processing(GO:0034963) histone glutamine methylation(GO:1990258) |
| 0.0 | 0.1 | GO:0045556 | TRAIL biosynthetic process(GO:0045553) regulation of TRAIL biosynthetic process(GO:0045554) positive regulation of TRAIL biosynthetic process(GO:0045556) |
| 0.0 | 0.9 | GO:0006012 | galactose metabolic process(GO:0006012) |
| 0.0 | 0.4 | GO:2001268 | negative regulation of cysteine-type endopeptidase activity involved in apoptotic signaling pathway(GO:2001268) |
| 0.0 | 1.6 | GO:0050855 | regulation of B cell receptor signaling pathway(GO:0050855) |
| 0.0 | 0.1 | GO:0006463 | steroid hormone receptor complex assembly(GO:0006463) |
| 0.0 | 1.6 | GO:0048741 | skeletal muscle fiber development(GO:0048741) |
| 0.0 | 0.5 | GO:0006776 | vitamin A metabolic process(GO:0006776) |
| 0.0 | 0.1 | GO:1904479 | negative regulation of intestinal absorption(GO:1904479) |
| 0.0 | 0.1 | GO:0018106 | peptidyl-histidine phosphorylation(GO:0018106) |
| 0.0 | 0.1 | GO:0051836 | translocation of peptides or proteins into host(GO:0042000) translocation of peptides or proteins into host cell cytoplasm(GO:0044053) translocation of molecules into host(GO:0044417) translocation of peptides or proteins into other organism involved in symbiotic interaction(GO:0051808) translocation of molecules into other organism involved in symbiotic interaction(GO:0051836) |
| 0.0 | 0.2 | GO:0021993 | initiation of neural tube closure(GO:0021993) |
| 0.0 | 0.3 | GO:0006686 | sphingomyelin biosynthetic process(GO:0006686) |
| 0.0 | 2.1 | GO:0006910 | phagocytosis, recognition(GO:0006910) |
| 0.0 | 0.3 | GO:0042866 | pyruvate biosynthetic process(GO:0042866) |
| 0.0 | 6.2 | GO:0034605 | cellular response to heat(GO:0034605) |
| 0.0 | 0.8 | GO:0050901 | leukocyte tethering or rolling(GO:0050901) |
| 0.0 | 0.4 | GO:0021840 | directional guidance of interneurons involved in migration from the subpallium to the cortex(GO:0021840) chemorepulsion involved in interneuron migration from the subpallium to the cortex(GO:0021842) ERBB3 signaling pathway(GO:0038129) |
| 0.0 | 2.0 | GO:0034260 | negative regulation of GTPase activity(GO:0034260) |
| 0.0 | 0.1 | GO:2001295 | malonyl-CoA biosynthetic process(GO:2001295) |
| 0.0 | 0.2 | GO:0060012 | synaptic transmission, glycinergic(GO:0060012) |
| 0.0 | 0.3 | GO:0048733 | sebaceous gland development(GO:0048733) |
| 0.0 | 0.1 | GO:0002361 | CD4-positive, CD25-positive, alpha-beta regulatory T cell differentiation(GO:0002361) |
| 0.0 | 0.3 | GO:1903818 | positive regulation of voltage-gated potassium channel activity(GO:1903818) |
| 0.0 | 0.4 | GO:0035988 | chondrocyte proliferation(GO:0035988) |
| 0.0 | 1.6 | GO:0006958 | complement activation, classical pathway(GO:0006958) |
| 0.0 | 0.1 | GO:0006880 | intracellular sequestering of iron ion(GO:0006880) sequestering of iron ion(GO:0097577) |
| 0.0 | 0.2 | GO:0006477 | protein sulfation(GO:0006477) |
| 0.0 | 0.1 | GO:0045039 | protein import into mitochondrial inner membrane(GO:0045039) |
| 0.0 | 0.3 | GO:2001256 | regulation of store-operated calcium entry(GO:2001256) |
| 0.0 | 0.0 | GO:0042309 | homoiothermy(GO:0042309) |
| 0.0 | 0.5 | GO:0045948 | positive regulation of translational initiation(GO:0045948) |
| 0.0 | 1.7 | GO:0010508 | positive regulation of autophagy(GO:0010508) |
| 0.0 | 0.0 | GO:1903179 | negative regulation of late endosome to lysosome transport(GO:1902823) regulation of dopamine biosynthetic process(GO:1903179) positive regulation of dopamine biosynthetic process(GO:1903181) |
| 0.0 | 0.4 | GO:0045947 | negative regulation of translational initiation(GO:0045947) |
| 0.0 | 0.1 | GO:0098886 | modification of dendritic spine(GO:0098886) |
| 0.0 | 0.9 | GO:0045646 | regulation of erythrocyte differentiation(GO:0045646) |
Gene overrepresentation in cellular component category:
| Log-likelihood per target | Total log-likelihood | Term | Description |
|---|---|---|---|
| 0.1 | 0.8 | GO:0060171 | stereocilium membrane(GO:0060171) |
| 0.1 | 0.3 | GO:1902912 | pyruvate kinase complex(GO:1902912) |
| 0.1 | 0.8 | GO:0008290 | F-actin capping protein complex(GO:0008290) |
| 0.0 | 0.2 | GO:0030956 | glutamyl-tRNA(Gln) amidotransferase complex(GO:0030956) |
| 0.0 | 0.5 | GO:0044194 | cytolytic granule(GO:0044194) |
| 0.0 | 2.1 | GO:0042571 | immunoglobulin complex, circulating(GO:0042571) |
| 0.0 | 0.7 | GO:0097433 | dense body(GO:0097433) |
| 0.0 | 0.1 | GO:0008043 | intracellular ferritin complex(GO:0008043) ferritin complex(GO:0070288) |
| 0.0 | 0.1 | GO:0016222 | procollagen-proline 4-dioxygenase complex(GO:0016222) |
| 0.0 | 0.2 | GO:0089701 | U2AF(GO:0089701) |
| 0.0 | 2.0 | GO:0001772 | immunological synapse(GO:0001772) |
| 0.0 | 0.1 | GO:0001651 | dense fibrillar component(GO:0001651) |
| 0.0 | 1.5 | GO:0030673 | axolemma(GO:0030673) |
| 0.0 | 0.6 | GO:0071682 | endocytic vesicle lumen(GO:0071682) |
| 0.0 | 0.3 | GO:0030314 | junctional membrane complex(GO:0030314) |
| 0.0 | 0.3 | GO:0042589 | zymogen granule membrane(GO:0042589) |
| 0.0 | 0.4 | GO:0031265 | CD95 death-inducing signaling complex(GO:0031265) |
| 0.0 | 0.1 | GO:0042721 | mitochondrial inner membrane protein insertion complex(GO:0042721) |
| 0.0 | 2.8 | GO:0035579 | specific granule membrane(GO:0035579) |
| 0.0 | 0.1 | GO:0042406 | extrinsic component of endoplasmic reticulum membrane(GO:0042406) |
| 0.0 | 0.8 | GO:0030131 | clathrin adaptor complex(GO:0030131) |
| 0.0 | 0.2 | GO:0016013 | syntrophin complex(GO:0016013) |
Gene overrepresentation in molecular function category:
| Log-likelihood per target | Total log-likelihood | Term | Description |
|---|---|---|---|
| 0.5 | 3.3 | GO:0005353 | fructose transmembrane transporter activity(GO:0005353) |
| 0.1 | 1.1 | GO:0001517 | N-acetylglucosamine 6-O-sulfotransferase activity(GO:0001517) |
| 0.1 | 0.4 | GO:0047635 | L-alanine:2-oxoglutarate aminotransferase activity(GO:0004021) alanine-oxo-acid transaminase activity(GO:0047635) |
| 0.1 | 0.5 | GO:0004572 | mannosyl-oligosaccharide 1,3-1,6-alpha-mannosidase activity(GO:0004572) |
| 0.1 | 0.4 | GO:0052595 | tryptamine:oxygen oxidoreductase (deaminating) activity(GO:0052593) aminoacetone:oxygen oxidoreductase(deaminating) activity(GO:0052594) aliphatic-amine oxidase activity(GO:0052595) phenethylamine:oxygen oxidoreductase (deaminating) activity(GO:0052596) |
| 0.1 | 0.5 | GO:0005502 | 11-cis retinal binding(GO:0005502) |
| 0.1 | 2.8 | GO:0004708 | MAP kinase kinase activity(GO:0004708) |
| 0.1 | 1.2 | GO:0010314 | phosphatidylinositol-5-phosphate binding(GO:0010314) |
| 0.1 | 0.4 | GO:0097199 | cysteine-type endopeptidase activity involved in apoptotic signaling pathway(GO:0097199) |
| 0.1 | 2.0 | GO:0005095 | GTPase inhibitor activity(GO:0005095) |
| 0.1 | 0.8 | GO:0000774 | adenyl-nucleotide exchange factor activity(GO:0000774) |
| 0.1 | 0.3 | GO:0004918 | interleukin-8 receptor activity(GO:0004918) |
| 0.1 | 0.6 | GO:0035312 | 5'-3' exodeoxyribonuclease activity(GO:0035312) |
| 0.1 | 0.4 | GO:0016215 | stearoyl-CoA 9-desaturase activity(GO:0004768) acyl-CoA desaturase activity(GO:0016215) |
| 0.1 | 0.3 | GO:0044736 | acid-sensing ion channel activity(GO:0044736) |
| 0.0 | 0.2 | GO:0050567 | glutaminyl-tRNA synthase (glutamine-hydrolyzing) activity(GO:0050567) |
| 0.0 | 0.3 | GO:0047493 | sphingomyelin synthase activity(GO:0033188) ceramide cholinephosphotransferase activity(GO:0047493) |
| 0.0 | 0.4 | GO:0019863 | IgE binding(GO:0019863) |
| 0.0 | 0.2 | GO:0048040 | UDP-glucuronate decarboxylase activity(GO:0048040) |
| 0.0 | 0.4 | GO:0046923 | ER retention sequence binding(GO:0046923) |
| 0.0 | 0.3 | GO:0004743 | pyruvate kinase activity(GO:0004743) |
| 0.0 | 0.2 | GO:0016933 | extracellular-glycine-gated ion channel activity(GO:0016933) extracellular-glycine-gated chloride channel activity(GO:0016934) |
| 0.0 | 0.1 | GO:0097604 | temperature-gated cation channel activity(GO:0097604) |
| 0.0 | 0.1 | GO:1990259 | protein-glutamine N-methyltransferase activity(GO:0036009) histone-glutamine methyltransferase activity(GO:1990259) |
| 0.0 | 0.2 | GO:0008523 | sodium-dependent multivitamin transmembrane transporter activity(GO:0008523) |
| 0.0 | 0.5 | GO:1990247 | N6-methyladenosine-containing RNA binding(GO:1990247) |
| 0.0 | 1.1 | GO:0005251 | delayed rectifier potassium channel activity(GO:0005251) |
| 0.0 | 2.1 | GO:0034987 | immunoglobulin receptor binding(GO:0034987) |
| 0.0 | 0.5 | GO:0045159 | myosin II binding(GO:0045159) |
| 0.0 | 0.2 | GO:0035727 | lysophosphatidic acid binding(GO:0035727) |
| 0.0 | 0.2 | GO:0030628 | pre-mRNA 3'-splice site binding(GO:0030628) |
| 0.0 | 0.3 | GO:0016286 | small conductance calcium-activated potassium channel activity(GO:0016286) |
| 0.0 | 0.2 | GO:0034235 | GPI anchor binding(GO:0034235) |
| 0.0 | 0.1 | GO:0004339 | glucan 1,4-alpha-glucosidase activity(GO:0004339) |
| 0.0 | 0.9 | GO:0031418 | L-ascorbic acid binding(GO:0031418) |
| 0.0 | 0.1 | GO:0003989 | acetyl-CoA carboxylase activity(GO:0003989) |
| 0.0 | 0.4 | GO:0017034 | Rap guanyl-nucleotide exchange factor activity(GO:0017034) |
| 0.0 | 0.5 | GO:0008195 | phosphatidate phosphatase activity(GO:0008195) |
| 0.0 | 4.1 | GO:0003823 | antigen binding(GO:0003823) |
| 0.0 | 0.2 | GO:0030274 | LIM domain binding(GO:0030274) |
| 0.0 | 0.9 | GO:0004712 | protein serine/threonine/tyrosine kinase activity(GO:0004712) |
| 0.0 | 1.8 | GO:0004715 | non-membrane spanning protein tyrosine kinase activity(GO:0004715) |
| 0.0 | 0.1 | GO:1990050 | phosphatidic acid transporter activity(GO:1990050) |
| 0.0 | 6.5 | GO:0005516 | calmodulin binding(GO:0005516) |
| 0.0 | 0.4 | GO:0030297 | transmembrane receptor protein tyrosine kinase activator activity(GO:0030297) |
| 0.0 | 0.7 | GO:0017075 | syntaxin-1 binding(GO:0017075) |
| 0.0 | 0.1 | GO:0032767 | copper-dependent protein binding(GO:0032767) |
| 0.0 | 0.1 | GO:0004144 | diacylglycerol O-acyltransferase activity(GO:0004144) |
| 0.0 | 0.1 | GO:0004673 | protein histidine kinase activity(GO:0004673) |
| 0.0 | 2.3 | GO:0008565 | protein transporter activity(GO:0008565) |
| 0.0 | 0.1 | GO:0016724 | ferroxidase activity(GO:0004322) oxidoreductase activity, oxidizing metal ions, oxygen as acceptor(GO:0016724) |
| 0.0 | 0.2 | GO:0008420 | CTD phosphatase activity(GO:0008420) |
| 0.0 | 0.5 | GO:0008143 | poly(A) binding(GO:0008143) poly(U) RNA binding(GO:0008266) |
| 0.0 | 0.0 | GO:0004980 | melanocyte-stimulating hormone receptor activity(GO:0004980) |
| 0.0 | 0.0 | GO:0052815 | medium-chain acyl-CoA hydrolase activity(GO:0052815) long-chain acyl-CoA hydrolase activity(GO:0052816) |
| 0.0 | 0.7 | GO:0000049 | tRNA binding(GO:0000049) |
Gene overrepresentation in curated gene sets: canonical pathways category:
| Log-likelihood per target | Total log-likelihood | Term | Description |
|---|---|---|---|
| 0.1 | 2.8 | PID P38 GAMMA DELTA PATHWAY | Signaling mediated by p38-gamma and p38-delta |
| 0.0 | 1.9 | PID GLYPICAN 1PATHWAY | Glypican 1 network |
| 0.0 | 0.3 | ST TYPE I INTERFERON PATHWAY | Type I Interferon (alpha/beta IFN) Pathway |
| 0.0 | 0.6 | SA B CELL RECEPTOR COMPLEXES | Antigen binding to B cell receptors activates protein tyrosine kinases, such as the Src family, which ultimate activate MAP kinases. |
| 0.0 | 0.4 | SA FAS SIGNALING | The TNF-type receptor Fas induces apoptosis on ligand binding. |
Gene overrepresentation in curated gene sets: REACTOME pathways category:
| Log-likelihood per target | Total log-likelihood | Term | Description |
|---|---|---|---|
| 0.1 | 3.3 | REACTOME FACILITATIVE NA INDEPENDENT GLUCOSE TRANSPORTERS | Genes involved in Facilitative Na+-independent glucose transporters |
| 0.1 | 2.8 | REACTOME ACTIVATED TAK1 MEDIATES P38 MAPK ACTIVATION | Genes involved in activated TAK1 mediates p38 MAPK activation |
| 0.0 | 1.1 | REACTOME KERATAN SULFATE BIOSYNTHESIS | Genes involved in Keratan sulfate biosynthesis |
| 0.0 | 1.6 | REACTOME ANTIGEN ACTIVATES B CELL RECEPTOR LEADING TO GENERATION OF SECOND MESSENGERS | Genes involved in Antigen Activates B Cell Receptor Leading to Generation of Second Messengers |
| 0.0 | 0.4 | REACTOME NFKB ACTIVATION THROUGH FADD RIP1 PATHWAY MEDIATED BY CASPASE 8 AND10 | Genes involved in NF-kB activation through FADD/RIP-1 pathway mediated by caspase-8 and -10 |
| 0.0 | 4.9 | REACTOME SIGNALING BY RHO GTPASES | Genes involved in Signaling by Rho GTPases |
| 0.0 | 1.5 | REACTOME REGULATION OF INSULIN SECRETION BY GLUCAGON LIKE PEPTIDE1 | Genes involved in Regulation of Insulin Secretion by Glucagon-like Peptide-1 |
| 0.0 | 0.2 | REACTOME VITAMIN B5 PANTOTHENATE METABOLISM | Genes involved in Vitamin B5 (pantothenate) metabolism |
| 0.0 | 0.4 | REACTOME AMINO ACID SYNTHESIS AND INTERCONVERSION TRANSAMINATION | Genes involved in Amino acid synthesis and interconversion (transamination) |
| 0.0 | 0.6 | REACTOME ERK MAPK TARGETS | Genes involved in ERK/MAPK targets |
| 0.0 | 0.3 | REACTOME REGULATION OF IFNA SIGNALING | Genes involved in Regulation of IFNA signaling |