Project
Illumina Body Map 2 (GSE30611)
Navigation
Downloads
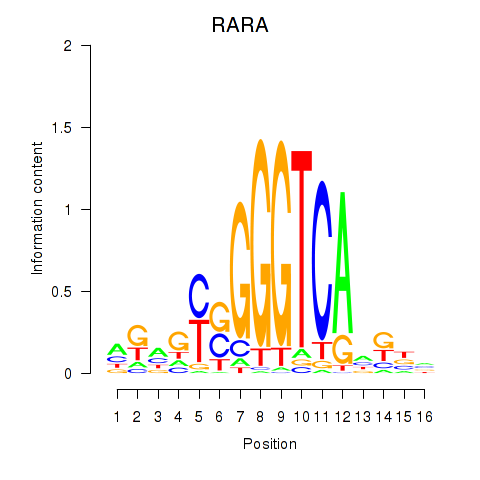
Results for RARA
Z-value: 1.19
Motif logo
Transcription factors associated with RARA
| Gene Symbol | Gene ID | Gene Info |
|---|---|---|
|
RARA
|
ENSG00000131759.18 | retinoic acid receptor alpha |
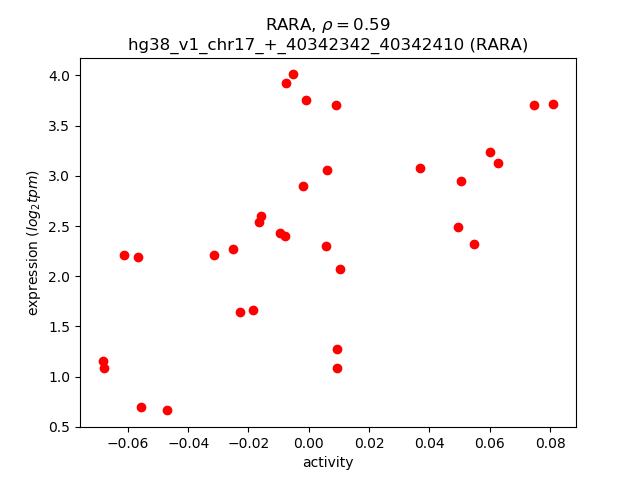
Activity-expression correlation:
| Gene | Promoter | Pearson corr. coef. | P-value | Plot |
|---|---|---|---|---|
| RARA | hg38_v1_chr17_+_40342342_40342410 | 0.59 | 4.0e-04 | Click! |
Activity profile of RARA motif
Sorted Z-values of RARA motif
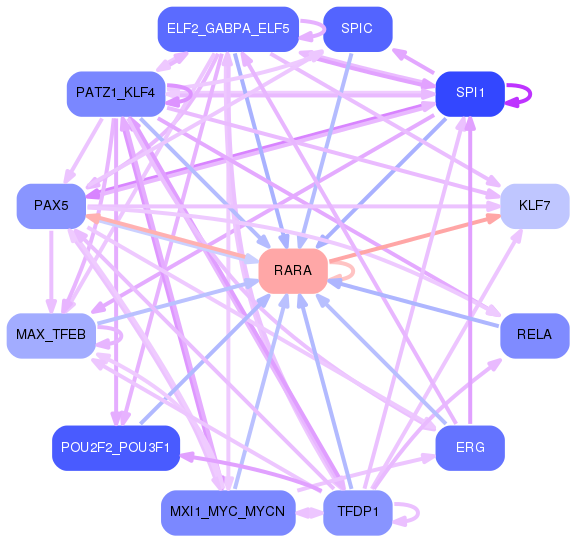
Network of associatons between targets according to the STRING database.

First level regulatory network of RARA
Gene Ontology Analysis
Gene overrepresentation in biological process category:
| Log-likelihood per target | Total log-likelihood | Term | Description |
|---|---|---|---|
| 2.4 | 7.2 | GO:2000309 | positive regulation of tumor necrosis factor (ligand) superfamily member 11 production(GO:2000309) positive regulation of thymocyte migration(GO:2000412) |
| 1.6 | 4.9 | GO:1900155 | regulation of bone trabecula formation(GO:1900154) negative regulation of bone trabecula formation(GO:1900155) |
| 0.8 | 2.4 | GO:0002876 | positive regulation of chronic inflammatory response to antigenic stimulus(GO:0002876) |
| 0.8 | 2.4 | GO:1903721 | regulation of I-kappaB phosphorylation(GO:1903719) positive regulation of I-kappaB phosphorylation(GO:1903721) |
| 0.6 | 5.0 | GO:0002774 | Fc receptor mediated inhibitory signaling pathway(GO:0002774) |
| 0.6 | 2.4 | GO:0002625 | regulation of T cell antigen processing and presentation(GO:0002625) |
| 0.6 | 2.3 | GO:0007113 | endomitotic cell cycle(GO:0007113) |
| 0.6 | 2.3 | GO:0032747 | positive regulation of interleukin-23 production(GO:0032747) |
| 0.6 | 2.8 | GO:2000325 | regulation of ligand-dependent nuclear receptor transcription coactivator activity(GO:2000325) positive regulation of ligand-dependent nuclear receptor transcription coactivator activity(GO:2000327) |
| 0.4 | 2.2 | GO:0002925 | positive regulation of humoral immune response mediated by circulating immunoglobulin(GO:0002925) |
| 0.4 | 1.3 | GO:0050720 | interleukin-1 beta biosynthetic process(GO:0050720) |
| 0.4 | 0.8 | GO:0003192 | mitral valve formation(GO:0003192) |
| 0.4 | 1.2 | GO:1903926 | signal transduction involved in intra-S DNA damage checkpoint(GO:0072428) response to bisphenol A(GO:1903925) cellular response to bisphenol A(GO:1903926) |
| 0.4 | 1.6 | GO:2000196 | positive regulation of female gonad development(GO:2000196) |
| 0.3 | 1.3 | GO:0071348 | cellular response to interleukin-11(GO:0071348) |
| 0.3 | 4.2 | GO:1904715 | negative regulation of chaperone-mediated autophagy(GO:1904715) |
| 0.3 | 2.5 | GO:2000980 | regulation of auditory receptor cell differentiation(GO:0045607) regulation of mechanoreceptor differentiation(GO:0045631) regulation of inner ear receptor cell differentiation(GO:2000980) |
| 0.3 | 1.8 | GO:0014846 | esophagus smooth muscle contraction(GO:0014846) |
| 0.3 | 1.8 | GO:0060332 | positive regulation of response to interferon-gamma(GO:0060332) positive regulation of interferon-gamma-mediated signaling pathway(GO:0060335) |
| 0.3 | 0.9 | GO:0043973 | histone H3-K4 acetylation(GO:0043973) |
| 0.3 | 1.7 | GO:0005985 | sucrose metabolic process(GO:0005985) |
| 0.3 | 0.8 | GO:0071626 | mastication(GO:0071626) learned vocalization behavior(GO:0098583) |
| 0.3 | 0.8 | GO:0060392 | negative regulation of SMAD protein import into nucleus(GO:0060392) |
| 0.2 | 0.7 | GO:0002339 | B cell selection(GO:0002339) apoptotic process involved in embryonic digit morphogenesis(GO:1902263) positive regulation of apoptotic DNA fragmentation(GO:1902512) |
| 0.2 | 1.2 | GO:0035627 | ceramide transport(GO:0035627) |
| 0.2 | 4.8 | GO:0038203 | TORC2 signaling(GO:0038203) |
| 0.2 | 0.7 | GO:0000103 | sulfate assimilation(GO:0000103) |
| 0.2 | 0.7 | GO:0035674 | tricarboxylic acid transmembrane transport(GO:0035674) |
| 0.2 | 0.7 | GO:0099552 | trans-synaptic signaling by lipid, modulating synaptic transmission(GO:0099552) trans-synaptic signaling by endocannabinoid, modulating synaptic transmission(GO:0099553) |
| 0.2 | 4.0 | GO:0070307 | lens fiber cell development(GO:0070307) |
| 0.2 | 1.5 | GO:0010814 | substance P catabolic process(GO:0010814) calcitonin catabolic process(GO:0010816) endothelin maturation(GO:0034959) |
| 0.2 | 1.5 | GO:0015015 | heparan sulfate proteoglycan biosynthetic process, enzymatic modification(GO:0015015) |
| 0.2 | 1.5 | GO:0000432 | regulation of transcription from RNA polymerase II promoter by glucose(GO:0000430) positive regulation of transcription from RNA polymerase II promoter by glucose(GO:0000432) |
| 0.2 | 2.8 | GO:1904714 | regulation of chaperone-mediated autophagy(GO:1904714) |
| 0.2 | 0.6 | GO:0036245 | cellular response to menadione(GO:0036245) |
| 0.2 | 0.6 | GO:0006097 | glyoxylate cycle(GO:0006097) |
| 0.2 | 0.8 | GO:1901857 | positive regulation of cellular respiration(GO:1901857) |
| 0.2 | 0.4 | GO:0031938 | regulation of chromatin silencing at telomere(GO:0031938) |
| 0.2 | 0.6 | GO:0032917 | polyamine acetylation(GO:0032917) spermidine acetylation(GO:0032918) |
| 0.2 | 1.5 | GO:0070942 | neutrophil mediated cytotoxicity(GO:0070942) neutrophil mediated killing of symbiont cell(GO:0070943) neutrophil mediated killing of bacterium(GO:0070944) |
| 0.2 | 0.6 | GO:1904562 | phosphatidylinositol 5-phosphate metabolic process(GO:1904562) |
| 0.2 | 0.9 | GO:0003245 | cardiac muscle tissue growth involved in heart morphogenesis(GO:0003245) |
| 0.2 | 3.0 | GO:0002227 | innate immune response in mucosa(GO:0002227) |
| 0.2 | 0.7 | GO:0032581 | ER-dependent peroxisome organization(GO:0032581) |
| 0.2 | 0.7 | GO:0032904 | viral protein processing(GO:0019082) regulation of nerve growth factor production(GO:0032903) negative regulation of nerve growth factor production(GO:0032904) dibasic protein processing(GO:0090472) |
| 0.2 | 1.7 | GO:0002480 | antigen processing and presentation of exogenous peptide antigen via MHC class I, TAP-independent(GO:0002480) |
| 0.2 | 0.5 | GO:0090080 | positive regulation of MAPKKK cascade by fibroblast growth factor receptor signaling pathway(GO:0090080) |
| 0.2 | 0.8 | GO:0009257 | 10-formyltetrahydrofolate biosynthetic process(GO:0009257) |
| 0.2 | 1.6 | GO:0007217 | tachykinin receptor signaling pathway(GO:0007217) |
| 0.2 | 1.1 | GO:2000782 | regulation of unidimensional cell growth(GO:0051510) negative regulation of unidimensional cell growth(GO:0051511) establishment of cell polarity regulating cell shape(GO:0071964) regulation of establishment or maintenance of cell polarity regulating cell shape(GO:2000769) positive regulation of establishment or maintenance of cell polarity regulating cell shape(GO:2000771) regulation of establishment of cell polarity regulating cell shape(GO:2000782) positive regulation of establishment of cell polarity regulating cell shape(GO:2000784) positive regulation of barbed-end actin filament capping(GO:2000814) |
| 0.2 | 0.6 | GO:0051413 | response to cortisone(GO:0051413) |
| 0.1 | 1.0 | GO:0003363 | lamellipodium assembly involved in ameboidal cell migration(GO:0003363) |
| 0.1 | 0.9 | GO:0060010 | Sertoli cell fate commitment(GO:0060010) |
| 0.1 | 3.4 | GO:0051573 | negative regulation of histone H3-K9 methylation(GO:0051573) |
| 0.1 | 0.4 | GO:0098707 | ferrous iron import into cell(GO:0097460) ferrous iron import across plasma membrane(GO:0098707) |
| 0.1 | 4.1 | GO:1904776 | regulation of protein localization to cell cortex(GO:1904776) positive regulation of protein localization to cell cortex(GO:1904778) |
| 0.1 | 1.4 | GO:0006701 | progesterone biosynthetic process(GO:0006701) |
| 0.1 | 1.7 | GO:0010898 | positive regulation of triglyceride catabolic process(GO:0010898) |
| 0.1 | 0.4 | GO:1903595 | positive regulation of histamine secretion by mast cell(GO:1903595) protein localization to vacuolar membrane(GO:1903778) |
| 0.1 | 0.3 | GO:0031247 | actin rod assembly(GO:0031247) |
| 0.1 | 1.2 | GO:1990928 | response to amino acid starvation(GO:1990928) |
| 0.1 | 0.4 | GO:0002184 | cytoplasmic translational termination(GO:0002184) |
| 0.1 | 0.5 | GO:0032915 | positive regulation of transforming growth factor beta2 production(GO:0032915) |
| 0.1 | 0.8 | GO:0098838 | reduced folate transmembrane transport(GO:0098838) |
| 0.1 | 1.0 | GO:0046102 | inosine metabolic process(GO:0046102) pyridine-containing compound catabolic process(GO:0072526) |
| 0.1 | 0.6 | GO:0009196 | dUDP biosynthetic process(GO:0006227) dTDP biosynthetic process(GO:0006233) pyrimidine nucleoside diphosphate biosynthetic process(GO:0009139) pyrimidine deoxyribonucleoside diphosphate metabolic process(GO:0009196) pyrimidine deoxyribonucleoside diphosphate biosynthetic process(GO:0009197) dTDP metabolic process(GO:0046072) dUDP metabolic process(GO:0046077) |
| 0.1 | 1.4 | GO:0060665 | regulation of branching involved in salivary gland morphogenesis by mesenchymal-epithelial signaling(GO:0060665) negative regulation of hydrogen peroxide-mediated programmed cell death(GO:1901299) |
| 0.1 | 0.8 | GO:0046642 | negative regulation of alpha-beta T cell proliferation(GO:0046642) |
| 0.1 | 0.3 | GO:0060738 | epithelial-mesenchymal signaling involved in prostate gland development(GO:0060738) |
| 0.1 | 0.9 | GO:0006021 | inositol biosynthetic process(GO:0006021) |
| 0.1 | 0.9 | GO:0072733 | response to staurosporine(GO:0072733) cellular response to staurosporine(GO:0072734) |
| 0.1 | 0.7 | GO:0001880 | Mullerian duct regression(GO:0001880) |
| 0.1 | 0.6 | GO:0019060 | intracellular transport of viral protein in host cell(GO:0019060) symbiont intracellular protein transport in host(GO:0030581) intracellular protein transport in other organism involved in symbiotic interaction(GO:0051708) |
| 0.1 | 1.2 | GO:0010533 | regulation of activation of Janus kinase activity(GO:0010533) |
| 0.1 | 0.6 | GO:0050653 | chondroitin sulfate proteoglycan biosynthetic process, polysaccharide chain biosynthetic process(GO:0050653) |
| 0.1 | 1.2 | GO:0002347 | response to tumor cell(GO:0002347) |
| 0.1 | 1.0 | GO:0016139 | glycoside catabolic process(GO:0016139) |
| 0.1 | 0.5 | GO:0009298 | GDP-mannose biosynthetic process(GO:0009298) |
| 0.1 | 1.0 | GO:0006003 | fructose 2,6-bisphosphate metabolic process(GO:0006003) |
| 0.1 | 0.7 | GO:0000727 | double-strand break repair via break-induced replication(GO:0000727) |
| 0.1 | 0.8 | GO:0006880 | intracellular sequestering of iron ion(GO:0006880) sequestering of iron ion(GO:0097577) |
| 0.1 | 0.6 | GO:1900369 | negative regulation of RNA interference(GO:1900369) |
| 0.1 | 0.3 | GO:0021718 | superior olivary nucleus development(GO:0021718) superior olivary nucleus maturation(GO:0021722) |
| 0.1 | 0.4 | GO:0046671 | negative regulation of cellular pH reduction(GO:0032848) CD8-positive, alpha-beta T cell lineage commitment(GO:0043375) negative regulation of retinal cell programmed cell death(GO:0046671) |
| 0.1 | 0.9 | GO:0070995 | NADPH oxidation(GO:0070995) |
| 0.1 | 1.6 | GO:0035630 | bone mineralization involved in bone maturation(GO:0035630) |
| 0.1 | 0.3 | GO:0000350 | generation of catalytic spliceosome for second transesterification step(GO:0000350) positive regulation of vitamin D receptor signaling pathway(GO:0070564) |
| 0.1 | 0.5 | GO:0009212 | dTTP biosynthetic process(GO:0006235) pyrimidine deoxyribonucleoside triphosphate biosynthetic process(GO:0009212) |
| 0.1 | 1.5 | GO:0021520 | spinal cord motor neuron cell fate specification(GO:0021520) |
| 0.1 | 0.3 | GO:0071169 | establishment of protein localization to chromatin(GO:0071169) |
| 0.1 | 13.5 | GO:0006958 | complement activation, classical pathway(GO:0006958) |
| 0.1 | 0.8 | GO:2001206 | positive regulation of osteoclast development(GO:2001206) |
| 0.1 | 0.4 | GO:0046167 | glycerol-3-phosphate biosynthetic process(GO:0046167) |
| 0.1 | 0.3 | GO:1905073 | occluding junction disassembly(GO:1905071) regulation of occluding junction disassembly(GO:1905073) positive regulation of occluding junction disassembly(GO:1905075) |
| 0.1 | 0.2 | GO:0097198 | histone H3-K36 trimethylation(GO:0097198) |
| 0.1 | 0.4 | GO:0006772 | thiamine metabolic process(GO:0006772) |
| 0.1 | 0.4 | GO:0072144 | glomerular mesangial cell development(GO:0072144) |
| 0.1 | 0.5 | GO:0015798 | myo-inositol transport(GO:0015798) |
| 0.1 | 1.0 | GO:0000290 | deadenylation-dependent decapping of nuclear-transcribed mRNA(GO:0000290) |
| 0.1 | 1.7 | GO:0051969 | regulation of transmission of nerve impulse(GO:0051969) |
| 0.1 | 0.5 | GO:0009624 | response to nematode(GO:0009624) |
| 0.1 | 0.2 | GO:0030505 | inorganic diphosphate transport(GO:0030505) |
| 0.1 | 2.1 | GO:0036150 | phosphatidylserine acyl-chain remodeling(GO:0036150) |
| 0.1 | 1.4 | GO:0038166 | angiotensin-activated signaling pathway(GO:0038166) |
| 0.1 | 0.7 | GO:0035897 | proteolysis in other organism(GO:0035897) |
| 0.1 | 0.4 | GO:0097350 | neutrophil clearance(GO:0097350) |
| 0.1 | 1.6 | GO:0035589 | G-protein coupled purinergic nucleotide receptor signaling pathway(GO:0035589) |
| 0.1 | 0.7 | GO:0016554 | cytidine to uridine editing(GO:0016554) |
| 0.1 | 1.6 | GO:1902894 | negative regulation of pri-miRNA transcription from RNA polymerase II promoter(GO:1902894) |
| 0.1 | 0.5 | GO:0090625 | mRNA cleavage involved in gene silencing by siRNA(GO:0090625) |
| 0.1 | 0.8 | GO:0035092 | sperm chromatin condensation(GO:0035092) |
| 0.1 | 0.2 | GO:1903182 | regulation of SUMO transferase activity(GO:1903182) positive regulation of SUMO transferase activity(GO:1903755) |
| 0.1 | 2.1 | GO:0035455 | response to interferon-alpha(GO:0035455) |
| 0.1 | 0.2 | GO:0001545 | primary ovarian follicle growth(GO:0001545) |
| 0.1 | 0.3 | GO:1905224 | clathrin-coated pit assembly(GO:1905224) |
| 0.1 | 0.3 | GO:0046874 | quinolinate biosynthetic process(GO:0019805) quinolinate metabolic process(GO:0046874) |
| 0.1 | 0.5 | GO:0001887 | selenium compound metabolic process(GO:0001887) |
| 0.1 | 0.6 | GO:0018401 | peptidyl-proline hydroxylation to 4-hydroxy-L-proline(GO:0018401) |
| 0.1 | 2.2 | GO:0030511 | positive regulation of transforming growth factor beta receptor signaling pathway(GO:0030511) positive regulation of cellular response to transforming growth factor beta stimulus(GO:1903846) |
| 0.0 | 0.1 | GO:1901301 | regulation of cargo loading into COPII-coated vesicle(GO:1901301) |
| 0.0 | 0.2 | GO:0009443 | pyridoxal 5'-phosphate salvage(GO:0009443) |
| 0.0 | 0.5 | GO:0002943 | tRNA dihydrouridine synthesis(GO:0002943) |
| 0.0 | 0.7 | GO:0017085 | response to insecticide(GO:0017085) |
| 0.0 | 1.4 | GO:0006309 | apoptotic DNA fragmentation(GO:0006309) |
| 0.0 | 0.4 | GO:0010265 | SCF complex assembly(GO:0010265) |
| 0.0 | 0.2 | GO:1901073 | N-acetylglucosamine biosynthetic process(GO:0006045) glucosamine-containing compound biosynthetic process(GO:1901073) |
| 0.0 | 0.4 | GO:1903377 | negative regulation of oxidative stress-induced neuron intrinsic apoptotic signaling pathway(GO:1903377) |
| 0.0 | 0.5 | GO:0030997 | regulation of centriole-centriole cohesion(GO:0030997) |
| 0.0 | 1.6 | GO:0001696 | gastric acid secretion(GO:0001696) |
| 0.0 | 0.4 | GO:0009838 | abscission(GO:0009838) |
| 0.0 | 5.4 | GO:0045454 | cell redox homeostasis(GO:0045454) |
| 0.0 | 0.3 | GO:0000117 | regulation of transcription involved in G2/M transition of mitotic cell cycle(GO:0000117) |
| 0.0 | 0.5 | GO:0051344 | negative regulation of cyclic-nucleotide phosphodiesterase activity(GO:0051344) |
| 0.0 | 2.8 | GO:0032456 | endocytic recycling(GO:0032456) |
| 0.0 | 0.7 | GO:0043568 | positive regulation of insulin-like growth factor receptor signaling pathway(GO:0043568) |
| 0.0 | 5.2 | GO:0001909 | leukocyte mediated cytotoxicity(GO:0001909) |
| 0.0 | 0.4 | GO:1902231 | positive regulation of intrinsic apoptotic signaling pathway in response to DNA damage(GO:1902231) |
| 0.0 | 0.5 | GO:0043951 | negative regulation of cAMP-mediated signaling(GO:0043951) |
| 0.0 | 0.3 | GO:0006651 | diacylglycerol biosynthetic process(GO:0006651) |
| 0.0 | 0.6 | GO:0035269 | protein O-linked mannosylation(GO:0035269) |
| 0.0 | 1.1 | GO:0002115 | store-operated calcium entry(GO:0002115) |
| 0.0 | 0.7 | GO:0035970 | peptidyl-threonine dephosphorylation(GO:0035970) |
| 0.0 | 4.8 | GO:0031295 | T cell costimulation(GO:0031295) |
| 0.0 | 0.8 | GO:0090050 | positive regulation of cell migration involved in sprouting angiogenesis(GO:0090050) |
| 0.0 | 0.4 | GO:0018344 | protein geranylgeranylation(GO:0018344) |
| 0.0 | 0.1 | GO:0048073 | regulation of eye pigmentation(GO:0048073) |
| 0.0 | 0.2 | GO:0021650 | vestibulocochlear nerve formation(GO:0021650) |
| 0.0 | 0.2 | GO:0051697 | protein delipidation(GO:0051697) |
| 0.0 | 0.5 | GO:0031507 | heterochromatin assembly(GO:0031507) |
| 0.0 | 1.2 | GO:0042347 | negative regulation of NF-kappaB import into nucleus(GO:0042347) |
| 0.0 | 0.2 | GO:0014038 | regulation of Schwann cell differentiation(GO:0014038) |
| 0.0 | 0.4 | GO:0051388 | positive regulation of neurotrophin TRK receptor signaling pathway(GO:0051388) |
| 0.0 | 0.6 | GO:0034587 | piRNA metabolic process(GO:0034587) |
| 0.0 | 0.1 | GO:0090235 | regulation of metaphase plate congression(GO:0090235) |
| 0.0 | 0.4 | GO:0060992 | response to fungicide(GO:0060992) |
| 0.0 | 0.1 | GO:1901052 | sarcosine metabolic process(GO:1901052) sarcosine catabolic process(GO:1901053) |
| 0.0 | 0.6 | GO:0016540 | protein autoprocessing(GO:0016540) |
| 0.0 | 0.4 | GO:0010216 | maintenance of DNA methylation(GO:0010216) |
| 0.0 | 0.1 | GO:0006391 | transcription initiation from mitochondrial promoter(GO:0006391) |
| 0.0 | 0.9 | GO:1902603 | carnitine transmembrane transport(GO:1902603) |
| 0.0 | 0.5 | GO:0050930 | induction of positive chemotaxis(GO:0050930) |
| 0.0 | 3.2 | GO:0048010 | vascular endothelial growth factor receptor signaling pathway(GO:0048010) |
| 0.0 | 0.5 | GO:0040034 | regulation of development, heterochronic(GO:0040034) regulation of timing of cell differentiation(GO:0048505) |
| 0.0 | 0.1 | GO:0001180 | transcription initiation from RNA polymerase I promoter for nuclear large rRNA transcript(GO:0001180) |
| 0.0 | 0.2 | GO:0046643 | regulation of gamma-delta T cell differentiation(GO:0045586) regulation of gamma-delta T cell activation(GO:0046643) |
| 0.0 | 1.0 | GO:0006295 | nucleotide-excision repair, DNA incision, 3'-to lesion(GO:0006295) |
| 0.0 | 0.1 | GO:0043686 | co-translational protein modification(GO:0043686) |
| 0.0 | 0.6 | GO:0006363 | termination of RNA polymerase I transcription(GO:0006363) |
| 0.0 | 0.2 | GO:0001712 | ectodermal cell fate commitment(GO:0001712) |
| 0.0 | 2.8 | GO:0042795 | snRNA transcription(GO:0009301) snRNA transcription from RNA polymerase II promoter(GO:0042795) |
| 0.0 | 0.5 | GO:0040015 | negative regulation of multicellular organism growth(GO:0040015) |
| 0.0 | 0.3 | GO:0021535 | cell migration in hindbrain(GO:0021535) |
| 0.0 | 0.3 | GO:1990403 | embryonic brain development(GO:1990403) |
| 0.0 | 0.5 | GO:0048757 | endosome to melanosome transport(GO:0035646) endosome to pigment granule transport(GO:0043485) pigment granule maturation(GO:0048757) |
| 0.0 | 1.5 | GO:0043551 | regulation of phosphatidylinositol 3-kinase activity(GO:0043551) |
| 0.0 | 0.8 | GO:0045332 | phospholipid translocation(GO:0045332) |
| 0.0 | 0.3 | GO:0014894 | response to muscle inactivity involved in regulation of muscle adaptation(GO:0014877) response to denervation involved in regulation of muscle adaptation(GO:0014894) |
| 0.0 | 1.0 | GO:0043252 | sodium-independent organic anion transport(GO:0043252) |
| 0.0 | 1.4 | GO:0010501 | RNA secondary structure unwinding(GO:0010501) |
| 0.0 | 0.1 | GO:0051464 | positive regulation of cortisol secretion(GO:0051464) positive regulation of glucocorticoid secretion(GO:2000851) |
| 0.0 | 0.1 | GO:0071921 | establishment of sister chromatid cohesion(GO:0034085) cohesin loading(GO:0071921) regulation of cohesin loading(GO:0071922) |
| 0.0 | 0.8 | GO:1902236 | negative regulation of endoplasmic reticulum stress-induced intrinsic apoptotic signaling pathway(GO:1902236) |
| 0.0 | 0.2 | GO:1903003 | positive regulation of protein deubiquitination(GO:1903003) |
| 0.0 | 0.1 | GO:0048861 | leukemia inhibitory factor signaling pathway(GO:0048861) |
| 0.0 | 0.4 | GO:0097094 | craniofacial suture morphogenesis(GO:0097094) |
| 0.0 | 2.8 | GO:0043154 | negative regulation of cysteine-type endopeptidase activity involved in apoptotic process(GO:0043154) |
| 0.0 | 0.4 | GO:0016973 | poly(A)+ mRNA export from nucleus(GO:0016973) |
| 0.0 | 0.3 | GO:0051256 | mitotic spindle midzone assembly(GO:0051256) |
| 0.0 | 0.2 | GO:0015808 | L-alanine transport(GO:0015808) |
| 0.0 | 0.8 | GO:0000188 | inactivation of MAPK activity(GO:0000188) |
| 0.0 | 0.1 | GO:2000270 | negative regulation of fibroblast apoptotic process(GO:2000270) |
| 0.0 | 1.6 | GO:0000380 | alternative mRNA splicing, via spliceosome(GO:0000380) |
| 0.0 | 0.3 | GO:0033327 | Leydig cell differentiation(GO:0033327) |
| 0.0 | 2.9 | GO:0007229 | integrin-mediated signaling pathway(GO:0007229) |
| 0.0 | 0.4 | GO:0050961 | detection of temperature stimulus involved in sensory perception(GO:0050961) detection of temperature stimulus involved in sensory perception of pain(GO:0050965) |
| 0.0 | 0.5 | GO:0006465 | signal peptide processing(GO:0006465) |
| 0.0 | 0.3 | GO:0048096 | chromatin-mediated maintenance of transcription(GO:0048096) |
| 0.0 | 0.4 | GO:0090141 | positive regulation of mitochondrial fission(GO:0090141) |
| 0.0 | 0.2 | GO:0036066 | protein O-linked fucosylation(GO:0036066) |
| 0.0 | 0.1 | GO:2000124 | regulation of endocannabinoid signaling pathway(GO:2000124) |
| 0.0 | 0.2 | GO:0006089 | lactate metabolic process(GO:0006089) |
| 0.0 | 0.0 | GO:0060128 | corticotropin hormone secreting cell differentiation(GO:0060128) |
| 0.0 | 0.2 | GO:0019530 | taurine metabolic process(GO:0019530) |
| 0.0 | 0.0 | GO:0072179 | nephric duct formation(GO:0072179) |
| 0.0 | 0.5 | GO:0044458 | motile cilium assembly(GO:0044458) |
| 0.0 | 0.3 | GO:0043508 | negative regulation of JUN kinase activity(GO:0043508) |
| 0.0 | 0.7 | GO:0036092 | phosphatidylinositol-3-phosphate biosynthetic process(GO:0036092) |
| 0.0 | 1.5 | GO:1902017 | regulation of cilium assembly(GO:1902017) |
| 0.0 | 0.1 | GO:0045218 | zonula adherens maintenance(GO:0045218) |
| 0.0 | 3.1 | GO:0048813 | dendrite morphogenesis(GO:0048813) |
| 0.0 | 0.6 | GO:0007140 | male meiosis(GO:0007140) |
| 0.0 | 0.2 | GO:0045003 | DNA recombinase assembly(GO:0000730) double-strand break repair via synthesis-dependent strand annealing(GO:0045003) |
Gene overrepresentation in cellular component category:
| Log-likelihood per target | Total log-likelihood | Term | Description |
|---|---|---|---|
| 2.4 | 7.2 | GO:0071065 | alpha9-beta1 integrin-vascular cell adhesion molecule-1 complex(GO:0071065) |
| 0.5 | 2.2 | GO:0005944 | phosphatidylinositol 3-kinase complex, class IB(GO:0005944) |
| 0.5 | 4.7 | GO:0098575 | lumenal side of lysosomal membrane(GO:0098575) |
| 0.4 | 1.8 | GO:0097057 | TRAF2-GSTP1 complex(GO:0097057) |
| 0.4 | 2.8 | GO:0070876 | SOSS complex(GO:0070876) |
| 0.2 | 4.8 | GO:0098574 | cytoplasmic side of lysosomal membrane(GO:0098574) |
| 0.2 | 1.5 | GO:0031302 | intrinsic component of endosome membrane(GO:0031302) |
| 0.2 | 0.8 | GO:0070288 | intracellular ferritin complex(GO:0008043) ferritin complex(GO:0070288) |
| 0.2 | 0.7 | GO:0030895 | apolipoprotein B mRNA editing enzyme complex(GO:0030895) |
| 0.2 | 4.8 | GO:0031932 | TORC2 complex(GO:0031932) |
| 0.2 | 0.5 | GO:0097224 | sperm connecting piece(GO:0097224) |
| 0.2 | 2.8 | GO:0030015 | CCR4-NOT core complex(GO:0030015) |
| 0.2 | 1.6 | GO:0065010 | extracellular membrane-bounded organelle(GO:0065010) |
| 0.2 | 1.7 | GO:0042612 | MHC class I protein complex(GO:0042612) |
| 0.1 | 1.4 | GO:0019907 | cyclin-dependent protein kinase activating kinase holoenzyme complex(GO:0019907) |
| 0.1 | 0.4 | GO:0030936 | collagen type XIII trimer(GO:0005600) transmembrane collagen trimer(GO:0030936) |
| 0.1 | 0.4 | GO:0036387 | nuclear pre-replicative complex(GO:0005656) pre-replicative complex(GO:0036387) |
| 0.1 | 0.4 | GO:0018444 | translation release factor complex(GO:0018444) |
| 0.1 | 0.6 | GO:0036502 | Derlin-1-VIMP complex(GO:0036502) |
| 0.1 | 4.1 | GO:0014731 | spectrin-associated cytoskeleton(GO:0014731) |
| 0.1 | 1.2 | GO:0044194 | cytolytic granule(GO:0044194) |
| 0.1 | 1.4 | GO:0071541 | eukaryotic translation initiation factor 3 complex, eIF3m(GO:0071541) |
| 0.1 | 0.9 | GO:0030121 | AP-1 adaptor complex(GO:0030121) |
| 0.1 | 0.6 | GO:0000120 | RNA polymerase I transcription factor complex(GO:0000120) |
| 0.1 | 13.2 | GO:0035578 | azurophil granule lumen(GO:0035578) |
| 0.1 | 0.9 | GO:0070449 | elongin complex(GO:0070449) |
| 0.1 | 2.0 | GO:0032433 | filopodium tip(GO:0032433) |
| 0.1 | 1.4 | GO:0042613 | MHC class II protein complex(GO:0042613) |
| 0.1 | 0.6 | GO:0044530 | supraspliceosomal complex(GO:0044530) |
| 0.1 | 0.7 | GO:0000808 | origin recognition complex(GO:0000808) nuclear origin of replication recognition complex(GO:0005664) |
| 0.1 | 0.4 | GO:0005968 | Rab-protein geranylgeranyltransferase complex(GO:0005968) |
| 0.1 | 0.7 | GO:0071986 | Ragulator complex(GO:0071986) |
| 0.1 | 0.2 | GO:0071001 | U4/U6 snRNP(GO:0071001) |
| 0.1 | 1.0 | GO:0044327 | dendritic spine head(GO:0044327) |
| 0.1 | 3.5 | GO:0042571 | immunoglobulin complex, circulating(GO:0042571) |
| 0.1 | 1.4 | GO:0016281 | eukaryotic translation initiation factor 4F complex(GO:0016281) |
| 0.1 | 0.7 | GO:0042567 | insulin-like growth factor ternary complex(GO:0042567) |
| 0.1 | 0.7 | GO:0097136 | Bcl-2 family protein complex(GO:0097136) |
| 0.1 | 1.2 | GO:0016442 | RISC complex(GO:0016442) RNAi effector complex(GO:0031332) |
| 0.1 | 0.3 | GO:0016533 | cyclin-dependent protein kinase 5 holoenzyme complex(GO:0016533) |
| 0.1 | 0.2 | GO:1990356 | sumoylated E2 ligase complex(GO:1990356) |
| 0.1 | 1.0 | GO:0097433 | dense body(GO:0097433) |
| 0.0 | 0.5 | GO:0030915 | Smc5-Smc6 complex(GO:0030915) |
| 0.0 | 6.1 | GO:0101003 | ficolin-1-rich granule membrane(GO:0101003) |
| 0.0 | 0.5 | GO:0042382 | paraspeckles(GO:0042382) |
| 0.0 | 0.1 | GO:0031085 | BLOC-3 complex(GO:0031085) |
| 0.0 | 0.2 | GO:0097125 | cyclin B1-CDK1 complex(GO:0097125) |
| 0.0 | 0.3 | GO:0034991 | nuclear meiotic cohesin complex(GO:0034991) |
| 0.0 | 0.9 | GO:0034663 | endoplasmic reticulum chaperone complex(GO:0034663) |
| 0.0 | 0.5 | GO:0005787 | signal peptidase complex(GO:0005787) |
| 0.0 | 0.2 | GO:0032798 | Swi5-Sfr1 complex(GO:0032798) |
| 0.0 | 0.4 | GO:0030896 | checkpoint clamp complex(GO:0030896) |
| 0.0 | 1.1 | GO:0097038 | perinuclear endoplasmic reticulum(GO:0097038) |
| 0.0 | 0.5 | GO:0005672 | transcription factor TFIIA complex(GO:0005672) |
| 0.0 | 3.5 | GO:1904724 | tertiary granule lumen(GO:1904724) |
| 0.0 | 0.1 | GO:0005900 | oncostatin-M receptor complex(GO:0005900) |
| 0.0 | 0.3 | GO:0070022 | transforming growth factor beta receptor homodimeric complex(GO:0070022) |
| 0.0 | 0.4 | GO:1990712 | HFE-transferrin receptor complex(GO:1990712) |
| 0.0 | 0.1 | GO:0032937 | SREBP-SCAP-Insig complex(GO:0032937) |
| 0.0 | 0.4 | GO:0016589 | NURF complex(GO:0016589) |
| 0.0 | 0.4 | GO:0016602 | CCAAT-binding factor complex(GO:0016602) |
| 0.0 | 0.6 | GO:0060293 | P granule(GO:0043186) pole plasm(GO:0045495) germ plasm(GO:0060293) |
| 0.0 | 0.2 | GO:0000110 | nucleotide-excision repair factor 1 complex(GO:0000110) |
| 0.0 | 0.9 | GO:0005721 | pericentric heterochromatin(GO:0005721) |
| 0.0 | 0.3 | GO:0042788 | polysomal ribosome(GO:0042788) |
| 0.0 | 0.4 | GO:0010369 | chromocenter(GO:0010369) |
| 0.0 | 0.7 | GO:0071141 | SMAD protein complex(GO:0071141) |
| 0.0 | 2.6 | GO:0005758 | mitochondrial intermembrane space(GO:0005758) |
| 0.0 | 0.4 | GO:0097427 | microtubule bundle(GO:0097427) |
| 0.0 | 2.8 | GO:0097517 | stress fiber(GO:0001725) contractile actin filament bundle(GO:0097517) |
| 0.0 | 1.7 | GO:0035577 | azurophil granule membrane(GO:0035577) |
| 0.0 | 1.3 | GO:0045171 | intercellular bridge(GO:0045171) |
| 0.0 | 0.5 | GO:0046930 | pore complex(GO:0046930) |
| 0.0 | 0.7 | GO:0044322 | endoplasmic reticulum quality control compartment(GO:0044322) |
| 0.0 | 1.7 | GO:0031093 | platelet alpha granule lumen(GO:0031093) |
| 0.0 | 0.4 | GO:0000346 | transcription export complex(GO:0000346) |
| 0.0 | 0.0 | GO:0036454 | insulin-like growth factor binding protein complex(GO:0016942) growth factor complex(GO:0036454) |
| 0.0 | 3.1 | GO:0001650 | fibrillar center(GO:0001650) |
| 0.0 | 1.5 | GO:0005811 | lipid particle(GO:0005811) |
| 0.0 | 0.4 | GO:0035145 | exon-exon junction complex(GO:0035145) |
| 0.0 | 2.6 | GO:0030175 | filopodium(GO:0030175) |
| 0.0 | 1.4 | GO:0032588 | trans-Golgi network membrane(GO:0032588) |
| 0.0 | 0.9 | GO:0030173 | integral component of Golgi membrane(GO:0030173) |
| 0.0 | 0.3 | GO:0005671 | Ada2/Gcn5/Ada3 transcription activator complex(GO:0005671) |
Gene overrepresentation in molecular function category:
| Log-likelihood per target | Total log-likelihood | Term | Description |
|---|---|---|---|
| 0.6 | 5.0 | GO:0032396 | MHC class Ib protein binding(GO:0023029) inhibitory MHC class I receptor activity(GO:0032396) |
| 0.6 | 1.8 | GO:0005174 | CD40 receptor binding(GO:0005174) |
| 0.6 | 2.3 | GO:0008427 | calcium-dependent protein kinase inhibitor activity(GO:0008427) |
| 0.6 | 1.7 | GO:0016154 | thymidine phosphorylase activity(GO:0009032) pyrimidine-nucleoside phosphorylase activity(GO:0016154) |
| 0.6 | 1.7 | GO:0004574 | oligo-1,6-glucosidase activity(GO:0004574) |
| 0.5 | 1.6 | GO:0031755 | endothelial differentiation G-protein coupled receptor binding(GO:0031753) Edg-2 lysophosphatidic acid receptor binding(GO:0031755) |
| 0.5 | 4.0 | GO:1990254 | keratin filament binding(GO:1990254) |
| 0.5 | 1.4 | GO:0004531 | deoxyribonuclease II activity(GO:0004531) |
| 0.4 | 2.1 | GO:0004905 | type I interferon receptor activity(GO:0004905) |
| 0.4 | 1.2 | GO:0036134 | thromboxane-A synthase activity(GO:0004796) 12-hydroxyheptadecatrienoic acid synthase activity(GO:0036134) |
| 0.4 | 4.9 | GO:0016015 | morphogen activity(GO:0016015) |
| 0.3 | 1.0 | GO:0016936 | galactoside binding(GO:0016936) |
| 0.3 | 5.3 | GO:0016997 | exo-alpha-sialidase activity(GO:0004308) alpha-sialidase activity(GO:0016997) |
| 0.3 | 1.3 | GO:0050211 | procollagen galactosyltransferase activity(GO:0050211) |
| 0.3 | 0.8 | GO:0008330 | protein tyrosine/threonine phosphatase activity(GO:0008330) |
| 0.2 | 1.0 | GO:0002060 | purine nucleobase binding(GO:0002060) |
| 0.2 | 1.2 | GO:0017089 | glycolipid transporter activity(GO:0017089) |
| 0.2 | 2.2 | GO:0019863 | IgE binding(GO:0019863) |
| 0.2 | 0.9 | GO:0047192 | 1-alkylglycerophosphocholine O-acetyltransferase activity(GO:0047192) |
| 0.2 | 1.5 | GO:0008467 | [heparan sulfate]-glucosamine 3-sulfotransferase 1 activity(GO:0008467) |
| 0.2 | 1.8 | GO:0004609 | phosphatidylserine decarboxylase activity(GO:0004609) |
| 0.2 | 0.6 | GO:0004450 | isocitrate dehydrogenase (NADP+) activity(GO:0004450) (R)-2-hydroxyglutarate dehydrogenase activity(GO:0051990) |
| 0.2 | 1.8 | GO:0008449 | N-acetylglucosamine-6-sulfatase activity(GO:0008449) |
| 0.2 | 1.4 | GO:0004945 | angiotensin receptor activity(GO:0001595) angiotensin type II receptor activity(GO:0004945) |
| 0.2 | 0.6 | GO:0004145 | diamine N-acetyltransferase activity(GO:0004145) |
| 0.2 | 4.6 | GO:0030215 | semaphorin receptor binding(GO:0030215) |
| 0.2 | 0.7 | GO:0004949 | cannabinoid receptor activity(GO:0004949) |
| 0.2 | 0.5 | GO:0004615 | phosphomannomutase activity(GO:0004615) |
| 0.2 | 0.5 | GO:0047389 | glycerophosphocholine phosphodiesterase activity(GO:0047389) |
| 0.2 | 0.8 | GO:0004329 | formate-tetrahydrofolate ligase activity(GO:0004329) |
| 0.1 | 0.9 | GO:0005275 | amine transmembrane transporter activity(GO:0005275) |
| 0.1 | 2.2 | GO:0046935 | 1-phosphatidylinositol-3-kinase regulator activity(GO:0046935) |
| 0.1 | 0.4 | GO:0004998 | transferrin receptor activity(GO:0004998) |
| 0.1 | 0.4 | GO:0090541 | MIT domain binding(GO:0090541) |
| 0.1 | 1.6 | GO:0004969 | histamine receptor activity(GO:0004969) |
| 0.1 | 0.9 | GO:0004499 | N,N-dimethylaniline monooxygenase activity(GO:0004499) |
| 0.1 | 0.8 | GO:0008518 | reduced folate carrier activity(GO:0008518) |
| 0.1 | 1.2 | GO:0001665 | alpha-N-acetylgalactosaminide alpha-2,6-sialyltransferase activity(GO:0001665) |
| 0.1 | 0.6 | GO:0004798 | thymidylate kinase activity(GO:0004798) |
| 0.1 | 0.7 | GO:0015137 | citrate transmembrane transporter activity(GO:0015137) tricarboxylic acid transmembrane transporter activity(GO:0015142) |
| 0.1 | 0.7 | GO:0004534 | 5'-3' exoribonuclease activity(GO:0004534) |
| 0.1 | 1.2 | GO:0030348 | syntaxin-3 binding(GO:0030348) |
| 0.1 | 0.8 | GO:1990050 | phosphatidic acid transporter activity(GO:1990050) |
| 0.1 | 0.3 | GO:0030350 | iron-responsive element binding(GO:0030350) |
| 0.1 | 1.0 | GO:0003873 | 6-phosphofructo-2-kinase activity(GO:0003873) |
| 0.1 | 0.6 | GO:0004645 | phosphorylase activity(GO:0004645) |
| 0.1 | 1.7 | GO:0030881 | beta-2-microglobulin binding(GO:0030881) |
| 0.1 | 1.2 | GO:0008142 | oxysterol binding(GO:0008142) |
| 0.1 | 12.5 | GO:0043621 | protein self-association(GO:0043621) |
| 0.1 | 0.3 | GO:0016534 | cyclin-dependent protein kinase 5 activator activity(GO:0016534) |
| 0.1 | 0.6 | GO:0004169 | dolichyl-phosphate-mannose-protein mannosyltransferase activity(GO:0004169) |
| 0.1 | 1.1 | GO:0015279 | store-operated calcium channel activity(GO:0015279) |
| 0.1 | 0.4 | GO:0004802 | transketolase activity(GO:0004802) |
| 0.1 | 0.1 | GO:0070363 | mitochondrial light strand promoter sense binding(GO:0070363) |
| 0.1 | 1.2 | GO:0051434 | BH3 domain binding(GO:0051434) |
| 0.1 | 1.4 | GO:0032395 | MHC class II receptor activity(GO:0032395) |
| 0.1 | 0.5 | GO:0008422 | beta-glucosidase activity(GO:0008422) |
| 0.1 | 3.1 | GO:0003746 | translation elongation factor activity(GO:0003746) |
| 0.1 | 0.2 | GO:0005026 | transforming growth factor beta receptor activity, type II(GO:0005026) |
| 0.1 | 0.9 | GO:0038036 | sphingosine-1-phosphate receptor activity(GO:0038036) |
| 0.1 | 0.4 | GO:0004370 | glycerol kinase activity(GO:0004370) |
| 0.1 | 2.9 | GO:0005545 | 1-phosphatidylinositol binding(GO:0005545) |
| 0.1 | 0.6 | GO:0000285 | 1-phosphatidylinositol-3-phosphate 5-kinase activity(GO:0000285) |
| 0.1 | 0.9 | GO:0044323 | retinoic acid-responsive element binding(GO:0044323) |
| 0.1 | 0.9 | GO:0019534 | toxin transporter activity(GO:0019534) |
| 0.1 | 0.5 | GO:0005166 | neurotrophin p75 receptor binding(GO:0005166) |
| 0.1 | 0.6 | GO:0047238 | glucuronylgalactosylproteoglycan 4-beta-N-acetylgalactosaminyltransferase activity(GO:0047237) glucuronosyl-N-acetylgalactosaminyl-proteoglycan 4-beta-N-acetylgalactosaminyltransferase activity(GO:0047238) |
| 0.1 | 1.6 | GO:0001608 | G-protein coupled nucleotide receptor activity(GO:0001608) G-protein coupled purinergic nucleotide receptor activity(GO:0045028) |
| 0.1 | 0.6 | GO:0003726 | double-stranded RNA adenosine deaminase activity(GO:0003726) |
| 0.1 | 15.0 | GO:0003823 | antigen binding(GO:0003823) |
| 0.1 | 0.5 | GO:0008269 | JAK pathway signal transduction adaptor activity(GO:0008269) |
| 0.1 | 0.4 | GO:0030618 | transforming growth factor beta receptor, pathway-specific cytoplasmic mediator activity(GO:0030618) |
| 0.1 | 0.6 | GO:0046703 | natural killer cell lectin-like receptor binding(GO:0046703) |
| 0.1 | 0.6 | GO:0003958 | NADPH-hemoprotein reductase activity(GO:0003958) |
| 0.1 | 0.2 | GO:0052816 | medium-chain acyl-CoA hydrolase activity(GO:0052815) long-chain acyl-CoA hydrolase activity(GO:0052816) |
| 0.1 | 0.7 | GO:0001727 | lipid kinase activity(GO:0001727) |
| 0.1 | 1.7 | GO:0003756 | protein disulfide isomerase activity(GO:0003756) intramolecular oxidoreductase activity, transposing S-S bonds(GO:0016864) |
| 0.1 | 0.6 | GO:0019826 | oxygen sensor activity(GO:0019826) |
| 0.1 | 0.9 | GO:0017017 | MAP kinase tyrosine/serine/threonine phosphatase activity(GO:0017017) |
| 0.1 | 0.2 | GO:0061656 | SUMO conjugating enzyme activity(GO:0061656) |
| 0.1 | 0.7 | GO:0008160 | protein tyrosine phosphatase activator activity(GO:0008160) |
| 0.1 | 0.7 | GO:0008420 | CTD phosphatase activity(GO:0008420) |
| 0.1 | 0.2 | GO:0004963 | follicle-stimulating hormone receptor activity(GO:0004963) |
| 0.0 | 0.7 | GO:0048406 | nerve growth factor binding(GO:0048406) |
| 0.0 | 0.2 | GO:0008478 | pyridoxal kinase activity(GO:0008478) |
| 0.0 | 0.5 | GO:0017150 | tRNA dihydrouridine synthase activity(GO:0017150) |
| 0.0 | 0.6 | GO:0030235 | nitric-oxide synthase regulator activity(GO:0030235) |
| 0.0 | 2.4 | GO:0005164 | tumor necrosis factor receptor binding(GO:0005164) |
| 0.0 | 1.7 | GO:0004806 | triglyceride lipase activity(GO:0004806) |
| 0.0 | 0.4 | GO:0008853 | exodeoxyribonuclease III activity(GO:0008853) |
| 0.0 | 0.2 | GO:0004803 | transposase activity(GO:0004803) |
| 0.0 | 0.2 | GO:0004492 | methylmalonyl-CoA decarboxylase activity(GO:0004492) |
| 0.0 | 1.3 | GO:0043395 | heparan sulfate proteoglycan binding(GO:0043395) |
| 0.0 | 2.5 | GO:0043027 | cysteine-type endopeptidase inhibitor activity involved in apoptotic process(GO:0043027) |
| 0.0 | 1.4 | GO:0000339 | RNA cap binding(GO:0000339) |
| 0.0 | 2.0 | GO:0004198 | calcium-dependent cysteine-type endopeptidase activity(GO:0004198) |
| 0.0 | 0.8 | GO:0008199 | ferric iron binding(GO:0008199) |
| 0.0 | 0.4 | GO:0046974 | histone methyltransferase activity (H3-K9 specific)(GO:0046974) |
| 0.0 | 0.2 | GO:0035529 | NADH pyrophosphatase activity(GO:0035529) |
| 0.0 | 1.4 | GO:0043274 | phospholipase binding(GO:0043274) |
| 0.0 | 0.5 | GO:0032027 | myosin light chain binding(GO:0032027) |
| 0.0 | 0.5 | GO:0070181 | polyol transmembrane transporter activity(GO:0015166) small ribosomal subunit rRNA binding(GO:0070181) |
| 0.0 | 3.0 | GO:0005160 | transforming growth factor beta receptor binding(GO:0005160) |
| 0.0 | 1.2 | GO:0008190 | eukaryotic initiation factor 4E binding(GO:0008190) |
| 0.0 | 2.4 | GO:0050699 | WW domain binding(GO:0050699) |
| 0.0 | 1.8 | GO:0043014 | alpha-tubulin binding(GO:0043014) |
| 0.0 | 0.9 | GO:0051864 | histone demethylase activity (H3-K36 specific)(GO:0051864) |
| 0.0 | 0.8 | GO:0001222 | transcription corepressor binding(GO:0001222) |
| 0.0 | 0.3 | GO:0004144 | diacylglycerol O-acyltransferase activity(GO:0004144) |
| 0.0 | 0.9 | GO:0031078 | histone deacetylase activity (H3-K14 specific)(GO:0031078) NAD-dependent histone deacetylase activity (H3-K14 specific)(GO:0032041) |
| 0.0 | 0.2 | GO:0004966 | galanin receptor activity(GO:0004966) |
| 0.0 | 0.5 | GO:0004559 | alpha-mannosidase activity(GO:0004559) |
| 0.0 | 0.9 | GO:0004012 | phospholipid-translocating ATPase activity(GO:0004012) |
| 0.0 | 0.1 | GO:0008480 | sarcosine dehydrogenase activity(GO:0008480) |
| 0.0 | 0.1 | GO:0004923 | leukemia inhibitory factor receptor activity(GO:0004923) |
| 0.0 | 1.3 | GO:0042056 | chemoattractant activity(GO:0042056) |
| 0.0 | 1.0 | GO:0008239 | dipeptidyl-peptidase activity(GO:0008239) |
| 0.0 | 0.9 | GO:0097200 | cysteine-type endopeptidase activity involved in execution phase of apoptosis(GO:0097200) |
| 0.0 | 0.6 | GO:0042288 | MHC class I protein binding(GO:0042288) |
| 0.0 | 1.5 | GO:0017046 | peptide hormone binding(GO:0017046) |
| 0.0 | 0.8 | GO:0005035 | tumor necrosis factor-activated receptor activity(GO:0005031) death receptor activity(GO:0005035) |
| 0.0 | 0.2 | GO:0030621 | U4 snRNA binding(GO:0030621) |
| 0.0 | 0.3 | GO:0097371 | MDM2/MDM4 family protein binding(GO:0097371) |
| 0.0 | 0.5 | GO:0017162 | aryl hydrocarbon receptor binding(GO:0017162) |
| 0.0 | 0.5 | GO:0035198 | miRNA binding(GO:0035198) |
| 0.0 | 0.5 | GO:0070492 | oligosaccharide binding(GO:0070492) |
| 0.0 | 4.3 | GO:0003697 | single-stranded DNA binding(GO:0003697) |
| 0.0 | 0.4 | GO:0004887 | thyroid hormone receptor activity(GO:0004887) |
| 0.0 | 1.3 | GO:0071889 | 14-3-3 protein binding(GO:0071889) |
| 0.0 | 0.3 | GO:0046790 | virion binding(GO:0046790) |
| 0.0 | 3.0 | GO:0005070 | SH3/SH2 adaptor activity(GO:0005070) |
| 0.0 | 1.5 | GO:0043425 | bHLH transcription factor binding(GO:0043425) |
| 0.0 | 0.8 | GO:0070566 | adenylyltransferase activity(GO:0070566) |
| 0.0 | 0.2 | GO:0004459 | L-lactate dehydrogenase activity(GO:0004459) |
| 0.0 | 15.4 | GO:0000982 | transcription factor activity, RNA polymerase II core promoter proximal region sequence-specific binding(GO:0000982) |
| 0.0 | 0.2 | GO:0046975 | histone methyltransferase activity (H3-K36 specific)(GO:0046975) |
| 0.0 | 0.2 | GO:0005280 | hydrogen:amino acid symporter activity(GO:0005280) |
| 0.0 | 0.1 | GO:0030290 | sphingolipid activator protein activity(GO:0030290) beta-N-acetylgalactosaminidase activity(GO:0032428) |
| 0.0 | 0.3 | GO:0000217 | DNA secondary structure binding(GO:0000217) |
| 0.0 | 4.4 | GO:0005125 | cytokine activity(GO:0005125) |
| 0.0 | 2.3 | GO:0005179 | hormone activity(GO:0005179) |
| 0.0 | 0.7 | GO:0005159 | insulin-like growth factor receptor binding(GO:0005159) |
| 0.0 | 0.3 | GO:0061578 | Lys63-specific deubiquitinase activity(GO:0061578) |
| 0.0 | 0.2 | GO:0019864 | IgG binding(GO:0019864) |
| 0.0 | 0.1 | GO:0019862 | IgA binding(GO:0019862) |
| 0.0 | 4.8 | GO:0019902 | phosphatase binding(GO:0019902) |
| 0.0 | 0.7 | GO:0004708 | MAP kinase kinase activity(GO:0004708) |
| 0.0 | 0.6 | GO:0005092 | GDP-dissociation inhibitor activity(GO:0005092) |
| 0.0 | 0.5 | GO:0005109 | frizzled binding(GO:0005109) |
| 0.0 | 0.6 | GO:0004712 | protein serine/threonine/tyrosine kinase activity(GO:0004712) |
| 0.0 | 0.4 | GO:0070300 | phosphatidic acid binding(GO:0070300) |
| 0.0 | 0.4 | GO:0050321 | tau-protein kinase activity(GO:0050321) |
| 0.0 | 0.4 | GO:0017025 | TBP-class protein binding(GO:0017025) |
| 0.0 | 0.3 | GO:0042809 | vitamin D receptor binding(GO:0042809) |
| 0.0 | 0.2 | GO:0070742 | C2H2 zinc finger domain binding(GO:0070742) |
| 0.0 | 0.7 | GO:0005484 | SNAP receptor activity(GO:0005484) |
| 0.0 | 0.6 | GO:0005154 | epidermal growth factor receptor binding(GO:0005154) |
| 0.0 | 0.2 | GO:0050291 | sphingosine N-acyltransferase activity(GO:0050291) |
| 0.0 | 0.1 | GO:0004769 | steroid delta-isomerase activity(GO:0004769) |
| 0.0 | 0.2 | GO:0008417 | fucosyltransferase activity(GO:0008417) |
| 0.0 | 0.2 | GO:0035173 | histone kinase activity(GO:0035173) |
| 0.0 | 1.0 | GO:0048365 | Rac GTPase binding(GO:0048365) |
Gene overrepresentation in curated gene sets: canonical pathways category:
| Log-likelihood per target | Total log-likelihood | Term | Description |
|---|---|---|---|
| 0.1 | 7.8 | PID INTEGRIN A9B1 PATHWAY | Alpha9 beta1 integrin signaling events |
| 0.1 | 5.8 | PID BMP PATHWAY | BMP receptor signaling |
| 0.1 | 4.0 | PID SYNDECAN 2 PATHWAY | Syndecan-2-mediated signaling events |
| 0.1 | 3.6 | PID ECADHERIN KERATINOCYTE PATHWAY | E-cadherin signaling in keratinocytes |
| 0.1 | 5.4 | PID CD8 TCR DOWNSTREAM PATHWAY | Downstream signaling in naïve CD8+ T cells |
| 0.1 | 2.3 | PID TOLL ENDOGENOUS PATHWAY | Endogenous TLR signaling |
| 0.1 | 2.5 | PID P38 MKK3 6PATHWAY | p38 MAPK signaling pathway |
| 0.0 | 5.0 | PID MTOR 4PATHWAY | mTOR signaling pathway |
| 0.0 | 5.8 | PID IL4 2PATHWAY | IL4-mediated signaling events |
| 0.0 | 2.9 | PID UPA UPAR PATHWAY | Urokinase-type plasminogen activator (uPA) and uPAR-mediated signaling |
| 0.0 | 1.5 | SA FAS SIGNALING | The TNF-type receptor Fas induces apoptosis on ligand binding. |
| 0.0 | 0.9 | SA CASPASE CASCADE | Apoptosis is mediated by caspases, cysteine proteases arranged in a proteolytic cascade. |
| 0.0 | 1.5 | PID EPHA FWDPATHWAY | EPHA forward signaling |
| 0.0 | 3.2 | PID CASPASE PATHWAY | Caspase cascade in apoptosis |
| 0.0 | 1.2 | PID MYC PATHWAY | C-MYC pathway |
| 0.0 | 1.7 | PID HES HEY PATHWAY | Notch-mediated HES/HEY network |
| 0.0 | 0.8 | PID CIRCADIAN PATHWAY | Circadian rhythm pathway |
| 0.0 | 2.4 | PID TCR PATHWAY | TCR signaling in naïve CD4+ T cells |
| 0.0 | 1.2 | PID FRA PATHWAY | Validated transcriptional targets of AP1 family members Fra1 and Fra2 |
| 0.0 | 0.6 | PID HIF1A PATHWAY | Hypoxic and oxygen homeostasis regulation of HIF-1-alpha |
| 0.0 | 0.2 | PID ALK2 PATHWAY | ALK2 signaling events |
| 0.0 | 1.0 | SIG REGULATION OF THE ACTIN CYTOSKELETON BY RHO GTPASES | Genes related to regulation of the actin cytoskeleton |
| 0.0 | 1.5 | PID ATM PATHWAY | ATM pathway |
| 0.0 | 0.5 | PID IL2 1PATHWAY | IL2-mediated signaling events |
| 0.0 | 3.1 | PID AR PATHWAY | Coregulation of Androgen receptor activity |
| 0.0 | 3.3 | PID CMYB PATHWAY | C-MYB transcription factor network |
| 0.0 | 2.1 | PID HNF3A PATHWAY | FOXA1 transcription factor network |
| 0.0 | 2.3 | PID HIF1 TFPATHWAY | HIF-1-alpha transcription factor network |
| 0.0 | 1.4 | PID VEGFR1 2 PATHWAY | Signaling events mediated by VEGFR1 and VEGFR2 |
| 0.0 | 2.4 | PID ILK PATHWAY | Integrin-linked kinase signaling |
| 0.0 | 0.8 | PID RETINOIC ACID PATHWAY | Retinoic acid receptors-mediated signaling |
| 0.0 | 1.5 | PID ECADHERIN STABILIZATION PATHWAY | Stabilization and expansion of the E-cadherin adherens junction |
| 0.0 | 0.7 | PID NCADHERIN PATHWAY | N-cadherin signaling events |
| 0.0 | 0.9 | PID FCER1 PATHWAY | Fc-epsilon receptor I signaling in mast cells |
| 0.0 | 0.7 | PID KIT PATHWAY | Signaling events mediated by Stem cell factor receptor (c-Kit) |
| 0.0 | 0.8 | ST T CELL SIGNAL TRANSDUCTION | T Cell Signal Transduction |
| 0.0 | 0.7 | PID MAPK TRK PATHWAY | Trk receptor signaling mediated by the MAPK pathway |
| 0.0 | 6.1 | NABA ECM REGULATORS | Genes encoding enzymes and their regulators involved in the remodeling of the extracellular matrix |
| 0.0 | 0.6 | PID FAK PATHWAY | Signaling events mediated by focal adhesion kinase |
| 0.0 | 0.6 | PID CONE PATHWAY | Visual signal transduction: Cones |
| 0.0 | 0.4 | PID IL6 7 PATHWAY | IL6-mediated signaling events |
| 0.0 | 0.3 | PID ALK1 PATHWAY | ALK1 signaling events |
| 0.0 | 0.9 | PID HDAC CLASSII PATHWAY | Signaling events mediated by HDAC Class II |
| 0.0 | 0.6 | PID FOXM1 PATHWAY | FOXM1 transcription factor network |
| 0.0 | 0.5 | PID ECADHERIN NASCENT AJ PATHWAY | E-cadherin signaling in the nascent adherens junction |
| 0.0 | 3.6 | NABA ECM GLYCOPROTEINS | Genes encoding structural ECM glycoproteins |
Gene overrepresentation in curated gene sets: REACTOME pathways category:
| Log-likelihood per target | Total log-likelihood | Term | Description |
|---|---|---|---|
| 0.2 | 2.3 | REACTOME TRAF6 MEDIATED IRF7 ACTIVATION IN TLR7 8 OR 9 SIGNALING | Genes involved in TRAF6 mediated IRF7 activation in TLR7/8 or 9 signaling |
| 0.2 | 1.7 | REACTOME ENDOSOMAL VACUOLAR PATHWAY | Genes involved in Endosomal/Vacuolar pathway |
| 0.1 | 4.4 | REACTOME CASPASE MEDIATED CLEAVAGE OF CYTOSKELETAL PROTEINS | Genes involved in Caspase-mediated cleavage of cytoskeletal proteins |
| 0.1 | 3.3 | REACTOME REGULATION OF IFNA SIGNALING | Genes involved in Regulation of IFNA signaling |
| 0.1 | 1.7 | REACTOME PYRIMIDINE CATABOLISM | Genes involved in Pyrimidine catabolism |
| 0.1 | 6.7 | REACTOME GLYCOSPHINGOLIPID METABOLISM | Genes involved in Glycosphingolipid metabolism |
| 0.1 | 2.3 | REACTOME REGULATION OF INSULIN LIKE GROWTH FACTOR IGF ACTIVITY BY INSULIN LIKE GROWTH FACTOR BINDING PROTEINS IGFBPS | Genes involved in Regulation of Insulin-like Growth Factor (IGF) Activity by Insulin-like Growth Factor Binding Proteins (IGFBPs) |
| 0.1 | 1.4 | REACTOME IL 7 SIGNALING | Genes involved in Interleukin-7 signaling |
| 0.1 | 1.0 | REACTOME PURINE CATABOLISM | Genes involved in Purine catabolism |
| 0.1 | 0.7 | REACTOME REGULATION OF THE FANCONI ANEMIA PATHWAY | Genes involved in Regulation of the Fanconi anemia pathway |
| 0.1 | 3.8 | REACTOME GENERATION OF SECOND MESSENGER MOLECULES | Genes involved in Generation of second messenger molecules |
| 0.1 | 1.4 | REACTOME G2 M DNA DAMAGE CHECKPOINT | Genes involved in G2/M DNA damage checkpoint |
| 0.1 | 1.6 | REACTOME SYNTHESIS OF PE | Genes involved in Synthesis of PE |
| 0.1 | 3.3 | REACTOME G BETA GAMMA SIGNALLING THROUGH PI3KGAMMA | Genes involved in G beta:gamma signalling through PI3Kgamma |
| 0.1 | 1.8 | REACTOME TRAF6 MEDIATED IRF7 ACTIVATION | Genes involved in TRAF6 mediated IRF7 activation |
| 0.1 | 3.0 | REACTOME DEFENSINS | Genes involved in Defensins |
| 0.1 | 5.3 | REACTOME COSTIMULATION BY THE CD28 FAMILY | Genes involved in Costimulation by the CD28 family |
| 0.0 | 0.9 | REACTOME ACYL CHAIN REMODELLING OF PS | Genes involved in Acyl chain remodelling of PS |
| 0.0 | 5.1 | REACTOME IMMUNOREGULATORY INTERACTIONS BETWEEN A LYMPHOID AND A NON LYMPHOID CELL | Genes involved in Immunoregulatory interactions between a Lymphoid and a non-Lymphoid cell |
| 0.0 | 1.0 | REACTOME MRNA DECAY BY 5 TO 3 EXORIBONUCLEASE | Genes involved in mRNA Decay by 5' to 3' Exoribonuclease |
| 0.0 | 2.3 | REACTOME LYSOSOME VESICLE BIOGENESIS | Genes involved in Lysosome Vesicle Biogenesis |
| 0.0 | 1.9 | REACTOME HORMONE SENSITIVE LIPASE HSL MEDIATED TRIACYLGLYCEROL HYDROLYSIS | Genes involved in Hormone-sensitive lipase (HSL)-mediated triacylglycerol hydrolysis |
| 0.0 | 0.8 | REACTOME MTORC1 MEDIATED SIGNALLING | Genes involved in mTORC1-mediated signalling |
| 0.0 | 1.1 | REACTOME SEMA3A PAK DEPENDENT AXON REPULSION | Genes involved in Sema3A PAK dependent Axon repulsion |
| 0.0 | 0.7 | REACTOME THE NLRP3 INFLAMMASOME | Genes involved in The NLRP3 inflammasome |
| 0.0 | 0.6 | REACTOME ACTIVATION OF CHAPERONE GENES BY ATF6 ALPHA | Genes involved in Activation of Chaperone Genes by ATF6-alpha |
| 0.0 | 0.7 | REACTOME GAMMA CARBOXYLATION TRANSPORT AND AMINO TERMINAL CLEAVAGE OF PROTEINS | Genes involved in Gamma-carboxylation, transport, and amino-terminal cleavage of proteins |
| 0.0 | 0.9 | REACTOME ORGANIC CATION ANION ZWITTERION TRANSPORT | Genes involved in Organic cation/anion/zwitterion transport |
| 0.0 | 1.5 | REACTOME HS GAG BIOSYNTHESIS | Genes involved in HS-GAG biosynthesis |
| 0.0 | 0.6 | REACTOME SYNTHESIS OF PIPS AT THE LATE ENDOSOME MEMBRANE | Genes involved in Synthesis of PIPs at the late endosome membrane |
| 0.0 | 1.4 | REACTOME ACTIVATION OF ATR IN RESPONSE TO REPLICATION STRESS | Genes involved in Activation of ATR in response to replication stress |
| 0.0 | 1.2 | REACTOME DEADENYLATION OF MRNA | Genes involved in Deadenylation of mRNA |
| 0.0 | 0.5 | REACTOME SYNTHESIS OF SUBSTRATES IN N GLYCAN BIOSYTHESIS | Genes involved in Synthesis of substrates in N-glycan biosythesis |
| 0.0 | 0.4 | REACTOME INFLAMMASOMES | Genes involved in Inflammasomes |
| 0.0 | 0.7 | REACTOME CYTOSOLIC SULFONATION OF SMALL MOLECULES | Genes involved in Cytosolic sulfonation of small molecules |
| 0.0 | 1.2 | REACTOME AMINE LIGAND BINDING RECEPTORS | Genes involved in Amine ligand-binding receptors |
| 0.0 | 0.7 | REACTOME ACTIVATED TAK1 MEDIATES P38 MAPK ACTIVATION | Genes involved in activated TAK1 mediates p38 MAPK activation |
| 0.0 | 0.5 | REACTOME SYNTHESIS SECRETION AND DEACYLATION OF GHRELIN | Genes involved in Synthesis, Secretion, and Deacylation of Ghrelin |
| 0.0 | 0.8 | REACTOME TERMINATION OF O GLYCAN BIOSYNTHESIS | Genes involved in Termination of O-glycan biosynthesis |
| 0.0 | 0.3 | REACTOME TRYPTOPHAN CATABOLISM | Genes involved in Tryptophan catabolism |
| 0.0 | 2.8 | REACTOME PEPTIDE CHAIN ELONGATION | Genes involved in Peptide chain elongation |
| 0.0 | 2.0 | REACTOME CLASS B 2 SECRETIN FAMILY RECEPTORS | Genes involved in Class B/2 (Secretin family receptors) |
| 0.0 | 0.7 | REACTOME INTRINSIC PATHWAY FOR APOPTOSIS | Genes involved in Intrinsic Pathway for Apoptosis |
| 0.0 | 1.1 | REACTOME GOLGI ASSOCIATED VESICLE BIOGENESIS | Genes involved in Golgi Associated Vesicle Biogenesis |
| 0.0 | 0.6 | REACTOME RNA POL I TRANSCRIPTION TERMINATION | Genes involved in RNA Polymerase I Transcription Termination |
| 0.0 | 0.3 | REACTOME METABOLISM OF POLYAMINES | Genes involved in Metabolism of polyamines |
| 0.0 | 0.6 | REACTOME OXYGEN DEPENDENT PROLINE HYDROXYLATION OF HYPOXIA INDUCIBLE FACTOR ALPHA | Genes involved in Oxygen-dependent Proline Hydroxylation of Hypoxia-inducible Factor Alpha |
| 0.0 | 0.1 | REACTOME IL 6 SIGNALING | Genes involved in Interleukin-6 signaling |
| 0.0 | 0.6 | REACTOME SYNTHESIS AND INTERCONVERSION OF NUCLEOTIDE DI AND TRIPHOSPHATES | Genes involved in Synthesis and interconversion of nucleotide di- and triphosphates |
| 0.0 | 0.6 | REACTOME CHONDROITIN SULFATE BIOSYNTHESIS | Genes involved in Chondroitin sulfate biosynthesis |
| 0.0 | 0.7 | REACTOME FATTY ACYL COA BIOSYNTHESIS | Genes involved in Fatty Acyl-CoA Biosynthesis |
| 0.0 | 0.2 | REACTOME HORMONE LIGAND BINDING RECEPTORS | Genes involved in Hormone ligand-binding receptors |
| 0.0 | 0.5 | REACTOME GROWTH HORMONE RECEPTOR SIGNALING | Genes involved in Growth hormone receptor signaling |
| 0.0 | 0.4 | REACTOME TRIGLYCERIDE BIOSYNTHESIS | Genes involved in Triglyceride Biosynthesis |
| 0.0 | 0.3 | REACTOME FORMATION OF THE TERNARY COMPLEX AND SUBSEQUENTLY THE 43S COMPLEX | Genes involved in Formation of the ternary complex, and subsequently, the 43S complex |
| 0.0 | 0.3 | REACTOME TGF BETA RECEPTOR SIGNALING IN EMT EPITHELIAL TO MESENCHYMAL TRANSITION | Genes involved in TGF-beta receptor signaling in EMT (epithelial to mesenchymal transition) |
| 0.0 | 1.2 | REACTOME PHASE1 FUNCTIONALIZATION OF COMPOUNDS | Genes involved in Phase 1 - Functionalization of compounds |
| 0.0 | 0.7 | REACTOME GLYCOLYSIS | Genes involved in Glycolysis |
| 0.0 | 0.3 | REACTOME INSULIN SYNTHESIS AND PROCESSING | Genes involved in Insulin Synthesis and Processing |
| 0.0 | 0.3 | REACTOME PROTEOLYTIC CLEAVAGE OF SNARE COMPLEX PROTEINS | Genes involved in Proteolytic cleavage of SNARE complex proteins |
| 0.0 | 3.1 | REACTOME SIGNALING BY RHO GTPASES | Genes involved in Signaling by Rho GTPases |
| 0.0 | 0.2 | REACTOME TAK1 ACTIVATES NFKB BY PHOSPHORYLATION AND ACTIVATION OF IKKS COMPLEX | Genes involved in TAK1 activates NFkB by phosphorylation and activation of IKKs complex |