Project
Illumina Body Map 2 (GSE30611)
Navigation
Downloads
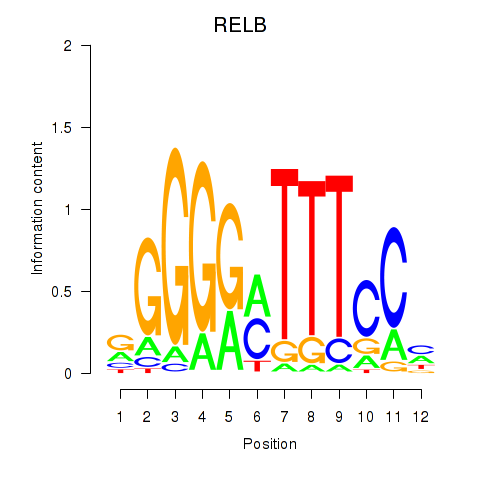
Results for RELB
Z-value: 0.99
Motif logo
Transcription factors associated with RELB
| Gene Symbol | Gene ID | Gene Info |
|---|---|---|
|
RELB
|
ENSG00000104856.14 | RELB proto-oncogene, NF-kB subunit |
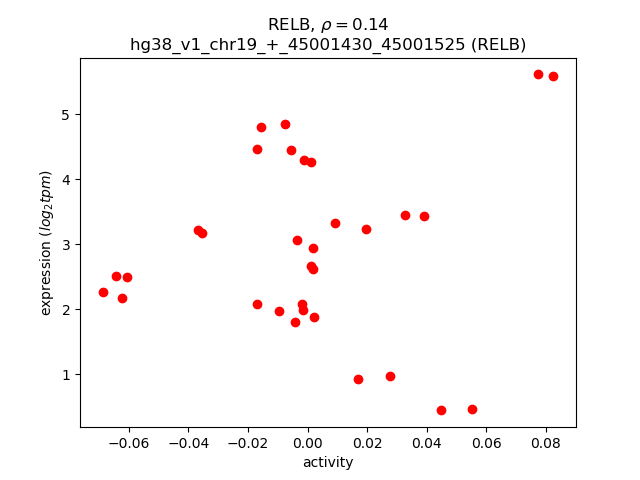
Activity-expression correlation:
| Gene | Promoter | Pearson corr. coef. | P-value | Plot |
|---|---|---|---|---|
| RELB | hg38_v1_chr19_+_45001430_45001525 | 0.14 | 4.5e-01 | Click! |
Activity profile of RELB motif
Sorted Z-values of RELB motif
| Promoter | Log-likelihood | Transcript | Gene | Gene Info |
|---|---|---|---|---|
| chr4_-_74099187 | 3.56 |
ENST00000508487.3
|
CXCL2
|
C-X-C motif chemokine ligand 2 |
| chr4_+_77605807 | 3.09 |
ENST00000682537.1
|
CXCL13
|
C-X-C motif chemokine ligand 13 |
| chr19_+_41877267 | 2.66 |
ENST00000221972.8
ENST00000597454.1 ENST00000444740.2 |
CD79A
|
CD79a molecule |
| chr11_+_18266254 | 2.64 |
ENST00000532858.5
ENST00000649195.1 ENST00000356524.9 ENST00000405158.2 |
SAA1
|
serum amyloid A1 |
| chr2_-_88947820 | 2.38 |
ENST00000496168.1
|
IGKV1-5
|
immunoglobulin kappa variable 1-5 |
| chr6_-_29559724 | 2.26 |
ENST00000377050.5
|
UBD
|
ubiquitin D |
| chr2_-_89320146 | 2.19 |
ENST00000498574.1
|
IGKV1-39
|
immunoglobulin kappa variable 1-39 |
| chr2_+_89913982 | 2.01 |
ENST00000390265.2
|
IGKV1D-33
|
immunoglobulin kappa variable 1D-33 |
| chr16_+_85899121 | 1.75 |
ENST00000268638.10
ENST00000565552.1 |
IRF8
|
interferon regulatory factor 8 |
| chr2_-_89100352 | 1.69 |
ENST00000479981.1
|
IGKV1-16
|
immunoglobulin kappa variable 1-16 |
| chr2_+_90159840 | 1.68 |
ENST00000377032.5
|
IGKV1D-12
|
immunoglobulin kappa variable 1D-12 |
| chr19_-_4540028 | 1.63 |
ENST00000306390.7
|
LRG1
|
leucine rich alpha-2-glycoprotein 1 |
| chr17_-_7114813 | 1.60 |
ENST00000254850.11
|
ASGR2
|
asialoglycoprotein receptor 2 |
| chr1_+_116754422 | 1.56 |
ENST00000369478.4
ENST00000369477.1 |
CD2
|
CD2 molecule |
| chr2_-_89010515 | 1.55 |
ENST00000493819.1
|
IGKV1-9
|
immunoglobulin kappa variable 1-9 |
| chr1_-_173917281 | 1.54 |
ENST00000367698.4
|
SERPINC1
|
serpin family C member 1 |
| chr15_+_32717994 | 1.49 |
ENST00000560677.5
ENST00000560830.1 ENST00000651154.1 |
GREM1
|
gremlin 1, DAN family BMP antagonist |
| chr22_+_22720615 | 1.48 |
ENST00000390309.2
|
IGLV3-19
|
immunoglobulin lambda variable 3-19 |
| chr6_+_32741382 | 1.43 |
ENST00000374940.4
|
HLA-DQA2
|
major histocompatibility complex, class II, DQ alpha 2 |
| chr9_-_133479075 | 1.43 |
ENST00000414172.1
ENST00000371897.8 ENST00000371899.9 |
SLC2A6
|
solute carrier family 2 member 6 |
| chr3_-_194351290 | 1.41 |
ENST00000429275.1
ENST00000323830.4 |
CPN2
|
carboxypeptidase N subunit 2 |
| chr22_-_37244237 | 1.41 |
ENST00000401529.3
ENST00000249071.11 |
RAC2
|
Rac family small GTPase 2 |
| chr19_+_17527250 | 1.37 |
ENST00000599164.6
ENST00000449408.6 ENST00000600871.5 ENST00000599124.1 |
NIBAN3
|
niban apoptosis regulator 3 |
| chr9_-_127755243 | 1.36 |
ENST00000629203.2
ENST00000420366.5 |
SH2D3C
|
SH2 domain containing 3C |
| chr12_-_92145838 | 1.29 |
ENST00000256015.5
|
BTG1
|
BTG anti-proliferation factor 1 |
| chr1_+_207496229 | 1.21 |
ENST00000367051.6
ENST00000367053.6 ENST00000367052.6 |
CR1
|
complement C3b/C4b receptor 1 (Knops blood group) |
| chr3_+_52495330 | 1.19 |
ENST00000321725.10
|
STAB1
|
stabilin 1 |
| chr7_+_22727147 | 1.18 |
ENST00000426291.5
ENST00000401651.5 ENST00000258743.10 ENST00000407492.5 ENST00000401630.7 ENST00000406575.1 |
IL6
|
interleukin 6 |
| chr2_+_218880844 | 1.17 |
ENST00000258411.8
|
WNT10A
|
Wnt family member 10A |
| chr4_-_73998669 | 1.16 |
ENST00000296027.5
|
CXCL5
|
C-X-C motif chemokine ligand 5 |
| chr1_+_37474572 | 1.11 |
ENST00000373087.7
|
ZC3H12A
|
zinc finger CCCH-type containing 12A |
| chr19_+_14031746 | 1.10 |
ENST00000263379.4
|
IL27RA
|
interleukin 27 receptor subunit alpha |
| chr19_-_17847962 | 1.09 |
ENST00000458235.7
ENST00000534444.1 |
JAK3
|
Janus kinase 3 |
| chr15_-_40307825 | 1.08 |
ENST00000456256.6
ENST00000557821.5 |
PLCB2
|
phospholipase C beta 2 |
| chrX_-_66033664 | 1.07 |
ENST00000427538.5
|
VSIG4
|
V-set and immunoglobulin domain containing 4 |
| chr19_-_46625037 | 1.06 |
ENST00000596260.1
ENST00000594275.1 ENST00000597185.1 ENST00000598865.5 ENST00000291294.7 |
PTGIR
|
prostaglandin I2 receptor |
| chr10_+_12349533 | 1.04 |
ENST00000619168.5
|
CAMK1D
|
calcium/calmodulin dependent protein kinase ID |
| chr22_+_22343185 | 1.03 |
ENST00000427632.2
|
IGLV9-49
|
immunoglobulin lambda variable 9-49 |
| chr2_+_233693659 | 1.03 |
ENST00000406651.1
|
UGT1A6
|
UDP glucuronosyltransferase family 1 member A6 |
| chr12_+_6946468 | 1.03 |
ENST00000543115.5
ENST00000399448.5 |
PTPN6
|
protein tyrosine phosphatase non-receptor type 6 |
| chr19_+_17527232 | 1.02 |
ENST00000601861.5
|
NIBAN3
|
niban apoptosis regulator 3 |
| chrX_-_153926757 | 1.02 |
ENST00000461052.5
ENST00000422091.1 |
ARHGAP4
|
Rho GTPase activating protein 4 |
| chr13_-_77918820 | 1.00 |
ENST00000646607.2
|
EDNRB
|
endothelin receptor type B |
| chr22_-_37244417 | 1.00 |
ENST00000405484.5
ENST00000441619.5 ENST00000406508.5 |
RAC2
|
Rac family small GTPase 2 |
| chr7_+_142715314 | 0.98 |
ENST00000390399.3
|
TRBV27
|
T cell receptor beta variable 27 |
| chr1_-_7940825 | 0.97 |
ENST00000377507.8
|
TNFRSF9
|
TNF receptor superfamily member 9 |
| chr19_-_6591103 | 0.96 |
ENST00000423145.7
ENST00000245903.4 |
CD70
|
CD70 molecule |
| chr15_-_40307910 | 0.95 |
ENST00000543785.3
ENST00000260402.8 |
PLCB2
|
phospholipase C beta 2 |
| chr6_+_29723421 | 0.93 |
ENST00000259951.12
ENST00000434407.6 |
HLA-F
|
major histocompatibility complex, class I, F |
| chr13_-_77918788 | 0.93 |
ENST00000626030.1
|
EDNRB
|
endothelin receptor type B |
| chr18_-_72867945 | 0.92 |
ENST00000327305.11
|
NETO1
|
neuropilin and tolloid like 1 |
| chr14_+_102777461 | 0.90 |
ENST00000560371.5
ENST00000347662.8 |
TRAF3
|
TNF receptor associated factor 3 |
| chr14_-_106005574 | 0.90 |
ENST00000390595.3
|
IGHV1-3
|
immunoglobulin heavy variable 1-3 |
| chr1_-_202159977 | 0.90 |
ENST00000367279.8
|
PTPN7
|
protein tyrosine phosphatase non-receptor type 7 |
| chr14_+_102777433 | 0.89 |
ENST00000392745.8
|
TRAF3
|
TNF receptor associated factor 3 |
| chr12_-_48924919 | 0.87 |
ENST00000444214.6
|
FKBP11
|
FKBP prolyl isomerase 11 |
| chr16_+_2019777 | 0.87 |
ENST00000566435.4
|
NPW
|
neuropeptide W |
| chr14_-_24576240 | 0.83 |
ENST00000216336.3
|
CTSG
|
cathepsin G |
| chr22_+_22427517 | 0.83 |
ENST00000390300.2
|
IGLV5-37
|
immunoglobulin lambda variable 5-37 |
| chr1_-_204467216 | 0.83 |
ENST00000367184.2
|
PIK3C2B
|
phosphatidylinositol-4-phosphate 3-kinase catalytic subunit type 2 beta |
| chr11_+_75717811 | 0.82 |
ENST00000198801.10
|
MOGAT2
|
monoacylglycerol O-acyltransferase 2 |
| chr6_+_29723340 | 0.81 |
ENST00000334668.8
|
HLA-F
|
major histocompatibility complex, class I, F |
| chr22_+_37282464 | 0.79 |
ENST00000402997.5
ENST00000405206.3 ENST00000248901.11 |
CYTH4
|
cytohesin 4 |
| chr12_-_102917203 | 0.79 |
ENST00000553106.6
ENST00000307000.7 |
PAH
|
phenylalanine hydroxylase |
| chr12_+_103930332 | 0.77 |
ENST00000681861.1
ENST00000550595.2 ENST00000680762.1 ENST00000614327.2 ENST00000681949.1 ENST00000299767.10 |
HSP90B1
|
heat shock protein 90 beta family member 1 |
| chr1_+_207496268 | 0.76 |
ENST00000529814.1
|
CR1
|
complement C3b/C4b receptor 1 (Knops blood group) |
| chr1_-_202161575 | 0.76 |
ENST00000309017.7
ENST00000477554.5 ENST00000492451.1 |
PTPN7
|
protein tyrosine phosphatase non-receptor type 7 |
| chr12_-_54588516 | 0.76 |
ENST00000547431.5
|
PPP1R1A
|
protein phosphatase 1 regulatory inhibitor subunit 1A |
| chrX_+_68693629 | 0.76 |
ENST00000374597.3
|
STARD8
|
StAR related lipid transfer domain containing 8 |
| chr15_-_44711306 | 0.74 |
ENST00000682850.1
|
PATL2
|
PAT1 homolog 2 |
| chr4_+_165874833 | 0.73 |
ENST00000506144.1
|
TLL1
|
tolloid like 1 |
| chr12_-_54984667 | 0.73 |
ENST00000524668.5
ENST00000533607.1 ENST00000449076.6 |
TESPA1
|
thymocyte expressed, positive selection associated 1 |
| chr11_-_124935973 | 0.73 |
ENST00000298251.5
|
HEPACAM
|
hepatic and glial cell adhesion molecule |
| chr21_+_42403856 | 0.72 |
ENST00000291535.11
|
UBASH3A
|
ubiquitin associated and SH3 domain containing A |
| chr12_+_57230086 | 0.72 |
ENST00000414700.7
ENST00000557703.5 |
SHMT2
|
serine hydroxymethyltransferase 2 |
| chr12_-_14961256 | 0.71 |
ENST00000541380.5
|
ARHGDIB
|
Rho GDP dissociation inhibitor beta |
| chr14_+_102777555 | 0.71 |
ENST00000539721.5
ENST00000560463.5 |
TRAF3
|
TNF receptor associated factor 3 |
| chr19_+_45001430 | 0.71 |
ENST00000625761.2
ENST00000505236.1 ENST00000221452.13 |
RELB
|
RELB proto-oncogene, NF-kB subunit |
| chr15_+_57599411 | 0.70 |
ENST00000569089.1
|
MYZAP
|
myocardial zonula adherens protein |
| chr14_+_52267683 | 0.70 |
ENST00000306051.3
ENST00000553372.1 |
PTGDR
|
prostaglandin D2 receptor |
| chr2_-_100105339 | 0.69 |
ENST00000424600.5
ENST00000441400.5 ENST00000673328.1 |
AFF3
|
AF4/FMR2 family member 3 |
| chr16_+_57358775 | 0.69 |
ENST00000219235.5
|
CCL22
|
C-C motif chemokine ligand 22 |
| chr12_+_57229694 | 0.69 |
ENST00000557487.5
ENST00000328923.8 ENST00000555634.5 ENST00000556689.5 |
SHMT2
|
serine hydroxymethyltransferase 2 |
| chr4_+_61200318 | 0.67 |
ENST00000683033.1
|
ADGRL3
|
adhesion G protein-coupled receptor L3 |
| chr1_-_202160577 | 0.66 |
ENST00000629151.2
ENST00000476061.5 ENST00000464870.5 ENST00000467283.5 ENST00000435759.6 ENST00000486116.5 ENST00000477625.5 |
PTPN7
|
protein tyrosine phosphatase non-receptor type 7 |
| chr12_-_54981838 | 0.66 |
ENST00000316577.12
|
TESPA1
|
thymocyte expressed, positive selection associated 1 |
| chr7_-_22500152 | 0.66 |
ENST00000406890.6
ENST00000678116.1 ENST00000424363.5 |
STEAP1B
|
STEAP family member 1B |
| chr14_+_75522531 | 0.64 |
ENST00000555504.1
|
BATF
|
basic leucine zipper ATF-like transcription factor |
| chr4_+_73869385 | 0.62 |
ENST00000395761.4
|
CXCL1
|
C-X-C motif chemokine ligand 1 |
| chr9_-_95317671 | 0.62 |
ENST00000490972.7
ENST00000647778.1 ENST00000649611.1 ENST00000289081.8 |
FANCC
|
FA complementation group C |
| chr2_-_100104530 | 0.62 |
ENST00000432037.5
ENST00000673232.1 ENST00000423966.6 ENST00000409236.6 |
AFF3
|
AF4/FMR2 family member 3 |
| chrX_+_15500800 | 0.62 |
ENST00000348343.11
|
BMX
|
BMX non-receptor tyrosine kinase |
| chr2_+_158968608 | 0.61 |
ENST00000263635.8
|
TANC1
|
tetratricopeptide repeat, ankyrin repeat and coiled-coil containing 1 |
| chr6_+_116461364 | 0.61 |
ENST00000368606.7
ENST00000368605.3 |
CALHM6
|
calcium homeostasis modulator family member 6 |
| chr14_+_75522427 | 0.60 |
ENST00000286639.8
|
BATF
|
basic leucine zipper ATF-like transcription factor |
| chr10_+_94762673 | 0.59 |
ENST00000480405.2
ENST00000371321.9 |
CYP2C19
|
cytochrome P450 family 2 subfamily C member 19 |
| chr22_+_36922040 | 0.59 |
ENST00000406230.5
|
CSF2RB
|
colony stimulating factor 2 receptor subunit beta |
| chr17_-_40665121 | 0.59 |
ENST00000394052.5
|
KRT222
|
keratin 222 |
| chr1_-_186680411 | 0.58 |
ENST00000367468.10
|
PTGS2
|
prostaglandin-endoperoxide synthase 2 |
| chr11_+_278398 | 0.58 |
ENST00000534750.6
|
NLRP6
|
NLR family pyrin domain containing 6 |
| chr2_+_113406368 | 0.57 |
ENST00000453673.3
|
IGKV1OR2-108
|
immunoglobulin kappa variable 1/OR2-108 (non-functional) |
| chr1_-_160070150 | 0.57 |
ENST00000644903.1
|
KCNJ10
|
potassium inwardly rectifying channel subfamily J member 10 |
| chr5_-_151141631 | 0.57 |
ENST00000523714.5
ENST00000521749.5 |
ANXA6
|
annexin A6 |
| chr5_-_180072086 | 0.55 |
ENST00000261947.4
|
RNF130
|
ring finger protein 130 |
| chr2_+_233917371 | 0.55 |
ENST00000324695.9
ENST00000433712.6 |
TRPM8
|
transient receptor potential cation channel subfamily M member 8 |
| chr12_+_100473875 | 0.55 |
ENST00000649582.1
|
NR1H4
|
nuclear receptor subfamily 1 group H member 4 |
| chr14_+_103123452 | 0.54 |
ENST00000558056.1
ENST00000560869.6 |
TNFAIP2
|
TNF alpha induced protein 2 |
| chr12_+_2053311 | 0.54 |
ENST00000399617.6
ENST00000683482.1 |
CACNA1C
|
calcium voltage-gated channel subunit alpha1 C |
| chr13_+_32031300 | 0.53 |
ENST00000642040.1
|
FRY
|
FRY microtubule binding protein |
| chr3_+_50205240 | 0.52 |
ENST00000610458.4
|
SLC38A3
|
solute carrier family 38 member 3 |
| chr13_+_31945826 | 0.52 |
ENST00000647500.1
|
FRY
|
FRY microtubule binding protein |
| chr1_-_19288764 | 0.52 |
ENST00000361640.5
|
AKR7A3
|
aldo-keto reductase family 7 member A3 |
| chr14_+_22086401 | 0.52 |
ENST00000390451.2
|
TRAV23DV6
|
T cell receptor alpha variable 23/delta variable 6 |
| chr14_+_23969874 | 0.52 |
ENST00000534993.5
ENST00000543805.6 ENST00000558293.7 |
DHRS4L2
ENSG00000285467.1
|
dehydrogenase/reductase 4 like 2 novel transcript |
| chr6_+_32637419 | 0.52 |
ENST00000374949.2
|
HLA-DQA1
|
major histocompatibility complex, class II, DQ alpha 1 |
| chr21_-_41953997 | 0.51 |
ENST00000380486.4
|
C2CD2
|
C2 calcium dependent domain containing 2 |
| chr7_+_90154442 | 0.51 |
ENST00000297205.7
|
STEAP1
|
STEAP family member 1 |
| chr15_+_90184912 | 0.51 |
ENST00000561085.1
ENST00000332496.10 |
SEMA4B
|
semaphorin 4B |
| chr8_+_72537219 | 0.50 |
ENST00000523207.2
|
KCNB2
|
potassium voltage-gated channel subfamily B member 2 |
| chr14_-_64503775 | 0.50 |
ENST00000608382.6
|
ZBTB25
|
zinc finger and BTB domain containing 25 |
| chr16_+_2009870 | 0.50 |
ENST00000567649.1
|
NPW
|
neuropeptide W |
| chr12_+_2053545 | 0.50 |
ENST00000682336.1
ENST00000344100.7 ENST00000399591.5 ENST00000399595.5 ENST00000399597.5 ENST00000399601.5 ENST00000399606.5 ENST00000399621.5 ENST00000399629.5 ENST00000399637.5 ENST00000399638.5 ENST00000399644.5 ENST00000399649.5 ENST00000402845.7 ENST00000682686.1 |
CACNA1C
|
calcium voltage-gated channel subunit alpha1 C |
| chr11_+_102317542 | 0.50 |
ENST00000532808.5
|
BIRC3
|
baculoviral IAP repeat containing 3 |
| chr12_-_8662703 | 0.50 |
ENST00000535336.5
|
MFAP5
|
microfibril associated protein 5 |
| chr12_+_57230301 | 0.50 |
ENST00000553474.5
|
SHMT2
|
serine hydroxymethyltransferase 2 |
| chr1_-_205775449 | 0.49 |
ENST00000235932.8
ENST00000437324.6 ENST00000414729.1 ENST00000367139.8 |
RAB29
|
RAB29, member RAS oncogene family |
| chr5_-_150412743 | 0.49 |
ENST00000353334.11
ENST00000009530.12 ENST00000377795.7 |
CD74
|
CD74 molecule |
| chrX_-_132218124 | 0.49 |
ENST00000342983.6
|
RAP2C
|
RAP2C, member of RAS oncogene family |
| chr7_+_1232865 | 0.49 |
ENST00000316333.9
|
UNCX
|
UNC homeobox |
| chr20_-_59032292 | 0.48 |
ENST00000395663.1
ENST00000243997.8 ENST00000395659.1 |
ATP5F1E
|
ATP synthase F1 subunit epsilon |
| chr1_-_160070102 | 0.48 |
ENST00000638728.1
ENST00000637644.1 |
KCNJ10
|
potassium inwardly rectifying channel subfamily J member 10 |
| chr3_-_186544377 | 0.48 |
ENST00000307944.6
|
CRYGS
|
crystallin gamma S |
| chr9_+_4490388 | 0.48 |
ENST00000262352.8
|
SLC1A1
|
solute carrier family 1 member 1 |
| chr14_+_51847145 | 0.48 |
ENST00000615906.4
|
GNG2
|
G protein subunit gamma 2 |
| chr11_+_308188 | 0.48 |
ENST00000680619.1
ENST00000681833.1 ENST00000680261.1 |
IFITM2
|
interferon induced transmembrane protein 2 |
| chr3_+_188153870 | 0.48 |
ENST00000416784.5
ENST00000430340.5 ENST00000414139.5 ENST00000454789.5 |
LPP
|
LIM domain containing preferred translocation partner in lipoma |
| chr15_-_78944985 | 0.48 |
ENST00000615999.5
ENST00000677789.1 ENST00000676880.1 ENST00000677936.1 ENST00000220166.10 ENST00000677810.1 ENST00000678644.1 ENST00000677534.1 ENST00000677316.1 |
CTSH
|
cathepsin H |
| chr9_-_133703700 | 0.47 |
ENST00000371868.5
|
SARDH
|
sarcosine dehydrogenase |
| chr6_-_32668368 | 0.47 |
ENST00000399084.5
|
HLA-DQB1
|
major histocompatibility complex, class II, DQ beta 1 |
| chr14_-_22829779 | 0.46 |
ENST00000488800.5
|
SLC7A7
|
solute carrier family 7 member 7 |
| chr8_-_80171106 | 0.46 |
ENST00000519303.6
|
TPD52
|
tumor protein D52 |
| chr22_-_50270353 | 0.45 |
ENST00000330651.11
|
MAPK11
|
mitogen-activated protein kinase 11 |
| chr14_+_22829879 | 0.45 |
ENST00000355151.9
ENST00000397496.7 ENST00000555345.5 ENST00000432849.7 ENST00000553711.5 ENST00000556465.5 ENST00000397505.2 ENST00000557221.1 ENST00000556840.5 ENST00000555536.1 |
MRPL52
|
mitochondrial ribosomal protein L52 |
| chr2_+_210556590 | 0.45 |
ENST00000233072.10
ENST00000619804.1 |
CPS1
|
carbamoyl-phosphate synthase 1 |
| chr11_+_102317492 | 0.45 |
ENST00000673846.1
|
BIRC3
|
baculoviral IAP repeat containing 3 |
| chr12_+_57230124 | 0.45 |
ENST00000553529.5
ENST00000554310.5 |
SHMT2
|
serine hydroxymethyltransferase 2 |
| chr4_-_48681171 | 0.45 |
ENST00000505759.1
|
FRYL
|
FRY like transcription coactivator |
| chr14_-_24232332 | 0.45 |
ENST00000534348.5
ENST00000524927.1 ENST00000250495.10 |
NEDD8-MDP1
NEDD8
|
NEDD8-MDP1 readthrough NEDD8 ubiquitin like modifier |
| chr3_-_39153512 | 0.44 |
ENST00000273153.10
|
CSRNP1
|
cysteine and serine rich nuclear protein 1 |
| chr7_+_86643902 | 0.44 |
ENST00000361669.7
|
GRM3
|
glutamate metabotropic receptor 3 |
| chr18_-_55401026 | 0.44 |
ENST00000562607.5
|
TCF4
|
transcription factor 4 |
| chr20_-_44651683 | 0.44 |
ENST00000537820.1
ENST00000372874.9 |
ADA
|
adenosine deaminase |
| chr12_+_100473708 | 0.44 |
ENST00000548884.5
ENST00000392986.8 |
NR1H4
|
nuclear receptor subfamily 1 group H member 4 |
| chr5_+_119268689 | 0.43 |
ENST00000274456.6
|
TNFAIP8
|
TNF alpha induced protein 8 |
| chr9_-_120926752 | 0.43 |
ENST00000373887.8
|
TRAF1
|
TNF receptor associated factor 1 |
| chr21_+_33403466 | 0.43 |
ENST00000405436.5
|
IFNGR2
|
interferon gamma receptor 2 |
| chr2_-_96857984 | 0.42 |
ENST00000393537.5
|
ANKRD39
|
ankyrin repeat domain 39 |
| chr12_+_57230336 | 0.42 |
ENST00000555773.5
ENST00000554975.5 ENST00000449049.7 |
SHMT2
|
serine hydroxymethyltransferase 2 |
| chr12_+_100473916 | 0.42 |
ENST00000549996.5
|
NR1H4
|
nuclear receptor subfamily 1 group H member 4 |
| chr6_+_132570322 | 0.42 |
ENST00000275198.1
|
TAAR6
|
trace amine associated receptor 6 |
| chr1_+_100538131 | 0.41 |
ENST00000315033.5
|
GPR88
|
G protein-coupled receptor 88 |
| chr12_-_108598002 | 0.41 |
ENST00000549447.1
|
TMEM119
|
transmembrane protein 119 |
| chr4_+_39044995 | 0.41 |
ENST00000261425.7
ENST00000508137.6 |
KLHL5
|
kelch like family member 5 |
| chr8_+_53880867 | 0.41 |
ENST00000522225.5
|
RGS20
|
regulator of G protein signaling 20 |
| chr11_+_102317450 | 0.40 |
ENST00000615299.4
ENST00000527309.2 ENST00000526421.6 ENST00000263464.9 |
BIRC3
|
baculoviral IAP repeat containing 3 |
| chr12_-_48865863 | 0.40 |
ENST00000309739.6
|
RND1
|
Rho family GTPase 1 |
| chr1_-_204411804 | 0.40 |
ENST00000367188.5
|
PPP1R15B
|
protein phosphatase 1 regulatory subunit 15B |
| chr12_-_54588636 | 0.40 |
ENST00000257905.13
|
PPP1R1A
|
protein phosphatase 1 regulatory inhibitor subunit 1A |
| chr8_-_65842051 | 0.39 |
ENST00000401827.8
|
PDE7A
|
phosphodiesterase 7A |
| chr3_-_138329839 | 0.39 |
ENST00000333911.9
ENST00000383180.6 |
NME9
|
NME/NM23 family member 9 |
| chr17_+_4731410 | 0.39 |
ENST00000575284.5
ENST00000293777.6 ENST00000674339.1 ENST00000573708.1 |
MED11
|
mediator complex subunit 11 |
| chr1_+_23791962 | 0.38 |
ENST00000421070.1
|
LYPLA2
|
lysophospholipase 2 |
| chr10_+_87659839 | 0.38 |
ENST00000456849.2
|
PAPSS2
|
3'-phosphoadenosine 5'-phosphosulfate synthase 2 |
| chr1_-_67054100 | 0.37 |
ENST00000235345.6
|
SLC35D1
|
solute carrier family 35 member D1 |
| chr22_-_19525369 | 0.37 |
ENST00000403084.1
ENST00000413119.2 |
CLDN5
|
claudin 5 |
| chr1_+_24502894 | 0.37 |
ENST00000436717.6
ENST00000616511.4 |
RCAN3
|
RCAN family member 3 |
| chr6_-_36387736 | 0.36 |
ENST00000373737.8
ENST00000373738.4 ENST00000538992.3 ENST00000615781.4 ENST00000620358.4 |
ETV7
|
ETS variant transcription factor 7 |
| chr11_-_5154757 | 0.36 |
ENST00000380367.3
|
OR52A1
|
olfactory receptor family 52 subfamily A member 1 |
| chr19_+_1261091 | 0.36 |
ENST00000588411.5
|
CIRBP
|
cold inducible RNA binding protein |
| chr1_+_11189347 | 0.36 |
ENST00000376819.4
|
ANGPTL7
|
angiopoietin like 7 |
| chr8_+_53880894 | 0.36 |
ENST00000276500.4
|
RGS20
|
regulator of G protein signaling 20 |
| chr1_+_112619824 | 0.35 |
ENST00000263168.4
|
CAPZA1
|
capping actin protein of muscle Z-line subunit alpha 1 |
| chr19_+_15082211 | 0.35 |
ENST00000641398.1
|
OR1I1
|
olfactory receptor family 1 subfamily I member 1 |
| chr15_+_34102037 | 0.35 |
ENST00000397766.4
|
PGBD4
|
piggyBac transposable element derived 4 |
| chr13_+_32031706 | 0.35 |
ENST00000542859.6
|
FRY
|
FRY microtubule binding protein |
| chr13_+_108269629 | 0.35 |
ENST00000430559.5
ENST00000375887.9 |
TNFSF13B
|
TNF superfamily member 13b |
| chr1_-_24187246 | 0.35 |
ENST00000374421.7
ENST00000374418.3 ENST00000327575.6 ENST00000327535.6 |
IFNLR1
|
interferon lambda receptor 1 |
| chr14_+_64504719 | 0.35 |
ENST00000555321.1
|
ZBTB1
|
zinc finger and BTB domain containing 1 |
| chr1_-_205775182 | 0.34 |
ENST00000446390.6
|
RAB29
|
RAB29, member RAS oncogene family |
| chr1_-_6261053 | 0.34 |
ENST00000377893.3
|
GPR153
|
G protein-coupled receptor 153 |
| chr14_+_24232422 | 0.33 |
ENST00000620807.4
ENST00000355299.8 ENST00000559836.5 |
GMPR2
|
guanosine monophosphate reductase 2 |
| chr17_-_42388360 | 0.33 |
ENST00000678960.1
ENST00000404395.3 ENST00000389272.7 ENST00000677421.1 ENST00000585517.5 ENST00000264657.10 ENST00000678048.1 ENST00000678674.1 ENST00000678913.1 ENST00000678572.1 ENST00000678906.1 |
STAT3
|
signal transducer and activator of transcription 3 |
| chr6_+_29942523 | 0.33 |
ENST00000376809.10
ENST00000376802.2 ENST00000638375.1 |
HLA-A
|
major histocompatibility complex, class I, A |
| chr2_+_60881553 | 0.33 |
ENST00000394479.4
|
REL
|
REL proto-oncogene, NF-kB subunit |
| chrX_-_20266606 | 0.33 |
ENST00000643085.1
ENST00000645270.1 ENST00000644368.1 |
RPS6KA3
|
ribosomal protein S6 kinase A3 |
| chr2_+_26346086 | 0.33 |
ENST00000613142.4
ENST00000260585.12 ENST00000447170.1 |
SELENOI
|
selenoprotein I |
| chr14_-_72894091 | 0.33 |
ENST00000556509.6
|
DPF3
|
double PHD fingers 3 |
| chr1_-_89175997 | 0.33 |
ENST00000294671.3
ENST00000650452.1 |
GBP7
|
guanylate binding protein 7 |
| chr15_+_85380625 | 0.32 |
ENST00000560302.5
|
AKAP13
|
A-kinase anchoring protein 13 |
| chr14_+_64503708 | 0.32 |
ENST00000553583.1
|
ZBTB1
|
zinc finger and BTB domain containing 1 |
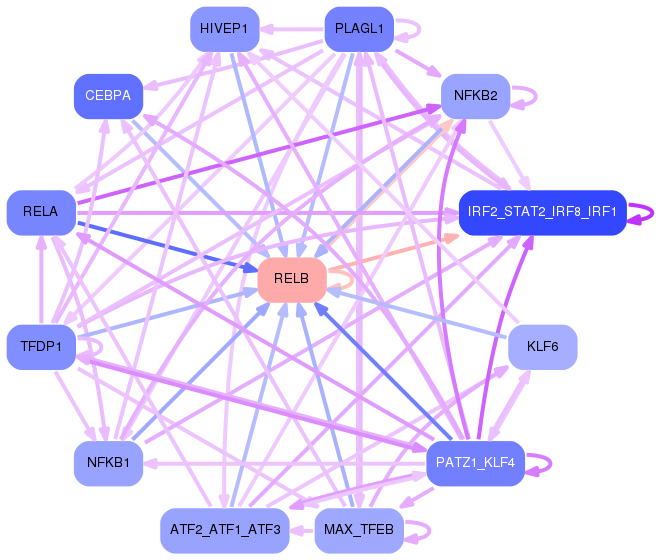
Network of associatons between targets according to the STRING database.

First level regulatory network of RELB
Gene Ontology Analysis
Gene overrepresentation in biological process category:
| Log-likelihood per target | Total log-likelihood | Term | Description |
|---|---|---|---|
| 0.8 | 3.1 | GO:2001027 | positive regulation of cell-cell adhesion mediated by integrin(GO:0033634) negative regulation of endothelial cell chemotaxis(GO:2001027) |
| 0.7 | 2.0 | GO:0045957 | regulation of complement activation, alternative pathway(GO:0030451) negative regulation of complement activation, alternative pathway(GO:0045957) |
| 0.5 | 1.5 | GO:1900155 | regulation of bone trabecula formation(GO:1900154) negative regulation of bone trabecula formation(GO:1900155) |
| 0.4 | 1.9 | GO:0035645 | enteric smooth muscle cell differentiation(GO:0035645) |
| 0.4 | 1.1 | GO:2000627 | nuclear-transcribed mRNA catabolic process, endonucleolytic cleavage-dependent decay(GO:0000294) regulation of miRNA catabolic process(GO:2000625) positive regulation of miRNA catabolic process(GO:2000627) |
| 0.3 | 3.0 | GO:0019264 | glycine biosynthetic process from serine(GO:0019264) |
| 0.3 | 1.2 | GO:1990637 | response to prolactin(GO:1990637) |
| 0.3 | 1.4 | GO:1904428 | negative regulation of tubulin deacetylation(GO:1904428) |
| 0.3 | 0.8 | GO:0031247 | actin rod assembly(GO:0031247) |
| 0.3 | 9.4 | GO:0090023 | positive regulation of neutrophil chemotaxis(GO:0090023) |
| 0.3 | 1.3 | GO:2000176 | regulation of pro-T cell differentiation(GO:2000174) positive regulation of pro-T cell differentiation(GO:2000176) |
| 0.3 | 2.5 | GO:0008063 | Toll signaling pathway(GO:0008063) |
| 0.2 | 1.0 | GO:0002636 | positive regulation of germinal center formation(GO:0002636) |
| 0.2 | 1.4 | GO:2001248 | nitrogen catabolite regulation of transcription from RNA polymerase II promoter(GO:0001079) nitrogen catabolite activation of transcription from RNA polymerase II promoter(GO:0001080) regulation of urea metabolic process(GO:0034255) intracellular bile acid receptor signaling pathway(GO:0038185) interleukin-17 secretion(GO:0072615) nitrogen catabolite regulation of transcription(GO:0090293) nitrogen catabolite activation of transcription(GO:0090294) regulation of nitrogen cycle metabolic process(GO:1903314) positive regulation of glutamate metabolic process(GO:2000213) regulation of ammonia assimilation cycle(GO:2001248) positive regulation of ammonia assimilation cycle(GO:2001250) |
| 0.2 | 1.4 | GO:0010387 | COP9 signalosome assembly(GO:0010387) |
| 0.2 | 0.7 | GO:0061402 | asparagine transport(GO:0006867) positive regulation of transcription from RNA polymerase II promoter in response to acidic pH(GO:0061402) regulation of glutamine transport(GO:2000485) |
| 0.2 | 1.1 | GO:0045626 | negative regulation of T-helper 1 cell differentiation(GO:0045626) |
| 0.2 | 1.1 | GO:0006957 | complement activation, alternative pathway(GO:0006957) |
| 0.2 | 2.1 | GO:0002480 | antigen processing and presentation of exogenous peptide antigen via MHC class I, TAP-independent(GO:0002480) |
| 0.2 | 0.6 | GO:0010730 | negative regulation of hydrogen peroxide biosynthetic process(GO:0010730) |
| 0.2 | 0.6 | GO:0090271 | positive regulation of fibroblast growth factor production(GO:0090271) |
| 0.2 | 0.7 | GO:0010607 | negative regulation of cytoplasmic mRNA processing body assembly(GO:0010607) |
| 0.2 | 0.9 | GO:2000312 | regulation of kainate selective glutamate receptor activity(GO:2000312) |
| 0.2 | 0.8 | GO:0038043 | interleukin-5-mediated signaling pathway(GO:0038043) |
| 0.2 | 1.2 | GO:0097461 | ferric iron import(GO:0033216) ferric iron import into cell(GO:0097461) ferric iron import across plasma membrane(GO:0098706) |
| 0.2 | 1.3 | GO:0051933 | amino acid neurotransmitter reuptake(GO:0051933) glutamate reuptake(GO:0051935) |
| 0.2 | 1.0 | GO:2001180 | negative regulation of interleukin-10 secretion(GO:2001180) |
| 0.2 | 0.5 | GO:1901052 | sarcosine metabolic process(GO:1901052) sarcosine catabolic process(GO:1901053) |
| 0.2 | 1.6 | GO:0030885 | regulation of myeloid dendritic cell activation(GO:0030885) |
| 0.2 | 0.5 | GO:1903718 | carbamoyl phosphate metabolic process(GO:0070408) carbamoyl phosphate biosynthetic process(GO:0070409) response to ammonia(GO:1903717) cellular response to ammonia(GO:1903718) |
| 0.1 | 1.0 | GO:0033277 | abortive mitotic cell cycle(GO:0033277) |
| 0.1 | 0.4 | GO:0038158 | granulocyte colony-stimulating factor signaling pathway(GO:0038158) |
| 0.1 | 0.4 | GO:0000103 | sulfate assimilation(GO:0000103) |
| 0.1 | 0.5 | GO:0060448 | dichotomous subdivision of terminal units involved in lung branching(GO:0060448) |
| 0.1 | 0.7 | GO:0071461 | cellular response to redox state(GO:0071461) |
| 0.1 | 3.0 | GO:0042832 | defense response to protozoan(GO:0042832) |
| 0.1 | 0.5 | GO:0045209 | MAPK phosphatase export from nucleus(GO:0045208) MAPK phosphatase export from nucleus, leptomycin B sensitive(GO:0045209) |
| 0.1 | 1.4 | GO:0070842 | aggresome assembly(GO:0070842) |
| 0.1 | 0.2 | GO:0002268 | follicular dendritic cell differentiation(GO:0002268) |
| 0.1 | 0.8 | GO:0070944 | neutrophil mediated cytotoxicity(GO:0070942) neutrophil mediated killing of symbiont cell(GO:0070943) neutrophil mediated killing of bacterium(GO:0070944) |
| 0.1 | 0.2 | GO:0048850 | hypophysis morphogenesis(GO:0048850) |
| 0.1 | 0.6 | GO:0021993 | initiation of neural tube closure(GO:0021993) |
| 0.1 | 14.4 | GO:2000257 | regulation of protein activation cascade(GO:2000257) |
| 0.1 | 0.3 | GO:0097187 | dentinogenesis(GO:0097187) |
| 0.1 | 1.3 | GO:2000271 | positive regulation of fibroblast apoptotic process(GO:2000271) |
| 0.1 | 1.0 | GO:0052696 | flavonoid glucuronidation(GO:0052696) xenobiotic glucuronidation(GO:0052697) |
| 0.1 | 0.6 | GO:0016098 | monoterpenoid metabolic process(GO:0016098) |
| 0.1 | 0.3 | GO:0034147 | regulation of toll-like receptor 5 signaling pathway(GO:0034147) negative regulation of toll-like receptor 5 signaling pathway(GO:0034148) negative regulation of nucleotide-binding oligomerization domain containing 1 signaling pathway(GO:0070429) |
| 0.1 | 0.3 | GO:0044501 | modulation of signal transduction in other organism(GO:0044501) modulation by symbiont of host signal transduction pathway(GO:0052027) modulation of signal transduction in other organism involved in symbiotic interaction(GO:0052250) modulation by symbiont of host I-kappaB kinase/NF-kappaB cascade(GO:0085032) |
| 0.1 | 1.4 | GO:0070424 | regulation of nucleotide-binding oligomerization domain containing signaling pathway(GO:0070424) |
| 0.1 | 0.5 | GO:2001184 | positive regulation of interleukin-12 secretion(GO:2001184) |
| 0.1 | 1.1 | GO:0043950 | positive regulation of cAMP-mediated signaling(GO:0043950) |
| 0.1 | 1.0 | GO:0098912 | membrane depolarization during atrial cardiac muscle cell action potential(GO:0098912) |
| 0.1 | 0.7 | GO:0002084 | protein depalmitoylation(GO:0002084) |
| 0.1 | 2.7 | GO:0050716 | positive regulation of interleukin-1 secretion(GO:0050716) |
| 0.1 | 0.7 | GO:0071798 | response to prostaglandin D(GO:0071798) cellular response to prostaglandin D stimulus(GO:0071799) |
| 0.1 | 0.6 | GO:0050955 | thermoception(GO:0050955) |
| 0.1 | 1.2 | GO:0048733 | sebaceous gland development(GO:0048733) |
| 0.1 | 1.1 | GO:0002827 | positive regulation of T-helper 1 type immune response(GO:0002827) |
| 0.1 | 1.3 | GO:0032688 | negative regulation of interferon-beta production(GO:0032688) |
| 0.1 | 1.0 | GO:0010764 | negative regulation of fibroblast migration(GO:0010764) |
| 0.1 | 0.1 | GO:0070427 | nucleotide-binding oligomerization domain containing 1 signaling pathway(GO:0070427) |
| 0.1 | 0.3 | GO:0042776 | mitochondrial ATP synthesis coupled proton transport(GO:0042776) |
| 0.1 | 0.5 | GO:1990822 | basic amino acid transmembrane transport(GO:1990822) |
| 0.1 | 0.4 | GO:0061743 | motor learning(GO:0061743) |
| 0.0 | 0.1 | GO:0030221 | basophil differentiation(GO:0030221) |
| 0.0 | 0.5 | GO:0035726 | common myeloid progenitor cell proliferation(GO:0035726) |
| 0.0 | 0.0 | GO:0060139 | positive regulation by symbiont of host apoptotic process(GO:0052151) positive regulation of apoptotic process by virus(GO:0060139) |
| 0.0 | 0.5 | GO:0000101 | sulfur amino acid transport(GO:0000101) |
| 0.0 | 0.1 | GO:0002752 | cell surface pattern recognition receptor signaling pathway(GO:0002752) |
| 0.0 | 2.3 | GO:0050913 | sensory perception of bitter taste(GO:0050913) |
| 0.0 | 0.8 | GO:0050862 | positive regulation of T cell receptor signaling pathway(GO:0050862) |
| 0.0 | 0.4 | GO:1903912 | negative regulation of PERK-mediated unfolded protein response(GO:1903898) negative regulation of endoplasmic reticulum stress-induced eIF2 alpha phosphorylation(GO:1903912) |
| 0.0 | 0.4 | GO:0006065 | UDP-glucuronate biosynthetic process(GO:0006065) |
| 0.0 | 0.3 | GO:1900425 | negative regulation of defense response to bacterium(GO:1900425) |
| 0.0 | 0.4 | GO:0036371 | protein localization to T-tubule(GO:0036371) |
| 0.0 | 0.6 | GO:0001865 | NK T cell differentiation(GO:0001865) |
| 0.0 | 0.4 | GO:0035965 | cardiolipin acyl-chain remodeling(GO:0035965) |
| 0.0 | 0.8 | GO:0006558 | L-phenylalanine metabolic process(GO:0006558) L-phenylalanine catabolic process(GO:0006559) erythrose 4-phosphate/phosphoenolpyruvate family amino acid metabolic process(GO:1902221) erythrose 4-phosphate/phosphoenolpyruvate family amino acid catabolic process(GO:1902222) |
| 0.0 | 0.1 | GO:1903721 | regulation of I-kappaB phosphorylation(GO:1903719) positive regulation of I-kappaB phosphorylation(GO:1903721) |
| 0.0 | 0.7 | GO:0031987 | locomotion involved in locomotory behavior(GO:0031987) |
| 0.0 | 0.6 | GO:0002862 | negative regulation of inflammatory response to antigenic stimulus(GO:0002862) |
| 0.0 | 0.2 | GO:0050915 | detection of chemical stimulus involved in sensory perception of taste(GO:0050912) sensory perception of sour taste(GO:0050915) |
| 0.0 | 0.2 | GO:0043137 | DNA replication, removal of RNA primer(GO:0043137) |
| 0.0 | 0.8 | GO:0006071 | glycerol metabolic process(GO:0006071) |
| 0.0 | 1.4 | GO:1904659 | hexose transmembrane transport(GO:0035428) glucose transmembrane transport(GO:1904659) |
| 0.0 | 0.5 | GO:0051601 | exocyst localization(GO:0051601) |
| 0.0 | 0.3 | GO:0072513 | positive regulation of secondary heart field cardioblast proliferation(GO:0072513) |
| 0.0 | 0.1 | GO:0019878 | lysine biosynthetic process(GO:0009085) lysine biosynthetic process via aminoadipic acid(GO:0019878) |
| 0.0 | 0.3 | GO:0007197 | adenylate cyclase-inhibiting G-protein coupled acetylcholine receptor signaling pathway(GO:0007197) |
| 0.0 | 0.4 | GO:1903142 | positive regulation of endothelial cell development(GO:1901552) positive regulation of establishment of endothelial barrier(GO:1903142) |
| 0.0 | 0.3 | GO:0002191 | cap-dependent translational initiation(GO:0002191) |
| 0.0 | 1.5 | GO:0050873 | brown fat cell differentiation(GO:0050873) |
| 0.0 | 0.5 | GO:0002455 | humoral immune response mediated by circulating immunoglobulin(GO:0002455) |
| 0.0 | 0.2 | GO:1903232 | melanosome assembly(GO:1903232) |
| 0.0 | 0.7 | GO:0050860 | negative regulation of T cell receptor signaling pathway(GO:0050860) |
| 0.0 | 0.8 | GO:0071380 | cellular response to prostaglandin E stimulus(GO:0071380) |
| 0.0 | 0.3 | GO:0060252 | positive regulation of glial cell proliferation(GO:0060252) |
| 0.0 | 0.3 | GO:0009133 | nucleoside diphosphate biosynthetic process(GO:0009133) |
| 0.0 | 0.2 | GO:0038110 | interleukin-2-mediated signaling pathway(GO:0038110) cellular response to interleukin-2(GO:0071352) |
| 0.0 | 0.3 | GO:0036444 | calcium ion transmembrane import into mitochondrion(GO:0036444) mitochondrial respiratory chain complex III biogenesis(GO:0097033) |
| 0.0 | 0.1 | GO:1990697 | protein depalmitoleylation(GO:1990697) |
| 0.0 | 0.3 | GO:0033690 | positive regulation of osteoblast proliferation(GO:0033690) |
| 0.0 | 1.1 | GO:0060216 | definitive hemopoiesis(GO:0060216) |
| 0.0 | 3.0 | GO:0050853 | B cell receptor signaling pathway(GO:0050853) |
| 0.0 | 0.4 | GO:0016322 | neuron remodeling(GO:0016322) |
| 0.0 | 0.7 | GO:0060334 | regulation of interferon-gamma-mediated signaling pathway(GO:0060334) |
| 0.0 | 0.4 | GO:0001833 | inner cell mass cell proliferation(GO:0001833) |
| 0.0 | 0.1 | GO:0051182 | coenzyme transport(GO:0051182) |
| 0.0 | 0.6 | GO:0097062 | dendritic spine maintenance(GO:0097062) |
| 0.0 | 0.1 | GO:0035880 | embryonic nail plate morphogenesis(GO:0035880) |
| 0.0 | 0.5 | GO:0090557 | establishment of endothelial intestinal barrier(GO:0090557) |
| 0.0 | 0.3 | GO:0007023 | post-chaperonin tubulin folding pathway(GO:0007023) |
| 0.0 | 0.4 | GO:0006228 | UTP biosynthetic process(GO:0006228) |
| 0.0 | 0.2 | GO:0006689 | ganglioside catabolic process(GO:0006689) |
| 0.0 | 0.2 | GO:0015860 | purine nucleoside transmembrane transport(GO:0015860) |
| 0.0 | 3.4 | GO:0002377 | immunoglobulin production(GO:0002377) |
| 0.0 | 0.8 | GO:0032012 | regulation of ARF protein signal transduction(GO:0032012) |
| 0.0 | 0.3 | GO:0071578 | zinc II ion transmembrane import(GO:0071578) |
| 0.0 | 0.3 | GO:0002385 | mucosal immune response(GO:0002385) |
| 0.0 | 0.2 | GO:0006537 | glutamate biosynthetic process(GO:0006537) |
| 0.0 | 0.3 | GO:0046951 | ketone body biosynthetic process(GO:0046951) |
| 0.0 | 0.1 | GO:0010968 | regulation of microtubule nucleation(GO:0010968) |
| 0.0 | 0.1 | GO:0072344 | rescue of stalled ribosome(GO:0072344) |
| 0.0 | 0.1 | GO:0097360 | chorionic trophoblast cell proliferation(GO:0097360) regulation of chorionic trophoblast cell proliferation(GO:1901382) positive regulation of PERK-mediated unfolded protein response(GO:1903899) |
| 0.0 | 0.2 | GO:0098582 | innate vocalization behavior(GO:0098582) |
| 0.0 | 2.3 | GO:0035335 | peptidyl-tyrosine dephosphorylation(GO:0035335) |
| 0.0 | 1.3 | GO:0018279 | protein N-linked glycosylation via asparagine(GO:0018279) |
| 0.0 | 0.0 | GO:0071930 | negative regulation of transcription involved in G1/S transition of mitotic cell cycle(GO:0071930) |
| 0.0 | 0.5 | GO:0035455 | response to interferon-alpha(GO:0035455) |
| 0.0 | 0.1 | GO:0051574 | positive regulation of histone H3-K9 methylation(GO:0051574) |
| 0.0 | 0.2 | GO:0015884 | folic acid transport(GO:0015884) |
| 0.0 | 0.8 | GO:0000413 | protein peptidyl-prolyl isomerization(GO:0000413) |
| 0.0 | 0.6 | GO:0048247 | lymphocyte chemotaxis(GO:0048247) |
| 0.0 | 0.1 | GO:1901097 | negative regulation of autophagosome maturation(GO:1901097) |
| 0.0 | 1.9 | GO:0019886 | antigen processing and presentation of exogenous peptide antigen via MHC class II(GO:0019886) |
| 0.0 | 0.4 | GO:0034063 | stress granule assembly(GO:0034063) |
| 0.0 | 0.1 | GO:0006432 | phenylalanyl-tRNA aminoacylation(GO:0006432) |
Gene overrepresentation in cellular component category:
| Log-likelihood per target | Total log-likelihood | Term | Description |
|---|---|---|---|
| 0.5 | 2.7 | GO:0019815 | B cell receptor complex(GO:0019815) |
| 0.2 | 3.0 | GO:0070552 | BRISC complex(GO:0070552) |
| 0.2 | 0.6 | GO:0030526 | granulocyte macrophage colony-stimulating factor receptor complex(GO:0030526) |
| 0.2 | 1.2 | GO:0005896 | interleukin-6 receptor complex(GO:0005896) |
| 0.2 | 2.1 | GO:0042612 | MHC class I protein complex(GO:0042612) |
| 0.2 | 0.8 | GO:0020003 | symbiont-containing vacuole(GO:0020003) |
| 0.2 | 3.2 | GO:0042611 | MHC protein complex(GO:0042611) |
| 0.1 | 2.5 | GO:0035631 | CD40 receptor complex(GO:0035631) |
| 0.1 | 0.3 | GO:0032002 | interleukin-28 receptor complex(GO:0032002) |
| 0.1 | 1.1 | GO:0042406 | extrinsic component of endoplasmic reticulum membrane(GO:0042406) |
| 0.1 | 1.4 | GO:0033256 | I-kappaB/NF-kappaB complex(GO:0033256) |
| 0.1 | 3.4 | GO:0071682 | endocytic vesicle lumen(GO:0071682) |
| 0.1 | 1.0 | GO:0042105 | alpha-beta T cell receptor complex(GO:0042105) |
| 0.1 | 0.3 | GO:1990075 | periciliary membrane compartment(GO:1990075) |
| 0.1 | 0.2 | GO:0005889 | hydrogen:potassium-exchanging ATPase complex(GO:0005889) |
| 0.1 | 0.3 | GO:1902560 | GMP reductase complex(GO:1902560) |
| 0.1 | 0.8 | GO:0097486 | multivesicular body lumen(GO:0097486) |
| 0.1 | 0.2 | GO:0031085 | BLOC-3 complex(GO:0031085) |
| 0.0 | 0.9 | GO:0098839 | postsynaptic density membrane(GO:0098839) |
| 0.0 | 11.9 | GO:0072562 | blood microparticle(GO:0072562) |
| 0.0 | 1.1 | GO:0001527 | microfibril(GO:0001527) fibril(GO:0043205) |
| 0.0 | 1.0 | GO:1990454 | L-type voltage-gated calcium channel complex(GO:1990454) |
| 0.0 | 0.3 | GO:1990111 | spermatoproteasome complex(GO:1990111) |
| 0.0 | 0.6 | GO:0043240 | Fanconi anaemia nuclear complex(GO:0043240) |
| 0.0 | 0.6 | GO:0061702 | inflammasome complex(GO:0061702) |
| 0.0 | 0.1 | GO:0036195 | muscle cell projection(GO:0036194) muscle cell projection membrane(GO:0036195) |
| 0.0 | 1.6 | GO:0046658 | anchored component of plasma membrane(GO:0046658) |
| 0.0 | 0.2 | GO:0005610 | laminin-5 complex(GO:0005610) |
| 0.0 | 2.4 | GO:0030670 | phagocytic vesicle membrane(GO:0030670) |
| 0.0 | 0.4 | GO:0008290 | F-actin capping protein complex(GO:0008290) |
| 0.0 | 0.3 | GO:0005785 | signal recognition particle receptor complex(GO:0005785) |
| 0.0 | 0.3 | GO:0005750 | mitochondrial respiratory chain complex III(GO:0005750) respiratory chain complex III(GO:0045275) |
| 0.0 | 0.1 | GO:0055087 | Ski complex(GO:0055087) |
| 0.0 | 0.7 | GO:0005942 | phosphatidylinositol 3-kinase complex(GO:0005942) |
| 0.0 | 0.5 | GO:0000145 | exocyst(GO:0000145) |
| 0.0 | 1.1 | GO:0008180 | COP9 signalosome(GO:0008180) |
| 0.0 | 0.3 | GO:0030008 | TRAPP complex(GO:0030008) |
| 0.0 | 0.7 | GO:0005719 | nuclear euchromatin(GO:0005719) |
| 0.0 | 0.5 | GO:0032809 | neuronal cell body membrane(GO:0032809) cell body membrane(GO:0044298) |
| 0.0 | 0.3 | GO:0016281 | eukaryotic translation initiation factor 4F complex(GO:0016281) |
| 0.0 | 0.9 | GO:0042645 | nucleoid(GO:0009295) mitochondrial nucleoid(GO:0042645) |
| 0.0 | 0.3 | GO:0031045 | dense core granule(GO:0031045) |
| 0.0 | 0.6 | GO:0032839 | dendrite cytoplasm(GO:0032839) |
| 0.0 | 0.2 | GO:0008250 | oligosaccharyltransferase complex(GO:0008250) |
| 0.0 | 0.0 | GO:0035189 | Rb-E2F complex(GO:0035189) |
| 0.0 | 0.3 | GO:0036038 | MKS complex(GO:0036038) |
| 0.0 | 0.2 | GO:0005641 | nuclear envelope lumen(GO:0005641) |
| 0.0 | 1.4 | GO:0101003 | ficolin-1-rich granule membrane(GO:0101003) |
| 0.0 | 0.2 | GO:0016013 | syntrophin complex(GO:0016013) |
| 0.0 | 1.2 | GO:0010494 | cytoplasmic stress granule(GO:0010494) |
| 0.0 | 0.8 | GO:0016235 | aggresome(GO:0016235) |
| 0.0 | 0.2 | GO:0000164 | protein phosphatase type 1 complex(GO:0000164) |
| 0.0 | 3.9 | GO:0009898 | cytoplasmic side of plasma membrane(GO:0009898) |
Gene overrepresentation in molecular function category:
| Log-likelihood per target | Total log-likelihood | Term | Description |
|---|---|---|---|
| 0.7 | 2.0 | GO:0001861 | complement component C4b receptor activity(GO:0001861) complement component C3b receptor activity(GO:0004877) |
| 0.6 | 3.1 | GO:0048248 | CXCR3 chemokine receptor binding(GO:0048248) |
| 0.5 | 5.2 | GO:0045236 | CXCR chemokine receptor binding(GO:0045236) |
| 0.3 | 3.0 | GO:0008732 | glycine hydroxymethyltransferase activity(GO:0004372) threonine aldolase activity(GO:0004793) L-allo-threonine aldolase activity(GO:0008732) |
| 0.3 | 1.9 | GO:0004962 | endothelin receptor activity(GO:0004962) |
| 0.2 | 1.4 | GO:1902122 | chenodeoxycholic acid binding(GO:1902122) |
| 0.2 | 0.7 | GO:0005290 | L-histidine transmembrane transporter activity(GO:0005290) L-asparagine transmembrane transporter activity(GO:0015182) |
| 0.2 | 1.7 | GO:0046979 | TAP2 binding(GO:0046979) |
| 0.2 | 1.6 | GO:0004873 | asialoglycoprotein receptor activity(GO:0004873) |
| 0.2 | 1.2 | GO:0008823 | cupric reductase activity(GO:0008823) ferric-chelate reductase (NADPH) activity(GO:0052851) |
| 0.2 | 0.8 | GO:0004914 | interleukin-5 receptor activity(GO:0004914) |
| 0.2 | 2.7 | GO:0032395 | MHC class II receptor activity(GO:0032395) |
| 0.2 | 0.5 | GO:0008480 | sarcosine dehydrogenase activity(GO:0008480) |
| 0.2 | 2.9 | GO:0031996 | thioesterase binding(GO:0031996) |
| 0.1 | 0.7 | GO:0004906 | interferon-gamma receptor activity(GO:0004906) |
| 0.1 | 0.8 | GO:0004505 | phenylalanine 4-monooxygenase activity(GO:0004505) |
| 0.1 | 1.2 | GO:0005138 | interleukin-6 receptor binding(GO:0005138) |
| 0.1 | 0.6 | GO:0004666 | prostaglandin-endoperoxide synthase activity(GO:0004666) arachidonate 15-lipoxygenase activity(GO:0050473) |
| 0.1 | 1.5 | GO:0016015 | morphogen activity(GO:0016015) |
| 0.1 | 0.5 | GO:0004088 | carbamoyl-phosphate synthase (ammonia) activity(GO:0004087) carbamoyl-phosphate synthase (glutamine-hydrolyzing) activity(GO:0004088) |
| 0.1 | 1.3 | GO:0015272 | ATP-activated inward rectifier potassium channel activity(GO:0015272) |
| 0.1 | 0.4 | GO:0001641 | group II metabotropic glutamate receptor activity(GO:0001641) |
| 0.1 | 1.1 | GO:0030368 | interleukin-17 receptor activity(GO:0030368) |
| 0.1 | 0.5 | GO:0042289 | MHC class II protein binding(GO:0042289) |
| 0.1 | 0.8 | GO:0031730 | CCR5 chemokine receptor binding(GO:0031730) |
| 0.1 | 0.8 | GO:0003846 | 2-acylglycerol O-acyltransferase activity(GO:0003846) |
| 0.1 | 0.3 | GO:0004421 | hydroxymethylglutaryl-CoA synthase activity(GO:0004421) |
| 0.1 | 0.3 | GO:0004307 | ethanolaminephosphotransferase activity(GO:0004307) |
| 0.1 | 1.8 | GO:0004955 | prostaglandin receptor activity(GO:0004955) |
| 0.1 | 0.2 | GO:0032428 | sphingolipid activator protein activity(GO:0030290) beta-N-acetylgalactosaminidase activity(GO:0032428) |
| 0.1 | 0.7 | GO:0001594 | trace-amine receptor activity(GO:0001594) |
| 0.1 | 1.0 | GO:0086056 | voltage-gated calcium channel activity involved in AV node cell action potential(GO:0086056) |
| 0.1 | 0.4 | GO:0016509 | long-chain-3-hydroxyacyl-CoA dehydrogenase activity(GO:0016509) |
| 0.1 | 1.2 | GO:0004865 | protein serine/threonine phosphatase inhibitor activity(GO:0004865) |
| 0.1 | 0.6 | GO:0008597 | calcium-dependent protein serine/threonine phosphatase regulator activity(GO:0008597) |
| 0.1 | 1.4 | GO:0055056 | D-glucose transmembrane transporter activity(GO:0055056) |
| 0.1 | 0.8 | GO:0046790 | virion binding(GO:0046790) |
| 0.1 | 0.8 | GO:0001727 | lipid kinase activity(GO:0001727) |
| 0.1 | 16.1 | GO:0003823 | antigen binding(GO:0003823) |
| 0.1 | 2.3 | GO:0070628 | proteasome binding(GO:0070628) |
| 0.1 | 0.6 | GO:0005094 | Rho GDP-dissociation inhibitor activity(GO:0005094) |
| 0.1 | 0.3 | GO:0003920 | GMP reductase activity(GO:0003920) oxidoreductase activity, acting on NAD(P)H, nitrogenous group as acceptor(GO:0016657) |
| 0.1 | 0.7 | GO:0008474 | palmitoyl-(protein) hydrolase activity(GO:0008474) palmitoyl hydrolase activity(GO:0098599) |
| 0.1 | 2.6 | GO:0042056 | chemoattractant activity(GO:0042056) |
| 0.1 | 0.2 | GO:0005415 | nucleoside:sodium symporter activity(GO:0005415) |
| 0.0 | 0.2 | GO:0016639 | oxidoreductase activity, acting on the CH-NH2 group of donors, NAD or NADP as acceptor(GO:0016639) |
| 0.0 | 0.5 | GO:0000099 | sulfur amino acid transmembrane transporter activity(GO:0000099) |
| 0.0 | 0.2 | GO:0005010 | insulin-like growth factor-activated receptor activity(GO:0005010) |
| 0.0 | 1.1 | GO:0035613 | RNA stem-loop binding(GO:0035613) |
| 0.0 | 0.1 | GO:0004583 | dolichyl-phosphate-glucose-glycolipid alpha-glucosyltransferase activity(GO:0004583) |
| 0.0 | 1.2 | GO:0030169 | low-density lipoprotein particle binding(GO:0030169) |
| 0.0 | 1.4 | GO:0004181 | metallocarboxypeptidase activity(GO:0004181) |
| 0.0 | 0.3 | GO:0005047 | signal recognition particle binding(GO:0005047) |
| 0.0 | 0.3 | GO:0045029 | UDP-activated nucleotide receptor activity(GO:0045029) |
| 0.0 | 0.5 | GO:0032393 | MHC class I receptor activity(GO:0032393) thyroid hormone binding(GO:0070324) |
| 0.0 | 0.3 | GO:0031849 | olfactory receptor binding(GO:0031849) |
| 0.0 | 0.4 | GO:0015165 | pyrimidine nucleotide-sugar transmembrane transporter activity(GO:0015165) |
| 0.0 | 0.3 | GO:0016907 | G-protein coupled acetylcholine receptor activity(GO:0016907) |
| 0.0 | 0.5 | GO:0017017 | MAP kinase tyrosine/serine/threonine phosphatase activity(GO:0017017) |
| 0.0 | 0.6 | GO:0008391 | arachidonic acid monooxygenase activity(GO:0008391) arachidonic acid epoxygenase activity(GO:0008392) |
| 0.0 | 0.2 | GO:0008309 | double-stranded DNA exodeoxyribonuclease activity(GO:0008309) 5'-flap endonuclease activity(GO:0017108) |
| 0.0 | 0.1 | GO:0051185 | coenzyme transporter activity(GO:0051185) |
| 0.0 | 0.6 | GO:0031681 | G-protein beta-subunit binding(GO:0031681) |
| 0.0 | 0.4 | GO:0070181 | small ribosomal subunit rRNA binding(GO:0070181) |
| 0.0 | 0.2 | GO:0001602 | pancreatic polypeptide receptor activity(GO:0001602) |
| 0.0 | 0.5 | GO:0015174 | basic amino acid transmembrane transporter activity(GO:0015174) |
| 0.0 | 0.2 | GO:0004301 | epoxide hydrolase activity(GO:0004301) |
| 0.0 | 0.8 | GO:0005528 | macrolide binding(GO:0005527) FK506 binding(GO:0005528) |
| 0.0 | 1.0 | GO:0019198 | transmembrane receptor protein tyrosine phosphatase activity(GO:0005001) transmembrane receptor protein phosphatase activity(GO:0019198) |
| 0.0 | 0.6 | GO:0051864 | histone demethylase activity (H3-K36 specific)(GO:0051864) |
| 0.0 | 1.0 | GO:0001972 | retinoic acid binding(GO:0001972) |
| 0.0 | 0.3 | GO:0015093 | ferrous iron transmembrane transporter activity(GO:0015093) |
| 0.0 | 0.1 | GO:1990699 | palmitoleyl hydrolase activity(GO:1990699) |
| 0.0 | 1.6 | GO:0005160 | transforming growth factor beta receptor binding(GO:0005160) |
| 0.0 | 1.2 | GO:0043027 | cysteine-type endopeptidase inhibitor activity involved in apoptotic process(GO:0043027) |
| 0.0 | 0.7 | GO:0048020 | CCR chemokine receptor binding(GO:0048020) |
| 0.0 | 0.1 | GO:0008479 | queuine tRNA-ribosyltransferase activity(GO:0008479) |
| 0.0 | 0.1 | GO:0032422 | purine-rich negative regulatory element binding(GO:0032422) |
| 0.0 | 0.6 | GO:0001087 | transcription factor activity, sequence-specific DNA binding, RNA polymerase recruiting(GO:0001011) transcription factor activity, TFIIB-class binding(GO:0001087) |
| 0.0 | 1.3 | GO:0004683 | calmodulin-dependent protein kinase activity(GO:0004683) |
| 0.0 | 0.6 | GO:0005031 | tumor necrosis factor-activated receptor activity(GO:0005031) death receptor activity(GO:0005035) |
| 0.0 | 0.3 | GO:0061578 | Lys63-specific deubiquitinase activity(GO:0061578) |
| 0.0 | 0.1 | GO:0046970 | NAD-dependent histone deacetylase activity (H4-K16 specific)(GO:0046970) |
| 0.0 | 0.4 | GO:0004000 | adenosine deaminase activity(GO:0004000) |
| 0.0 | 2.5 | GO:0004725 | protein tyrosine phosphatase activity(GO:0004725) |
| 0.0 | 0.8 | GO:0070840 | dynein complex binding(GO:0070840) |
| 0.0 | 0.2 | GO:0016308 | 1-phosphatidylinositol-4-phosphate 5-kinase activity(GO:0016308) |
| 0.0 | 1.8 | GO:0004715 | non-membrane spanning protein tyrosine kinase activity(GO:0004715) |
| 0.0 | 0.6 | GO:0005109 | frizzled binding(GO:0005109) |
| 0.0 | 0.3 | GO:0017110 | nucleoside-diphosphatase activity(GO:0017110) |
| 0.0 | 0.8 | GO:0005086 | ARF guanyl-nucleotide exchange factor activity(GO:0005086) |
| 0.0 | 1.8 | GO:0005070 | SH3/SH2 adaptor activity(GO:0005070) |
| 0.0 | 0.6 | GO:0005164 | tumor necrosis factor receptor binding(GO:0005164) |
| 0.0 | 0.1 | GO:0008440 | inositol-1,4,5-trisphosphate 3-kinase activity(GO:0008440) |
| 0.0 | 0.5 | GO:0005251 | delayed rectifier potassium channel activity(GO:0005251) |
| 0.0 | 0.3 | GO:0008190 | eukaryotic initiation factor 4E binding(GO:0008190) |
| 0.0 | 0.3 | GO:0008301 | DNA binding, bending(GO:0008301) |
| 0.0 | 0.4 | GO:0004707 | MAP kinase activity(GO:0004707) |
| 0.0 | 0.1 | GO:0015277 | kainate selective glutamate receptor activity(GO:0015277) |
| 0.0 | 0.0 | GO:0098640 | integrin binding involved in cell-matrix adhesion(GO:0098640) |
| 0.0 | 0.1 | GO:0004826 | phenylalanine-tRNA ligase activity(GO:0004826) |
Gene overrepresentation in curated gene sets: canonical pathways category:
| Log-likelihood per target | Total log-likelihood | Term | Description |
|---|---|---|---|
| 0.1 | 3.1 | ST STAT3 PATHWAY | STAT3 Pathway |
| 0.1 | 2.6 | PID THROMBIN PAR4 PATHWAY | PAR4-mediated thrombin signaling events |
| 0.1 | 2.3 | PID TCR RAS PATHWAY | Ras signaling in the CD4+ TCR pathway |
| 0.1 | 2.8 | ST GRANULE CELL SURVIVAL PATHWAY | Granule Cell Survival Pathway is a specific case of more general PAC1 Receptor Pathway. |
| 0.1 | 0.6 | PID NFKAPPAB ATYPICAL PATHWAY | Atypical NF-kappaB pathway |
| 0.1 | 4.2 | PID CD40 PATHWAY | CD40/CD40L signaling |
| 0.1 | 2.3 | PID TOLL ENDOGENOUS PATHWAY | Endogenous TLR signaling |
| 0.0 | 0.8 | PID IL5 PATHWAY | IL5-mediated signaling events |
| 0.0 | 2.9 | PID CXCR3 PATHWAY | CXCR3-mediated signaling events |
| 0.0 | 2.4 | PID IL8 CXCR2 PATHWAY | IL8- and CXCR2-mediated signaling events |
| 0.0 | 1.6 | PID GMCSF PATHWAY | GMCSF-mediated signaling events |
| 0.0 | 3.8 | PID BCR 5PATHWAY | BCR signaling pathway |
| 0.0 | 1.1 | PID IL27 PATHWAY | IL27-mediated signaling events |
| 0.0 | 1.5 | PID GLYPICAN 1PATHWAY | Glypican 1 network |
| 0.0 | 0.6 | PID S1P S1P1 PATHWAY | S1P1 pathway |
| 0.0 | 0.6 | PID IL23 PATHWAY | IL23-mediated signaling events |
| 0.0 | 1.8 | PID TXA2PATHWAY | Thromboxane A2 receptor signaling |
| 0.0 | 1.3 | PID CD8 TCR DOWNSTREAM PATHWAY | Downstream signaling in naïve CD8+ T cells |
| 0.0 | 0.7 | PID IL12 2PATHWAY | IL12-mediated signaling events |
| 0.0 | 0.2 | ST IL 13 PATHWAY | Interleukin 13 (IL-13) Pathway |
| 0.0 | 1.9 | PID ARF6 TRAFFICKING PATHWAY | Arf6 trafficking events |
| 0.0 | 0.8 | PID IL6 7 PATHWAY | IL6-mediated signaling events |
| 0.0 | 1.5 | PID BMP PATHWAY | BMP receptor signaling |
| 0.0 | 0.9 | PID KIT PATHWAY | Signaling events mediated by Stem cell factor receptor (c-Kit) |
| 0.0 | 0.8 | ST G ALPHA I PATHWAY | G alpha i Pathway |
| 0.0 | 0.5 | PID P38 ALPHA BETA PATHWAY | Regulation of p38-alpha and p38-beta |
| 0.0 | 1.0 | PID RXR VDR PATHWAY | RXR and RAR heterodimerization with other nuclear receptor |
| 0.0 | 0.8 | PID UPA UPAR PATHWAY | Urokinase-type plasminogen activator (uPA) and uPAR-mediated signaling |
| 0.0 | 0.2 | PID INTEGRIN4 PATHWAY | Alpha6 beta4 integrin-ligand interactions |
| 0.0 | 0.6 | PID ANGIOPOIETIN RECEPTOR PATHWAY | Angiopoietin receptor Tie2-mediated signaling |
| 0.0 | 0.3 | ST DIFFERENTIATION PATHWAY IN PC12 CELLS | Differentiation Pathway in PC12 Cells; this is a specific case of PAC1 Receptor Pathway. |
Gene overrepresentation in curated gene sets: REACTOME pathways category:
| Log-likelihood per target | Total log-likelihood | Term | Description |
|---|---|---|---|
| 0.2 | 2.1 | REACTOME ENDOSOMAL VACUOLAR PATHWAY | Genes involved in Endosomal/Vacuolar pathway |
| 0.1 | 2.0 | REACTOME REGULATION OF INSULIN SECRETION BY ACETYLCHOLINE | Genes involved in Regulation of Insulin Secretion by Acetylcholine |
| 0.1 | 1.8 | REACTOME PROSTANOID LIGAND RECEPTORS | Genes involved in Prostanoid ligand receptors |
| 0.1 | 9.0 | REACTOME CHEMOKINE RECEPTORS BIND CHEMOKINES | Genes involved in Chemokine receptors bind chemokines |
| 0.1 | 3.3 | REACTOME PD1 SIGNALING | Genes involved in PD-1 signaling |
| 0.1 | 2.0 | REACTOME IL 6 SIGNALING | Genes involved in Interleukin-6 signaling |
| 0.1 | 3.0 | REACTOME ADVANCED GLYCOSYLATION ENDPRODUCT RECEPTOR SIGNALING | Genes involved in Advanced glycosylation endproduct receptor signaling |
| 0.1 | 1.5 | REACTOME COMMON PATHWAY | Genes involved in Common Pathway |
| 0.1 | 2.2 | REACTOME ACTIVATION OF IRF3 IRF7 MEDIATED BY TBK1 IKK EPSILON | Genes involved in Activation of IRF3/IRF7 mediated by TBK1/IKK epsilon |
| 0.1 | 2.0 | REACTOME REGULATION OF COMPLEMENT CASCADE | Genes involved in Regulation of Complement cascade |
| 0.1 | 0.8 | REACTOME TRAFFICKING AND PROCESSING OF ENDOSOMAL TLR | Genes involved in Trafficking and processing of endosomal TLR |
| 0.1 | 0.7 | REACTOME REGULATION OF IFNG SIGNALING | Genes involved in Regulation of IFNG signaling |
| 0.1 | 1.9 | REACTOME IL RECEPTOR SHC SIGNALING | Genes involved in Interleukin receptor SHC signaling |
| 0.0 | 1.4 | REACTOME FACILITATIVE NA INDEPENDENT GLUCOSE TRANSPORTERS | Genes involved in Facilitative Na+-independent glucose transporters |
| 0.0 | 1.4 | REACTOME GLUCURONIDATION | Genes involved in Glucuronidation |
| 0.0 | 0.4 | REACTOME TAK1 ACTIVATES NFKB BY PHOSPHORYLATION AND ACTIVATION OF IKKS COMPLEX | Genes involved in TAK1 activates NFkB by phosphorylation and activation of IKKs complex |
| 0.0 | 2.1 | REACTOME GPVI MEDIATED ACTIVATION CASCADE | Genes involved in GPVI-mediated activation cascade |
| 0.0 | 2.5 | REACTOME ANTIGEN ACTIVATES B CELL RECEPTOR LEADING TO GENERATION OF SECOND MESSENGERS | Genes involved in Antigen Activates B Cell Receptor Leading to Generation of Second Messengers |
| 0.0 | 2.2 | REACTOME NOD1 2 SIGNALING PATHWAY | Genes involved in NOD1/2 Signaling Pathway |
| 0.0 | 0.6 | REACTOME XENOBIOTICS | Genes involved in Xenobiotics |
| 0.0 | 0.4 | REACTOME SEMA3A PLEXIN REPULSION SIGNALING BY INHIBITING INTEGRIN ADHESION | Genes involved in SEMA3A-Plexin repulsion signaling by inhibiting Integrin adhesion |
| 0.0 | 0.8 | REACTOME REGULATION OF INSULIN LIKE GROWTH FACTOR IGF ACTIVITY BY INSULIN LIKE GROWTH FACTOR BINDING PROTEINS IGFBPS | Genes involved in Regulation of Insulin-like Growth Factor (IGF) Activity by Insulin-like Growth Factor Binding Proteins (IGFBPs) |
| 0.0 | 1.5 | REACTOME INHIBITION OF VOLTAGE GATED CA2 CHANNELS VIA GBETA GAMMA SUBUNITS | Genes involved in Inhibition of voltage gated Ca2+ channels via Gbeta/gamma subunits |
| 0.0 | 2.3 | REACTOME INTERFERON ALPHA BETA SIGNALING | Genes involved in Interferon alpha/beta signaling |
| 0.0 | 0.6 | REACTOME FANCONI ANEMIA PATHWAY | Genes involved in Fanconi Anemia pathway |
| 0.0 | 0.4 | REACTOME MITOCHONDRIAL FATTY ACID BETA OXIDATION | Genes involved in Mitochondrial Fatty Acid Beta-Oxidation |
| 0.0 | 0.5 | REACTOME PURINE SALVAGE | Genes involved in Purine salvage |
| 0.0 | 0.9 | REACTOME AMINE LIGAND BINDING RECEPTORS | Genes involved in Amine ligand-binding receptors |
| 0.0 | 2.5 | REACTOME PEPTIDE LIGAND BINDING RECEPTORS | Genes involved in Peptide ligand-binding receptors |
| 0.0 | 1.1 | REACTOME AMINO ACID TRANSPORT ACROSS THE PLASMA MEMBRANE | Genes involved in Amino acid transport across the plasma membrane |
| 0.0 | 0.3 | REACTOME MTORC1 MEDIATED SIGNALLING | Genes involved in mTORC1-mediated signalling |
| 0.0 | 0.4 | REACTOME CYTOSOLIC SULFONATION OF SMALL MOLECULES | Genes involved in Cytosolic sulfonation of small molecules |
| 0.0 | 0.5 | REACTOME AMINO ACID AND OLIGOPEPTIDE SLC TRANSPORTERS | Genes involved in Amino acid and oligopeptide SLC transporters |
| 0.0 | 0.8 | REACTOME G ALPHA Z SIGNALLING EVENTS | Genes involved in G alpha (z) signalling events |
| 0.0 | 1.2 | REACTOME CLASS B 2 SECRETIN FAMILY RECEPTORS | Genes involved in Class B/2 (Secretin family receptors) |
| 0.0 | 0.2 | REACTOME REMOVAL OF THE FLAP INTERMEDIATE FROM THE C STRAND | Genes involved in Removal of the Flap Intermediate from the C-strand |
| 0.0 | 0.3 | REACTOME P2Y RECEPTORS | Genes involved in P2Y receptors |
| 0.0 | 0.9 | REACTOME ACTIVATION OF NF KAPPAB IN B CELLS | Genes involved in Activation of NF-kappaB in B Cells |