Project
Illumina Body Map 2 (GSE30611)
Navigation
Downloads
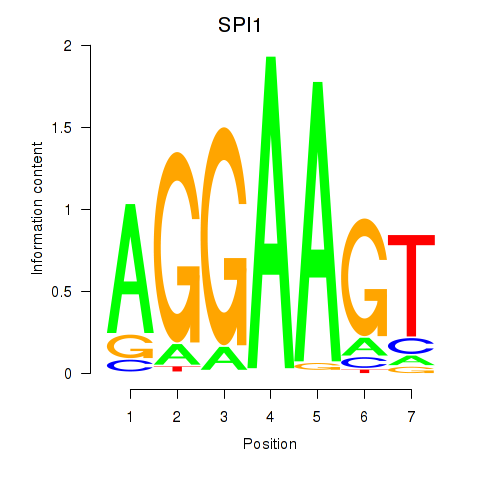
Results for SPI1
Z-value: 4.92
Motif logo
Transcription factors associated with SPI1
| Gene Symbol | Gene ID | Gene Info |
|---|---|---|
|
SPI1
|
ENSG00000066336.12 | Spi-1 proto-oncogene |
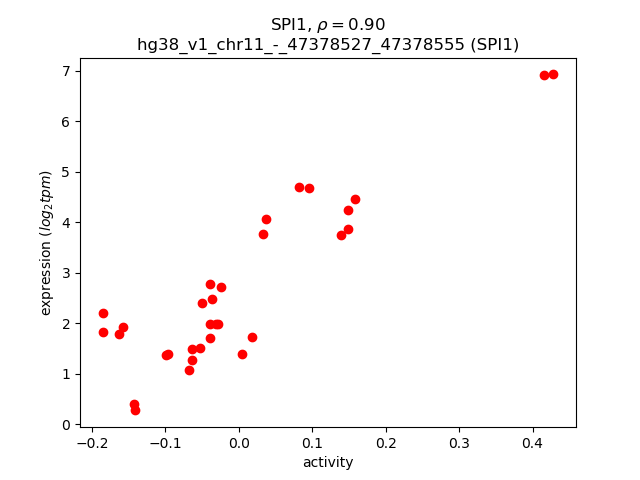
Activity-expression correlation:
| Gene | Promoter | Pearson corr. coef. | P-value | Plot |
|---|---|---|---|---|
| SPI1 | hg38_v1_chr11_-_47378527_47378555 | 0.90 | 4.3e-12 | Click! |
Activity profile of SPI1 motif
Sorted Z-values of SPI1 motif
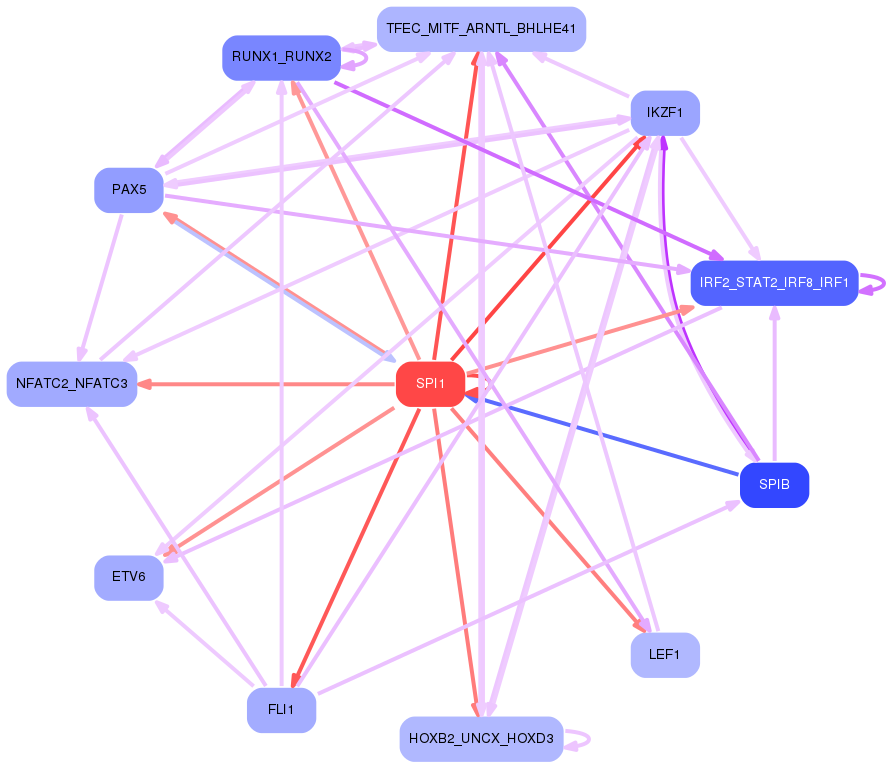
Network of associatons between targets according to the STRING database.

First level regulatory network of SPI1
Gene Ontology Analysis
Gene overrepresentation in biological process category:
| Log-likelihood per target | Total log-likelihood | Term | Description |
|---|---|---|---|
| 23.0 | 114.8 | GO:2000471 | regulation of hematopoietic stem cell migration(GO:2000471) positive regulation of hematopoietic stem cell migration(GO:2000473) |
| 13.6 | 40.9 | GO:0034769 | basement membrane disassembly(GO:0034769) |
| 10.9 | 10.9 | GO:1903973 | negative regulation of macrophage colony-stimulating factor signaling pathway(GO:1902227) negative regulation of response to macrophage colony-stimulating factor(GO:1903970) negative regulation of cellular response to macrophage colony-stimulating factor stimulus(GO:1903973) |
| 10.0 | 40.2 | GO:0045658 | regulation of neutrophil differentiation(GO:0045658) negative regulation of neutrophil differentiation(GO:0045659) |
| 9.5 | 19.0 | GO:1902567 | negative regulation of eosinophil activation(GO:1902567) |
| 8.2 | 40.9 | GO:0002357 | defense response to tumor cell(GO:0002357) |
| 8.0 | 55.7 | GO:0044027 | hypermethylation of CpG island(GO:0044027) |
| 7.8 | 62.7 | GO:0002322 | B cell proliferation involved in immune response(GO:0002322) |
| 7.0 | 21.0 | GO:0002752 | cell surface pattern recognition receptor signaling pathway(GO:0002752) |
| 6.5 | 19.5 | GO:0043376 | regulation of CD8-positive, alpha-beta T cell differentiation(GO:0043376) |
| 6.1 | 30.5 | GO:0002913 | positive regulation of T cell anergy(GO:0002669) positive regulation of lymphocyte anergy(GO:0002913) |
| 6.0 | 18.0 | GO:0001808 | negative regulation of type IV hypersensitivity(GO:0001808) |
| 4.9 | 24.7 | GO:0003366 | cell-matrix adhesion involved in ameboidal cell migration(GO:0003366) |
| 4.8 | 4.8 | GO:0034125 | negative regulation of MyD88-dependent toll-like receptor signaling pathway(GO:0034125) |
| 4.8 | 14.3 | GO:1904844 | response to L-glutamine(GO:1904844) cellular response to L-glutamine(GO:1904845) |
| 4.6 | 46.2 | GO:0000821 | regulation of arginine metabolic process(GO:0000821) |
| 4.6 | 18.2 | GO:0045399 | positive regulation of interleukin-3 production(GO:0032752) interleukin-3 biosynthetic process(GO:0042223) regulation of interleukin-3 biosynthetic process(GO:0045399) positive regulation of interleukin-3 biosynthetic process(GO:0045401) |
| 4.2 | 42.4 | GO:0038110 | interleukin-2-mediated signaling pathway(GO:0038110) |
| 4.2 | 25.3 | GO:0071461 | cellular response to redox state(GO:0071461) |
| 4.1 | 12.4 | GO:0061485 | memory T cell proliferation(GO:0061485) |
| 4.0 | 67.5 | GO:1900017 | positive regulation of cytokine production involved in inflammatory response(GO:1900017) |
| 3.9 | 11.8 | GO:0070662 | mast cell proliferation(GO:0070662) |
| 3.7 | 11.1 | GO:0002876 | positive regulation of chronic inflammatory response to antigenic stimulus(GO:0002876) positive regulation of translational initiation by iron(GO:0045994) positive regulation of vitamin metabolic process(GO:0046136) positive regulation of vitamin D biosynthetic process(GO:0060557) positive regulation of calcidiol 1-monooxygenase activity(GO:0060559) |
| 3.6 | 21.9 | GO:0050859 | negative regulation of B cell receptor signaling pathway(GO:0050859) |
| 3.5 | 21.2 | GO:0010897 | negative regulation of triglyceride catabolic process(GO:0010897) |
| 3.4 | 17.0 | GO:0033031 | positive regulation of neutrophil apoptotic process(GO:0033031) |
| 3.2 | 12.9 | GO:0001915 | negative regulation of T cell mediated cytotoxicity(GO:0001915) |
| 3.2 | 9.6 | GO:0017186 | peptidyl-pyroglutamic acid biosynthetic process, using glutaminyl-peptide cyclotransferase(GO:0017186) |
| 2.9 | 11.7 | GO:0035606 | peptidyl-cysteine S-trans-nitrosylation(GO:0035606) |
| 2.9 | 2.9 | GO:0002884 | negative regulation of hypersensitivity(GO:0002884) |
| 2.9 | 2.9 | GO:1903006 | regulation of protein K63-linked deubiquitination(GO:1903004) positive regulation of protein K63-linked deubiquitination(GO:1903006) |
| 2.8 | 11.1 | GO:0042631 | cellular response to water deprivation(GO:0042631) |
| 2.7 | 13.7 | GO:0039650 | modulation by virus of host molecular function(GO:0039506) suppression by virus of host molecular function(GO:0039507) suppression by virus of host catalytic activity(GO:0039513) modulation by virus of host catalytic activity(GO:0039516) suppression by virus of host cysteine-type endopeptidase activity involved in apoptotic process(GO:0039650) negative regulation by symbiont of host catalytic activity(GO:0052053) negative regulation by symbiont of host molecular function(GO:0052056) modulation by symbiont of host catalytic activity(GO:0052148) |
| 2.7 | 10.7 | GO:0002032 | desensitization of G-protein coupled receptor protein signaling pathway by arrestin(GO:0002032) |
| 2.7 | 5.3 | GO:0033029 | regulation of neutrophil apoptotic process(GO:0033029) |
| 2.6 | 7.9 | GO:1903595 | positive regulation of histamine secretion by mast cell(GO:1903595) |
| 2.3 | 7.0 | GO:0032701 | negative regulation of interleukin-18 production(GO:0032701) |
| 2.3 | 13.9 | GO:2000537 | regulation of B cell chemotaxis(GO:2000537) positive regulation of B cell chemotaxis(GO:2000538) |
| 2.3 | 95.6 | GO:0045730 | respiratory burst(GO:0045730) |
| 2.3 | 9.1 | GO:0021569 | rhombomere 3 development(GO:0021569) |
| 2.3 | 38.4 | GO:0002291 | T cell activation via T cell receptor contact with antigen bound to MHC molecule on antigen presenting cell(GO:0002291) |
| 2.2 | 24.6 | GO:0051534 | negative regulation of NFAT protein import into nucleus(GO:0051534) |
| 2.1 | 16.6 | GO:0035696 | monocyte extravasation(GO:0035696) |
| 2.1 | 8.2 | GO:0002625 | regulation of T cell antigen processing and presentation(GO:0002625) |
| 2.0 | 6.0 | GO:0035752 | lysosomal lumen pH elevation(GO:0035752) |
| 2.0 | 11.8 | GO:0002277 | myeloid dendritic cell activation involved in immune response(GO:0002277) |
| 1.9 | 5.8 | GO:0060876 | semicircular canal formation(GO:0060876) |
| 1.9 | 33.6 | GO:0048290 | isotype switching to IgA isotypes(GO:0048290) |
| 1.8 | 16.3 | GO:0061737 | leukotriene signaling pathway(GO:0061737) |
| 1.8 | 10.7 | GO:0010989 | negative regulation of low-density lipoprotein particle clearance(GO:0010989) |
| 1.7 | 3.4 | GO:0048861 | leukemia inhibitory factor signaling pathway(GO:0048861) |
| 1.7 | 6.9 | GO:1903445 | intermembrane transport(GO:0046909) protein transport from ciliary membrane to plasma membrane(GO:1903445) |
| 1.6 | 4.7 | GO:0070105 | regulation of interleukin-6-mediated signaling pathway(GO:0070103) positive regulation of interleukin-6-mediated signaling pathway(GO:0070105) |
| 1.5 | 4.5 | GO:0098974 | postsynaptic actin cytoskeleton organization(GO:0098974) |
| 1.4 | 2.8 | GO:1902463 | protein localization to cell leading edge(GO:1902463) |
| 1.4 | 4.2 | GO:0044725 | chromatin reprogramming in the zygote(GO:0044725) |
| 1.4 | 7.0 | GO:0034154 | toll-like receptor 7 signaling pathway(GO:0034154) |
| 1.4 | 37.5 | GO:0035855 | megakaryocyte development(GO:0035855) |
| 1.4 | 32.5 | GO:0050862 | positive regulation of T cell receptor signaling pathway(GO:0050862) |
| 1.3 | 5.3 | GO:0042939 | glutathione transport(GO:0034635) tripeptide transport(GO:0042939) |
| 1.3 | 6.7 | GO:0045084 | positive regulation of interleukin-12 biosynthetic process(GO:0045084) |
| 1.3 | 6.6 | GO:0007296 | vitellogenesis(GO:0007296) |
| 1.3 | 11.7 | GO:1902262 | apoptotic process involved in patterning of blood vessels(GO:1902262) |
| 1.2 | 2.5 | GO:2000525 | regulation of T cell costimulation(GO:2000523) positive regulation of T cell costimulation(GO:2000525) |
| 1.2 | 29.0 | GO:0051014 | actin filament severing(GO:0051014) |
| 1.2 | 3.6 | GO:0006844 | acyl carnitine transport(GO:0006844) acyl carnitine transmembrane transport(GO:1902616) |
| 1.2 | 60.5 | GO:0070207 | protein homotrimerization(GO:0070207) |
| 1.2 | 11.7 | GO:0008063 | Toll signaling pathway(GO:0008063) |
| 1.2 | 3.5 | GO:0060178 | regulation of exocyst assembly(GO:0001928) regulation of exocyst localization(GO:0060178) |
| 1.1 | 5.7 | GO:0032497 | detection of lipopolysaccharide(GO:0032497) |
| 1.1 | 17.7 | GO:0002315 | marginal zone B cell differentiation(GO:0002315) |
| 1.1 | 1.1 | GO:0060458 | right lung development(GO:0060458) |
| 1.1 | 6.6 | GO:0097368 | establishment of Sertoli cell barrier(GO:0097368) |
| 1.1 | 9.8 | GO:0031914 | negative regulation of synaptic plasticity(GO:0031914) |
| 1.1 | 2.1 | GO:2000646 | positive regulation of receptor catabolic process(GO:2000646) |
| 1.1 | 8.4 | GO:0038165 | oncostatin-M-mediated signaling pathway(GO:0038165) |
| 1.0 | 4.1 | GO:0045360 | regulation of interleukin-1 biosynthetic process(GO:0045360) positive regulation of interleukin-1 biosynthetic process(GO:0045362) |
| 1.0 | 6.2 | GO:0030037 | actin filament reorganization involved in cell cycle(GO:0030037) |
| 1.0 | 11.2 | GO:0002517 | T cell tolerance induction(GO:0002517) |
| 1.0 | 10.0 | GO:0071317 | cellular response to morphine(GO:0071315) cellular response to isoquinoline alkaloid(GO:0071317) |
| 1.0 | 6.0 | GO:2000158 | positive regulation of ubiquitin-specific protease activity(GO:2000158) |
| 1.0 | 39.4 | GO:0032753 | positive regulation of interleukin-4 production(GO:0032753) |
| 1.0 | 4.9 | GO:0038155 | interleukin-23-mediated signaling pathway(GO:0038155) |
| 1.0 | 19.3 | GO:0002523 | leukocyte migration involved in inflammatory response(GO:0002523) |
| 1.0 | 4.8 | GO:2000503 | positive regulation of natural killer cell chemotaxis(GO:2000503) |
| 0.9 | 5.7 | GO:0002457 | T cell antigen processing and presentation(GO:0002457) |
| 0.9 | 36.8 | GO:0097320 | membrane tubulation(GO:0097320) |
| 0.9 | 85.2 | GO:0006968 | cellular defense response(GO:0006968) |
| 0.9 | 10.0 | GO:0030854 | positive regulation of granulocyte differentiation(GO:0030854) |
| 0.9 | 4.5 | GO:0002384 | hepatic immune response(GO:0002384) |
| 0.9 | 8.0 | GO:0070236 | negative regulation of activation-induced cell death of T cells(GO:0070236) |
| 0.9 | 16.8 | GO:0070424 | regulation of nucleotide-binding oligomerization domain containing signaling pathway(GO:0070424) |
| 0.9 | 5.3 | GO:0060335 | positive regulation of response to interferon-gamma(GO:0060332) positive regulation of interferon-gamma-mediated signaling pathway(GO:0060335) |
| 0.9 | 4.3 | GO:0046543 | development of secondary female sexual characteristics(GO:0046543) |
| 0.8 | 4.1 | GO:0000379 | tRNA-type intron splice site recognition and cleavage(GO:0000379) |
| 0.8 | 17.4 | GO:0071803 | positive regulation of podosome assembly(GO:0071803) |
| 0.8 | 5.8 | GO:0050916 | sensory perception of sweet taste(GO:0050916) |
| 0.8 | 9.9 | GO:0016554 | cytidine to uridine editing(GO:0016554) |
| 0.8 | 4.9 | GO:0014846 | esophagus smooth muscle contraction(GO:0014846) |
| 0.8 | 63.7 | GO:0002260 | lymphocyte homeostasis(GO:0002260) |
| 0.8 | 2.4 | GO:0060623 | regulation of chromosome condensation(GO:0060623) |
| 0.8 | 19.9 | GO:0042832 | defense response to protozoan(GO:0042832) |
| 0.8 | 4.7 | GO:0006226 | dUMP biosynthetic process(GO:0006226) |
| 0.8 | 8.6 | GO:0043313 | regulation of neutrophil degranulation(GO:0043313) |
| 0.8 | 13.3 | GO:0010572 | positive regulation of platelet activation(GO:0010572) |
| 0.8 | 6.2 | GO:0002441 | histamine production involved in inflammatory response(GO:0002349) histamine secretion involved in inflammatory response(GO:0002441) histamine secretion by mast cell(GO:0002553) |
| 0.8 | 9.4 | GO:0002467 | germinal center formation(GO:0002467) |
| 0.8 | 18.6 | GO:0030220 | platelet formation(GO:0030220) |
| 0.8 | 3.1 | GO:0032904 | viral protein processing(GO:0019082) regulation of nerve growth factor production(GO:0032903) negative regulation of nerve growth factor production(GO:0032904) dibasic protein processing(GO:0090472) |
| 0.8 | 8.5 | GO:0002051 | osteoblast fate commitment(GO:0002051) |
| 0.8 | 6.9 | GO:0002254 | kinin cascade(GO:0002254) plasma kallikrein-kinin cascade(GO:0002353) |
| 0.8 | 9.2 | GO:0016127 | cholesterol catabolic process(GO:0006707) sterol catabolic process(GO:0016127) |
| 0.7 | 13.2 | GO:0036066 | protein O-linked fucosylation(GO:0036066) |
| 0.7 | 2.2 | GO:0007518 | myoblast fate determination(GO:0007518) |
| 0.7 | 13.8 | GO:0014877 | response to muscle inactivity involved in regulation of muscle adaptation(GO:0014877) response to denervation involved in regulation of muscle adaptation(GO:0014894) |
| 0.7 | 2.1 | GO:0086092 | regulation of the force of heart contraction by cardiac conduction(GO:0086092) |
| 0.7 | 2.8 | GO:0097045 | phosphatidylserine exposure on blood platelet(GO:0097045) |
| 0.7 | 16.0 | GO:0050930 | induction of positive chemotaxis(GO:0050930) |
| 0.7 | 2.1 | GO:1904826 | regulation of phenotypic switching by transcription from RNA polymerase II promoter(GO:0100057) regulation of hydrogen sulfide biosynthetic process(GO:1904826) positive regulation of hydrogen sulfide biosynthetic process(GO:1904828) |
| 0.7 | 5.5 | GO:1900226 | negative regulation of NLRP3 inflammasome complex assembly(GO:1900226) |
| 0.7 | 12.9 | GO:0045589 | regulation of regulatory T cell differentiation(GO:0045589) |
| 0.7 | 12.1 | GO:0072619 | interleukin-21 production(GO:0032625) interleukin-21 secretion(GO:0072619) |
| 0.7 | 7.4 | GO:1903715 | regulation of aerobic respiration(GO:1903715) |
| 0.7 | 16.9 | GO:0048247 | lymphocyte chemotaxis(GO:0048247) |
| 0.6 | 1.9 | GO:1990637 | response to prolactin(GO:1990637) |
| 0.6 | 17.6 | GO:0045954 | positive regulation of natural killer cell mediated cytotoxicity(GO:0045954) |
| 0.6 | 8.8 | GO:0090026 | positive regulation of monocyte chemotaxis(GO:0090026) |
| 0.6 | 1.9 | GO:1903674 | regulation of cap-dependent translational initiation(GO:1903674) positive regulation of cap-dependent translational initiation(GO:1903676) |
| 0.6 | 3.1 | GO:1905224 | clathrin-coated pit assembly(GO:1905224) |
| 0.6 | 45.8 | GO:0032945 | negative regulation of mononuclear cell proliferation(GO:0032945) negative regulation of lymphocyte proliferation(GO:0050672) |
| 0.6 | 9.0 | GO:0034447 | very-low-density lipoprotein particle clearance(GO:0034447) |
| 0.6 | 3.6 | GO:0051001 | negative regulation of nitric-oxide synthase activity(GO:0051001) |
| 0.6 | 5.3 | GO:0070345 | negative regulation of fat cell proliferation(GO:0070345) |
| 0.6 | 7.1 | GO:0043152 | induction of bacterial agglutination(GO:0043152) |
| 0.6 | 3.5 | GO:0050653 | chondroitin sulfate proteoglycan biosynthetic process, polysaccharide chain biosynthetic process(GO:0050653) |
| 0.6 | 1.8 | GO:0060957 | endocardial cell fate commitment(GO:0060957) endocardial cushion cell fate commitment(GO:0061445) |
| 0.6 | 5.3 | GO:0045654 | positive regulation of megakaryocyte differentiation(GO:0045654) |
| 0.6 | 4.1 | GO:2000270 | negative regulation of fibroblast apoptotic process(GO:2000270) |
| 0.6 | 1.7 | GO:1904211 | membrane protein proteolysis involved in retrograde protein transport, ER to cytosol(GO:1904211) |
| 0.5 | 24.7 | GO:0032012 | regulation of ARF protein signal transduction(GO:0032012) |
| 0.5 | 13.2 | GO:0050869 | negative regulation of B cell activation(GO:0050869) |
| 0.5 | 10.9 | GO:0038203 | TORC2 signaling(GO:0038203) |
| 0.5 | 6.5 | GO:0006116 | NADH oxidation(GO:0006116) |
| 0.5 | 15.7 | GO:0072678 | T cell migration(GO:0072678) |
| 0.5 | 38.8 | GO:0042100 | B cell proliferation(GO:0042100) |
| 0.5 | 19.7 | GO:0007202 | activation of phospholipase C activity(GO:0007202) |
| 0.5 | 26.5 | GO:1900027 | regulation of ruffle assembly(GO:1900027) |
| 0.5 | 6.3 | GO:0007144 | female meiosis I(GO:0007144) |
| 0.5 | 6.7 | GO:2000587 | negative regulation of platelet-derived growth factor receptor-beta signaling pathway(GO:2000587) |
| 0.5 | 5.7 | GO:0002347 | response to tumor cell(GO:0002347) |
| 0.5 | 2.6 | GO:1904059 | positive regulation of sensory perception of pain(GO:1904058) regulation of locomotor rhythm(GO:1904059) |
| 0.5 | 4.6 | GO:0010756 | positive regulation of plasminogen activation(GO:0010756) |
| 0.5 | 2.0 | GO:0001732 | formation of cytoplasmic translation initiation complex(GO:0001732) |
| 0.5 | 3.5 | GO:1902963 | regulation of metalloendopeptidase activity involved in amyloid precursor protein catabolic process(GO:1902962) negative regulation of metalloendopeptidase activity involved in amyloid precursor protein catabolic process(GO:1902963) |
| 0.5 | 10.5 | GO:1901741 | positive regulation of myoblast fusion(GO:1901741) |
| 0.5 | 2.0 | GO:0000738 | DNA catabolic process, exonucleolytic(GO:0000738) |
| 0.5 | 2.4 | GO:0031584 | activation of phospholipase D activity(GO:0031584) |
| 0.5 | 5.8 | GO:2000271 | positive regulation of fibroblast apoptotic process(GO:2000271) |
| 0.5 | 8.1 | GO:0043983 | histone H4-K12 acetylation(GO:0043983) |
| 0.5 | 21.4 | GO:0045737 | positive regulation of cyclin-dependent protein serine/threonine kinase activity(GO:0045737) |
| 0.5 | 4.6 | GO:2000491 | positive regulation of hepatic stellate cell activation(GO:2000491) |
| 0.5 | 2.7 | GO:1903588 | negative regulation of blood vessel endothelial cell proliferation involved in sprouting angiogenesis(GO:1903588) |
| 0.5 | 5.0 | GO:0031087 | deadenylation-independent decapping of nuclear-transcribed mRNA(GO:0031087) |
| 0.4 | 2.7 | GO:0045076 | regulation of interleukin-2 biosynthetic process(GO:0045076) |
| 0.4 | 10.6 | GO:0051573 | negative regulation of histone H3-K9 methylation(GO:0051573) |
| 0.4 | 1.3 | GO:0038193 | thromboxane A2 signaling pathway(GO:0038193) |
| 0.4 | 6.0 | GO:0033008 | positive regulation of mast cell activation involved in immune response(GO:0033008) positive regulation of mast cell degranulation(GO:0043306) |
| 0.4 | 4.3 | GO:0051694 | pointed-end actin filament capping(GO:0051694) |
| 0.4 | 3.4 | GO:0061767 | negative regulation of lung blood pressure(GO:0061767) |
| 0.4 | 10.0 | GO:0035589 | G-protein coupled purinergic nucleotide receptor signaling pathway(GO:0035589) |
| 0.4 | 2.8 | GO:1901029 | negative regulation of mitochondrial outer membrane permeabilization involved in apoptotic signaling pathway(GO:1901029) |
| 0.4 | 1.6 | GO:0045653 | negative regulation of megakaryocyte differentiation(GO:0045653) |
| 0.4 | 9.4 | GO:0038092 | nodal signaling pathway(GO:0038092) |
| 0.4 | 19.2 | GO:0000188 | inactivation of MAPK activity(GO:0000188) |
| 0.4 | 1.9 | GO:0001923 | B-1 B cell differentiation(GO:0001923) |
| 0.4 | 3.1 | GO:0036324 | vascular endothelial growth factor receptor-2 signaling pathway(GO:0036324) positive regulation of protein monoubiquitination(GO:1902527) |
| 0.4 | 11.4 | GO:1900026 | positive regulation of substrate adhesion-dependent cell spreading(GO:1900026) |
| 0.4 | 2.6 | GO:0051918 | negative regulation of fibrinolysis(GO:0051918) |
| 0.4 | 3.8 | GO:0070995 | NADPH oxidation(GO:0070995) |
| 0.4 | 2.2 | GO:0097012 | cellular response to granulocyte macrophage colony-stimulating factor stimulus(GO:0097011) response to granulocyte macrophage colony-stimulating factor(GO:0097012) |
| 0.4 | 1.5 | GO:2000681 | negative regulation of rubidium ion transport(GO:2000681) negative regulation of rubidium ion transmembrane transporter activity(GO:2000687) |
| 0.4 | 12.1 | GO:0043101 | purine-containing compound salvage(GO:0043101) |
| 0.4 | 8.4 | GO:0071380 | cellular response to prostaglandin E stimulus(GO:0071380) |
| 0.4 | 2.9 | GO:0071802 | negative regulation of podosome assembly(GO:0071802) |
| 0.4 | 71.1 | GO:0038094 | Fc-gamma receptor signaling pathway(GO:0038094) |
| 0.4 | 4.7 | GO:0036295 | cellular response to increased oxygen levels(GO:0036295) |
| 0.4 | 6.8 | GO:0071361 | cellular response to ethanol(GO:0071361) |
| 0.4 | 1.1 | GO:0098905 | regulation of bundle of His cell action potential(GO:0098905) |
| 0.4 | 4.3 | GO:0090168 | Golgi reassembly(GO:0090168) |
| 0.4 | 0.7 | GO:0071921 | establishment of sister chromatid cohesion(GO:0034085) cohesin loading(GO:0071921) regulation of cohesin loading(GO:0071922) |
| 0.3 | 5.6 | GO:0039536 | negative regulation of RIG-I signaling pathway(GO:0039536) |
| 0.3 | 11.1 | GO:0007095 | mitotic G2 DNA damage checkpoint(GO:0007095) |
| 0.3 | 0.7 | GO:0045903 | positive regulation of translational fidelity(GO:0045903) |
| 0.3 | 3.4 | GO:1903800 | positive regulation of production of miRNAs involved in gene silencing by miRNA(GO:1903800) |
| 0.3 | 19.3 | GO:0031294 | lymphocyte costimulation(GO:0031294) T cell costimulation(GO:0031295) |
| 0.3 | 2.0 | GO:2001270 | regulation of cysteine-type endopeptidase activity involved in execution phase of apoptosis(GO:2001270) |
| 0.3 | 10.6 | GO:0072378 | blood coagulation, fibrin clot formation(GO:0072378) |
| 0.3 | 2.9 | GO:0060136 | enucleate erythrocyte differentiation(GO:0043353) embryonic process involved in female pregnancy(GO:0060136) |
| 0.3 | 1.6 | GO:0000415 | negative regulation of histone H3-K36 methylation(GO:0000415) negative regulation of histone H3-K4 methylation(GO:0051572) |
| 0.3 | 2.6 | GO:0000414 | regulation of histone H3-K36 methylation(GO:0000414) |
| 0.3 | 17.9 | GO:0045576 | mast cell activation(GO:0045576) |
| 0.3 | 3.2 | GO:0043374 | CD8-positive, alpha-beta T cell differentiation(GO:0043374) |
| 0.3 | 1.3 | GO:0021553 | olfactory nerve development(GO:0021553) |
| 0.3 | 2.2 | GO:1903377 | negative regulation of oxidative stress-induced neuron intrinsic apoptotic signaling pathway(GO:1903377) |
| 0.3 | 10.8 | GO:0032460 | negative regulation of protein oligomerization(GO:0032460) |
| 0.3 | 3.8 | GO:0060372 | regulation of atrial cardiac muscle cell membrane repolarization(GO:0060372) |
| 0.3 | 3.8 | GO:0043249 | erythrocyte maturation(GO:0043249) |
| 0.3 | 3.8 | GO:1902857 | positive regulation of nonmotile primary cilium assembly(GO:1902857) |
| 0.3 | 2.9 | GO:0009826 | unidimensional cell growth(GO:0009826) |
| 0.3 | 1.7 | GO:0090234 | regulation of centromere complex assembly(GO:0090230) regulation of kinetochore assembly(GO:0090234) |
| 0.3 | 6.7 | GO:0021796 | cerebral cortex regionalization(GO:0021796) |
| 0.3 | 9.4 | GO:0006491 | N-glycan processing(GO:0006491) |
| 0.3 | 4.7 | GO:0032462 | regulation of protein homooligomerization(GO:0032462) positive regulation of protein homooligomerization(GO:0032464) |
| 0.3 | 1.6 | GO:0006432 | phenylalanyl-tRNA aminoacylation(GO:0006432) |
| 0.3 | 1.1 | GO:0021847 | ventricular zone neuroblast division(GO:0021847) |
| 0.3 | 1.4 | GO:0090166 | Golgi disassembly(GO:0090166) |
| 0.3 | 3.0 | GO:0031022 | nuclear migration along microfilament(GO:0031022) |
| 0.3 | 1.6 | GO:0060040 | retinal bipolar neuron differentiation(GO:0060040) |
| 0.3 | 5.7 | GO:0003376 | sphingosine-1-phosphate signaling pathway(GO:0003376) |
| 0.3 | 2.7 | GO:0072383 | plus-end-directed vesicle transport along microtubule(GO:0072383) |
| 0.3 | 0.8 | GO:0035526 | retrograde transport, plasma membrane to Golgi(GO:0035526) |
| 0.3 | 4.6 | GO:0036065 | fucosylation(GO:0036065) |
| 0.3 | 1.5 | GO:0021993 | initiation of neural tube closure(GO:0021993) |
| 0.3 | 4.6 | GO:0075522 | IRES-dependent viral translational initiation(GO:0075522) |
| 0.3 | 5.6 | GO:0060670 | branching involved in labyrinthine layer morphogenesis(GO:0060670) |
| 0.2 | 2.2 | GO:0001780 | neutrophil homeostasis(GO:0001780) |
| 0.2 | 2.5 | GO:0090527 | actin filament reorganization(GO:0090527) |
| 0.2 | 147.2 | GO:0051056 | regulation of small GTPase mediated signal transduction(GO:0051056) |
| 0.2 | 1.5 | GO:0090037 | positive regulation of protein kinase C signaling(GO:0090037) |
| 0.2 | 3.3 | GO:2000622 | regulation of nuclear-transcribed mRNA catabolic process, nonsense-mediated decay(GO:2000622) negative regulation of nuclear-transcribed mRNA catabolic process, nonsense-mediated decay(GO:2000623) |
| 0.2 | 2.3 | GO:0031848 | protection from non-homologous end joining at telomere(GO:0031848) |
| 0.2 | 1.6 | GO:0060399 | positive regulation of growth hormone receptor signaling pathway(GO:0060399) |
| 0.2 | 0.7 | GO:0036090 | cleavage furrow ingression(GO:0036090) |
| 0.2 | 1.6 | GO:1903435 | positive regulation of constitutive secretory pathway(GO:1903435) |
| 0.2 | 2.7 | GO:0060613 | fat pad development(GO:0060613) |
| 0.2 | 0.7 | GO:1900154 | regulation of bone trabecula formation(GO:1900154) negative regulation of bone trabecula formation(GO:1900155) |
| 0.2 | 0.6 | GO:1904398 | positive regulation of neuromuscular junction development(GO:1904398) |
| 0.2 | 0.2 | GO:0006680 | glucosylceramide catabolic process(GO:0006680) |
| 0.2 | 1.7 | GO:1901098 | positive regulation of autophagosome maturation(GO:1901098) |
| 0.2 | 1.9 | GO:0046085 | adenosine metabolic process(GO:0046085) |
| 0.2 | 10.5 | GO:0045652 | regulation of megakaryocyte differentiation(GO:0045652) |
| 0.2 | 26.3 | GO:0060218 | hematopoietic stem cell differentiation(GO:0060218) |
| 0.2 | 3.1 | GO:0000012 | single strand break repair(GO:0000012) |
| 0.2 | 2.2 | GO:0051665 | membrane raft localization(GO:0051665) |
| 0.2 | 0.4 | GO:0001927 | exocyst assembly(GO:0001927) |
| 0.2 | 5.5 | GO:0007064 | mitotic sister chromatid cohesion(GO:0007064) |
| 0.2 | 6.2 | GO:0050651 | dermatan sulfate proteoglycan biosynthetic process(GO:0050651) |
| 0.2 | 1.7 | GO:0047484 | regulation of response to osmotic stress(GO:0047484) |
| 0.2 | 0.6 | GO:2000642 | negative regulation of early endosome to late endosome transport(GO:2000642) |
| 0.2 | 1.3 | GO:0007172 | signal complex assembly(GO:0007172) |
| 0.2 | 2.0 | GO:0048194 | Golgi vesicle budding(GO:0048194) |
| 0.2 | 2.6 | GO:1903748 | negative regulation of establishment of protein localization to mitochondrion(GO:1903748) |
| 0.2 | 1.8 | GO:0060124 | positive regulation of growth hormone secretion(GO:0060124) |
| 0.2 | 4.7 | GO:0046597 | negative regulation of viral entry into host cell(GO:0046597) |
| 0.2 | 3.4 | GO:0034205 | beta-amyloid formation(GO:0034205) |
| 0.2 | 0.4 | GO:0002692 | negative regulation of cellular extravasation(GO:0002692) regulation of leukocyte tethering or rolling(GO:1903236) |
| 0.2 | 27.5 | GO:0006614 | SRP-dependent cotranslational protein targeting to membrane(GO:0006614) |
| 0.2 | 16.6 | GO:1902017 | regulation of cilium assembly(GO:1902017) |
| 0.2 | 1.9 | GO:1903071 | positive regulation of ER-associated ubiquitin-dependent protein catabolic process(GO:1903071) |
| 0.2 | 1.4 | GO:0032472 | Golgi calcium ion transport(GO:0032472) |
| 0.2 | 18.4 | GO:0030218 | erythrocyte differentiation(GO:0030218) |
| 0.2 | 1.5 | GO:0001712 | ectodermal cell fate commitment(GO:0001712) |
| 0.2 | 6.4 | GO:0008053 | mitochondrial fusion(GO:0008053) |
| 0.2 | 1.8 | GO:0035965 | cardiolipin acyl-chain remodeling(GO:0035965) |
| 0.2 | 3.0 | GO:0031507 | heterochromatin assembly(GO:0031507) |
| 0.2 | 3.6 | GO:0060965 | negative regulation of gene silencing by miRNA(GO:0060965) |
| 0.2 | 1.0 | GO:0010157 | response to chlorate(GO:0010157) |
| 0.2 | 0.5 | GO:0006597 | spermine biosynthetic process(GO:0006597) |
| 0.2 | 1.6 | GO:0010792 | DNA double-strand break processing involved in repair via single-strand annealing(GO:0010792) |
| 0.2 | 1.5 | GO:0001833 | inner cell mass cell proliferation(GO:0001833) |
| 0.2 | 3.0 | GO:0034162 | toll-like receptor 9 signaling pathway(GO:0034162) |
| 0.2 | 1.2 | GO:0001731 | formation of translation preinitiation complex(GO:0001731) |
| 0.2 | 0.6 | GO:0018008 | N-terminal peptidyl-glycine N-myristoylation(GO:0018008) |
| 0.2 | 4.6 | GO:0006297 | nucleotide-excision repair, DNA gap filling(GO:0006297) |
| 0.2 | 3.6 | GO:0072673 | lamellipodium morphogenesis(GO:0072673) |
| 0.1 | 1.2 | GO:0035897 | proteolysis in other organism(GO:0035897) |
| 0.1 | 1.5 | GO:0043402 | glucocorticoid mediated signaling pathway(GO:0043402) |
| 0.1 | 1.8 | GO:0045898 | regulation of RNA polymerase II transcriptional preinitiation complex assembly(GO:0045898) |
| 0.1 | 1.1 | GO:0070816 | phosphorylation of RNA polymerase II C-terminal domain(GO:0070816) |
| 0.1 | 0.8 | GO:0035434 | copper ion transmembrane transport(GO:0035434) |
| 0.1 | 0.8 | GO:0071477 | hypotonic salinity response(GO:0042539) cellular hypotonic salinity response(GO:0071477) |
| 0.1 | 11.5 | GO:0007602 | phototransduction(GO:0007602) |
| 0.1 | 3.7 | GO:0045332 | phospholipid translocation(GO:0045332) |
| 0.1 | 1.3 | GO:0097338 | response to clozapine(GO:0097338) |
| 0.1 | 2.4 | GO:1902743 | regulation of lamellipodium organization(GO:1902743) |
| 0.1 | 7.2 | GO:0014066 | regulation of phosphatidylinositol 3-kinase signaling(GO:0014066) |
| 0.1 | 3.3 | GO:0015671 | oxygen transport(GO:0015671) |
| 0.1 | 2.2 | GO:0051016 | barbed-end actin filament capping(GO:0051016) |
| 0.1 | 1.1 | GO:0032929 | negative regulation of superoxide anion generation(GO:0032929) |
| 0.1 | 2.6 | GO:0032486 | Rap protein signal transduction(GO:0032486) |
| 0.1 | 5.3 | GO:0043550 | regulation of lipid kinase activity(GO:0043550) |
| 0.1 | 0.7 | GO:0000973 | posttranscriptional tethering of RNA polymerase II gene DNA at nuclear periphery(GO:0000973) |
| 0.1 | 1.8 | GO:0090051 | negative regulation of cell migration involved in sprouting angiogenesis(GO:0090051) |
| 0.1 | 2.2 | GO:0070932 | histone H3 deacetylation(GO:0070932) |
| 0.1 | 0.7 | GO:0035063 | nuclear speck organization(GO:0035063) |
| 0.1 | 74.9 | GO:0043547 | positive regulation of GTPase activity(GO:0043547) |
| 0.1 | 1.9 | GO:0070934 | CRD-mediated mRNA stabilization(GO:0070934) |
| 0.1 | 2.5 | GO:0000729 | DNA double-strand break processing(GO:0000729) |
| 0.1 | 0.7 | GO:2000234 | positive regulation of ribosome biogenesis(GO:0090070) positive regulation of rRNA processing(GO:2000234) |
| 0.1 | 4.6 | GO:0006607 | NLS-bearing protein import into nucleus(GO:0006607) |
| 0.1 | 0.5 | GO:0006420 | arginyl-tRNA aminoacylation(GO:0006420) |
| 0.1 | 3.6 | GO:0030225 | macrophage differentiation(GO:0030225) |
| 0.1 | 0.3 | GO:0045416 | positive regulation of interleukin-8 biosynthetic process(GO:0045416) |
| 0.1 | 0.9 | GO:0006398 | mRNA 3'-end processing by stem-loop binding and cleavage(GO:0006398) |
| 0.1 | 0.6 | GO:0036079 | GDP-fucose transport(GO:0015783) purine nucleotide-sugar transport(GO:0036079) |
| 0.1 | 1.5 | GO:0035970 | peptidyl-threonine dephosphorylation(GO:0035970) |
| 0.1 | 1.2 | GO:0097178 | ruffle assembly(GO:0097178) |
| 0.1 | 2.3 | GO:0044804 | nucleophagy(GO:0044804) |
| 0.1 | 1.7 | GO:0021794 | thalamus development(GO:0021794) |
| 0.1 | 5.4 | GO:0051881 | regulation of mitochondrial membrane potential(GO:0051881) |
| 0.1 | 0.8 | GO:0099639 | neurotransmitter receptor transport, endosome to postsynaptic membrane(GO:0098887) endosome to plasma membrane protein transport(GO:0099638) neurotransmitter receptor transport, endosome to plasma membrane(GO:0099639) |
| 0.1 | 3.4 | GO:0035666 | TRIF-dependent toll-like receptor signaling pathway(GO:0035666) |
| 0.1 | 2.8 | GO:1902236 | negative regulation of endoplasmic reticulum stress-induced intrinsic apoptotic signaling pathway(GO:1902236) |
| 0.1 | 1.4 | GO:0035372 | protein localization to microtubule(GO:0035372) |
| 0.1 | 1.5 | GO:0015937 | coenzyme A biosynthetic process(GO:0015937) |
| 0.1 | 1.6 | GO:0051085 | chaperone mediated protein folding requiring cofactor(GO:0051085) |
| 0.1 | 0.7 | GO:0000480 | endonucleolytic cleavage in 5'-ETS of tricistronic rRNA transcript (SSU-rRNA, 5.8S rRNA, LSU-rRNA)(GO:0000480) |
| 0.1 | 1.1 | GO:0034244 | negative regulation of transcription elongation from RNA polymerase II promoter(GO:0034244) |
| 0.1 | 0.4 | GO:0044830 | modulation by host of viral RNA genome replication(GO:0044830) positive regulation of intracellular transport of viral material(GO:1901254) negative regulation of synaptic vesicle exocytosis(GO:2000301) |
| 0.1 | 1.0 | GO:0010032 | meiotic chromosome condensation(GO:0010032) |
| 0.1 | 1.6 | GO:0006853 | carnitine shuttle(GO:0006853) |
| 0.1 | 1.2 | GO:0007250 | activation of NF-kappaB-inducing kinase activity(GO:0007250) |
| 0.1 | 2.0 | GO:2000369 | regulation of clathrin-mediated endocytosis(GO:2000369) |
| 0.1 | 1.9 | GO:0046339 | diacylglycerol metabolic process(GO:0046339) |
| 0.1 | 1.0 | GO:0035331 | negative regulation of hippo signaling(GO:0035331) |
| 0.1 | 2.9 | GO:0032402 | melanosome transport(GO:0032402) |
| 0.1 | 2.0 | GO:0000185 | activation of MAPKKK activity(GO:0000185) |
| 0.1 | 5.0 | GO:0048678 | response to axon injury(GO:0048678) |
| 0.1 | 2.0 | GO:0007035 | vacuolar acidification(GO:0007035) |
| 0.1 | 0.3 | GO:0044376 | RNA polymerase II complex import to nucleus(GO:0044376) RNA polymerase III complex localization to nucleus(GO:1990022) |
| 0.1 | 1.0 | GO:0035360 | positive regulation of peroxisome proliferator activated receptor signaling pathway(GO:0035360) |
| 0.1 | 3.0 | GO:0043087 | regulation of GTPase activity(GO:0043087) |
| 0.1 | 2.8 | GO:0001824 | blastocyst development(GO:0001824) |
| 0.1 | 1.6 | GO:0006750 | glutathione biosynthetic process(GO:0006750) |
| 0.1 | 1.7 | GO:0048268 | clathrin coat assembly(GO:0048268) |
| 0.1 | 0.4 | GO:0021797 | forebrain anterior/posterior pattern specification(GO:0021797) |
| 0.1 | 3.9 | GO:0006656 | phosphatidylcholine biosynthetic process(GO:0006656) |
| 0.1 | 1.3 | GO:0016254 | preassembly of GPI anchor in ER membrane(GO:0016254) |
| 0.1 | 0.6 | GO:0043569 | negative regulation of insulin-like growth factor receptor signaling pathway(GO:0043569) |
| 0.1 | 0.6 | GO:0033147 | negative regulation of intracellular estrogen receptor signaling pathway(GO:0033147) |
| 0.1 | 8.6 | GO:0006261 | DNA-dependent DNA replication(GO:0006261) |
| 0.1 | 0.6 | GO:0034427 | nuclear-transcribed mRNA catabolic process, exonucleolytic, 3'-5'(GO:0034427) |
| 0.1 | 1.0 | GO:0045116 | protein neddylation(GO:0045116) |
| 0.1 | 8.5 | GO:0002576 | platelet degranulation(GO:0002576) |
| 0.1 | 3.4 | GO:0070301 | cellular response to hydrogen peroxide(GO:0070301) |
| 0.0 | 2.7 | GO:0007212 | dopamine receptor signaling pathway(GO:0007212) |
| 0.0 | 0.3 | GO:0000463 | maturation of LSU-rRNA from tricistronic rRNA transcript (SSU-rRNA, 5.8S rRNA, LSU-rRNA)(GO:0000463) |
| 0.0 | 2.8 | GO:0010107 | potassium ion import(GO:0010107) |
| 0.0 | 1.8 | GO:0030520 | intracellular estrogen receptor signaling pathway(GO:0030520) |
| 0.0 | 1.2 | GO:0051123 | RNA polymerase II transcriptional preinitiation complex assembly(GO:0051123) |
| 0.0 | 0.9 | GO:0060716 | labyrinthine layer blood vessel development(GO:0060716) |
| 0.0 | 1.2 | GO:0036035 | osteoclast development(GO:0036035) |
| 0.0 | 1.0 | GO:0035196 | production of miRNAs involved in gene silencing by miRNA(GO:0035196) |
| 0.0 | 0.2 | GO:0034638 | phosphatidylcholine catabolic process(GO:0034638) |
| 0.0 | 1.7 | GO:0038083 | peptidyl-tyrosine autophosphorylation(GO:0038083) |
| 0.0 | 0.3 | GO:1901339 | activation of store-operated calcium channel activity(GO:0032237) regulation of store-operated calcium channel activity(GO:1901339) positive regulation of store-operated calcium channel activity(GO:1901341) |
| 0.0 | 4.9 | GO:0034605 | cellular response to heat(GO:0034605) |
| 0.0 | 2.6 | GO:0032508 | DNA duplex unwinding(GO:0032508) |
| 0.0 | 0.7 | GO:0007379 | segment specification(GO:0007379) |
| 0.0 | 0.2 | GO:0046166 | glyceraldehyde-3-phosphate biosynthetic process(GO:0046166) |
| 0.0 | 0.2 | GO:0040034 | regulation of development, heterochronic(GO:0040034) regulation of timing of cell differentiation(GO:0048505) |
| 0.0 | 1.1 | GO:2000651 | positive regulation of sodium ion transmembrane transporter activity(GO:2000651) |
| 0.0 | 1.0 | GO:0016338 | calcium-independent cell-cell adhesion via plasma membrane cell-adhesion molecules(GO:0016338) |
| 0.0 | 1.2 | GO:0034383 | low-density lipoprotein particle clearance(GO:0034383) |
| 0.0 | 0.6 | GO:1990118 | sodium ion import across plasma membrane(GO:0098719) sodium ion import into cell(GO:1990118) |
| 0.0 | 2.7 | GO:0071357 | type I interferon signaling pathway(GO:0060337) cellular response to type I interferon(GO:0071357) |
| 0.0 | 0.9 | GO:0032418 | lysosome localization(GO:0032418) |
| 0.0 | 0.8 | GO:0043586 | tongue development(GO:0043586) |
| 0.0 | 1.3 | GO:0042059 | negative regulation of epidermal growth factor receptor signaling pathway(GO:0042059) |
| 0.0 | 1.3 | GO:0006336 | DNA replication-independent nucleosome assembly(GO:0006336) |
| 0.0 | 1.4 | GO:0048701 | embryonic cranial skeleton morphogenesis(GO:0048701) |
| 0.0 | 1.1 | GO:0009435 | NAD biosynthetic process(GO:0009435) |
| 0.0 | 0.7 | GO:0002003 | angiotensin maturation(GO:0002003) |
| 0.0 | 0.8 | GO:0000042 | protein targeting to Golgi(GO:0000042) |
| 0.0 | 0.1 | GO:0002756 | MyD88-independent toll-like receptor signaling pathway(GO:0002756) |
| 0.0 | 1.4 | GO:0010830 | regulation of myotube differentiation(GO:0010830) |
| 0.0 | 0.3 | GO:0045721 | negative regulation of gluconeogenesis(GO:0045721) |
| 0.0 | 3.4 | GO:1990823 | response to leukemia inhibitory factor(GO:1990823) cellular response to leukemia inhibitory factor(GO:1990830) |
| 0.0 | 0.3 | GO:0001887 | selenium compound metabolic process(GO:0001887) |
| 0.0 | 0.7 | GO:0021983 | pituitary gland development(GO:0021983) |
| 0.0 | 0.3 | GO:0006388 | tRNA splicing, via endonucleolytic cleavage and ligation(GO:0006388) |
| 0.0 | 0.3 | GO:0061088 | regulation of sequestering of zinc ion(GO:0061088) |
| 0.0 | 1.7 | GO:0006446 | regulation of translational initiation(GO:0006446) |
| 0.0 | 1.5 | GO:0032436 | positive regulation of proteasomal ubiquitin-dependent protein catabolic process(GO:0032436) |
| 0.0 | 0.2 | GO:0051601 | exocyst localization(GO:0051601) |
| 0.0 | 0.6 | GO:0000291 | nuclear-transcribed mRNA catabolic process, exonucleolytic(GO:0000291) exonucleolytic nuclear-transcribed mRNA catabolic process involved in deadenylation-dependent decay(GO:0043928) |
| 0.0 | 0.8 | GO:0008156 | negative regulation of DNA replication(GO:0008156) |
| 0.0 | 0.4 | GO:0043011 | myeloid dendritic cell differentiation(GO:0043011) |
| 0.0 | 0.8 | GO:0015914 | phospholipid transport(GO:0015914) |
| 0.0 | 1.1 | GO:0002223 | innate immune response activating cell surface receptor signaling pathway(GO:0002220) stimulatory C-type lectin receptor signaling pathway(GO:0002223) |
| 0.0 | 1.9 | GO:2000117 | negative regulation of cysteine-type endopeptidase activity(GO:2000117) |
| 0.0 | 0.1 | GO:2000643 | positive regulation of vacuolar transport(GO:1903337) positive regulation of early endosome to late endosome transport(GO:2000643) |
| 0.0 | 0.1 | GO:0007406 | negative regulation of neuroblast proliferation(GO:0007406) |
| 0.0 | 0.1 | GO:1902775 | mitochondrial large ribosomal subunit assembly(GO:1902775) |
| 0.0 | 1.3 | GO:0048791 | calcium ion-regulated exocytosis of neurotransmitter(GO:0048791) |
| 0.0 | 1.1 | GO:0045454 | cell redox homeostasis(GO:0045454) |
| 0.0 | 0.1 | GO:1990481 | mRNA pseudouridine synthesis(GO:1990481) |
| 0.0 | 0.1 | GO:0036486 | trunk segmentation(GO:0035290) trunk neural crest cell migration(GO:0036484) ventral trunk neural crest cell migration(GO:0036486) |
| 0.0 | 0.5 | GO:0018345 | protein palmitoylation(GO:0018345) |
| 0.0 | 0.1 | GO:0021759 | globus pallidus development(GO:0021759) |
Gene overrepresentation in cellular component category:
| Log-likelihood per target | Total log-likelihood | Term | Description |
|---|---|---|---|
| 8.4 | 101.2 | GO:0042105 | alpha-beta T cell receptor complex(GO:0042105) |
| 7.2 | 28.8 | GO:0005944 | phosphatidylinositol 3-kinase complex, class IB(GO:0005944) |
| 6.0 | 66.3 | GO:0032010 | phagolysosome(GO:0032010) |
| 5.8 | 40.9 | GO:0036021 | endolysosome lumen(GO:0036021) |
| 5.6 | 16.7 | GO:0016590 | ACF complex(GO:0016590) |
| 5.5 | 27.5 | GO:0019815 | B cell receptor complex(GO:0019815) |
| 5.2 | 51.8 | GO:0034687 | integrin alphaL-beta2 complex(GO:0034687) |
| 5.2 | 15.5 | GO:0036284 | tubulobulbar complex(GO:0036284) |
| 4.9 | 24.7 | GO:0034669 | integrin alpha4-beta7 complex(GO:0034669) |
| 4.5 | 40.9 | GO:0044194 | cytolytic granule(GO:0044194) |
| 3.1 | 18.5 | GO:0036398 | TCR signalosome(GO:0036398) |
| 2.2 | 12.9 | GO:0031232 | extrinsic component of external side of plasma membrane(GO:0031232) |
| 2.1 | 84.4 | GO:0001891 | phagocytic cup(GO:0001891) |
| 2.1 | 16.4 | GO:1990111 | spermatoproteasome complex(GO:1990111) |
| 2.0 | 12.1 | GO:1902560 | GMP reductase complex(GO:1902560) |
| 2.0 | 11.8 | GO:0034666 | integrin alpha2-beta1 complex(GO:0034666) |
| 1.8 | 21.3 | GO:0046696 | lipopolysaccharide receptor complex(GO:0046696) |
| 1.7 | 40.4 | GO:0031254 | uropod(GO:0001931) cell trailing edge(GO:0031254) |
| 1.6 | 4.9 | GO:0042022 | interleukin-12 receptor complex(GO:0042022) |
| 1.5 | 29.0 | GO:0032059 | bleb(GO:0032059) |
| 1.5 | 107.2 | GO:0001772 | immunological synapse(GO:0001772) |
| 1.4 | 22.7 | GO:0031209 | SCAR complex(GO:0031209) |
| 1.2 | 14.3 | GO:0043020 | NADPH oxidase complex(GO:0043020) |
| 1.2 | 22.5 | GO:0031618 | nuclear pericentric heterochromatin(GO:0031618) |
| 0.9 | 18.7 | GO:0070938 | contractile ring(GO:0070938) |
| 0.9 | 6.0 | GO:0042101 | T cell receptor complex(GO:0042101) |
| 0.8 | 4.6 | GO:0043625 | delta DNA polymerase complex(GO:0043625) |
| 0.8 | 6.8 | GO:0005577 | fibrinogen complex(GO:0005577) |
| 0.7 | 4.5 | GO:0005896 | interleukin-6 receptor complex(GO:0005896) |
| 0.7 | 4.5 | GO:0030905 | retromer, tubulation complex(GO:0030905) |
| 0.7 | 2.8 | GO:0071817 | MMXD complex(GO:0071817) |
| 0.7 | 3.5 | GO:0070381 | endosome to plasma membrane transport vesicle(GO:0070381) |
| 0.7 | 4.1 | GO:0000214 | tRNA-intron endonuclease complex(GO:0000214) |
| 0.7 | 303.8 | GO:0009897 | external side of plasma membrane(GO:0009897) |
| 0.7 | 8.7 | GO:1990907 | beta-catenin-TCF complex(GO:1990907) |
| 0.7 | 2.0 | GO:0002947 | tumor necrosis factor receptor superfamily complex(GO:0002947) |
| 0.6 | 13.7 | GO:0031265 | CD95 death-inducing signaling complex(GO:0031265) |
| 0.6 | 7.4 | GO:0097524 | sperm plasma membrane(GO:0097524) |
| 0.6 | 3.0 | GO:0071159 | NF-kappaB complex(GO:0071159) |
| 0.6 | 9.7 | GO:0008290 | F-actin capping protein complex(GO:0008290) |
| 0.6 | 6.4 | GO:0098554 | cytoplasmic side of endoplasmic reticulum membrane(GO:0098554) |
| 0.6 | 14.4 | GO:0016461 | unconventional myosin complex(GO:0016461) |
| 0.6 | 5.1 | GO:0032009 | early phagosome(GO:0032009) |
| 0.6 | 62.5 | GO:0101003 | ficolin-1-rich granule membrane(GO:0101003) |
| 0.6 | 1.7 | GO:0016939 | kinesin II complex(GO:0016939) |
| 0.6 | 12.7 | GO:0042588 | zymogen granule(GO:0042588) |
| 0.5 | 3.8 | GO:1990031 | pinceau fiber(GO:1990031) |
| 0.5 | 42.3 | GO:0005834 | heterotrimeric G-protein complex(GO:0005834) |
| 0.5 | 17.0 | GO:0042629 | mast cell granule(GO:0042629) |
| 0.5 | 1.9 | GO:0032449 | CBM complex(GO:0032449) |
| 0.5 | 3.8 | GO:0070436 | Grb2-EGFR complex(GO:0070436) |
| 0.5 | 2.4 | GO:0042643 | actomyosin, actin portion(GO:0042643) |
| 0.5 | 13.6 | GO:0005916 | fascia adherens(GO:0005916) |
| 0.4 | 12.4 | GO:0031932 | TORC2 complex(GO:0031932) |
| 0.4 | 3.7 | GO:0035032 | phosphatidylinositol 3-kinase complex, class III(GO:0035032) |
| 0.4 | 1.6 | GO:0009328 | phenylalanine-tRNA ligase complex(GO:0009328) |
| 0.4 | 2.9 | GO:0033553 | rDNA heterochromatin(GO:0033553) |
| 0.4 | 35.7 | GO:0030670 | phagocytic vesicle membrane(GO:0030670) |
| 0.4 | 38.3 | GO:0035580 | specific granule lumen(GO:0035580) |
| 0.4 | 3.4 | GO:0070765 | gamma-secretase complex(GO:0070765) |
| 0.4 | 2.2 | GO:0090571 | RNA polymerase II transcription repressor complex(GO:0090571) |
| 0.4 | 4.3 | GO:0031390 | Ctf18 RFC-like complex(GO:0031390) |
| 0.4 | 4.2 | GO:0001940 | male pronucleus(GO:0001940) |
| 0.3 | 2.6 | GO:0016272 | prefoldin complex(GO:0016272) |
| 0.3 | 6.8 | GO:0008074 | guanylate cyclase complex, soluble(GO:0008074) |
| 0.3 | 1.8 | GO:0048179 | activin receptor complex(GO:0048179) |
| 0.3 | 5.6 | GO:0034098 | VCP-NPL4-UFD1 AAA ATPase complex(GO:0034098) |
| 0.3 | 2.2 | GO:0005797 | Golgi medial cisterna(GO:0005797) |
| 0.3 | 7.7 | GO:0031528 | microvillus membrane(GO:0031528) |
| 0.3 | 3.0 | GO:0034992 | microtubule organizing center attachment site(GO:0034992) LINC complex(GO:0034993) |
| 0.3 | 3.0 | GO:0005677 | chromatin silencing complex(GO:0005677) |
| 0.3 | 3.4 | GO:0071144 | SMAD2-SMAD3 protein complex(GO:0071144) |
| 0.3 | 4.8 | GO:0097451 | glial limiting end-foot(GO:0097451) |
| 0.2 | 1.9 | GO:1990037 | Lewy body core(GO:1990037) |
| 0.2 | 4.5 | GO:0097433 | dense body(GO:0097433) |
| 0.2 | 6.9 | GO:0042627 | chylomicron(GO:0042627) |
| 0.2 | 3.0 | GO:0097136 | Bcl-2 family protein complex(GO:0097136) |
| 0.2 | 1.8 | GO:0030121 | AP-1 adaptor complex(GO:0030121) |
| 0.2 | 3.1 | GO:0033180 | proton-transporting V-type ATPase, V1 domain(GO:0033180) |
| 0.2 | 0.7 | GO:0060342 | photoreceptor inner segment membrane(GO:0060342) |
| 0.2 | 10.8 | GO:0044665 | MLL1/2 complex(GO:0044665) MLL1 complex(GO:0071339) |
| 0.2 | 1.9 | GO:0097197 | tetraspanin-enriched microdomain(GO:0097197) |
| 0.2 | 2.4 | GO:0008024 | cyclin/CDK positive transcription elongation factor complex(GO:0008024) |
| 0.2 | 3.4 | GO:0071141 | SMAD protein complex(GO:0071141) |
| 0.2 | 1.3 | GO:0005658 | alpha DNA polymerase:primase complex(GO:0005658) |
| 0.2 | 0.6 | GO:0055087 | Ski complex(GO:0055087) |
| 0.2 | 1.5 | GO:0070435 | Shc-EGFR complex(GO:0070435) |
| 0.2 | 83.5 | GO:0045121 | membrane raft(GO:0045121) membrane microdomain(GO:0098857) |
| 0.2 | 1.6 | GO:0044666 | MLL3/4 complex(GO:0044666) |
| 0.2 | 2.1 | GO:0005721 | pericentric heterochromatin(GO:0005721) |
| 0.2 | 0.7 | GO:0034457 | Mpp10 complex(GO:0034457) |
| 0.2 | 3.4 | GO:0005885 | Arp2/3 protein complex(GO:0005885) |
| 0.2 | 2.0 | GO:0071541 | eukaryotic translation initiation factor 3 complex, eIF3m(GO:0071541) |
| 0.2 | 2.3 | GO:0070419 | nonhomologous end joining complex(GO:0070419) |
| 0.2 | 84.8 | GO:0000790 | nuclear chromatin(GO:0000790) |
| 0.2 | 0.8 | GO:0035061 | interchromatin granule(GO:0035061) |
| 0.2 | 1.4 | GO:0097452 | GAIT complex(GO:0097452) |
| 0.2 | 4.0 | GO:1904724 | tertiary granule lumen(GO:1904724) |
| 0.2 | 1.0 | GO:0032044 | DSIF complex(GO:0032044) |
| 0.2 | 69.8 | GO:0034774 | secretory granule lumen(GO:0034774) |
| 0.2 | 1.1 | GO:0030289 | protein phosphatase 4 complex(GO:0030289) |
| 0.2 | 1.7 | GO:1990316 | ATG1/ULK1 kinase complex(GO:1990316) |
| 0.2 | 1.4 | GO:0005785 | signal recognition particle receptor complex(GO:0005785) |
| 0.1 | 11.1 | GO:0022627 | cytosolic small ribosomal subunit(GO:0022627) |
| 0.1 | 8.7 | GO:0000307 | cyclin-dependent protein kinase holoenzyme complex(GO:0000307) |
| 0.1 | 2.4 | GO:0008278 | cohesin complex(GO:0008278) |
| 0.1 | 2.3 | GO:0034045 | pre-autophagosomal structure membrane(GO:0034045) |
| 0.1 | 3.9 | GO:0002102 | podosome(GO:0002102) |
| 0.1 | 9.5 | GO:0035577 | azurophil granule membrane(GO:0035577) |
| 0.1 | 0.9 | GO:0034715 | pICln-Sm protein complex(GO:0034715) |
| 0.1 | 1.0 | GO:0033270 | paranode region of axon(GO:0033270) |
| 0.1 | 13.6 | GO:0022625 | cytosolic large ribosomal subunit(GO:0022625) |
| 0.1 | 1.3 | GO:0042382 | paraspeckles(GO:0042382) |
| 0.1 | 3.3 | GO:1990124 | messenger ribonucleoprotein complex(GO:1990124) |
| 0.1 | 0.8 | GO:0098837 | postsynaptic recycling endosome(GO:0098837) |
| 0.1 | 3.0 | GO:0046658 | anchored component of plasma membrane(GO:0046658) |
| 0.1 | 0.8 | GO:0031417 | NatC complex(GO:0031417) |
| 0.1 | 2.4 | GO:0030127 | COPII vesicle coat(GO:0030127) |
| 0.1 | 5.8 | GO:0005640 | nuclear outer membrane(GO:0005640) |
| 0.1 | 5.2 | GO:0019897 | extrinsic component of plasma membrane(GO:0019897) |
| 0.1 | 22.4 | GO:0009898 | cytoplasmic side of plasma membrane(GO:0009898) |
| 0.1 | 1.6 | GO:0031588 | nucleotide-activated protein kinase complex(GO:0031588) |
| 0.1 | 30.4 | GO:0001726 | ruffle(GO:0001726) |
| 0.1 | 36.1 | GO:0016323 | basolateral plasma membrane(GO:0016323) |
| 0.1 | 3.2 | GO:0005776 | autophagosome(GO:0005776) |
| 0.1 | 0.7 | GO:0044614 | nuclear pore cytoplasmic filaments(GO:0044614) |
| 0.1 | 1.6 | GO:0010369 | chromocenter(GO:0010369) |
| 0.1 | 4.5 | GO:0000159 | protein phosphatase type 2A complex(GO:0000159) |
| 0.1 | 13.8 | GO:0016605 | PML body(GO:0016605) |
| 0.1 | 1.4 | GO:0031092 | platelet alpha granule membrane(GO:0031092) |
| 0.1 | 1.9 | GO:0000164 | protein phosphatase type 1 complex(GO:0000164) |
| 0.1 | 1.1 | GO:0033162 | melanosome membrane(GO:0033162) chitosome(GO:0045009) |
| 0.1 | 1.3 | GO:0005952 | cAMP-dependent protein kinase complex(GO:0005952) |
| 0.1 | 1.3 | GO:0008385 | IkappaB kinase complex(GO:0008385) |
| 0.1 | 0.6 | GO:1990726 | Lsm1-7-Pat1 complex(GO:1990726) |
| 0.1 | 17.2 | GO:0030136 | clathrin-coated vesicle(GO:0030136) |
| 0.1 | 2.2 | GO:0000930 | gamma-tubulin complex(GO:0000930) |
| 0.1 | 3.3 | GO:0016235 | aggresome(GO:0016235) |
| 0.1 | 1.1 | GO:0036057 | filtration diaphragm(GO:0036056) slit diaphragm(GO:0036057) |
| 0.1 | 6.3 | GO:0034707 | chloride channel complex(GO:0034707) |
| 0.1 | 10.6 | GO:0005923 | bicellular tight junction(GO:0005923) |
| 0.1 | 5.8 | GO:0005913 | cell-cell adherens junction(GO:0005913) |
| 0.1 | 4.4 | GO:0017053 | transcriptional repressor complex(GO:0017053) |
| 0.1 | 2.7 | GO:0043596 | nuclear replication fork(GO:0043596) |
| 0.1 | 1.7 | GO:0005763 | organellar small ribosomal subunit(GO:0000314) mitochondrial small ribosomal subunit(GO:0005763) |
| 0.0 | 10.6 | GO:0005911 | cell-cell junction(GO:0005911) |
| 0.0 | 0.3 | GO:0070545 | PeBoW complex(GO:0070545) |
| 0.0 | 0.9 | GO:0046930 | pore complex(GO:0046930) |
| 0.0 | 4.6 | GO:0031463 | Cul3-RING ubiquitin ligase complex(GO:0031463) |
| 0.0 | 9.0 | GO:0030667 | secretory granule membrane(GO:0030667) |
| 0.0 | 4.9 | GO:0032580 | Golgi cisterna membrane(GO:0032580) |
| 0.0 | 0.5 | GO:0030008 | TRAPP complex(GO:0030008) |
| 0.0 | 3.6 | GO:0000118 | histone deacetylase complex(GO:0000118) |
| 0.0 | 2.9 | GO:0005801 | cis-Golgi network(GO:0005801) |
| 0.0 | 0.4 | GO:0070937 | CRD-mediated mRNA stability complex(GO:0070937) |
| 0.0 | 7.7 | GO:0030027 | lamellipodium(GO:0030027) |
| 0.0 | 4.1 | GO:0031252 | cell leading edge(GO:0031252) |
| 0.0 | 0.5 | GO:0030867 | rough endoplasmic reticulum membrane(GO:0030867) |
| 0.0 | 0.9 | GO:0012507 | ER to Golgi transport vesicle membrane(GO:0012507) |
| 0.0 | 2.4 | GO:0098791 | Golgi subcompartment(GO:0098791) |
| 0.0 | 0.3 | GO:0072669 | tRNA-splicing ligase complex(GO:0072669) |
| 0.0 | 0.3 | GO:0032541 | cortical endoplasmic reticulum(GO:0032541) |
| 0.0 | 0.2 | GO:0005955 | calcineurin complex(GO:0005955) |
| 0.0 | 0.7 | GO:0097381 | photoreceptor disc membrane(GO:0097381) |
| 0.0 | 5.7 | GO:0005765 | lysosomal membrane(GO:0005765) lytic vacuole membrane(GO:0098852) |
| 0.0 | 0.4 | GO:0008250 | oligosaccharyltransferase complex(GO:0008250) |
| 0.0 | 3.1 | GO:0043679 | axon terminus(GO:0043679) |
| 0.0 | 0.2 | GO:0016602 | CCAAT-binding factor complex(GO:0016602) |
| 0.0 | 1.1 | GO:0055038 | recycling endosome membrane(GO:0055038) |
| 0.0 | 16.1 | GO:0000139 | Golgi membrane(GO:0000139) |
| 0.0 | 0.2 | GO:0097038 | perinuclear endoplasmic reticulum(GO:0097038) |
| 0.0 | 0.1 | GO:0032021 | NELF complex(GO:0032021) |
| 0.0 | 14.4 | GO:0097708 | intracellular vesicle(GO:0097708) |
| 0.0 | 1.0 | GO:0005795 | Golgi stack(GO:0005795) |
Gene overrepresentation in molecular function category:
| Log-likelihood per target | Total log-likelihood | Term | Description |
|---|---|---|---|
| 8.5 | 42.4 | GO:0019976 | interleukin-2 receptor activity(GO:0004911) interleukin-2 binding(GO:0019976) |
| 6.4 | 12.9 | GO:0004917 | interleukin-7 receptor activity(GO:0004917) |
| 6.3 | 18.8 | GO:0005174 | CD40 receptor binding(GO:0005174) |
| 5.7 | 40.2 | GO:0016314 | phosphatidylinositol-3,4,5-trisphosphate 3-phosphatase activity(GO:0016314) |
| 4.7 | 66.3 | GO:0016176 | superoxide-generating NADPH oxidase activator activity(GO:0016176) |
| 4.7 | 51.8 | GO:0030369 | ICAM-3 receptor activity(GO:0030369) |
| 4.0 | 55.7 | GO:0051525 | NFAT protein binding(GO:0051525) |
| 3.9 | 65.9 | GO:0042608 | T cell receptor binding(GO:0042608) |
| 3.2 | 9.6 | GO:0016603 | glutaminyl-peptide cyclotransferase activity(GO:0016603) |
| 3.1 | 25.1 | GO:0043208 | glycosphingolipid binding(GO:0043208) |
| 2.9 | 5.7 | GO:0019763 | immunoglobulin receptor activity(GO:0019763) |
| 2.7 | 62.4 | GO:0005522 | profilin binding(GO:0005522) |
| 2.7 | 10.7 | GO:0031826 | type 2A serotonin receptor binding(GO:0031826) |
| 2.7 | 21.3 | GO:0001875 | lipopolysaccharide receptor activity(GO:0001875) |
| 2.6 | 111.9 | GO:0019198 | transmembrane receptor protein tyrosine phosphatase activity(GO:0005001) transmembrane receptor protein phosphatase activity(GO:0019198) |
| 2.5 | 25.3 | GO:0005094 | Rho GDP-dissociation inhibitor activity(GO:0005094) |
| 2.4 | 7.1 | GO:0035375 | zymogen binding(GO:0035375) |
| 2.3 | 32.8 | GO:0035005 | 1-phosphatidylinositol-4-phosphate 3-kinase activity(GO:0035005) |
| 2.2 | 19.9 | GO:0070891 | lipoteichoic acid binding(GO:0070891) |
| 2.1 | 12.6 | GO:0032422 | purine-rich negative regulatory element binding(GO:0032422) |
| 2.1 | 10.5 | GO:0031726 | CCR1 chemokine receptor binding(GO:0031726) |
| 2.0 | 16.3 | GO:0004974 | leukotriene receptor activity(GO:0004974) |
| 2.0 | 12.1 | GO:0016657 | GMP reductase activity(GO:0003920) oxidoreductase activity, acting on NAD(P)H, nitrogenous group as acceptor(GO:0016657) |
| 2.0 | 59.6 | GO:0005092 | GDP-dissociation inhibitor activity(GO:0005092) |
| 2.0 | 5.9 | GO:0004613 | phosphoenolpyruvate carboxykinase activity(GO:0004611) phosphoenolpyruvate carboxykinase (GTP) activity(GO:0004613) |
| 2.0 | 13.7 | GO:0097199 | cysteine-type endopeptidase activity involved in apoptotic signaling pathway(GO:0097199) |
| 1.8 | 43.1 | GO:0015174 | basic amino acid transmembrane transporter activity(GO:0015174) |
| 1.8 | 8.9 | GO:0070051 | fibrinogen binding(GO:0070051) |
| 1.7 | 5.1 | GO:0008330 | protein tyrosine/threonine phosphatase activity(GO:0008330) |
| 1.7 | 8.4 | GO:0043423 | 3-phosphoinositide-dependent protein kinase binding(GO:0043423) |
| 1.7 | 21.6 | GO:0008420 | CTD phosphatase activity(GO:0008420) |
| 1.7 | 29.9 | GO:0019864 | IgG binding(GO:0019864) |
| 1.6 | 4.9 | GO:0016517 | interleukin-12 receptor activity(GO:0016517) |
| 1.6 | 4.7 | GO:0004132 | dCMP deaminase activity(GO:0004132) |
| 1.5 | 4.5 | GO:0098918 | structural constituent of synapse(GO:0098918) structural constituent of postsynaptic actin cytoskeleton(GO:0098973) |
| 1.4 | 5.8 | GO:0000822 | inositol hexakisphosphate binding(GO:0000822) |
| 1.4 | 10.9 | GO:0005157 | macrophage colony-stimulating factor receptor binding(GO:0005157) |
| 1.3 | 11.7 | GO:0035662 | Toll-like receptor 4 binding(GO:0035662) |
| 1.3 | 46.0 | GO:0043325 | phosphatidylinositol-3,4-bisphosphate binding(GO:0043325) |
| 1.2 | 4.8 | GO:0005136 | interleukin-4 receptor binding(GO:0005136) |
| 1.1 | 13.6 | GO:0033691 | sialic acid binding(GO:0033691) |
| 1.1 | 9.0 | GO:0030229 | very-low-density lipoprotein particle receptor activity(GO:0030229) |
| 1.1 | 4.5 | GO:0070119 | ciliary neurotrophic factor binding(GO:0070119) |
| 1.1 | 4.2 | GO:0044378 | non-sequence-specific DNA binding, bending(GO:0044378) |
| 1.0 | 3.1 | GO:0033699 | DNA 5'-adenosine monophosphate hydrolase activity(GO:0033699) |
| 1.0 | 6.2 | GO:0015018 | galactosylgalactosylxylosylprotein 3-beta-glucuronosyltransferase activity(GO:0015018) |
| 1.0 | 4.1 | GO:0031731 | CCR6 chemokine receptor binding(GO:0031731) |
| 1.0 | 19.0 | GO:0008429 | phosphatidylethanolamine binding(GO:0008429) |
| 1.0 | 6.0 | GO:0035800 | deubiquitinase activator activity(GO:0035800) |
| 1.0 | 45.5 | GO:0005164 | tumor necrosis factor receptor binding(GO:0005164) |
| 1.0 | 19.5 | GO:0035325 | Toll-like receptor binding(GO:0035325) |
| 1.0 | 3.9 | GO:0004979 | beta-endorphin receptor activity(GO:0004979) morphine receptor activity(GO:0038047) |
| 1.0 | 35.6 | GO:0022829 | wide pore channel activity(GO:0022829) |
| 0.8 | 4.2 | GO:0070579 | methylcytosine dioxygenase activity(GO:0070579) |
| 0.8 | 16.0 | GO:0042609 | CD4 receptor binding(GO:0042609) |
| 0.8 | 14.3 | GO:0016175 | superoxide-generating NADPH oxidase activity(GO:0016175) |
| 0.8 | 25.1 | GO:0023026 | MHC class II protein complex binding(GO:0023026) |
| 0.8 | 3.2 | GO:0016300 | tRNA (uracil) methyltransferase activity(GO:0016300) |
| 0.8 | 40.9 | GO:0043236 | laminin binding(GO:0043236) |
| 0.8 | 9.4 | GO:0038049 | transcription factor activity, ligand-activated RNA polymerase II transcription factor binding(GO:0038049) |
| 0.8 | 31.5 | GO:0017166 | vinculin binding(GO:0017166) |
| 0.8 | 16.9 | GO:0016493 | C-C chemokine receptor activity(GO:0016493) |
| 0.7 | 9.0 | GO:0003810 | protein-glutamine gamma-glutamyltransferase activity(GO:0003810) |
| 0.7 | 2.2 | GO:0031755 | endothelial differentiation G-protein coupled receptor binding(GO:0031753) Edg-2 lysophosphatidic acid receptor binding(GO:0031755) |
| 0.7 | 3.6 | GO:1990460 | leptin receptor binding(GO:1990460) |
| 0.7 | 20.1 | GO:0001965 | G-protein alpha-subunit binding(GO:0001965) |
| 0.7 | 5.6 | GO:0004514 | nicotinate-nucleotide diphosphorylase (carboxylating) activity(GO:0004514) |
| 0.7 | 2.8 | GO:0061769 | ribosylnicotinamide kinase activity(GO:0050262) ribosylnicotinate kinase activity(GO:0061769) |
| 0.7 | 8.4 | GO:0031681 | G-protein beta-subunit binding(GO:0031681) |
| 0.6 | 2.6 | GO:0001626 | nociceptin receptor activity(GO:0001626) |
| 0.6 | 1.9 | GO:0050146 | nucleoside phosphotransferase activity(GO:0050146) |
| 0.6 | 30.8 | GO:0005547 | phosphatidylinositol-3,4,5-trisphosphate binding(GO:0005547) |
| 0.6 | 25.1 | GO:0001784 | phosphotyrosine binding(GO:0001784) |
| 0.6 | 34.5 | GO:0043027 | cysteine-type endopeptidase inhibitor activity involved in apoptotic process(GO:0043027) |
| 0.6 | 13.2 | GO:0051400 | BH domain binding(GO:0051400) |
| 0.6 | 2.9 | GO:0004464 | leukotriene-C4 synthase activity(GO:0004464) |
| 0.6 | 1.7 | GO:0090555 | phosphatidylethanolamine-translocating ATPase activity(GO:0090555) |
| 0.5 | 4.9 | GO:0008449 | N-acetylglucosamine-6-sulfatase activity(GO:0008449) |
| 0.5 | 3.8 | GO:0086089 | voltage-gated potassium channel activity involved in atrial cardiac muscle cell action potential repolarization(GO:0086089) |
| 0.5 | 4.9 | GO:1990405 | protein antigen binding(GO:1990405) |
| 0.5 | 5.3 | GO:0008440 | inositol-1,4,5-trisphosphate 3-kinase activity(GO:0008440) |
| 0.5 | 16.4 | GO:0004298 | threonine-type endopeptidase activity(GO:0004298) threonine-type peptidase activity(GO:0070003) |
| 0.5 | 24.7 | GO:0005086 | ARF guanyl-nucleotide exchange factor activity(GO:0005086) |
| 0.5 | 3.1 | GO:0071074 | eukaryotic initiation factor eIF2 binding(GO:0071074) |
| 0.5 | 40.4 | GO:0017112 | Rab guanyl-nucleotide exchange factor activity(GO:0017112) |
| 0.5 | 6.5 | GO:0070181 | small ribosomal subunit rRNA binding(GO:0070181) |
| 0.5 | 5.0 | GO:0035612 | AP-2 adaptor complex binding(GO:0035612) |
| 0.5 | 1.5 | GO:0036328 | VEGF-C-activated receptor activity(GO:0036328) |
| 0.5 | 6.7 | GO:0004726 | non-membrane spanning protein tyrosine phosphatase activity(GO:0004726) |
| 0.5 | 4.3 | GO:1990829 | C-rich single-stranded DNA binding(GO:1990829) |
| 0.5 | 6.6 | GO:0046935 | 1-phosphatidylinositol-3-kinase regulator activity(GO:0046935) |
| 0.5 | 47.9 | GO:1990782 | protein tyrosine kinase binding(GO:1990782) |
| 0.5 | 3.3 | GO:0046624 | sphingolipid transporter activity(GO:0046624) |
| 0.5 | 4.1 | GO:0000213 | tRNA-intron endonuclease activity(GO:0000213) |
| 0.5 | 65.9 | GO:0005070 | SH3/SH2 adaptor activity(GO:0005070) |
| 0.4 | 228.4 | GO:0005096 | GTPase activator activity(GO:0005096) |
| 0.4 | 2.2 | GO:0004572 | mannosyl-oligosaccharide 1,3-1,6-alpha-mannosidase activity(GO:0004572) |
| 0.4 | 12.4 | GO:0004185 | serine-type carboxypeptidase activity(GO:0004185) |
| 0.4 | 3.9 | GO:0003886 | DNA (cytosine-5-)-methyltransferase activity(GO:0003886) |
| 0.4 | 1.3 | GO:0004961 | thromboxane receptor activity(GO:0004960) thromboxane A2 receptor activity(GO:0004961) |
| 0.4 | 2.6 | GO:0055131 | C3HC4-type RING finger domain binding(GO:0055131) |
| 0.4 | 1.7 | GO:0004949 | cannabinoid receptor activity(GO:0004949) |
| 0.4 | 7.2 | GO:0045159 | myosin II binding(GO:0045159) |
| 0.4 | 3.8 | GO:0043426 | MRF binding(GO:0043426) |
| 0.4 | 3.4 | GO:0031962 | mineralocorticoid receptor binding(GO:0031962) |
| 0.4 | 10.0 | GO:0045028 | G-protein coupled nucleotide receptor activity(GO:0001608) G-protein coupled purinergic nucleotide receptor activity(GO:0045028) |
| 0.4 | 11.1 | GO:0045125 | bioactive lipid receptor activity(GO:0045125) |
| 0.4 | 2.0 | GO:0033829 | O-fucosylpeptide 3-beta-N-acetylglucosaminyltransferase activity(GO:0033829) |
| 0.4 | 2.0 | GO:0098808 | mRNA cap binding(GO:0098808) |
| 0.4 | 3.4 | GO:0035500 | MH2 domain binding(GO:0035500) |
| 0.4 | 24.6 | GO:0043425 | bHLH transcription factor binding(GO:0043425) |
| 0.4 | 4.6 | GO:0046920 | alpha-(1->3)-fucosyltransferase activity(GO:0046920) |
| 0.4 | 5.3 | GO:0019869 | chloride channel inhibitor activity(GO:0019869) |
| 0.4 | 8.1 | GO:0034450 | ubiquitin-ubiquitin ligase activity(GO:0034450) |
| 0.3 | 10.7 | GO:0034236 | protein kinase A catalytic subunit binding(GO:0034236) |
| 0.3 | 2.4 | GO:0031752 | D5 dopamine receptor binding(GO:0031752) |
| 0.3 | 2.4 | GO:0019826 | oxygen sensor activity(GO:0019826) |
| 0.3 | 2.4 | GO:0042289 | MHC class II protein binding(GO:0042289) |
| 0.3 | 10.4 | GO:0043274 | phospholipase binding(GO:0043274) |
| 0.3 | 4.3 | GO:0044323 | retinoic acid-responsive element binding(GO:0044323) |
| 0.3 | 2.0 | GO:0004534 | 5'-3' exoribonuclease activity(GO:0004534) |
| 0.3 | 6.8 | GO:0004383 | guanylate cyclase activity(GO:0004383) |
| 0.3 | 5.8 | GO:0003680 | AT DNA binding(GO:0003680) |
| 0.3 | 3.5 | GO:0042799 | histone methyltransferase activity (H4-K20 specific)(GO:0042799) |
| 0.3 | 1.6 | GO:0004826 | phenylalanine-tRNA ligase activity(GO:0004826) |
| 0.3 | 12.6 | GO:0004709 | MAP kinase kinase kinase activity(GO:0004709) |
| 0.3 | 2.1 | GO:0005176 | ErbB-2 class receptor binding(GO:0005176) |
| 0.3 | 1.6 | GO:0102008 | cytosolic dipeptidase activity(GO:0102008) |
| 0.3 | 9.6 | GO:0048020 | CCR chemokine receptor binding(GO:0048020) |
| 0.3 | 2.3 | GO:0035312 | 5'-3' exodeoxyribonuclease activity(GO:0035312) |
| 0.3 | 1.3 | GO:1990450 | linear polyubiquitin binding(GO:1990450) |
| 0.3 | 11.0 | GO:0032266 | phosphatidylinositol-3-phosphate binding(GO:0032266) |
| 0.3 | 2.3 | GO:0001594 | trace-amine receptor activity(GO:0001594) |
| 0.2 | 0.5 | GO:0016303 | 1-phosphatidylinositol-3-kinase activity(GO:0016303) |
| 0.2 | 3.6 | GO:0015925 | galactosidase activity(GO:0015925) |
| 0.2 | 3.5 | GO:0032050 | clathrin heavy chain binding(GO:0032050) |
| 0.2 | 1.6 | GO:0017108 | 5'-flap endonuclease activity(GO:0017108) |
| 0.2 | 11.1 | GO:0051959 | dynein light intermediate chain binding(GO:0051959) |
| 0.2 | 5.5 | GO:0008301 | DNA binding, bending(GO:0008301) |
| 0.2 | 1.1 | GO:0004167 | dopachrome isomerase activity(GO:0004167) |
| 0.2 | 1.3 | GO:0004376 | glycolipid mannosyltransferase activity(GO:0004376) |
| 0.2 | 2.1 | GO:0030346 | protein phosphatase 2B binding(GO:0030346) |
| 0.2 | 1.7 | GO:0032184 | SUMO polymer binding(GO:0032184) |
| 0.2 | 12.6 | GO:0004003 | ATP-dependent DNA helicase activity(GO:0004003) |
| 0.2 | 6.0 | GO:0042043 | neurexin family protein binding(GO:0042043) |
| 0.2 | 2.7 | GO:0031821 | G-protein coupled serotonin receptor binding(GO:0031821) |
| 0.2 | 2.9 | GO:0008097 | 5S rRNA binding(GO:0008097) |
| 0.2 | 2.8 | GO:0071933 | Arp2/3 complex binding(GO:0071933) |
| 0.2 | 4.0 | GO:0001206 | transcriptional repressor activity, RNA polymerase II distal enhancer sequence-specific binding(GO:0001206) |
| 0.2 | 4.1 | GO:0003678 | DNA helicase activity(GO:0003678) |
| 0.2 | 6.0 | GO:0046961 | ATPase activity, coupled to transmembrane movement of ions, rotational mechanism(GO:0044769) proton-transporting ATPase activity, rotational mechanism(GO:0046961) |
| 0.2 | 4.0 | GO:0030296 | protein tyrosine kinase activator activity(GO:0030296) |
| 0.2 | 1.4 | GO:0008853 | exodeoxyribonuclease III activity(GO:0008853) |
| 0.2 | 9.2 | GO:0004869 | cysteine-type endopeptidase inhibitor activity(GO:0004869) |
| 0.2 | 2.4 | GO:0050542 | icosanoid binding(GO:0050542) fatty acid derivative binding(GO:1901567) |
| 0.2 | 7.1 | GO:0042169 | SH2 domain binding(GO:0042169) |
| 0.2 | 5.0 | GO:0042288 | MHC class I protein binding(GO:0042288) |
| 0.2 | 12.0 | GO:0005080 | protein kinase C binding(GO:0005080) |
| 0.2 | 2.8 | GO:0017128 | phospholipid scramblase activity(GO:0017128) |
| 0.2 | 0.5 | GO:0019808 | polyamine binding(GO:0019808) |
| 0.2 | 7.9 | GO:0003705 | transcription factor activity, RNA polymerase II distal enhancer sequence-specific binding(GO:0003705) |
| 0.2 | 1.6 | GO:0008603 | cAMP-dependent protein kinase regulator activity(GO:0008603) |
| 0.2 | 5.3 | GO:0031489 | myosin V binding(GO:0031489) |
| 0.2 | 2.4 | GO:0005041 | low-density lipoprotein receptor activity(GO:0005041) |
| 0.2 | 2.7 | GO:0050700 | CARD domain binding(GO:0050700) |
| 0.2 | 23.0 | GO:0001158 | enhancer sequence-specific DNA binding(GO:0001158) |
| 0.2 | 0.6 | GO:0019107 | glycylpeptide N-tetradecanoyltransferase activity(GO:0004379) myristoyltransferase activity(GO:0019107) |
| 0.2 | 4.4 | GO:0030676 | Rac guanyl-nucleotide exchange factor activity(GO:0030676) |
| 0.1 | 14.0 | GO:0004402 | histone acetyltransferase activity(GO:0004402) |
| 0.1 | 7.0 | GO:0070717 | poly-purine tract binding(GO:0070717) |
| 0.1 | 0.4 | GO:0004108 | citrate (Si)-synthase activity(GO:0004108) citrate synthase activity(GO:0036440) |
| 0.1 | 1.2 | GO:0004771 | sterol esterase activity(GO:0004771) |
| 0.1 | 3.3 | GO:0005344 | oxygen transporter activity(GO:0005344) |
| 0.1 | 1.0 | GO:0019003 | GDP binding(GO:0019003) |
| 0.1 | 2.0 | GO:0097602 | cullin family protein binding(GO:0097602) |
| 0.1 | 0.9 | GO:0004966 | galanin receptor activity(GO:0004966) |
| 0.1 | 4.6 | GO:0000983 | transcription factor activity, RNA polymerase II core promoter sequence-specific(GO:0000983) |
| 0.1 | 1.0 | GO:0097108 | smoothened binding(GO:0005119) hedgehog family protein binding(GO:0097108) |
| 0.1 | 0.7 | GO:0050254 | rhodopsin kinase activity(GO:0050254) |
| 0.1 | 58.2 | GO:0003924 | GTPase activity(GO:0003924) |
| 0.1 | 3.1 | GO:0015467 | G-protein activated inward rectifier potassium channel activity(GO:0015467) |
| 0.1 | 2.2 | GO:0017151 | DEAD/H-box RNA helicase binding(GO:0017151) |
| 0.1 | 5.0 | GO:0004435 | phosphatidylinositol phospholipase C activity(GO:0004435) |
| 0.1 | 2.3 | GO:0004791 | thioredoxin-disulfide reductase activity(GO:0004791) |
| 0.1 | 2.3 | GO:0005078 | MAP-kinase scaffold activity(GO:0005078) |
| 0.1 | 6.7 | GO:0031624 | ubiquitin conjugating enzyme binding(GO:0031624) |
| 0.1 | 2.8 | GO:0015037 | peptide disulfide oxidoreductase activity(GO:0015037) |
| 0.1 | 3.7 | GO:0004012 | phospholipid-translocating ATPase activity(GO:0004012) |
| 0.1 | 1.0 | GO:0042975 | peroxisome proliferator activated receptor binding(GO:0042975) |
| 0.1 | 2.1 | GO:0030169 | low-density lipoprotein particle binding(GO:0030169) |
| 0.1 | 2.0 | GO:0035198 | miRNA binding(GO:0035198) |
| 0.1 | 9.4 | GO:0004693 | cyclin-dependent protein serine/threonine kinase activity(GO:0004693) |
| 0.1 | 4.6 | GO:0003887 | DNA-directed DNA polymerase activity(GO:0003887) |
| 0.1 | 3.4 | GO:0016805 | dipeptidase activity(GO:0016805) |
| 0.1 | 4.8 | GO:0005184 | neuropeptide hormone activity(GO:0005184) |
| 0.1 | 7.3 | GO:0005044 | scavenger receptor activity(GO:0005044) |
| 0.1 | 1.1 | GO:0005087 | Ran guanyl-nucleotide exchange factor activity(GO:0005087) |
| 0.1 | 16.7 | GO:0004725 | protein tyrosine phosphatase activity(GO:0004725) |
| 0.1 | 3.1 | GO:0043548 | phosphatidylinositol 3-kinase binding(GO:0043548) |
| 0.1 | 0.9 | GO:0008409 | 5'-3' exonuclease activity(GO:0008409) |
| 0.1 | 0.8 | GO:0008525 | phosphatidylcholine transporter activity(GO:0008525) |
| 0.1 | 6.6 | GO:0050840 | extracellular matrix binding(GO:0050840) |
| 0.1 | 0.4 | GO:0004348 | glucosylceramidase activity(GO:0004348) |
| 0.1 | 0.5 | GO:0004814 | arginine-tRNA ligase activity(GO:0004814) |
| 0.1 | 6.0 | GO:0019843 | rRNA binding(GO:0019843) |
| 0.1 | 0.6 | GO:0036080 | GDP-fucose transmembrane transporter activity(GO:0005457) purine nucleotide-sugar transmembrane transporter activity(GO:0036080) |
| 0.1 | 1.9 | GO:0005161 | platelet-derived growth factor receptor binding(GO:0005161) |
| 0.1 | 3.5 | GO:0017134 | fibroblast growth factor binding(GO:0017134) |
| 0.1 | 1.9 | GO:0017154 | semaphorin receptor activity(GO:0017154) |
| 0.1 | 4.2 | GO:0004364 | glutathione transferase activity(GO:0004364) |
| 0.1 | 0.2 | GO:0047389 | glycerophosphocholine phosphodiesterase activity(GO:0047389) |
| 0.1 | 1.2 | GO:0045499 | chemorepellent activity(GO:0045499) |
| 0.1 | 0.3 | GO:0003696 | satellite DNA binding(GO:0003696) |
| 0.1 | 2.5 | GO:0017025 | TBP-class protein binding(GO:0017025) |
| 0.1 | 0.9 | GO:0034452 | dynactin binding(GO:0034452) |
| 0.1 | 1.4 | GO:0035259 | glucocorticoid receptor binding(GO:0035259) |
| 0.1 | 1.1 | GO:0001871 | pattern binding(GO:0001871) polysaccharide binding(GO:0030247) |
| 0.1 | 2.9 | GO:0005035 | tumor necrosis factor-activated receptor activity(GO:0005031) death receptor activity(GO:0005035) |
| 0.1 | 1.9 | GO:0004143 | diacylglycerol kinase activity(GO:0004143) |
| 0.1 | 0.7 | GO:0071535 | RING-like zinc finger domain binding(GO:0071535) |
| 0.1 | 4.9 | GO:0050681 | androgen receptor binding(GO:0050681) |
| 0.1 | 50.9 | GO:0001228 | transcriptional activator activity, RNA polymerase II transcription regulatory region sequence-specific binding(GO:0001228) |
| 0.1 | 4.6 | GO:0004683 | calmodulin-dependent protein kinase activity(GO:0004683) |
| 0.1 | 2.0 | GO:1990841 | promoter-specific chromatin binding(GO:1990841) |
| 0.1 | 1.5 | GO:0051019 | mitogen-activated protein kinase binding(GO:0051019) |
| 0.1 | 2.0 | GO:0043495 | protein anchor(GO:0043495) |
| 0.1 | 0.2 | GO:0004807 | triose-phosphate isomerase activity(GO:0004807) |
| 0.1 | 0.8 | GO:0005375 | copper ion transmembrane transporter activity(GO:0005375) |
| 0.1 | 2.2 | GO:0043015 | gamma-tubulin binding(GO:0043015) |
| 0.1 | 5.0 | GO:0001085 | RNA polymerase II transcription factor binding(GO:0001085) |
| 0.1 | 21.1 | GO:0051020 | GTPase binding(GO:0051020) |
| 0.1 | 1.0 | GO:0008266 | poly(U) RNA binding(GO:0008266) |
| 0.1 | 0.3 | GO:0008457 | beta-galactosyl-N-acetylglucosaminylgalactosylglucosyl-ceramide beta-1,3-acetylglucosaminyltransferase activity(GO:0008457) lactosylceramide 1,3-N-acetyl-beta-D-glucosaminyltransferase activity(GO:0047256) |
| 0.1 | 0.7 | GO:0008020 | G-protein coupled photoreceptor activity(GO:0008020) |
| 0.1 | 1.2 | GO:0004708 | MAP kinase kinase activity(GO:0004708) |
| 0.1 | 10.7 | GO:0003735 | structural constituent of ribosome(GO:0003735) |
| 0.1 | 1.0 | GO:0070273 | phosphatidylinositol-4-phosphate binding(GO:0070273) |
| 0.1 | 0.7 | GO:0031078 | histone deacetylase activity (H3-K14 specific)(GO:0031078) NAD-dependent histone deacetylase activity (H3-K14 specific)(GO:0032041) |
| 0.0 | 0.1 | GO:0030156 | benzodiazepine receptor binding(GO:0030156) |
| 0.0 | 2.1 | GO:0001106 | RNA polymerase II transcription corepressor activity(GO:0001106) |
| 0.0 | 4.3 | GO:0001618 | virus receptor activity(GO:0001618) |
| 0.0 | 6.9 | GO:0004867 | serine-type endopeptidase inhibitor activity(GO:0004867) |
| 0.0 | 2.6 | GO:0046934 | phosphatidylinositol-4,5-bisphosphate 3-kinase activity(GO:0046934) |
| 0.0 | 1.0 | GO:0030332 | cyclin binding(GO:0030332) |
| 0.0 | 2.3 | GO:0001105 | RNA polymerase II transcription coactivator activity(GO:0001105) |
| 0.0 | 1.1 | GO:0008198 | ferrous iron binding(GO:0008198) |
| 0.0 | 1.7 | GO:0071889 | 14-3-3 protein binding(GO:0071889) |
| 0.0 | 0.6 | GO:0015386 | potassium:proton antiporter activity(GO:0015386) |
| 0.0 | 5.6 | GO:0005178 | integrin binding(GO:0005178) |
| 0.0 | 1.2 | GO:0046966 | thyroid hormone receptor binding(GO:0046966) |
| 0.0 | 1.0 | GO:0005523 | tropomyosin binding(GO:0005523) |
| 0.0 | 1.3 | GO:0004623 | phospholipase A2 activity(GO:0004623) |
| 0.0 | 0.7 | GO:0004181 | metallocarboxypeptidase activity(GO:0004181) |
| 0.0 | 1.0 | GO:0030544 | Hsp70 protein binding(GO:0030544) |
| 0.0 | 1.9 | GO:0019209 | kinase activator activity(GO:0019209) |
| 0.0 | 1.4 | GO:0004033 | aldo-keto reductase (NADP) activity(GO:0004033) |
| 0.0 | 0.5 | GO:0035925 | mRNA 3'-UTR AU-rich region binding(GO:0035925) |
| 0.0 | 2.6 | GO:0047485 | protein N-terminus binding(GO:0047485) |
| 0.0 | 0.8 | GO:0008331 | high voltage-gated calcium channel activity(GO:0008331) |
| 0.0 | 0.3 | GO:1904264 | ubiquitin protein ligase activity involved in ERAD pathway(GO:1904264) |
| 0.0 | 0.4 | GO:0008009 | chemokine activity(GO:0008009) |
| 0.0 | 1.1 | GO:0061631 | ubiquitin conjugating enzyme activity(GO:0061631) ubiquitin-like protein conjugating enzyme activity(GO:0061650) |
| 0.0 | 0.8 | GO:0019706 | protein-cysteine S-palmitoyltransferase activity(GO:0019706) protein-cysteine S-acyltransferase activity(GO:0019707) |
| 0.0 | 0.2 | GO:0033192 | calmodulin-dependent protein phosphatase activity(GO:0033192) |
| 0.0 | 1.0 | GO:0003727 | single-stranded RNA binding(GO:0003727) |
| 0.0 | 0.1 | GO:0030911 | TPR domain binding(GO:0030911) |
| 0.0 | 0.3 | GO:0098847 | sequence-specific single stranded DNA binding(GO:0098847) |
| 0.0 | 0.1 | GO:0051185 | coenzyme transporter activity(GO:0051185) |
| 0.0 | 0.7 | GO:0032451 | demethylase activity(GO:0032451) |
| 0.0 | 1.6 | GO:0004386 | helicase activity(GO:0004386) |
| 0.0 | 0.1 | GO:0008179 | adenylate cyclase binding(GO:0008179) |
| 0.0 | 0.2 | GO:0005149 | interleukin-1 receptor binding(GO:0005149) |
| 0.0 | 0.1 | GO:0097322 | 7SK snRNA binding(GO:0097322) |
Gene overrepresentation in curated gene sets: canonical pathways category:
| Log-likelihood per target | Total log-likelihood | Term | Description |
|---|---|---|---|
| 3.2 | 379.9 | PID CD8 TCR PATHWAY | TCR signaling in naïve CD8+ T cells |
| 1.6 | 66.9 | PID IL8 CXCR1 PATHWAY | IL8- and CXCR1-mediated signaling events |
| 1.5 | 61.9 | PID TCR PATHWAY | TCR signaling in naïve CD4+ T cells |
| 1.3 | 55.8 | SA MMP CYTOKINE CONNECTION | Cytokines can induce activation of matrix metalloproteinases, which degrade extracellular matrix. |
| 1.2 | 79.8 | PID INTEGRIN2 PATHWAY | Beta2 integrin cell surface interactions |
| 1.2 | 34.7 | PID IL8 CXCR2 PATHWAY | IL8- and CXCR2-mediated signaling events |
| 1.0 | 68.7 | PID IL2 STAT5 PATHWAY | IL2 signaling events mediated by STAT5 |
| 1.0 | 36.3 | PID TOLL ENDOGENOUS PATHWAY | Endogenous TLR signaling |
| 1.0 | 17.3 | PID TCR RAS PATHWAY | Ras signaling in the CD4+ TCR pathway |
| 0.9 | 66.6 | PID FCER1 PATHWAY | Fc-epsilon receptor I signaling in mast cells |
| 0.9 | 97.8 | PID RAC1 PATHWAY | RAC1 signaling pathway |
| 0.8 | 70.4 | PID IL4 2PATHWAY | IL4-mediated signaling events |
| 0.7 | 28.4 | SA CASPASE CASCADE | Apoptosis is mediated by caspases, cysteine proteases arranged in a proteolytic cascade. |
| 0.7 | 31.1 | PID BCR 5PATHWAY | BCR signaling pathway |
| 0.6 | 85.6 | PID RHOA REG PATHWAY | Regulation of RhoA activity |
| 0.6 | 18.4 | SA PTEN PATHWAY | PTEN is a tumor suppressor that dephosphorylates the lipid messenger phosphatidylinositol triphosphate. |
| 0.6 | 12.6 | PID IL12 STAT4 PATHWAY | IL12 signaling mediated by STAT4 |
| 0.5 | 15.6 | PID EPHRINB REV PATHWAY | Ephrin B reverse signaling |
| 0.5 | 4.6 | SA B CELL RECEPTOR COMPLEXES | Antigen binding to B cell receptors activates protein tyrosine kinases, such as the Src family, which ultimate activate MAP kinases. |
| 0.4 | 47.9 | PID ILK PATHWAY | Integrin-linked kinase signaling |
| 0.4 | 6.4 | PID LYMPH ANGIOGENESIS PATHWAY | VEGFR3 signaling in lymphatic endothelium |
| 0.4 | 15.1 | PID P38 MKK3 6PATHWAY | p38 MAPK signaling pathway |
| 0.3 | 1.7 | PID AR NONGENOMIC PATHWAY | Nongenotropic Androgen signaling |
| 0.3 | 12.9 | PID INTEGRIN A9B1 PATHWAY | Alpha9 beta1 integrin signaling events |
| 0.3 | 7.5 | PID EPHA FWDPATHWAY | EPHA forward signaling |
| 0.3 | 9.7 | PID IL12 2PATHWAY | IL12-mediated signaling events |
| 0.3 | 7.5 | PID S1P S1P2 PATHWAY | S1P2 pathway |
| 0.3 | 10.3 | ST GAQ PATHWAY | G alpha q Pathway |
| 0.3 | 5.2 | PID IL2 1PATHWAY | IL2-mediated signaling events |
| 0.3 | 23.3 | PID NFAT TFPATHWAY | Calcineurin-regulated NFAT-dependent transcription in lymphocytes |
| 0.3 | 15.0 | PID ENDOTHELIN PATHWAY | Endothelins |
| 0.3 | 10.3 | PID GMCSF PATHWAY | GMCSF-mediated signaling events |
| 0.3 | 10.1 | PID CONE PATHWAY | Visual signal transduction: Cones |
| 0.3 | 34.7 | PID CMYB PATHWAY | C-MYB transcription factor network |
| 0.3 | 13.5 | PID ECADHERIN NASCENT AJ PATHWAY | E-cadherin signaling in the nascent adherens junction |
| 0.3 | 2.4 | PID IL2 PI3K PATHWAY | IL2 signaling events mediated by PI3K |
| 0.3 | 5.7 | PID P38 ALPHA BETA PATHWAY | Regulation of p38-alpha and p38-beta |
| 0.3 | 8.5 | PID P38 MK2 PATHWAY | p38 signaling mediated by MAPKAP kinases |
| 0.3 | 3.0 | SA PROGRAMMED CELL DEATH | Programmed cell death, or apoptosis, eliminates damaged or unneeded cells. |
| 0.2 | 37.7 | PID SMAD2 3NUCLEAR PATHWAY | Regulation of nuclear SMAD2/3 signaling |
| 0.2 | 6.6 | PID TXA2PATHWAY | Thromboxane A2 receptor signaling |
| 0.2 | 5.5 | PID DNA PK PATHWAY | DNA-PK pathway in nonhomologous end joining |
| 0.2 | 1.4 | PID FRA PATHWAY | Validated transcriptional targets of AP1 family members Fra1 and Fra2 |
| 0.2 | 5.4 | PID CD40 PATHWAY | CD40/CD40L signaling |
| 0.2 | 7.7 | PID KIT PATHWAY | Signaling events mediated by Stem cell factor receptor (c-Kit) |
| 0.2 | 1.2 | PID EPHA2 FWD PATHWAY | EPHA2 forward signaling |
| 0.2 | 3.5 | PID NFKAPPAB CANONICAL PATHWAY | Canonical NF-kappaB pathway |
| 0.2 | 6.6 | PID SYNDECAN 4 PATHWAY | Syndecan-4-mediated signaling events |
| 0.2 | 8.2 | PID ARF6 PATHWAY | Arf6 signaling events |
| 0.1 | 8.3 | PID MET PATHWAY | Signaling events mediated by Hepatocyte Growth Factor Receptor (c-Met) |
| 0.1 | 4.6 | PID INTEGRIN A4B1 PATHWAY | Alpha4 beta1 integrin signaling events |
| 0.1 | 8.7 | PID RB 1PATHWAY | Regulation of retinoblastoma protein |
| 0.1 | 3.4 | PID SYNDECAN 3 PATHWAY | Syndecan-3-mediated signaling events |
| 0.1 | 1.7 | PID THROMBIN PAR1 PATHWAY | PAR1-mediated thrombin signaling events |
| 0.1 | 2.1 | ST T CELL SIGNAL TRANSDUCTION | T Cell Signal Transduction |
| 0.1 | 2.3 | PID RHODOPSIN PATHWAY | Visual signal transduction: Rods |
| 0.1 | 1.3 | PID TCR CALCIUM PATHWAY | Calcium signaling in the CD4+ TCR pathway |
| 0.1 | 6.0 | PID PDGFRB PATHWAY | PDGFR-beta signaling pathway |
| 0.1 | 1.5 | PID ERB GENOMIC PATHWAY | Validated nuclear estrogen receptor beta network |
| 0.1 | 1.5 | PID HDAC CLASSII PATHWAY | Signaling events mediated by HDAC Class II |
| 0.1 | 4.3 | PID CDC42 REG PATHWAY | Regulation of CDC42 activity |
| 0.1 | 5.0 | PID TRKR PATHWAY | Neurotrophic factor-mediated Trk receptor signaling |
| 0.1 | 3.6 | PID ERBB1 DOWNSTREAM PATHWAY | ErbB1 downstream signaling |
| 0.1 | 3.2 | PID REG GR PATHWAY | Glucocorticoid receptor regulatory network |
| 0.1 | 2.2 | PID DELTA NP63 PATHWAY | Validated transcriptional targets of deltaNp63 isoforms |
| 0.1 | 27.8 | NABA SECRETED FACTORS | Genes encoding secreted soluble factors |
| 0.1 | 4.4 | PID P53 REGULATION PATHWAY | p53 pathway |
| 0.1 | 7.1 | PID AR PATHWAY | Coregulation of Androgen receptor activity |
| 0.1 | 4.6 | PID NOTCH PATHWAY | Notch signaling pathway |
| 0.1 | 1.2 | PID WNT NONCANONICAL PATHWAY | Noncanonical Wnt signaling pathway |
| 0.0 | 11.6 | NABA ECM AFFILIATED | Genes encoding proteins affiliated structurally or functionally to extracellular matrix proteins |
| 0.0 | 1.0 | PID HEDGEHOG 2PATHWAY | Signaling events mediated by the Hedgehog family |
| 0.0 | 1.5 | PID RXR VDR PATHWAY | RXR and RAR heterodimerization with other nuclear receptor |
| 0.0 | 0.7 | ST P38 MAPK PATHWAY | p38 MAPK Pathway |
| 0.0 | 0.3 | PID ERBB4 PATHWAY | ErbB4 signaling events |
| 0.0 | 10.9 | NABA MATRISOME ASSOCIATED | Ensemble of genes encoding ECM-associated proteins including ECM-affilaited proteins, ECM regulators and secreted factors |
| 0.0 | 0.8 | PID AURORA A PATHWAY | Aurora A signaling |
| 0.0 | 1.6 | PID HDAC CLASSI PATHWAY | Signaling events mediated by HDAC Class I |
| 0.0 | 0.3 | PID FOXM1 PATHWAY | FOXM1 transcription factor network |
| 0.0 | 0.7 | NABA PROTEOGLYCANS | Genes encoding proteoglycans |
| 0.0 | 0.6 | PID LKB1 PATHWAY | LKB1 signaling events |
Gene overrepresentation in curated gene sets: REACTOME pathways category:
| Log-likelihood per target | Total log-likelihood | Term | Description |
|---|---|---|---|
| 8.2 | 237.2 | REACTOME PHOSPHORYLATION OF CD3 AND TCR ZETA CHAINS | Genes involved in Phosphorylation of CD3 and TCR zeta chains |
| 3.7 | 40.9 | REACTOME ENDOSOMAL VACUOLAR PATHWAY | Genes involved in Endosomal/Vacuolar pathway |
| 2.8 | 2.8 | REACTOME INTERACTIONS OF VPR WITH HOST CELLULAR PROTEINS | Genes involved in Interactions of Vpr with host cellular proteins |
| 2.4 | 78.0 | REACTOME GENERATION OF SECOND MESSENGER MOLECULES | Genes involved in Generation of second messenger molecules |
| 1.9 | 13.1 | REACTOME PD1 SIGNALING | Genes involved in PD-1 signaling |
| 1.8 | 1.8 | REACTOME SIGNAL AMPLIFICATION | Genes involved in Signal amplification |
| 1.4 | 156.2 | REACTOME IMMUNOREGULATORY INTERACTIONS BETWEEN A LYMPHOID AND A NON LYMPHOID CELL | Genes involved in Immunoregulatory interactions between a Lymphoid and a non-Lymphoid cell |
| 1.4 | 77.9 | REACTOME LATENT INFECTION OF HOMO SAPIENS WITH MYCOBACTERIUM TUBERCULOSIS | Genes involved in Latent infection of Homo sapiens with Mycobacterium tuberculosis |
| 1.4 | 66.6 | REACTOME IL RECEPTOR SHC SIGNALING | Genes involved in Interleukin receptor SHC signaling |
| 1.4 | 20.7 | REACTOME REGULATION OF INSULIN SECRETION BY ACETYLCHOLINE | Genes involved in Regulation of Insulin Secretion by Acetylcholine |
| 1.4 | 104.5 | REACTOME GPVI MEDIATED ACTIVATION CASCADE | Genes involved in GPVI-mediated activation cascade |
| 1.4 | 27.3 | REACTOME THE NLRP3 INFLAMMASOME | Genes involved in The NLRP3 inflammasome |
| 1.1 | 8.6 | REACTOME IRAK1 RECRUITS IKK COMPLEX | Genes involved in IRAK1 recruits IKK complex |
| 1.1 | 21.3 | REACTOME IKK COMPLEX RECRUITMENT MEDIATED BY RIP1 | Genes involved in IKK complex recruitment mediated by RIP1 |
| 1.0 | 3.1 | REACTOME TRAF3 DEPENDENT IRF ACTIVATION PATHWAY | Genes involved in TRAF3-dependent IRF activation pathway |
| 1.0 | 15.5 | REACTOME NFKB ACTIVATION THROUGH FADD RIP1 PATHWAY MEDIATED BY CASPASE 8 AND10 | Genes involved in NF-kB activation through FADD/RIP-1 pathway mediated by caspase-8 and -10 |
| 1.0 | 60.6 | REACTOME BASIGIN INTERACTIONS | Genes involved in Basigin interactions |
| 0.9 | 11.1 | REACTOME SIGNAL REGULATORY PROTEIN SIRP FAMILY INTERACTIONS | Genes involved in Signal regulatory protein (SIRP) family interactions |
| 0.8 | 3.4 | REACTOME TRAF6 MEDIATED IRF7 ACTIVATION IN TLR7 8 OR 9 SIGNALING | Genes involved in TRAF6 mediated IRF7 activation in TLR7/8 or 9 signaling |
| 0.8 | 8.3 | REACTOME G ALPHA1213 SIGNALLING EVENTS | Genes involved in G alpha (12/13) signalling events |
| 0.8 | 12.9 | REACTOME IL 7 SIGNALING | Genes involved in Interleukin-7 signaling |
| 0.8 | 20.0 | REACTOME EICOSANOID LIGAND BINDING RECEPTORS | Genes involved in Eicosanoid ligand-binding receptors |
| 0.7 | 23.1 | REACTOME ANTIGEN ACTIVATES B CELL RECEPTOR LEADING TO GENERATION OF SECOND MESSENGERS | Genes involved in Antigen Activates B Cell Receptor Leading to Generation of Second Messengers |
| 0.7 | 10.1 | REACTOME THROMBIN SIGNALLING THROUGH PROTEINASE ACTIVATED RECEPTORS PARS | Genes involved in Thrombin signalling through proteinase activated receptors (PARs) |
| 0.7 | 21.8 | REACTOME THROMBOXANE SIGNALLING THROUGH TP RECEPTOR | Genes involved in Thromboxane signalling through TP receptor |
| 0.7 | 12.5 | REACTOME COMMON PATHWAY | Genes involved in Common Pathway |
| 0.6 | 16.6 | REACTOME ADVANCED GLYCOSYLATION ENDPRODUCT RECEPTOR SIGNALING | Genes involved in Advanced glycosylation endproduct receptor signaling |
| 0.6 | 8.4 | REACTOME IL 2 SIGNALING | Genes involved in Interleukin-2 signaling |
| 0.6 | 1.2 | REACTOME ACTIVATED TAK1 MEDIATES P38 MAPK ACTIVATION | Genes involved in activated TAK1 mediates p38 MAPK activation |
| 0.6 | 10.5 | REACTOME SIGNALING BY NOTCH2 | Genes involved in Signaling by NOTCH2 |
| 0.5 | 10.0 | REACTOME P2Y RECEPTORS | Genes involved in P2Y receptors |
| 0.5 | 145.6 | REACTOME SIGNALING BY RHO GTPASES | Genes involved in Signaling by Rho GTPases |
| 0.5 | 15.3 | REACTOME TRAF6 MEDIATED IRF7 ACTIVATION | Genes involved in TRAF6 mediated IRF7 activation |
| 0.5 | 6.1 | REACTOME TRAFFICKING AND PROCESSING OF ENDOSOMAL TLR | Genes involved in Trafficking and processing of endosomal TLR |
| 0.5 | 28.2 | REACTOME G ALPHA Z SIGNALLING EVENTS | Genes involved in G alpha (z) signalling events |
| 0.4 | 8.5 | REACTOME CYCLIN A B1 ASSOCIATED EVENTS DURING G2 M TRANSITION | Genes involved in Cyclin A/B1 associated events during G2/M transition |
| 0.4 | 12.1 | REACTOME PURINE SALVAGE | Genes involved in Purine salvage |
| 0.4 | 11.1 | REACTOME EXTRINSIC PATHWAY FOR APOPTOSIS | Genes involved in Extrinsic Pathway for Apoptosis |
| 0.4 | 20.5 | REACTOME PREFOLDIN MEDIATED TRANSFER OF SUBSTRATE TO CCT TRIC | Genes involved in Prefoldin mediated transfer of substrate to CCT/TriC |
| 0.4 | 11.5 | REACTOME GRB2 SOS PROVIDES LINKAGE TO MAPK SIGNALING FOR INTERGRINS | Genes involved in GRB2:SOS provides linkage to MAPK signaling for Intergrins |
| 0.4 | 5.3 | REACTOME APOPTOSIS INDUCED DNA FRAGMENTATION | Genes involved in Apoptosis induced DNA fragmentation |
| 0.4 | 6.1 | REACTOME CYCLIN E ASSOCIATED EVENTS DURING G1 S TRANSITION | Genes involved in Cyclin E associated events during G1/S transition |
| 0.4 | 32.5 | REACTOME CHEMOKINE RECEPTORS BIND CHEMOKINES | Genes involved in Chemokine receptors bind chemokines |
| 0.4 | 5.7 | REACTOME P38MAPK EVENTS | Genes involved in p38MAPK events |
| 0.4 | 14.6 | REACTOME NEPHRIN INTERACTIONS | Genes involved in Nephrin interactions |
| 0.4 | 17.4 | REACTOME NOD1 2 SIGNALING PATHWAY | Genes involved in NOD1/2 Signaling Pathway |
| 0.3 | 4.5 | REACTOME IL 6 SIGNALING | Genes involved in Interleukin-6 signaling |
| 0.3 | 7.7 | REACTOME INTRINSIC PATHWAY | Genes involved in Intrinsic Pathway |
| 0.3 | 8.4 | REACTOME ACTIVATION OF BH3 ONLY PROTEINS | Genes involved in Activation of BH3-only proteins |
| 0.3 | 4.1 | REACTOME CDC6 ASSOCIATION WITH THE ORC ORIGIN COMPLEX | Genes involved in CDC6 association with the ORC:origin complex |
| 0.3 | 13.3 | REACTOME NEGATIVE REGULATORS OF RIG I MDA5 SIGNALING | Genes involved in Negative regulators of RIG-I/MDA5 signaling |
| 0.3 | 46.8 | REACTOME REGULATION OF MRNA STABILITY BY PROTEINS THAT BIND AU RICH ELEMENTS | Genes involved in Regulation of mRNA Stability by Proteins that Bind AU-rich Elements |
| 0.3 | 7.9 | REACTOME LYSOSOME VESICLE BIOGENESIS | Genes involved in Lysosome Vesicle Biogenesis |
| 0.3 | 12.4 | REACTOME DOWNREGULATION OF SMAD2 3 SMAD4 TRANSCRIPTIONAL ACTIVITY | Genes involved in Downregulation of SMAD2/3:SMAD4 transcriptional activity |
| 0.3 | 16.3 | REACTOME COSTIMULATION BY THE CD28 FAMILY | Genes involved in Costimulation by the CD28 family |
| 0.3 | 3.1 | REACTOME GAMMA CARBOXYLATION TRANSPORT AND AMINO TERMINAL CLEAVAGE OF PROTEINS | Genes involved in Gamma-carboxylation, transport, and amino-terminal cleavage of proteins |
| 0.3 | 4.6 | REACTOME REMOVAL OF THE FLAP INTERMEDIATE FROM THE C STRAND | Genes involved in Removal of the Flap Intermediate from the C-strand |
| 0.3 | 2.0 | REACTOME PRE NOTCH PROCESSING IN GOLGI | Genes involved in Pre-NOTCH Processing in Golgi |
| 0.2 | 25.5 | REACTOME TOLL RECEPTOR CASCADES | Genes involved in Toll Receptor Cascades |
| 0.2 | 1.9 | REACTOME TCR SIGNALING | Genes involved in TCR signaling |
| 0.2 | 9.9 | REACTOME RAP1 SIGNALLING | Genes involved in Rap1 signalling |
| 0.2 | 2.4 | REACTOME MTORC1 MEDIATED SIGNALLING | Genes involved in mTORC1-mediated signalling |
| 0.2 | 2.1 | REACTOME REGULATION OF IFNA SIGNALING | Genes involved in Regulation of IFNA signaling |
| 0.2 | 9.1 | REACTOME THE ROLE OF NEF IN HIV1 REPLICATION AND DISEASE PATHOGENESIS | Genes involved in The role of Nef in HIV-1 replication and disease pathogenesis |
| 0.2 | 16.0 | REACTOME FORMATION OF THE TERNARY COMPLEX AND SUBSEQUENTLY THE 43S COMPLEX | Genes involved in Formation of the ternary complex, and subsequently, the 43S complex |
| 0.2 | 8.0 | REACTOME AMYLOIDS | Genes involved in Amyloids |
| 0.2 | 3.9 | REACTOME G PROTEIN ACTIVATION | Genes involved in G-protein activation |
| 0.2 | 11.0 | REACTOME G1 PHASE | Genes involved in G1 Phase |
| 0.2 | 3.6 | REACTOME INTRINSIC PATHWAY FOR APOPTOSIS | Genes involved in Intrinsic Pathway for Apoptosis |
| 0.1 | 4.1 | REACTOME SHC1 EVENTS IN ERBB4 SIGNALING | Genes involved in SHC1 events in ERBB4 signaling |
| 0.1 | 14.8 | REACTOME 3 UTR MEDIATED TRANSLATIONAL REGULATION | Genes involved in 3' -UTR-mediated translational regulation |
| 0.1 | 1.3 | REACTOME ORC1 REMOVAL FROM CHROMATIN | Genes involved in Orc1 removal from chromatin |
| 0.1 | 2.6 | REACTOME VITAMIN B5 PANTOTHENATE METABOLISM | Genes involved in Vitamin B5 (pantothenate) metabolism |
| 0.1 | 1.7 | REACTOME HORMONE LIGAND BINDING RECEPTORS | Genes involved in Hormone ligand-binding receptors |
| 0.1 | 6.7 | REACTOME INTERFERON ALPHA BETA SIGNALING | Genes involved in Interferon alpha/beta signaling |
| 0.1 | 1.9 | REACTOME PURINE CATABOLISM | Genes involved in Purine catabolism |
| 0.1 | 7.6 | REACTOME VOLTAGE GATED POTASSIUM CHANNELS | Genes involved in Voltage gated Potassium channels |
| 0.1 | 1.9 | REACTOME ACTIVATION OF GENES BY ATF4 | Genes involved in Activation of Genes by ATF4 |
| 0.1 | 1.6 | REACTOME REGULATION OF RHEB GTPASE ACTIVITY BY AMPK | Genes involved in Regulation of Rheb GTPase activity by AMPK |
| 0.1 | 5.6 | REACTOME MYOGENESIS | Genes involved in Myogenesis |
| 0.1 | 2.2 | REACTOME N GLYCAN ANTENNAE ELONGATION IN THE MEDIAL TRANS GOLGI | Genes involved in N-glycan antennae elongation in the medial/trans-Golgi |
| 0.1 | 14.7 | REACTOME CLASS A1 RHODOPSIN LIKE RECEPTORS | Genes involved in Class A/1 (Rhodopsin-like receptors) |
| 0.1 | 2.5 | REACTOME A TETRASACCHARIDE LINKER SEQUENCE IS REQUIRED FOR GAG SYNTHESIS | Genes involved in A tetrasaccharide linker sequence is required for GAG synthesis |
| 0.0 | 0.5 | REACTOME REGULATION OF AMPK ACTIVITY VIA LKB1 | Genes involved in Regulation of AMPK activity via LKB1 |
| 0.0 | 1.3 | REACTOME SYNTHESIS OF GLYCOSYLPHOSPHATIDYLINOSITOL GPI | Genes involved in Synthesis of glycosylphosphatidylinositol (GPI) |
| 0.0 | 1.7 | REACTOME CELL SURFACE INTERACTIONS AT THE VASCULAR WALL | Genes involved in Cell surface interactions at the vascular wall |
| 0.0 | 1.6 | REACTOME SULFUR AMINO ACID METABOLISM | Genes involved in Sulfur amino acid metabolism |
| 0.0 | 0.5 | REACTOME METABOLISM OF POLYAMINES | Genes involved in Metabolism of polyamines |
| 0.0 | 0.9 | REACTOME MRNA SPLICING MINOR PATHWAY | Genes involved in mRNA Splicing - Minor Pathway |
| 0.0 | 0.9 | REACTOME OTHER SEMAPHORIN INTERACTIONS | Genes involved in Other semaphorin interactions |
| 0.0 | 0.6 | REACTOME MRNA DECAY BY 5 TO 3 EXORIBONUCLEASE | Genes involved in mRNA Decay by 5' to 3' Exoribonuclease |
| 0.0 | 5.1 | REACTOME FACTORS INVOLVED IN MEGAKARYOCYTE DEVELOPMENT AND PLATELET PRODUCTION | Genes involved in Factors involved in megakaryocyte development and platelet production |
| 0.0 | 0.8 | REACTOME REGULATION OF WATER BALANCE BY RENAL AQUAPORINS | Genes involved in Regulation of Water Balance by Renal Aquaporins |
| 0.0 | 1.0 | REACTOME ABORTIVE ELONGATION OF HIV1 TRANSCRIPT IN THE ABSENCE OF TAT | Genes involved in Abortive elongation of HIV-1 transcript in the absence of Tat |
| 0.0 | 1.8 | REACTOME ACTIVATION OF CHAPERONE GENES BY XBP1S | Genes involved in Activation of Chaperone Genes by XBP1(S) |
| 0.0 | 0.7 | REACTOME EXTENSION OF TELOMERES | Genes involved in Extension of Telomeres |
| 0.0 | 1.5 | REACTOME TRANS GOLGI NETWORK VESICLE BUDDING | Genes involved in trans-Golgi Network Vesicle Budding |
| 0.0 | 0.9 | REACTOME TRANSPORT OF MATURE MRNA DERIVED FROM AN INTRONLESS TRANSCRIPT | Genes involved in Transport of Mature mRNA Derived from an Intronless Transcript |
| 0.0 | 0.8 | REACTOME METAL ION SLC TRANSPORTERS | Genes involved in Metal ion SLC transporters |
| 0.0 | 0.5 | REACTOME SIGNALING BY THE B CELL RECEPTOR BCR | Genes involved in Signaling by the B Cell Receptor (BCR) |
| 0.0 | 0.4 | REACTOME CITRIC ACID CYCLE TCA CYCLE | Genes involved in Citric acid cycle (TCA cycle) |
| 0.0 | 0.2 | REACTOME CHYLOMICRON MEDIATED LIPID TRANSPORT | Genes involved in Chylomicron-mediated lipid transport |
| 0.0 | 0.4 | REACTOME ADHERENS JUNCTIONS INTERACTIONS | Genes involved in Adherens junctions interactions |