Project
Illumina Body Map 2 (GSE30611)
Navigation
Downloads
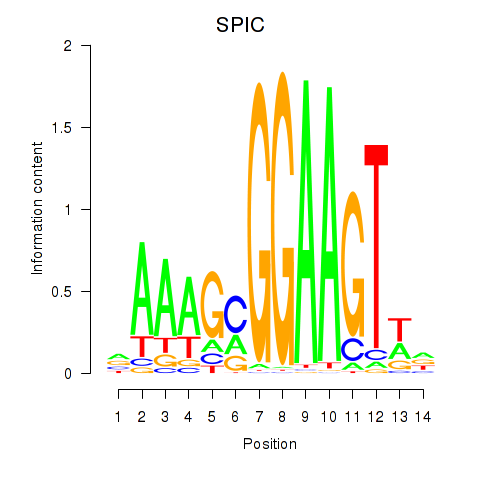
Results for SPIC
Z-value: 3.88
Motif logo
Transcription factors associated with SPIC
| Gene Symbol | Gene ID | Gene Info |
|---|---|---|
|
SPIC
|
ENSG00000166211.8 | Spi-C transcription factor |
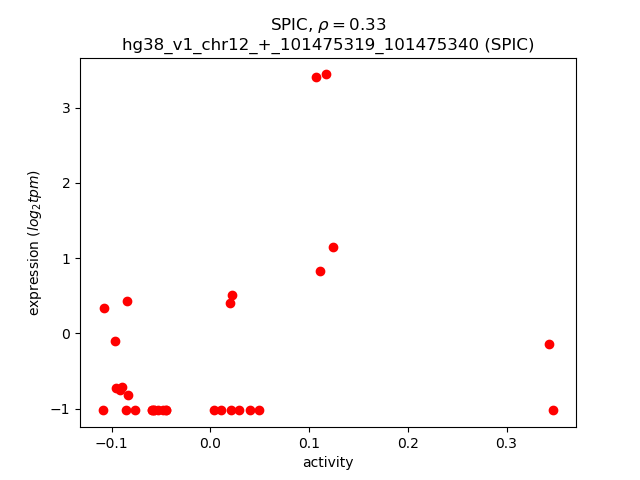
Activity-expression correlation:
| Gene | Promoter | Pearson corr. coef. | P-value | Plot |
|---|---|---|---|---|
| SPIC | hg38_v1_chr12_+_101475319_101475340 | 0.33 | 6.6e-02 | Click! |
Activity profile of SPIC motif
Sorted Z-values of SPIC motif
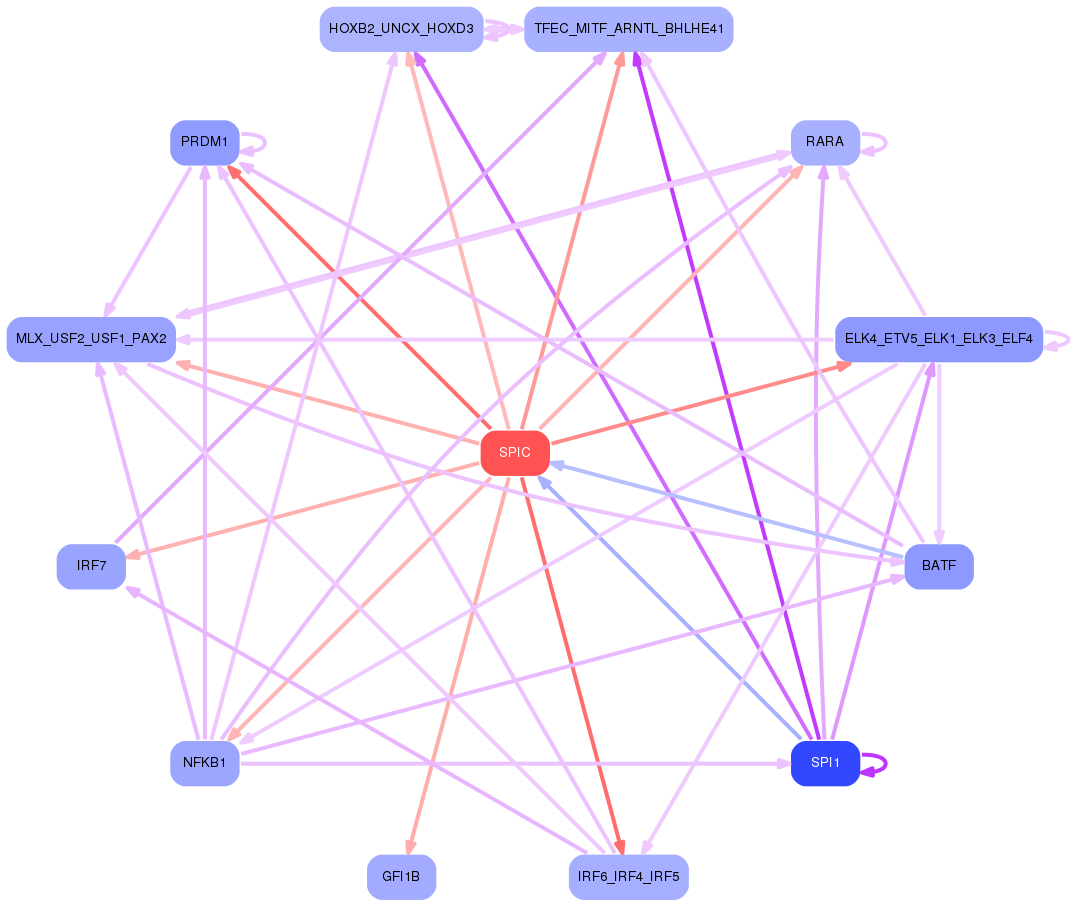
Network of associatons between targets according to the STRING database.

First level regulatory network of SPIC
Gene Ontology Analysis
Gene overrepresentation in biological process category:
| Log-likelihood per target | Total log-likelihood | Term | Description |
|---|---|---|---|
| 10.6 | 31.7 | GO:0034125 | negative regulation of MyD88-dependent toll-like receptor signaling pathway(GO:0034125) |
| 8.8 | 26.3 | GO:0061485 | memory T cell proliferation(GO:0061485) |
| 7.7 | 23.2 | GO:0043376 | regulation of CD8-positive, alpha-beta T cell differentiation(GO:0043376) |
| 5.3 | 21.3 | GO:0002337 | B-1a B cell differentiation(GO:0002337) |
| 4.6 | 36.6 | GO:0002774 | Fc receptor mediated inhibitory signaling pathway(GO:0002774) |
| 4.4 | 17.8 | GO:0045404 | positive regulation of interleukin-4 biosynthetic process(GO:0045404) |
| 4.4 | 13.2 | GO:0034769 | basement membrane disassembly(GO:0034769) |
| 4.1 | 20.5 | GO:0052053 | modulation by virus of host molecular function(GO:0039506) suppression by virus of host molecular function(GO:0039507) suppression by virus of host catalytic activity(GO:0039513) modulation by virus of host catalytic activity(GO:0039516) suppression by virus of host cysteine-type endopeptidase activity involved in apoptotic process(GO:0039650) negative regulation by symbiont of host catalytic activity(GO:0052053) negative regulation by symbiont of host molecular function(GO:0052056) modulation by symbiont of host catalytic activity(GO:0052148) |
| 3.9 | 23.1 | GO:0050859 | negative regulation of B cell receptor signaling pathway(GO:0050859) |
| 3.8 | 23.0 | GO:0071461 | cellular response to redox state(GO:0071461) |
| 3.8 | 11.3 | GO:0002316 | follicular B cell differentiation(GO:0002316) |
| 3.4 | 13.6 | GO:0045658 | regulation of neutrophil differentiation(GO:0045658) negative regulation of neutrophil differentiation(GO:0045659) |
| 3.2 | 22.6 | GO:0002322 | B cell proliferation involved in immune response(GO:0002322) |
| 3.1 | 31.4 | GO:0000821 | regulation of arginine metabolic process(GO:0000821) |
| 2.9 | 8.7 | GO:1990654 | sebum secreting cell proliferation(GO:1990654) |
| 2.7 | 13.6 | GO:0032796 | uropod organization(GO:0032796) |
| 2.7 | 13.4 | GO:0038043 | interleukin-5-mediated signaling pathway(GO:0038043) |
| 2.6 | 7.9 | GO:1904844 | response to L-glutamine(GO:1904844) cellular response to L-glutamine(GO:1904845) |
| 2.6 | 7.8 | GO:0032701 | negative regulation of interleukin-18 production(GO:0032701) |
| 2.6 | 2.6 | GO:1904139 | microglial cell migration(GO:1904124) regulation of microglial cell migration(GO:1904139) |
| 2.6 | 7.7 | GO:0002752 | cell surface pattern recognition receptor signaling pathway(GO:0002752) |
| 2.5 | 15.1 | GO:2000538 | regulation of cGMP-mediated signaling(GO:0010752) regulation of B cell chemotaxis(GO:2000537) positive regulation of B cell chemotaxis(GO:2000538) |
| 2.2 | 8.8 | GO:1903722 | regulation of centriole elongation(GO:1903722) |
| 1.9 | 5.7 | GO:0060557 | positive regulation of vitamin metabolic process(GO:0046136) positive regulation of vitamin D biosynthetic process(GO:0060557) positive regulation of calcidiol 1-monooxygenase activity(GO:0060559) |
| 1.8 | 5.4 | GO:1902227 | negative regulation of macrophage colony-stimulating factor signaling pathway(GO:1902227) negative regulation of response to macrophage colony-stimulating factor(GO:1903970) negative regulation of cellular response to macrophage colony-stimulating factor stimulus(GO:1903973) |
| 1.8 | 5.3 | GO:0019085 | early viral transcription(GO:0019085) |
| 1.7 | 3.4 | GO:2000562 | negative regulation of CD4-positive, alpha-beta T cell proliferation(GO:2000562) |
| 1.6 | 13.0 | GO:0071725 | toll-like receptor TLR1:TLR2 signaling pathway(GO:0038123) response to triacyl bacterial lipopeptide(GO:0071725) cellular response to triacyl bacterial lipopeptide(GO:0071727) |
| 1.5 | 12.3 | GO:0050904 | diapedesis(GO:0050904) |
| 1.5 | 4.6 | GO:0006679 | glucosylceramide biosynthetic process(GO:0006679) |
| 1.5 | 10.6 | GO:0010266 | response to vitamin B1(GO:0010266) |
| 1.4 | 12.9 | GO:0038145 | macrophage colony-stimulating factor signaling pathway(GO:0038145) |
| 1.4 | 7.0 | GO:0019086 | late viral transcription(GO:0019086) |
| 1.4 | 9.6 | GO:0033625 | positive regulation of integrin activation(GO:0033625) |
| 1.4 | 23.1 | GO:0015939 | pantothenate metabolic process(GO:0015939) |
| 1.4 | 5.4 | GO:0005986 | sucrose biosynthetic process(GO:0005986) |
| 1.3 | 2.6 | GO:0036369 | transcription factor catabolic process(GO:0036369) |
| 1.3 | 7.7 | GO:0010609 | mRNA localization resulting in posttranscriptional regulation of gene expression(GO:0010609) platelet alpha granule organization(GO:0070889) regulation of DNA damage response, signal transduction by p53 class mediator resulting in transcription of p21 class mediator(GO:1902162) positive regulation of DNA damage response, signal transduction by p53 class mediator resulting in transcription of p21 class mediator(GO:1902164) |
| 1.3 | 57.1 | GO:0045730 | respiratory burst(GO:0045730) |
| 1.2 | 3.7 | GO:0002399 | MHC class II protein complex assembly(GO:0002399) |
| 1.1 | 3.4 | GO:0071810 | corticotropin-releasing hormone secretion(GO:0043396) regulation of corticotropin-releasing hormone secretion(GO:0043397) regulation of fever generation by regulation of prostaglandin secretion(GO:0071810) positive regulation of fever generation by positive regulation of prostaglandin secretion(GO:0071812) positive regulation of ERK1 and ERK2 cascade via TNFSF11-mediated signaling(GO:0071848) regulation of fever generation by prostaglandin secretion(GO:0100009) |
| 1.1 | 5.7 | GO:0019805 | quinolinate biosynthetic process(GO:0019805) |
| 1.1 | 28.9 | GO:0002523 | leukocyte migration involved in inflammatory response(GO:0002523) |
| 1.1 | 13.3 | GO:0002291 | T cell activation via T cell receptor contact with antigen bound to MHC molecule on antigen presenting cell(GO:0002291) |
| 1.1 | 11.8 | GO:0001866 | NK T cell proliferation(GO:0001866) |
| 1.1 | 6.4 | GO:0060800 | regulation of cell differentiation involved in embryonic placenta development(GO:0060800) |
| 1.0 | 9.4 | GO:0061737 | leukotriene signaling pathway(GO:0061737) |
| 1.0 | 3.1 | GO:0070902 | mitochondrial tRNA pseudouridine synthesis(GO:0070902) |
| 1.0 | 8.8 | GO:2001137 | positive regulation of endocytic recycling(GO:2001137) |
| 0.9 | 4.7 | GO:0034124 | regulation of MyD88-dependent toll-like receptor signaling pathway(GO:0034124) |
| 0.9 | 5.5 | GO:0030037 | actin filament reorganization involved in cell cycle(GO:0030037) |
| 0.9 | 5.4 | GO:0038112 | interleukin-8-mediated signaling pathway(GO:0038112) |
| 0.9 | 7.1 | GO:2000660 | negative regulation of interleukin-1-mediated signaling pathway(GO:2000660) |
| 0.9 | 4.3 | GO:2000503 | positive regulation of natural killer cell chemotaxis(GO:2000503) |
| 0.8 | 3.4 | GO:0045079 | negative regulation of chemokine biosynthetic process(GO:0045079) |
| 0.8 | 6.7 | GO:1903378 | positive regulation of oxidative stress-induced neuron intrinsic apoptotic signaling pathway(GO:1903378) |
| 0.8 | 5.9 | GO:0014738 | regulation of muscle hyperplasia(GO:0014738) |
| 0.8 | 3.1 | GO:0036071 | N-glycan fucosylation(GO:0036071) |
| 0.8 | 3.1 | GO:0043335 | protein unfolding(GO:0043335) |
| 0.8 | 4.5 | GO:1901097 | negative regulation of autophagosome maturation(GO:1901097) |
| 0.8 | 6.8 | GO:0035696 | monocyte extravasation(GO:0035696) |
| 0.7 | 12.7 | GO:0036066 | protein O-linked fucosylation(GO:0036066) |
| 0.7 | 10.5 | GO:2001300 | lipoxin metabolic process(GO:2001300) |
| 0.7 | 3.0 | GO:0036058 | filtration diaphragm assembly(GO:0036058) slit diaphragm assembly(GO:0036060) |
| 0.7 | 12.3 | GO:0002430 | complement receptor mediated signaling pathway(GO:0002430) |
| 0.7 | 4.2 | GO:0051708 | intracellular transport of viral protein in host cell(GO:0019060) symbiont intracellular protein transport in host(GO:0030581) intracellular protein transport in other organism involved in symbiotic interaction(GO:0051708) |
| 0.7 | 4.0 | GO:0010757 | negative regulation of plasminogen activation(GO:0010757) |
| 0.7 | 2.0 | GO:0000967 | endonucleolytic cleavage to generate mature 5'-end of SSU-rRNA from (SSU-rRNA, 5.8S rRNA, LSU-rRNA)(GO:0000472) rRNA 5'-end processing(GO:0000967) ncRNA 5'-end processing(GO:0034471) |
| 0.6 | 3.9 | GO:2000825 | positive regulation of androgen receptor activity(GO:2000825) |
| 0.6 | 7.7 | GO:0045651 | positive regulation of macrophage differentiation(GO:0045651) |
| 0.6 | 8.8 | GO:0032494 | response to peptidoglycan(GO:0032494) |
| 0.6 | 5.6 | GO:0033004 | negative regulation of mast cell activation(GO:0033004) |
| 0.6 | 3.7 | GO:0035655 | interleukin-18-mediated signaling pathway(GO:0035655) cellular response to interleukin-18(GO:0071351) |
| 0.6 | 8.7 | GO:0043152 | induction of bacterial agglutination(GO:0043152) |
| 0.6 | 6.5 | GO:0070212 | protein poly-ADP-ribosylation(GO:0070212) |
| 0.6 | 4.1 | GO:0006049 | UDP-N-acetylglucosamine catabolic process(GO:0006049) |
| 0.6 | 8.4 | GO:2000271 | positive regulation of fibroblast apoptotic process(GO:2000271) |
| 0.6 | 6.1 | GO:2000535 | regulation of entry of bacterium into host cell(GO:2000535) |
| 0.6 | 13.8 | GO:0035589 | G-protein coupled purinergic nucleotide receptor signaling pathway(GO:0035589) |
| 0.5 | 12.2 | GO:0050869 | negative regulation of B cell activation(GO:0050869) |
| 0.5 | 4.2 | GO:0006710 | androgen catabolic process(GO:0006710) |
| 0.5 | 3.1 | GO:2000158 | positive regulation of ubiquitin-specific protease activity(GO:2000158) |
| 0.5 | 10.8 | GO:0009313 | oligosaccharide catabolic process(GO:0009313) |
| 0.5 | 1.5 | GO:0042109 | lymphotoxin A production(GO:0032641) lymphotoxin A biosynthetic process(GO:0042109) |
| 0.5 | 1.5 | GO:0071529 | cementum mineralization(GO:0071529) |
| 0.5 | 18.5 | GO:0000185 | activation of MAPKKK activity(GO:0000185) |
| 0.5 | 1.4 | GO:0046725 | negative regulation by virus of viral protein levels in host cell(GO:0046725) negative regulation of metanephric nephron tubule epithelial cell differentiation(GO:0072308) |
| 0.5 | 1.8 | GO:0021569 | rhombomere 3 development(GO:0021569) |
| 0.4 | 9.8 | GO:0071803 | positive regulation of podosome assembly(GO:0071803) |
| 0.4 | 5.0 | GO:0090168 | Golgi reassembly(GO:0090168) |
| 0.4 | 1.7 | GO:1902963 | regulation of metalloendopeptidase activity involved in amyloid precursor protein catabolic process(GO:1902962) negative regulation of metalloendopeptidase activity involved in amyloid precursor protein catabolic process(GO:1902963) |
| 0.4 | 45.6 | GO:0050672 | negative regulation of mononuclear cell proliferation(GO:0032945) negative regulation of lymphocyte proliferation(GO:0050672) |
| 0.4 | 1.2 | GO:0001546 | preantral ovarian follicle growth(GO:0001546) multi-layer follicle stage(GO:0048162) |
| 0.4 | 0.8 | GO:0039534 | negative regulation of MDA-5 signaling pathway(GO:0039534) |
| 0.4 | 1.2 | GO:2000646 | positive regulation of receptor catabolic process(GO:2000646) |
| 0.4 | 1.6 | GO:2000418 | positive regulation of eosinophil migration(GO:2000418) |
| 0.4 | 2.7 | GO:0031438 | negative regulation of mRNA cleavage(GO:0031438) negative regulation of mRNA endonucleolytic cleavage involved in unfolded protein response(GO:1904721) |
| 0.4 | 2.2 | GO:0060010 | Sertoli cell fate commitment(GO:0060010) |
| 0.4 | 3.3 | GO:0035879 | plasma membrane lactate transport(GO:0035879) |
| 0.4 | 0.7 | GO:0090135 | actin filament branching(GO:0090135) |
| 0.4 | 3.7 | GO:0006001 | fructose catabolic process(GO:0006001) fructose catabolic process to hydroxyacetone phosphate and glyceraldehyde-3-phosphate(GO:0061624) |
| 0.4 | 2.2 | GO:0035063 | nuclear speck organization(GO:0035063) |
| 0.3 | 3.1 | GO:0014057 | positive regulation of acetylcholine secretion, neurotransmission(GO:0014057) |
| 0.3 | 1.4 | GO:0048633 | positive regulation of skeletal muscle tissue growth(GO:0048633) |
| 0.3 | 78.6 | GO:0038094 | Fc-gamma receptor signaling pathway(GO:0038094) |
| 0.3 | 1.7 | GO:0035574 | histone H4-K20 demethylation(GO:0035574) |
| 0.3 | 7.0 | GO:0010818 | T cell chemotaxis(GO:0010818) |
| 0.3 | 1.0 | GO:0098583 | mastication(GO:0071626) learned vocalization behavior(GO:0098583) |
| 0.3 | 2.6 | GO:0000447 | endonucleolytic cleavage in ITS1 to separate SSU-rRNA from 5.8S rRNA and LSU-rRNA from tricistronic rRNA transcript (SSU-rRNA, 5.8S rRNA, LSU-rRNA)(GO:0000447) |
| 0.3 | 1.9 | GO:0098838 | reduced folate transmembrane transport(GO:0098838) |
| 0.3 | 6.4 | GO:0001955 | blood vessel maturation(GO:0001955) |
| 0.3 | 5.4 | GO:0034447 | very-low-density lipoprotein particle clearance(GO:0034447) |
| 0.3 | 5.1 | GO:0021842 | directional guidance of interneurons involved in migration from the subpallium to the cortex(GO:0021840) chemorepulsion involved in interneuron migration from the subpallium to the cortex(GO:0021842) ERBB3 signaling pathway(GO:0038129) |
| 0.3 | 3.6 | GO:0060665 | regulation of branching involved in salivary gland morphogenesis by mesenchymal-epithelial signaling(GO:0060665) |
| 0.3 | 1.8 | GO:0001692 | histamine metabolic process(GO:0001692) |
| 0.3 | 5.6 | GO:0034498 | early endosome to Golgi transport(GO:0034498) |
| 0.3 | 1.7 | GO:0090230 | regulation of centromere complex assembly(GO:0090230) regulation of kinetochore assembly(GO:0090234) |
| 0.3 | 2.3 | GO:0071802 | negative regulation of podosome assembly(GO:0071802) |
| 0.3 | 2.6 | GO:0002254 | kinin cascade(GO:0002254) plasma kallikrein-kinin cascade(GO:0002353) |
| 0.3 | 0.6 | GO:0034427 | nuclear-transcribed mRNA catabolic process, exonucleolytic, 3'-5'(GO:0034427) |
| 0.3 | 6.3 | GO:0007597 | blood coagulation, intrinsic pathway(GO:0007597) |
| 0.3 | 0.9 | GO:0048852 | diencephalon morphogenesis(GO:0048852) |
| 0.3 | 3.1 | GO:0031087 | deadenylation-independent decapping of nuclear-transcribed mRNA(GO:0031087) |
| 0.3 | 12.5 | GO:0051482 | positive regulation of cytosolic calcium ion concentration involved in phospholipase C-activating G-protein coupled signaling pathway(GO:0051482) |
| 0.3 | 1.1 | GO:1900127 | positive regulation of hyaluronan biosynthetic process(GO:1900127) |
| 0.3 | 0.5 | GO:0070945 | neutrophil mediated killing of gram-negative bacterium(GO:0070945) |
| 0.3 | 1.6 | GO:1904207 | regulation of chemokine (C-C motif) ligand 2 secretion(GO:1904207) positive regulation of chemokine (C-C motif) ligand 2 secretion(GO:1904209) |
| 0.3 | 1.3 | GO:0051771 | negative regulation of nitric-oxide synthase biosynthetic process(GO:0051771) |
| 0.3 | 1.3 | GO:0046671 | negative regulation of cellular pH reduction(GO:0032848) CD8-positive, alpha-beta T cell lineage commitment(GO:0043375) negative regulation of retinal cell programmed cell death(GO:0046671) |
| 0.3 | 41.0 | GO:0006614 | SRP-dependent cotranslational protein targeting to membrane(GO:0006614) |
| 0.3 | 3.6 | GO:0019885 | antigen processing and presentation of endogenous peptide antigen via MHC class I(GO:0019885) |
| 0.3 | 3.8 | GO:0098789 | pre-mRNA cleavage required for polyadenylation(GO:0098789) |
| 0.2 | 1.5 | GO:0097368 | establishment of Sertoli cell barrier(GO:0097368) |
| 0.2 | 1.5 | GO:1903438 | regulation of cytokinetic process(GO:0032954) regulation of mitotic cytokinetic process(GO:1903436) positive regulation of mitotic cytokinetic process(GO:1903438) positive regulation of mitotic cytokinesis(GO:1903490) |
| 0.2 | 8.6 | GO:0097320 | membrane tubulation(GO:0097320) |
| 0.2 | 4.1 | GO:0043983 | histone H4-K12 acetylation(GO:0043983) |
| 0.2 | 4.3 | GO:1901223 | negative regulation of NIK/NF-kappaB signaling(GO:1901223) |
| 0.2 | 2.6 | GO:0031022 | nuclear migration along microfilament(GO:0031022) |
| 0.2 | 3.8 | GO:0010668 | ectodermal cell differentiation(GO:0010668) |
| 0.2 | 2.6 | GO:1901409 | positive regulation of phosphorylation of RNA polymerase II C-terminal domain(GO:1901409) |
| 0.2 | 8.7 | GO:0043551 | regulation of phosphatidylinositol 3-kinase activity(GO:0043551) |
| 0.2 | 0.7 | GO:0071460 | cellular response to cell-matrix adhesion(GO:0071460) |
| 0.2 | 0.9 | GO:0072334 | UDP-galactose transport(GO:0015785) UDP-galactose transmembrane transport(GO:0072334) |
| 0.2 | 1.8 | GO:0032713 | negative regulation of interleukin-4 production(GO:0032713) |
| 0.2 | 9.3 | GO:0006266 | DNA ligation(GO:0006266) |
| 0.2 | 0.9 | GO:0033320 | UDP-D-xylose metabolic process(GO:0033319) UDP-D-xylose biosynthetic process(GO:0033320) |
| 0.2 | 1.9 | GO:0045039 | protein import into mitochondrial inner membrane(GO:0045039) |
| 0.2 | 0.9 | GO:1902528 | regulation of protein linear polyubiquitination(GO:1902528) positive regulation of protein linear polyubiquitination(GO:1902530) |
| 0.2 | 0.8 | GO:0070681 | glutaminyl-tRNAGln biosynthesis via transamidation(GO:0070681) |
| 0.2 | 2.5 | GO:0010606 | positive regulation of cytoplasmic mRNA processing body assembly(GO:0010606) |
| 0.2 | 1.5 | GO:1903376 | neuron intrinsic apoptotic signaling pathway in response to oxidative stress(GO:0036480) regulation of oxidative stress-induced neuron intrinsic apoptotic signaling pathway(GO:1903376) |
| 0.2 | 7.0 | GO:0043101 | purine-containing compound salvage(GO:0043101) |
| 0.2 | 5.5 | GO:1901741 | positive regulation of myoblast fusion(GO:1901741) |
| 0.2 | 1.2 | GO:1902255 | positive regulation of intrinsic apoptotic signaling pathway by p53 class mediator(GO:1902255) |
| 0.2 | 24.4 | GO:0050853 | B cell receptor signaling pathway(GO:0050853) |
| 0.2 | 1.9 | GO:0061042 | vascular wound healing(GO:0061042) |
| 0.2 | 2.6 | GO:0061179 | negative regulation of insulin secretion involved in cellular response to glucose stimulus(GO:0061179) |
| 0.2 | 0.4 | GO:0045084 | positive regulation of interleukin-12 biosynthetic process(GO:0045084) |
| 0.2 | 2.0 | GO:0042989 | sequestering of actin monomers(GO:0042989) |
| 0.2 | 4.6 | GO:0006068 | ethanol catabolic process(GO:0006068) |
| 0.2 | 1.2 | GO:0071477 | hypotonic salinity response(GO:0042539) cellular hypotonic salinity response(GO:0071477) |
| 0.2 | 0.7 | GO:0010585 | glutamine secretion(GO:0010585) L-glutamine import(GO:0036229) L-glutamine import into cell(GO:1903803) |
| 0.2 | 0.5 | GO:0070077 | peptidyl-lysine hydroxylation to 5-hydroxy-L-lysine(GO:0018395) histone arginine demethylation(GO:0070077) histone H3-R2 demethylation(GO:0070078) histone H4-R3 demethylation(GO:0070079) |
| 0.2 | 2.7 | GO:0090154 | positive regulation of sphingolipid biosynthetic process(GO:0090154) positive regulation of ceramide biosynthetic process(GO:2000304) |
| 0.2 | 5.1 | GO:0007202 | activation of phospholipase C activity(GO:0007202) |
| 0.2 | 2.5 | GO:0060670 | branching involved in labyrinthine layer morphogenesis(GO:0060670) |
| 0.2 | 6.0 | GO:0043304 | regulation of mast cell activation involved in immune response(GO:0033006) regulation of mast cell degranulation(GO:0043304) |
| 0.2 | 0.5 | GO:0071314 | negative regulation of epinephrine secretion(GO:0032811) negative regulation of luteinizing hormone secretion(GO:0033685) negative regulation of circadian sleep/wake cycle, REM sleep(GO:0042322) negative regulation of glucagon secretion(GO:0070093) cellular response to cocaine(GO:0071314) |
| 0.2 | 1.4 | GO:0080009 | mRNA methylation(GO:0080009) |
| 0.2 | 4.2 | GO:0006054 | N-acetylneuraminate metabolic process(GO:0006054) |
| 0.2 | 3.4 | GO:0019371 | cyclooxygenase pathway(GO:0019371) |
| 0.2 | 6.0 | GO:0045737 | positive regulation of cyclin-dependent protein serine/threonine kinase activity(GO:0045737) |
| 0.1 | 1.5 | GO:0010792 | DNA double-strand break processing involved in repair via single-strand annealing(GO:0010792) |
| 0.1 | 0.6 | GO:0006393 | termination of mitochondrial transcription(GO:0006393) |
| 0.1 | 2.4 | GO:0021860 | pyramidal neuron development(GO:0021860) |
| 0.1 | 3.6 | GO:0045577 | regulation of B cell differentiation(GO:0045577) |
| 0.1 | 2.1 | GO:0070816 | phosphorylation of RNA polymerase II C-terminal domain(GO:0070816) |
| 0.1 | 1.7 | GO:0048680 | positive regulation of axon regeneration(GO:0048680) |
| 0.1 | 1.1 | GO:0070236 | negative regulation of activation-induced cell death of T cells(GO:0070236) |
| 0.1 | 1.8 | GO:1902857 | positive regulation of nonmotile primary cilium assembly(GO:1902857) |
| 0.1 | 0.4 | GO:0030974 | thiamine pyrophosphate transport(GO:0030974) |
| 0.1 | 1.9 | GO:0080182 | histone H3-K4 trimethylation(GO:0080182) |
| 0.1 | 0.7 | GO:0046963 | 3'-phosphoadenosine 5'-phosphosulfate transport(GO:0046963) 3'-phospho-5'-adenylyl sulfate transmembrane transport(GO:1902559) |
| 0.1 | 2.4 | GO:0032625 | interleukin-21 production(GO:0032625) interleukin-21 secretion(GO:0072619) |
| 0.1 | 0.7 | GO:0097026 | dendritic cell dendrite assembly(GO:0097026) |
| 0.1 | 3.2 | GO:0006488 | dolichol-linked oligosaccharide biosynthetic process(GO:0006488) |
| 0.1 | 1.1 | GO:0060372 | regulation of atrial cardiac muscle cell membrane repolarization(GO:0060372) |
| 0.1 | 1.5 | GO:0032876 | negative regulation of DNA endoreduplication(GO:0032876) |
| 0.1 | 5.0 | GO:0007035 | vacuolar acidification(GO:0007035) |
| 0.1 | 5.7 | GO:0070207 | protein homotrimerization(GO:0070207) |
| 0.1 | 1.4 | GO:0000056 | ribosomal small subunit export from nucleus(GO:0000056) |
| 0.1 | 3.1 | GO:1902187 | negative regulation of viral release from host cell(GO:1902187) |
| 0.1 | 3.1 | GO:0034656 | nucleobase-containing small molecule catabolic process(GO:0034656) |
| 0.1 | 5.6 | GO:0045742 | positive regulation of epidermal growth factor receptor signaling pathway(GO:0045742) |
| 0.1 | 1.5 | GO:0002315 | marginal zone B cell differentiation(GO:0002315) |
| 0.1 | 4.6 | GO:0070206 | protein trimerization(GO:0070206) |
| 0.1 | 0.6 | GO:0060700 | regulation of ribonuclease activity(GO:0060700) |
| 0.1 | 2.0 | GO:0006983 | ER overload response(GO:0006983) |
| 0.1 | 2.5 | GO:0000470 | maturation of LSU-rRNA(GO:0000470) |
| 0.1 | 3.5 | GO:0007176 | regulation of epidermal growth factor-activated receptor activity(GO:0007176) |
| 0.1 | 1.8 | GO:0043402 | glucocorticoid mediated signaling pathway(GO:0043402) |
| 0.1 | 7.4 | GO:0006968 | cellular defense response(GO:0006968) |
| 0.1 | 1.9 | GO:0007220 | Notch receptor processing(GO:0007220) |
| 0.1 | 2.0 | GO:0070544 | histone H3-K36 demethylation(GO:0070544) |
| 0.1 | 7.3 | GO:0018279 | protein N-linked glycosylation via asparagine(GO:0018279) |
| 0.1 | 2.6 | GO:0034162 | toll-like receptor 9 signaling pathway(GO:0034162) |
| 0.1 | 1.8 | GO:0031163 | iron-sulfur cluster assembly(GO:0016226) metallo-sulfur cluster assembly(GO:0031163) |
| 0.1 | 3.5 | GO:0050832 | defense response to fungus(GO:0050832) |
| 0.1 | 2.8 | GO:0090557 | establishment of endothelial intestinal barrier(GO:0090557) |
| 0.1 | 2.0 | GO:0090161 | Golgi ribbon formation(GO:0090161) |
| 0.1 | 5.3 | GO:0051569 | regulation of histone H3-K4 methylation(GO:0051569) |
| 0.1 | 1.2 | GO:0015693 | magnesium ion transport(GO:0015693) |
| 0.1 | 1.2 | GO:0051665 | membrane raft localization(GO:0051665) |
| 0.1 | 8.7 | GO:0070527 | platelet aggregation(GO:0070527) |
| 0.1 | 0.4 | GO:0072709 | cellular response to sorbitol(GO:0072709) |
| 0.1 | 0.7 | GO:0060124 | positive regulation of growth hormone secretion(GO:0060124) |
| 0.1 | 53.4 | GO:0051056 | regulation of small GTPase mediated signal transduction(GO:0051056) |
| 0.1 | 8.0 | GO:0002377 | immunoglobulin production(GO:0002377) |
| 0.1 | 1.4 | GO:0051382 | kinetochore assembly(GO:0051382) |
| 0.1 | 1.5 | GO:0035970 | peptidyl-threonine dephosphorylation(GO:0035970) |
| 0.1 | 0.8 | GO:0006048 | UDP-N-acetylglucosamine biosynthetic process(GO:0006048) amino sugar biosynthetic process(GO:0046349) |
| 0.1 | 0.4 | GO:0000466 | maturation of 5.8S rRNA from tricistronic rRNA transcript (SSU-rRNA, 5.8S rRNA, LSU-rRNA)(GO:0000466) |
| 0.1 | 1.7 | GO:0035162 | embryonic hemopoiesis(GO:0035162) |
| 0.1 | 0.9 | GO:0022417 | protein maturation by protein folding(GO:0022417) |
| 0.1 | 0.1 | GO:1990164 | histone H2A phosphorylation(GO:1990164) |
| 0.1 | 2.6 | GO:1900739 | regulation of protein insertion into mitochondrial membrane involved in apoptotic signaling pathway(GO:1900739) positive regulation of protein insertion into mitochondrial membrane involved in apoptotic signaling pathway(GO:1900740) |
| 0.1 | 3.7 | GO:0007194 | negative regulation of adenylate cyclase activity(GO:0007194) |
| 0.1 | 1.7 | GO:0006020 | inositol metabolic process(GO:0006020) |
| 0.1 | 0.8 | GO:0033314 | mitotic DNA replication checkpoint(GO:0033314) |
| 0.1 | 2.5 | GO:0000732 | strand displacement(GO:0000732) |
| 0.1 | 0.7 | GO:0070995 | NADPH oxidation(GO:0070995) |
| 0.1 | 4.0 | GO:0006953 | acute-phase response(GO:0006953) |
| 0.1 | 0.5 | GO:0006269 | DNA replication, synthesis of RNA primer(GO:0006269) |
| 0.1 | 1.2 | GO:0019388 | galactose catabolic process(GO:0019388) |
| 0.1 | 5.5 | GO:0097192 | signal transduction in absence of ligand(GO:0038034) extrinsic apoptotic signaling pathway in absence of ligand(GO:0097192) |
| 0.1 | 2.7 | GO:0035666 | TRIF-dependent toll-like receptor signaling pathway(GO:0035666) |
| 0.1 | 0.4 | GO:0002933 | lipid hydroxylation(GO:0002933) |
| 0.1 | 0.6 | GO:1901096 | regulation of autophagosome maturation(GO:1901096) |
| 0.1 | 1.9 | GO:0030208 | dermatan sulfate biosynthetic process(GO:0030208) |
| 0.1 | 1.2 | GO:0001829 | trophectodermal cell differentiation(GO:0001829) |
| 0.1 | 1.1 | GO:0097421 | liver regeneration(GO:0097421) |
| 0.1 | 0.2 | GO:0051182 | coenzyme transport(GO:0051182) |
| 0.1 | 9.7 | GO:0002223 | stimulatory C-type lectin receptor signaling pathway(GO:0002223) |
| 0.1 | 0.7 | GO:0034244 | negative regulation of transcription elongation from RNA polymerase II promoter(GO:0034244) |
| 0.1 | 0.7 | GO:0018095 | protein polyglutamylation(GO:0018095) |
| 0.1 | 1.1 | GO:0006388 | tRNA splicing, via endonucleolytic cleavage and ligation(GO:0006388) |
| 0.1 | 0.8 | GO:0015866 | ADP transport(GO:0015866) |
| 0.1 | 0.2 | GO:0042226 | interleukin-6 biosynthetic process(GO:0042226) |
| 0.1 | 0.2 | GO:0000451 | rRNA 2'-O-methylation(GO:0000451) |
| 0.1 | 0.4 | GO:0009804 | coumarin metabolic process(GO:0009804) |
| 0.1 | 0.6 | GO:0070857 | regulation of bile acid biosynthetic process(GO:0070857) |
| 0.1 | 3.4 | GO:0036297 | interstrand cross-link repair(GO:0036297) |
| 0.1 | 0.7 | GO:0090043 | regulation of tubulin deacetylation(GO:0090043) |
| 0.1 | 7.9 | GO:0002819 | regulation of adaptive immune response(GO:0002819) |
| 0.1 | 0.6 | GO:0043981 | histone H4-K5 acetylation(GO:0043981) histone H4-K8 acetylation(GO:0043982) |
| 0.1 | 35.8 | GO:0043547 | positive regulation of GTPase activity(GO:0043547) |
| 0.1 | 0.2 | GO:0061580 | colon epithelial cell migration(GO:0061580) |
| 0.0 | 0.4 | GO:2000010 | positive regulation of protein localization to cell surface(GO:2000010) |
| 0.0 | 1.5 | GO:0008334 | histone mRNA metabolic process(GO:0008334) |
| 0.0 | 0.4 | GO:0006290 | pyrimidine dimer repair(GO:0006290) |
| 0.0 | 0.7 | GO:2000623 | regulation of nuclear-transcribed mRNA catabolic process, nonsense-mediated decay(GO:2000622) negative regulation of nuclear-transcribed mRNA catabolic process, nonsense-mediated decay(GO:2000623) |
| 0.0 | 0.5 | GO:0017182 | peptidyl-diphthamide metabolic process(GO:0017182) peptidyl-diphthamide biosynthetic process from peptidyl-histidine(GO:0017183) |
| 0.0 | 1.4 | GO:0000132 | establishment of mitotic spindle orientation(GO:0000132) |
| 0.0 | 1.8 | GO:0007143 | female meiotic division(GO:0007143) |
| 0.0 | 0.5 | GO:0051152 | positive regulation of smooth muscle cell differentiation(GO:0051152) |
| 0.0 | 1.0 | GO:0016180 | snRNA processing(GO:0016180) |
| 0.0 | 0.4 | GO:0032957 | inositol trisphosphate metabolic process(GO:0032957) |
| 0.0 | 2.9 | GO:0048010 | vascular endothelial growth factor receptor signaling pathway(GO:0048010) |
| 0.0 | 0.1 | GO:1900227 | positive regulation of NLRP3 inflammasome complex assembly(GO:1900227) |
| 0.0 | 2.8 | GO:0060976 | coronary vasculature development(GO:0060976) |
| 0.0 | 0.1 | GO:0060684 | epithelial-mesenchymal cell signaling(GO:0060684) |
| 0.0 | 0.7 | GO:0031297 | replication fork processing(GO:0031297) |
| 0.0 | 1.6 | GO:0006622 | protein targeting to lysosome(GO:0006622) |
| 0.0 | 2.2 | GO:0042255 | ribosome assembly(GO:0042255) |
| 0.0 | 0.4 | GO:0009838 | abscission(GO:0009838) |
| 0.0 | 2.5 | GO:0030071 | regulation of mitotic metaphase/anaphase transition(GO:0030071) |
| 0.0 | 2.9 | GO:0046426 | negative regulation of JAK-STAT cascade(GO:0046426) negative regulation of STAT cascade(GO:1904893) |
| 0.0 | 0.2 | GO:1900246 | positive regulation of RIG-I signaling pathway(GO:1900246) |
| 0.0 | 1.1 | GO:0009435 | NAD biosynthetic process(GO:0009435) |
| 0.0 | 1.1 | GO:0090503 | RNA phosphodiester bond hydrolysis, exonucleolytic(GO:0090503) |
| 0.0 | 2.6 | GO:0010501 | RNA secondary structure unwinding(GO:0010501) |
| 0.0 | 0.1 | GO:0018874 | benzoate metabolic process(GO:0018874) |
| 0.0 | 0.9 | GO:0006853 | carnitine shuttle(GO:0006853) |
| 0.0 | 3.9 | GO:0006890 | retrograde vesicle-mediated transport, Golgi to ER(GO:0006890) |
| 0.0 | 0.7 | GO:0075522 | IRES-dependent viral translational initiation(GO:0075522) |
| 0.0 | 0.3 | GO:0018230 | peptidyl-L-cysteine S-palmitoylation(GO:0018230) peptidyl-S-diacylglycerol-L-cysteine biosynthetic process from peptidyl-cysteine(GO:0018231) |
| 0.0 | 1.6 | GO:0038061 | NIK/NF-kappaB signaling(GO:0038061) |
| 0.0 | 1.4 | GO:0042220 | response to cocaine(GO:0042220) |
| 0.0 | 1.2 | GO:0046427 | positive regulation of JAK-STAT cascade(GO:0046427) positive regulation of STAT cascade(GO:1904894) |
| 0.0 | 0.3 | GO:0035457 | cellular response to interferon-alpha(GO:0035457) |
| 0.0 | 1.9 | GO:0051865 | protein autoubiquitination(GO:0051865) |
| 0.0 | 0.6 | GO:0001522 | pseudouridine synthesis(GO:0001522) |
| 0.0 | 4.3 | GO:1990823 | response to leukemia inhibitory factor(GO:1990823) cellular response to leukemia inhibitory factor(GO:1990830) |
| 0.0 | 0.3 | GO:0090521 | glomerular visceral epithelial cell migration(GO:0090521) |
| 0.0 | 17.1 | GO:0043312 | neutrophil activation involved in immune response(GO:0002283) neutrophil degranulation(GO:0043312) |
| 0.0 | 0.3 | GO:0045023 | G0 to G1 transition(GO:0045023) |
| 0.0 | 0.3 | GO:0061099 | negative regulation of protein tyrosine kinase activity(GO:0061099) |
| 0.0 | 0.8 | GO:0033146 | regulation of intracellular estrogen receptor signaling pathway(GO:0033146) |
| 0.0 | 0.1 | GO:0048627 | myoblast development(GO:0048627) |
| 0.0 | 2.4 | GO:0009060 | aerobic respiration(GO:0009060) |
| 0.0 | 0.2 | GO:0035897 | proteolysis in other organism(GO:0035897) |
| 0.0 | 0.4 | GO:0045722 | positive regulation of gluconeogenesis(GO:0045722) |
| 0.0 | 1.8 | GO:0045071 | negative regulation of viral genome replication(GO:0045071) |
| 0.0 | 0.5 | GO:0000042 | protein targeting to Golgi(GO:0000042) |
| 0.0 | 0.3 | GO:0001682 | tRNA 5'-leader removal(GO:0001682) protein lipoylation(GO:0009249) |
| 0.0 | 0.6 | GO:0030490 | maturation of SSU-rRNA(GO:0030490) |
| 0.0 | 0.5 | GO:0002115 | store-operated calcium entry(GO:0002115) |
| 0.0 | 0.6 | GO:0048026 | positive regulation of mRNA splicing, via spliceosome(GO:0048026) |
| 0.0 | 0.3 | GO:0045636 | positive regulation of melanocyte differentiation(GO:0045636) |
| 0.0 | 0.8 | GO:0003091 | renal water homeostasis(GO:0003091) |
| 0.0 | 0.7 | GO:0060218 | hematopoietic stem cell differentiation(GO:0060218) |
| 0.0 | 0.3 | GO:0051568 | histone H3-K4 methylation(GO:0051568) |
| 0.0 | 1.2 | GO:0045454 | cell redox homeostasis(GO:0045454) |
| 0.0 | 1.3 | GO:1900034 | regulation of cellular response to heat(GO:1900034) |
| 0.0 | 0.5 | GO:0030212 | hyaluronan metabolic process(GO:0030212) |
| 0.0 | 0.4 | GO:0006700 | C21-steroid hormone biosynthetic process(GO:0006700) |
| 0.0 | 0.7 | GO:0015721 | bile acid and bile salt transport(GO:0015721) |
| 0.0 | 0.9 | GO:0048791 | calcium ion-regulated exocytosis of neurotransmitter(GO:0048791) |
Gene overrepresentation in cellular component category:
| Log-likelihood per target | Total log-likelihood | Term | Description |
|---|---|---|---|
| 3.8 | 19.2 | GO:0019815 | B cell receptor complex(GO:0019815) |
| 3.8 | 41.6 | GO:0032010 | phagolysosome(GO:0032010) |
| 3.7 | 11.2 | GO:0030526 | granulocyte macrophage colony-stimulating factor receptor complex(GO:0030526) |
| 3.3 | 13.2 | GO:0005944 | phosphatidylinositol 3-kinase complex, class IB(GO:0005944) |
| 2.9 | 8.6 | GO:0034687 | integrin alphaL-beta2 complex(GO:0034687) |
| 2.7 | 21.9 | GO:0034688 | integrin alphaM-beta2 complex(GO:0034688) |
| 1.9 | 23.1 | GO:0042105 | alpha-beta T cell receptor complex(GO:0042105) |
| 1.9 | 30.1 | GO:0031209 | SCAR complex(GO:0031209) |
| 1.6 | 11.5 | GO:0036021 | endolysosome lumen(GO:0036021) |
| 1.6 | 12.9 | GO:1990682 | CSF1-CSF1R complex(GO:1990682) |
| 1.5 | 17.8 | GO:0046696 | lipopolysaccharide receptor complex(GO:0046696) |
| 1.3 | 3.8 | GO:0016590 | ACF complex(GO:0016590) |
| 1.3 | 8.8 | GO:0020016 | ciliary pocket(GO:0020016) ciliary pocket membrane(GO:0020018) |
| 1.2 | 6.0 | GO:0034669 | integrin alpha4-beta7 complex(GO:0034669) |
| 1.2 | 8.2 | GO:0000788 | nuclear nucleosome(GO:0000788) |
| 1.1 | 6.9 | GO:0043625 | delta DNA polymerase complex(GO:0043625) |
| 1.1 | 3.4 | GO:0032002 | interleukin-28 receptor complex(GO:0032002) |
| 1.1 | 6.4 | GO:1902560 | GMP reductase complex(GO:1902560) |
| 0.8 | 4.2 | GO:0036502 | Derlin-1-VIMP complex(GO:0036502) |
| 0.8 | 2.5 | GO:0031251 | PAN complex(GO:0031251) |
| 0.8 | 20.6 | GO:0031265 | CD95 death-inducing signaling complex(GO:0031265) |
| 0.8 | 19.8 | GO:0016461 | unconventional myosin complex(GO:0016461) |
| 0.8 | 31.4 | GO:0001891 | phagocytic cup(GO:0001891) |
| 0.8 | 3.0 | GO:0071920 | cleavage body(GO:0071920) |
| 0.7 | 7.9 | GO:0043020 | NADPH oxidase complex(GO:0043020) |
| 0.6 | 8.4 | GO:0097136 | Bcl-2 family protein complex(GO:0097136) |
| 0.6 | 7.0 | GO:0016589 | NURF complex(GO:0016589) |
| 0.6 | 14.6 | GO:0031254 | uropod(GO:0001931) cell trailing edge(GO:0031254) |
| 0.6 | 13.3 | GO:0017146 | NMDA selective glutamate receptor complex(GO:0017146) |
| 0.5 | 2.1 | GO:0045323 | interleukin-1 receptor complex(GO:0045323) |
| 0.5 | 9.1 | GO:0090543 | Flemming body(GO:0090543) |
| 0.4 | 4.7 | GO:0042101 | T cell receptor complex(GO:0042101) |
| 0.4 | 9.8 | GO:0005885 | Arp2/3 protein complex(GO:0005885) |
| 0.4 | 47.0 | GO:0101003 | ficolin-1-rich granule membrane(GO:0101003) |
| 0.4 | 3.1 | GO:0070435 | Shc-EGFR complex(GO:0070435) |
| 0.4 | 2.2 | GO:0000220 | vacuolar proton-transporting V-type ATPase, V0 domain(GO:0000220) |
| 0.3 | 1.4 | GO:0071001 | U4/U6 snRNP(GO:0071001) |
| 0.3 | 4.4 | GO:0005577 | fibrinogen complex(GO:0005577) |
| 0.3 | 1.7 | GO:0060053 | neurofilament cytoskeleton(GO:0060053) |
| 0.3 | 1.7 | GO:0070381 | endosome to plasma membrane transport vesicle(GO:0070381) |
| 0.3 | 2.8 | GO:0033179 | proton-transporting V-type ATPase, V0 domain(GO:0033179) |
| 0.3 | 26.4 | GO:0035577 | azurophil granule membrane(GO:0035577) |
| 0.3 | 48.5 | GO:0035578 | azurophil granule lumen(GO:0035578) |
| 0.3 | 10.8 | GO:0042629 | mast cell granule(GO:0042629) |
| 0.3 | 1.4 | GO:0036396 | MIS complex(GO:0036396) mRNA editing complex(GO:0045293) |
| 0.3 | 19.1 | GO:0001772 | immunological synapse(GO:0001772) |
| 0.3 | 1.7 | GO:0032807 | DNA-dependent protein kinase-DNA ligase 4 complex(GO:0005958) DNA ligase IV complex(GO:0032807) |
| 0.3 | 1.9 | GO:0042721 | mitochondrial inner membrane protein insertion complex(GO:0042721) |
| 0.3 | 118.5 | GO:0009897 | external side of plasma membrane(GO:0009897) |
| 0.3 | 0.8 | GO:0005953 | CAAX-protein geranylgeranyltransferase complex(GO:0005953) |
| 0.2 | 1.2 | GO:0005854 | nascent polypeptide-associated complex(GO:0005854) |
| 0.2 | 5.1 | GO:0042588 | zymogen granule(GO:0042588) |
| 0.2 | 11.3 | GO:0031258 | lamellipodium membrane(GO:0031258) |
| 0.2 | 6.3 | GO:0031092 | platelet alpha granule membrane(GO:0031092) |
| 0.2 | 0.4 | GO:0043203 | axon hillock(GO:0043203) |
| 0.2 | 2.1 | GO:0030915 | Smc5-Smc6 complex(GO:0030915) |
| 0.2 | 24.4 | GO:0022625 | cytosolic large ribosomal subunit(GO:0022625) |
| 0.2 | 0.8 | GO:0030956 | glutamyl-tRNA(Gln) amidotransferase complex(GO:0030956) |
| 0.2 | 15.7 | GO:0022627 | cytosolic small ribosomal subunit(GO:0022627) |
| 0.2 | 1.7 | GO:0070971 | endoplasmic reticulum exit site(GO:0070971) |
| 0.2 | 3.7 | GO:0042613 | MHC class II protein complex(GO:0042613) |
| 0.2 | 5.4 | GO:0042627 | chylomicron(GO:0042627) |
| 0.2 | 1.5 | GO:0005683 | U7 snRNP(GO:0005683) |
| 0.2 | 15.7 | GO:0035580 | specific granule lumen(GO:0035580) |
| 0.2 | 3.0 | GO:0072357 | PTW/PP1 phosphatase complex(GO:0072357) |
| 0.2 | 1.5 | GO:0065010 | extracellular membrane-bounded organelle(GO:0065010) |
| 0.2 | 1.1 | GO:0097149 | centralspindlin complex(GO:0097149) |
| 0.2 | 1.1 | GO:0072669 | tRNA-splicing ligase complex(GO:0072669) |
| 0.1 | 2.7 | GO:0032039 | integrator complex(GO:0032039) |
| 0.1 | 19.1 | GO:0031091 | platelet alpha granule(GO:0031091) |
| 0.1 | 8.8 | GO:0031201 | SNARE complex(GO:0031201) |
| 0.1 | 11.0 | GO:0030670 | phagocytic vesicle membrane(GO:0030670) |
| 0.1 | 0.7 | GO:0071006 | U2-type catalytic step 1 spliceosome(GO:0071006) |
| 0.1 | 0.7 | GO:0035032 | phosphatidylinositol 3-kinase complex, class III(GO:0035032) |
| 0.1 | 1.6 | GO:0033269 | internode region of axon(GO:0033269) |
| 0.1 | 1.5 | GO:0042382 | paraspeckles(GO:0042382) |
| 0.1 | 0.4 | GO:0055087 | Ski complex(GO:0055087) |
| 0.1 | 13.6 | GO:0005811 | lipid particle(GO:0005811) |
| 0.1 | 2.2 | GO:0043240 | Fanconi anaemia nuclear complex(GO:0043240) |
| 0.1 | 2.6 | GO:0034992 | microtubule organizing center attachment site(GO:0034992) LINC complex(GO:0034993) |
| 0.1 | 22.8 | GO:0031225 | anchored component of membrane(GO:0031225) |
| 0.1 | 1.3 | GO:0044322 | endoplasmic reticulum quality control compartment(GO:0044322) |
| 0.1 | 1.4 | GO:0008024 | cyclin/CDK positive transcription elongation factor complex(GO:0008024) |
| 0.1 | 1.2 | GO:0098554 | cytoplasmic side of endoplasmic reticulum membrane(GO:0098554) |
| 0.1 | 19.4 | GO:0032587 | ruffle membrane(GO:0032587) |
| 0.1 | 1.6 | GO:0000164 | protein phosphatase type 1 complex(GO:0000164) |
| 0.1 | 3.7 | GO:0030687 | preribosome, large subunit precursor(GO:0030687) |
| 0.1 | 1.4 | GO:0044754 | autolysosome(GO:0044754) |
| 0.1 | 0.7 | GO:1990031 | pinceau fiber(GO:1990031) |
| 0.1 | 1.4 | GO:0005642 | annulate lamellae(GO:0005642) |
| 0.1 | 0.8 | GO:0030688 | preribosome, small subunit precursor(GO:0030688) |
| 0.1 | 0.9 | GO:0034751 | aryl hydrocarbon receptor complex(GO:0034751) |
| 0.1 | 1.5 | GO:0031588 | nucleotide-activated protein kinase complex(GO:0031588) |
| 0.1 | 0.7 | GO:0016514 | SWI/SNF complex(GO:0016514) |
| 0.1 | 0.5 | GO:0043196 | varicosity(GO:0043196) |
| 0.1 | 0.5 | GO:0005658 | alpha DNA polymerase:primase complex(GO:0005658) |
| 0.1 | 6.4 | GO:0005834 | heterotrimeric G-protein complex(GO:0005834) |
| 0.1 | 0.5 | GO:0000801 | central element(GO:0000801) |
| 0.1 | 1.5 | GO:0070938 | contractile ring(GO:0070938) |
| 0.1 | 1.4 | GO:0036057 | filtration diaphragm(GO:0036056) slit diaphragm(GO:0036057) |
| 0.1 | 1.5 | GO:0005662 | DNA replication factor A complex(GO:0005662) |
| 0.1 | 1.2 | GO:0030015 | CCR4-NOT core complex(GO:0030015) |
| 0.1 | 1.4 | GO:0033276 | transcription factor TFTC complex(GO:0033276) |
| 0.1 | 0.7 | GO:1990316 | ATG1/ULK1 kinase complex(GO:1990316) |
| 0.1 | 7.1 | GO:0000777 | condensed chromosome kinetochore(GO:0000777) |
| 0.1 | 11.6 | GO:0016605 | PML body(GO:0016605) |
| 0.1 | 0.2 | GO:0071817 | MMXD complex(GO:0071817) |
| 0.1 | 1.6 | GO:0046540 | U4/U6 x U5 tri-snRNP complex(GO:0046540) |
| 0.1 | 15.5 | GO:0005741 | mitochondrial outer membrane(GO:0005741) |
| 0.1 | 0.7 | GO:0071541 | eukaryotic translation initiation factor 3 complex, eIF3m(GO:0071541) |
| 0.1 | 4.4 | GO:0031234 | extrinsic component of cytoplasmic side of plasma membrane(GO:0031234) |
| 0.1 | 0.4 | GO:0030289 | protein phosphatase 4 complex(GO:0030289) |
| 0.1 | 1.8 | GO:0044665 | MLL1/2 complex(GO:0044665) MLL1 complex(GO:0071339) |
| 0.1 | 1.2 | GO:0035102 | PRC1 complex(GO:0035102) |
| 0.1 | 0.9 | GO:0019897 | extrinsic component of plasma membrane(GO:0019897) |
| 0.1 | 0.7 | GO:0019773 | proteasome core complex, alpha-subunit complex(GO:0019773) |
| 0.1 | 127.7 | GO:0005887 | integral component of plasma membrane(GO:0005887) |
| 0.0 | 19.5 | GO:0031252 | cell leading edge(GO:0031252) |
| 0.0 | 0.8 | GO:0005847 | mRNA cleavage and polyadenylation specificity factor complex(GO:0005847) |
| 0.0 | 11.7 | GO:0098857 | membrane raft(GO:0045121) membrane microdomain(GO:0098857) |
| 0.0 | 0.3 | GO:0000172 | ribonuclease MRP complex(GO:0000172) |
| 0.0 | 1.2 | GO:0005905 | clathrin-coated pit(GO:0005905) |
| 0.0 | 0.2 | GO:0098575 | lumenal side of lysosomal membrane(GO:0098575) |
| 0.0 | 4.0 | GO:0030139 | endocytic vesicle(GO:0030139) |
| 0.0 | 6.4 | GO:0030136 | clathrin-coated vesicle(GO:0030136) |
| 0.0 | 0.9 | GO:0031616 | spindle pole centrosome(GO:0031616) |
| 0.0 | 2.3 | GO:0015030 | Cajal body(GO:0015030) |
| 0.0 | 0.3 | GO:0044666 | MLL3/4 complex(GO:0044666) |
| 0.0 | 1.3 | GO:0005680 | anaphase-promoting complex(GO:0005680) |
| 0.0 | 4.2 | GO:0031902 | late endosome membrane(GO:0031902) |
| 0.0 | 1.2 | GO:0031904 | endosome lumen(GO:0031904) |
| 0.0 | 3.4 | GO:0048770 | melanosome(GO:0042470) pigment granule(GO:0048770) |
| 0.0 | 0.4 | GO:0008250 | oligosaccharyltransferase complex(GO:0008250) |
| 0.0 | 3.4 | GO:0032580 | Golgi cisterna membrane(GO:0032580) |
| 0.0 | 23.2 | GO:0000139 | Golgi membrane(GO:0000139) |
| 0.0 | 0.1 | GO:0005674 | transcription factor TFIIF complex(GO:0005674) |
| 0.0 | 0.2 | GO:0032021 | NELF complex(GO:0032021) |
| 0.0 | 2.4 | GO:0031463 | Cul3-RING ubiquitin ligase complex(GO:0031463) |
| 0.0 | 0.8 | GO:0000159 | protein phosphatase type 2A complex(GO:0000159) |
| 0.0 | 100.9 | GO:0016021 | integral component of membrane(GO:0016021) |
| 0.0 | 0.4 | GO:0055038 | recycling endosome membrane(GO:0055038) |
| 0.0 | 2.6 | GO:0060205 | vesicle lumen(GO:0031983) secretory granule lumen(GO:0034774) cytoplasmic membrane-bounded vesicle lumen(GO:0060205) |
| 0.0 | 0.3 | GO:0010369 | chromocenter(GO:0010369) |
| 0.0 | 7.7 | GO:0000790 | nuclear chromatin(GO:0000790) |
| 0.0 | 0.3 | GO:0000346 | transcription export complex(GO:0000346) |
| 0.0 | 3.5 | GO:0036464 | cytoplasmic ribonucleoprotein granule(GO:0036464) |
| 0.0 | 2.8 | GO:0000922 | spindle pole(GO:0000922) |
| 0.0 | 1.6 | GO:0016363 | nuclear matrix(GO:0016363) |
| 0.0 | 0.3 | GO:0005697 | telomerase holoenzyme complex(GO:0005697) |
| 0.0 | 0.1 | GO:0002199 | zona pellucida receptor complex(GO:0002199) |
| 0.0 | 6.3 | GO:0031410 | cytoplasmic vesicle(GO:0031410) |
Gene overrepresentation in molecular function category:
| Log-likelihood per target | Total log-likelihood | Term | Description |
|---|---|---|---|
| 4.6 | 36.6 | GO:0032396 | inhibitory MHC class I receptor activity(GO:0032396) |
| 4.6 | 18.2 | GO:0017159 | pantetheine hydrolase activity(GO:0017159) |
| 3.3 | 13.4 | GO:0005136 | interleukin-4 receptor binding(GO:0005136) |
| 3.2 | 12.9 | GO:0005011 | macrophage colony-stimulating factor receptor activity(GO:0005011) |
| 3.0 | 15.1 | GO:0043423 | 3-phosphoinositide-dependent protein kinase binding(GO:0043423) |
| 3.0 | 41.6 | GO:0016176 | superoxide-generating NADPH oxidase activator activity(GO:0016176) |
| 2.9 | 20.5 | GO:0097199 | cysteine-type endopeptidase activity involved in apoptotic signaling pathway(GO:0097199) |
| 2.9 | 8.7 | GO:0046935 | 1-phosphatidylinositol-3-kinase regulator activity(GO:0046935) |
| 2.7 | 13.4 | GO:0004914 | interleukin-5 receptor activity(GO:0004914) |
| 2.3 | 23.0 | GO:0005094 | Rho GDP-dissociation inhibitor activity(GO:0005094) |
| 2.1 | 23.5 | GO:0030369 | ICAM-3 receptor activity(GO:0030369) |
| 2.1 | 10.6 | GO:0070180 | large ribosomal subunit rRNA binding(GO:0070180) |
| 2.1 | 10.5 | GO:0004464 | leukotriene-C4 synthase activity(GO:0004464) |
| 1.9 | 13.6 | GO:0016314 | phosphatidylinositol-3,4,5-trisphosphate 3-phosphatase activity(GO:0016314) |
| 1.7 | 30.9 | GO:0019864 | IgG binding(GO:0019864) |
| 1.6 | 13.0 | GO:0016019 | peptidoglycan receptor activity(GO:0016019) |
| 1.5 | 4.6 | GO:0005150 | interleukin-1, Type I receptor binding(GO:0005150) |
| 1.5 | 4.6 | GO:0050405 | [hydroxymethylglutaryl-CoA reductase (NADPH)] kinase activity(GO:0047322) [acetyl-CoA carboxylase] kinase activity(GO:0050405) |
| 1.4 | 7.1 | GO:0031726 | CCR1 chemokine receptor binding(GO:0031726) |
| 1.4 | 5.4 | GO:0042132 | fructose 1,6-bisphosphate 1-phosphatase activity(GO:0042132) |
| 1.3 | 7.7 | GO:0004522 | ribonuclease A activity(GO:0004522) |
| 1.3 | 30.4 | GO:0015174 | basic amino acid transmembrane transporter activity(GO:0015174) |
| 1.2 | 3.7 | GO:0042008 | interleukin-18 receptor activity(GO:0042008) |
| 1.2 | 10.6 | GO:0005497 | androgen binding(GO:0005497) |
| 1.2 | 18.7 | GO:0045236 | CXCR chemokine receptor binding(GO:0045236) |
| 1.2 | 6.9 | GO:0001851 | complement component C3b binding(GO:0001851) |
| 1.1 | 5.5 | GO:0070051 | fibrinogen binding(GO:0070051) |
| 1.1 | 6.4 | GO:0016657 | GMP reductase activity(GO:0003920) oxidoreductase activity, acting on NAD(P)H, nitrogenous group as acceptor(GO:0016657) |
| 1.0 | 8.3 | GO:0004974 | leukotriene receptor activity(GO:0004974) |
| 1.0 | 3.1 | GO:0004730 | pseudouridylate synthase activity(GO:0004730) |
| 1.0 | 18.3 | GO:0008429 | phosphatidylethanolamine binding(GO:0008429) |
| 0.9 | 12.3 | GO:0004875 | complement receptor activity(GO:0004875) |
| 0.9 | 5.4 | GO:0004918 | interleukin-8 receptor activity(GO:0004918) |
| 0.8 | 6.8 | GO:0004873 | asialoglycoprotein receptor activity(GO:0004873) |
| 0.8 | 2.5 | GO:0005139 | interleukin-7 receptor binding(GO:0005139) |
| 0.8 | 4.1 | GO:0001069 | regulatory region RNA binding(GO:0001069) |
| 0.8 | 3.1 | GO:0046921 | glycoprotein 6-alpha-L-fucosyltransferase activity(GO:0008424) alpha-(1->6)-fucosyltransferase activity(GO:0046921) |
| 0.7 | 6.7 | GO:0015057 | thrombin receptor activity(GO:0015057) |
| 0.7 | 18.5 | GO:0008349 | MAP kinase kinase kinase kinase activity(GO:0008349) |
| 0.7 | 6.4 | GO:0004704 | NF-kappaB-inducing kinase activity(GO:0004704) |
| 0.7 | 5.6 | GO:0030229 | very-low-density lipoprotein particle receptor activity(GO:0030229) |
| 0.7 | 3.4 | GO:0048030 | disaccharide binding(GO:0048030) |
| 0.7 | 14.9 | GO:0051400 | BH domain binding(GO:0051400) |
| 0.7 | 5.4 | GO:0005157 | macrophage colony-stimulating factor receptor binding(GO:0005157) |
| 0.7 | 4.7 | GO:0004594 | pantothenate kinase activity(GO:0004594) |
| 0.7 | 3.4 | GO:0004666 | prostaglandin-endoperoxide synthase activity(GO:0004666) |
| 0.7 | 6.0 | GO:1990405 | protein antigen binding(GO:1990405) |
| 0.6 | 2.6 | GO:0042282 | hydroxymethylglutaryl-CoA reductase (NADPH) activity(GO:0004420) hydroxymethylglutaryl-CoA reductase activity(GO:0042282) |
| 0.6 | 7.0 | GO:0016494 | C-X-C chemokine receptor activity(GO:0016494) |
| 0.6 | 16.3 | GO:0045028 | G-protein coupled nucleotide receptor activity(GO:0001608) G-protein coupled purinergic nucleotide receptor activity(GO:0045028) |
| 0.6 | 49.3 | GO:0001784 | phosphotyrosine binding(GO:0001784) |
| 0.6 | 1.8 | GO:0004060 | arylamine N-acetyltransferase activity(GO:0004060) |
| 0.6 | 4.1 | GO:0003827 | alpha-1,3-mannosylglycoprotein 2-beta-N-acetylglucosaminyltransferase activity(GO:0003827) |
| 0.6 | 2.3 | GO:0004949 | cannabinoid receptor activity(GO:0004949) |
| 0.6 | 13.6 | GO:0032036 | myosin heavy chain binding(GO:0032036) |
| 0.5 | 11.8 | GO:0005537 | mannose binding(GO:0005537) |
| 0.5 | 13.5 | GO:0050664 | oxidoreductase activity, acting on NAD(P)H, oxygen as acceptor(GO:0050664) |
| 0.5 | 3.1 | GO:0035800 | deubiquitinase activator activity(GO:0035800) |
| 0.5 | 2.5 | GO:0004910 | interleukin-1, Type II, blocking receptor activity(GO:0004910) |
| 0.5 | 2.9 | GO:0001875 | lipopolysaccharide receptor activity(GO:0001875) |
| 0.5 | 3.4 | GO:0004920 | interleukin-10 receptor activity(GO:0004920) |
| 0.5 | 1.9 | GO:0061628 | H3K27me3 modified histone binding(GO:0061628) |
| 0.5 | 5.6 | GO:0004465 | lipoprotein lipase activity(GO:0004465) |
| 0.5 | 1.9 | GO:0055100 | adiponectin binding(GO:0055100) |
| 0.5 | 3.2 | GO:0008508 | bile acid:sodium symporter activity(GO:0008508) |
| 0.4 | 1.7 | GO:0070012 | oligopeptidase activity(GO:0070012) |
| 0.4 | 4.1 | GO:0003835 | beta-galactoside alpha-2,6-sialyltransferase activity(GO:0003835) |
| 0.4 | 6.0 | GO:0035374 | chondroitin sulfate binding(GO:0035374) |
| 0.4 | 1.2 | GO:0031753 | endothelial differentiation G-protein coupled receptor binding(GO:0031753) Edg-2 lysophosphatidic acid receptor binding(GO:0031755) |
| 0.4 | 1.9 | GO:0047757 | chondroitin-glucuronate 5-epimerase activity(GO:0047757) |
| 0.4 | 3.7 | GO:0016812 | hydrolase activity, acting on carbon-nitrogen (but not peptide) bonds, in cyclic amides(GO:0016812) |
| 0.3 | 5.9 | GO:0015379 | potassium:chloride symporter activity(GO:0015379) potassium ion symporter activity(GO:0022820) |
| 0.3 | 4.8 | GO:0008381 | mechanically-gated ion channel activity(GO:0008381) mechanically gated channel activity(GO:0022833) |
| 0.3 | 2.7 | GO:0060698 | endoribonuclease inhibitor activity(GO:0060698) |
| 0.3 | 1.7 | GO:0035575 | histone demethylase activity (H4-K20 specific)(GO:0035575) |
| 0.3 | 1.0 | GO:0036487 | nitric-oxide synthase inhibitor activity(GO:0036487) |
| 0.3 | 1.0 | GO:0035375 | zymogen binding(GO:0035375) |
| 0.3 | 2.6 | GO:0050815 | phosphoserine binding(GO:0050815) |
| 0.3 | 1.9 | GO:0008518 | reduced folate carrier activity(GO:0008518) |
| 0.3 | 1.6 | GO:0031728 | CCR3 chemokine receptor binding(GO:0031728) |
| 0.3 | 1.5 | GO:0033829 | O-fucosylpeptide 3-beta-N-acetylglucosaminyltransferase activity(GO:0033829) |
| 0.3 | 1.2 | GO:0003974 | UDP-N-acetylglucosamine 4-epimerase activity(GO:0003974) UDP-glucose 4-epimerase activity(GO:0003978) |
| 0.3 | 1.5 | GO:0071208 | histone pre-mRNA DCP binding(GO:0071208) |
| 0.3 | 1.1 | GO:0061769 | ribosylnicotinamide kinase activity(GO:0050262) ribosylnicotinate kinase activity(GO:0061769) |
| 0.3 | 6.5 | GO:0005522 | profilin binding(GO:0005522) |
| 0.3 | 3.9 | GO:0035005 | 1-phosphatidylinositol-4-phosphate 3-kinase activity(GO:0035005) |
| 0.3 | 11.5 | GO:0043394 | proteoglycan binding(GO:0043394) |
| 0.3 | 4.5 | GO:0005149 | interleukin-1 receptor binding(GO:0005149) |
| 0.3 | 0.8 | GO:0033699 | DNA 5'-adenosine monophosphate hydrolase activity(GO:0033699) |
| 0.3 | 0.8 | GO:0004662 | CAAX-protein geranylgeranyltransferase activity(GO:0004662) |
| 0.2 | 2.1 | GO:0008269 | JAK pathway signal transduction adaptor activity(GO:0008269) |
| 0.2 | 60.3 | GO:0003823 | antigen binding(GO:0003823) |
| 0.2 | 1.2 | GO:0016230 | sphingomyelin phosphodiesterase activator activity(GO:0016230) |
| 0.2 | 3.7 | GO:0031821 | G-protein coupled serotonin receptor binding(GO:0031821) |
| 0.2 | 2.8 | GO:0008553 | hydrogen-exporting ATPase activity, phosphorylative mechanism(GO:0008553) |
| 0.2 | 5.5 | GO:0031702 | type 1 angiotensin receptor binding(GO:0031702) |
| 0.2 | 5.1 | GO:0019992 | diacylglycerol binding(GO:0019992) |
| 0.2 | 0.9 | GO:0005459 | UDP-galactose transmembrane transporter activity(GO:0005459) |
| 0.2 | 1.8 | GO:0038051 | glucocorticoid receptor activity(GO:0004883) glucocorticoid-activated RNA polymerase II transcription factor binding transcription factor activity(GO:0038051) |
| 0.2 | 5.1 | GO:0030297 | transmembrane receptor protein tyrosine kinase activator activity(GO:0030297) |
| 0.2 | 1.7 | GO:0032184 | SUMO polymer binding(GO:0032184) |
| 0.2 | 7.3 | GO:0070403 | NAD+ binding(GO:0070403) |
| 0.2 | 0.8 | GO:0050567 | glutaminyl-tRNA synthase (glutamine-hydrolyzing) activity(GO:0050567) |
| 0.2 | 1.5 | GO:0004035 | alkaline phosphatase activity(GO:0004035) |
| 0.2 | 6.5 | GO:0001965 | G-protein alpha-subunit binding(GO:0001965) |
| 0.2 | 1.5 | GO:0017108 | 5'-flap endonuclease activity(GO:0017108) |
| 0.2 | 4.2 | GO:0042288 | MHC class I protein binding(GO:0042288) |
| 0.2 | 7.5 | GO:0008239 | dipeptidyl-peptidase activity(GO:0008239) |
| 0.2 | 6.1 | GO:0003756 | protein disulfide isomerase activity(GO:0003756) intramolecular oxidoreductase activity, transposing S-S bonds(GO:0016864) |
| 0.2 | 5.2 | GO:0043422 | protein kinase B binding(GO:0043422) |
| 0.2 | 1.9 | GO:0001609 | G-protein coupled adenosine receptor activity(GO:0001609) |
| 0.2 | 112.3 | GO:0005096 | GTPase activator activity(GO:0005096) |
| 0.2 | 2.4 | GO:0005005 | transmembrane-ephrin receptor activity(GO:0005005) |
| 0.2 | 6.8 | GO:0005123 | death receptor binding(GO:0005123) |
| 0.2 | 1.3 | GO:0000293 | ferric-chelate reductase activity(GO:0000293) |
| 0.2 | 1.7 | GO:0033857 | diphosphoinositol-pentakisphosphate kinase activity(GO:0033857) |
| 0.2 | 2.1 | GO:0070290 | N-acylphosphatidylethanolamine-specific phospholipase D activity(GO:0070290) |
| 0.2 | 3.0 | GO:0005225 | volume-sensitive anion channel activity(GO:0005225) |
| 0.2 | 2.0 | GO:0070735 | protein-glycine ligase activity(GO:0070735) |
| 0.2 | 0.5 | GO:0033749 | histone demethylase activity (H3-R2 specific)(GO:0033746) histone demethylase activity (H4-R3 specific)(GO:0033749) |
| 0.2 | 6.2 | GO:0003887 | DNA-directed DNA polymerase activity(GO:0003887) |
| 0.2 | 1.2 | GO:0004045 | aminoacyl-tRNA hydrolase activity(GO:0004045) |
| 0.2 | 7.0 | GO:0043539 | protein serine/threonine kinase activator activity(GO:0043539) |
| 0.2 | 4.8 | GO:0043325 | phosphatidylinositol-3,4-bisphosphate binding(GO:0043325) |
| 0.2 | 3.6 | GO:0052629 | phosphatidylinositol-3,5-bisphosphate 3-phosphatase activity(GO:0052629) |
| 0.2 | 0.8 | GO:0070569 | uridylyltransferase activity(GO:0070569) |
| 0.1 | 0.4 | GO:0052835 | inositol tetrakisphosphate 1-kinase activity(GO:0047325) inositol-1,3,4-trisphosphate 6-kinase activity(GO:0052725) inositol-1,3,4-trisphosphate 5-kinase activity(GO:0052726) inositol-1,3,4,5,6-pentakisphosphate 1-phosphatase activity(GO:0052825) inositol-1,3,4,6-tetrakisphosphate 6-phosphatase activity(GO:0052830) inositol-1,3,4,6-tetrakisphosphate 1-phosphatase activity(GO:0052831) inositol-3,4,6-trisphosphate 1-kinase activity(GO:0052835) |
| 0.1 | 1.5 | GO:0030292 | protein tyrosine kinase inhibitor activity(GO:0030292) |
| 0.1 | 3.4 | GO:0003691 | double-stranded telomeric DNA binding(GO:0003691) |
| 0.1 | 4.4 | GO:0030296 | protein tyrosine kinase activator activity(GO:0030296) |
| 0.1 | 8.7 | GO:1990841 | promoter-specific chromatin binding(GO:1990841) |
| 0.1 | 12.0 | GO:0019843 | rRNA binding(GO:0019843) |
| 0.1 | 2.0 | GO:0051864 | histone demethylase activity (H3-K36 specific)(GO:0051864) |
| 0.1 | 1.7 | GO:0032050 | clathrin heavy chain binding(GO:0032050) |
| 0.1 | 0.4 | GO:0090422 | thiamine pyrophosphate transporter activity(GO:0090422) |
| 0.1 | 3.6 | GO:0042056 | chemoattractant activity(GO:0042056) |
| 0.1 | 1.0 | GO:0004301 | epoxide hydrolase activity(GO:0004301) |
| 0.1 | 3.1 | GO:0017110 | nucleoside-diphosphatase activity(GO:0017110) |
| 0.1 | 2.1 | GO:0008353 | RNA polymerase II carboxy-terminal domain kinase activity(GO:0008353) |
| 0.1 | 0.7 | GO:0046964 | 3'-phosphoadenosine 5'-phosphosulfate transmembrane transporter activity(GO:0046964) |
| 0.1 | 0.8 | GO:0089720 | caspase binding(GO:0089720) |
| 0.1 | 7.0 | GO:0005484 | SNAP receptor activity(GO:0005484) |
| 0.1 | 1.4 | GO:0030621 | U4 snRNA binding(GO:0030621) |
| 0.1 | 1.1 | GO:0043426 | MRF binding(GO:0043426) |
| 0.1 | 1.2 | GO:0070740 | tubulin-glutamic acid ligase activity(GO:0070740) |
| 0.1 | 2.0 | GO:0004030 | aldehyde dehydrogenase [NAD(P)+] activity(GO:0004030) |
| 0.1 | 1.6 | GO:0004985 | opioid receptor activity(GO:0004985) |
| 0.1 | 33.3 | GO:0005125 | cytokine activity(GO:0005125) |
| 0.1 | 0.5 | GO:0051431 | corticotropin-releasing hormone receptor 2 binding(GO:0051431) |
| 0.1 | 0.4 | GO:0090541 | MIT domain binding(GO:0090541) |
| 0.1 | 0.7 | GO:0015186 | L-glutamine transmembrane transporter activity(GO:0015186) |
| 0.1 | 0.9 | GO:0042043 | neurexin family protein binding(GO:0042043) |
| 0.1 | 2.8 | GO:0070300 | phosphatidic acid binding(GO:0070300) |
| 0.1 | 0.4 | GO:0061676 | importin-alpha family protein binding(GO:0061676) |
| 0.1 | 2.6 | GO:0004062 | aryl sulfotransferase activity(GO:0004062) |
| 0.1 | 1.6 | GO:0015129 | lactate transmembrane transporter activity(GO:0015129) |
| 0.1 | 1.3 | GO:0035251 | UDP-glucosyltransferase activity(GO:0035251) |
| 0.1 | 2.5 | GO:0005041 | low-density lipoprotein receptor activity(GO:0005041) |
| 0.1 | 2.2 | GO:0036442 | hydrogen-exporting ATPase activity(GO:0036442) ATPase activity, coupled to transmembrane movement of ions, rotational mechanism(GO:0044769) proton-transporting ATPase activity, rotational mechanism(GO:0046961) |
| 0.1 | 1.6 | GO:0004865 | protein serine/threonine phosphatase inhibitor activity(GO:0004865) |
| 0.1 | 9.5 | GO:0016279 | protein-lysine N-methyltransferase activity(GO:0016279) |
| 0.1 | 1.6 | GO:0019911 | structural constituent of myelin sheath(GO:0019911) |
| 0.1 | 5.3 | GO:0017112 | Rab guanyl-nucleotide exchange factor activity(GO:0017112) |
| 0.1 | 1.5 | GO:0017017 | MAP kinase tyrosine/serine/threonine phosphatase activity(GO:0017017) |
| 0.1 | 0.9 | GO:0008607 | phosphorylase kinase regulator activity(GO:0008607) |
| 0.1 | 3.0 | GO:0005001 | transmembrane receptor protein tyrosine phosphatase activity(GO:0005001) transmembrane receptor protein phosphatase activity(GO:0019198) |
| 0.1 | 0.4 | GO:0034875 | oxidoreductase activity, acting on CH or CH2 groups, quinone or similar compound as acceptor(GO:0033695) caffeine oxidase activity(GO:0034875) |
| 0.1 | 5.5 | GO:0043425 | bHLH transcription factor binding(GO:0043425) |
| 0.1 | 0.2 | GO:0070039 | rRNA (guanosine-2'-O-)-methyltransferase activity(GO:0070039) |
| 0.1 | 0.6 | GO:0047623 | AMP deaminase activity(GO:0003876) adenosine-phosphate deaminase activity(GO:0047623) |
| 0.1 | 0.9 | GO:0017162 | aryl hydrocarbon receptor binding(GO:0017162) |
| 0.1 | 1.4 | GO:0010857 | calcium-dependent protein serine/threonine kinase activity(GO:0009931) calcium-dependent protein kinase activity(GO:0010857) |
| 0.1 | 6.4 | GO:0019894 | kinesin binding(GO:0019894) |
| 0.1 | 0.6 | GO:0008889 | glycerophosphodiester phosphodiesterase activity(GO:0008889) |
| 0.1 | 0.6 | GO:0043996 | histone acetyltransferase activity (H4-K5 specific)(GO:0043995) histone acetyltransferase activity (H4-K8 specific)(GO:0043996) histone acetyltransferase activity (H4-K16 specific)(GO:0046972) |
| 0.1 | 6.3 | GO:0001618 | virus receptor activity(GO:0001618) |
| 0.1 | 1.4 | GO:0032813 | tumor necrosis factor receptor superfamily binding(GO:0032813) |
| 0.1 | 29.7 | GO:0030246 | carbohydrate binding(GO:0030246) |
| 0.1 | 1.8 | GO:0070006 | metalloaminopeptidase activity(GO:0070006) |
| 0.1 | 2.3 | GO:0030676 | Rac guanyl-nucleotide exchange factor activity(GO:0030676) |
| 0.1 | 12.6 | GO:0005178 | integrin binding(GO:0005178) |
| 0.1 | 1.1 | GO:0004303 | estradiol 17-beta-dehydrogenase activity(GO:0004303) |
| 0.1 | 0.8 | GO:0015217 | adenine nucleotide transmembrane transporter activity(GO:0000295) purine ribonucleotide transmembrane transporter activity(GO:0005346) ATP transmembrane transporter activity(GO:0005347) ADP transmembrane transporter activity(GO:0015217) |
| 0.1 | 4.9 | GO:0001205 | transcriptional activator activity, RNA polymerase II distal enhancer sequence-specific binding(GO:0001205) |
| 0.1 | 0.2 | GO:0016420 | [acyl-carrier-protein] S-malonyltransferase activity(GO:0004314) S-malonyltransferase activity(GO:0016419) malonyltransferase activity(GO:0016420) |
| 0.1 | 2.0 | GO:0003785 | actin monomer binding(GO:0003785) |
| 0.1 | 19.9 | GO:0005516 | calmodulin binding(GO:0005516) |
| 0.1 | 2.8 | GO:0008536 | Ran GTPase binding(GO:0008536) |
| 0.1 | 1.2 | GO:0015095 | magnesium ion transmembrane transporter activity(GO:0015095) |
| 0.1 | 1.1 | GO:0086008 | voltage-gated potassium channel activity involved in cardiac muscle cell action potential repolarization(GO:0086008) |
| 0.1 | 3.3 | GO:0004715 | non-membrane spanning protein tyrosine kinase activity(GO:0004715) |
| 0.0 | 7.0 | GO:1901981 | phosphatidylinositol phosphate binding(GO:1901981) |
| 0.0 | 0.5 | GO:0015279 | store-operated calcium channel activity(GO:0015279) |
| 0.0 | 1.2 | GO:0070182 | DNA polymerase binding(GO:0070182) |
| 0.0 | 1.2 | GO:0046875 | ephrin receptor binding(GO:0046875) |
| 0.0 | 0.9 | GO:0004065 | arylsulfatase activity(GO:0004065) |
| 0.0 | 23.6 | GO:0005525 | GTP binding(GO:0005525) |
| 0.0 | 0.4 | GO:0004983 | neuropeptide Y receptor activity(GO:0004983) |
| 0.0 | 3.0 | GO:0061733 | peptide-lysine-N-acetyltransferase activity(GO:0061733) |
| 0.0 | 0.6 | GO:0001730 | 2'-5'-oligoadenylate synthetase activity(GO:0001730) |
| 0.0 | 30.8 | GO:0001228 | transcriptional activator activity, RNA polymerase II transcription regulatory region sequence-specific binding(GO:0001228) |
| 0.0 | 2.2 | GO:0071889 | 14-3-3 protein binding(GO:0071889) |
| 0.0 | 0.3 | GO:0004366 | glycerol-3-phosphate O-acyltransferase activity(GO:0004366) |
| 0.0 | 0.6 | GO:0009982 | pseudouridine synthase activity(GO:0009982) |
| 0.0 | 1.9 | GO:0000175 | 3'-5'-exoribonuclease activity(GO:0000175) |
| 0.0 | 0.5 | GO:0001075 | transcription factor activity, RNA polymerase II core promoter sequence-specific binding involved in preinitiation complex assembly(GO:0001075) |
| 0.0 | 0.2 | GO:0017153 | sodium:dicarboxylate symporter activity(GO:0017153) |
| 0.0 | 4.9 | GO:0001085 | RNA polymerase II transcription factor binding(GO:0001085) |
| 0.0 | 1.7 | GO:0070840 | dynein complex binding(GO:0070840) |
| 0.0 | 0.1 | GO:0008761 | UDP-N-acetylglucosamine 2-epimerase activity(GO:0008761) N-acylmannosamine kinase activity(GO:0009384) |
| 0.0 | 0.9 | GO:0043495 | protein anchor(GO:0043495) |
| 0.0 | 0.4 | GO:0004579 | oligosaccharyl transferase activity(GO:0004576) dolichyl-diphosphooligosaccharide-protein glycotransferase activity(GO:0004579) |
| 0.0 | 0.2 | GO:0004966 | galanin receptor activity(GO:0004966) |
| 0.0 | 1.0 | GO:0008395 | steroid hydroxylase activity(GO:0008395) |
| 0.0 | 1.1 | GO:0019706 | protein-cysteine S-palmitoyltransferase activity(GO:0019706) protein-cysteine S-acyltransferase activity(GO:0019707) |
| 0.0 | 0.9 | GO:0043027 | cysteine-type endopeptidase inhibitor activity involved in apoptotic process(GO:0043027) |
| 0.0 | 6.8 | GO:0051015 | actin filament binding(GO:0051015) |
| 0.0 | 1.5 | GO:0050681 | androgen receptor binding(GO:0050681) |
| 0.0 | 1.5 | GO:0033558 | histone deacetylase activity(GO:0004407) protein deacetylase activity(GO:0033558) |
| 0.0 | 0.7 | GO:0000980 | RNA polymerase II distal enhancer sequence-specific DNA binding(GO:0000980) |
| 0.0 | 1.0 | GO:0051219 | phosphoprotein binding(GO:0051219) |
| 0.0 | 0.3 | GO:0004526 | ribonuclease P activity(GO:0004526) |
| 0.0 | 5.0 | GO:0008022 | protein C-terminus binding(GO:0008022) |
| 0.0 | 8.4 | GO:0005085 | guanyl-nucleotide exchange factor activity(GO:0005085) |
| 0.0 | 0.2 | GO:0008517 | folic acid transporter activity(GO:0008517) |
| 0.0 | 31.8 | GO:0060089 | receptor activity(GO:0004872) molecular transducer activity(GO:0060089) |
| 0.0 | 0.3 | GO:0008179 | adenylate cyclase binding(GO:0008179) |
| 0.0 | 0.9 | GO:0051539 | 4 iron, 4 sulfur cluster binding(GO:0051539) |
| 0.0 | 1.2 | GO:0001046 | core promoter sequence-specific DNA binding(GO:0001046) |
| 0.0 | 0.6 | GO:0051959 | dynein light intermediate chain binding(GO:0051959) |
| 0.0 | 0.7 | GO:0004033 | aldo-keto reductase (NADP) activity(GO:0004033) |
| 0.0 | 3.6 | GO:0004518 | nuclease activity(GO:0004518) |
| 0.0 | 0.1 | GO:0031681 | G-protein beta-subunit binding(GO:0031681) |
| 0.0 | 0.2 | GO:0001206 | transcriptional repressor activity, RNA polymerase II distal enhancer sequence-specific binding(GO:0001206) |
| 0.0 | 0.1 | GO:0035184 | histone threonine kinase activity(GO:0035184) |
| 0.0 | 0.7 | GO:0004713 | protein tyrosine kinase activity(GO:0004713) |
| 0.0 | 0.2 | GO:0019789 | SUMO transferase activity(GO:0019789) |
Gene overrepresentation in curated gene sets: canonical pathways category:
| Log-likelihood per target | Total log-likelihood | Term | Description |
|---|---|---|---|
| 1.2 | 4.9 | SA G1 AND S PHASES | Cdk2, 4, and 6 bind cyclin D in G1, while cdk2/cyclin E promotes the G1/S transition. |
| 0.9 | 60.3 | PID INTEGRIN2 PATHWAY | Beta2 integrin cell surface interactions |
| 0.6 | 14.1 | PID ANTHRAX PATHWAY | Cellular roles of Anthrax toxin |
| 0.6 | 84.0 | PID BCR 5PATHWAY | BCR signaling pathway |
| 0.6 | 21.9 | SA FAS SIGNALING | The TNF-type receptor Fas induces apoptosis on ligand binding. |
| 0.6 | 19.9 | PID TOLL ENDOGENOUS PATHWAY | Endogenous TLR signaling |
| 0.5 | 7.1 | SA B CELL RECEPTOR COMPLEXES | Antigen binding to B cell receptors activates protein tyrosine kinases, such as the Src family, which ultimate activate MAP kinases. |
| 0.5 | 58.5 | PID RAC1 PATHWAY | RAC1 signaling pathway |
| 0.5 | 15.0 | SA PTEN PATHWAY | PTEN is a tumor suppressor that dephosphorylates the lipid messenger phosphatidylinositol triphosphate. |
| 0.4 | 6.4 | PID IL5 PATHWAY | IL5-mediated signaling events |
| 0.4 | 8.4 | SA PROGRAMMED CELL DEATH | Programmed cell death, or apoptosis, eliminates damaged or unneeded cells. |
| 0.4 | 25.3 | PID IL8 CXCR2 PATHWAY | IL8- and CXCR2-mediated signaling events |
| 0.4 | 17.9 | PID IL12 STAT4 PATHWAY | IL12 signaling mediated by STAT4 |
| 0.3 | 13.6 | SA MMP CYTOKINE CONNECTION | Cytokines can induce activation of matrix metalloproteinases, which degrade extracellular matrix. |
| 0.3 | 6.0 | PID LYMPH ANGIOGENESIS PATHWAY | VEGFR3 signaling in lymphatic endothelium |
| 0.3 | 19.3 | PID PTP1B PATHWAY | Signaling events mediated by PTP1B |
| 0.3 | 11.1 | PID EPHA FWDPATHWAY | EPHA forward signaling |
| 0.3 | 10.7 | PID CXCR3 PATHWAY | CXCR3-mediated signaling events |
| 0.3 | 13.0 | PID P38 MK2 PATHWAY | p38 signaling mediated by MAPKAP kinases |
| 0.3 | 6.5 | PID IL2 STAT5 PATHWAY | IL2 signaling events mediated by STAT5 |
| 0.2 | 31.9 | PID RHOA REG PATHWAY | Regulation of RhoA activity |
| 0.2 | 7.7 | PID FCER1 PATHWAY | Fc-epsilon receptor I signaling in mast cells |
| 0.2 | 10.1 | PID IL6 7 PATHWAY | IL6-mediated signaling events |
| 0.2 | 9.3 | PID UPA UPAR PATHWAY | Urokinase-type plasminogen activator (uPA) and uPAR-mediated signaling |
| 0.2 | 12.0 | PID KIT PATHWAY | Signaling events mediated by Stem cell factor receptor (c-Kit) |
| 0.2 | 3.7 | PID IL2 1PATHWAY | IL2-mediated signaling events |
| 0.2 | 3.2 | PID IL2 PI3K PATHWAY | IL2 signaling events mediated by PI3K |
| 0.2 | 8.9 | PID IL4 2PATHWAY | IL4-mediated signaling events |
| 0.1 | 1.6 | PID AVB3 OPN PATHWAY | Osteopontin-mediated events |
| 0.1 | 4.9 | PID IL1 PATHWAY | IL1-mediated signaling events |
| 0.1 | 6.4 | PID INTEGRIN3 PATHWAY | Beta3 integrin cell surface interactions |
| 0.1 | 4.3 | PID IL12 2PATHWAY | IL12-mediated signaling events |
| 0.1 | 6.4 | PID ENDOTHELIN PATHWAY | Endothelins |
| 0.1 | 6.5 | PID CXCR4 PATHWAY | CXCR4-mediated signaling events |
| 0.1 | 5.1 | PID GLYPICAN 1PATHWAY | Glypican 1 network |
| 0.1 | 5.1 | PID RAS PATHWAY | Regulation of Ras family activation |
| 0.1 | 2.4 | PID DNA PK PATHWAY | DNA-PK pathway in nonhomologous end joining |
| 0.1 | 4.6 | PID P38 ALPHA BETA DOWNSTREAM PATHWAY | Signaling mediated by p38-alpha and p38-beta |
| 0.1 | 0.9 | SA CASPASE CASCADE | Apoptosis is mediated by caspases, cysteine proteases arranged in a proteolytic cascade. |
| 0.1 | 1.9 | PID SYNDECAN 3 PATHWAY | Syndecan-3-mediated signaling events |
| 0.1 | 2.8 | PID SYNDECAN 4 PATHWAY | Syndecan-4-mediated signaling events |
| 0.1 | 4.6 | PID FANCONI PATHWAY | Fanconi anemia pathway |
| 0.1 | 3.7 | PID VEGFR1 2 PATHWAY | Signaling events mediated by VEGFR1 and VEGFR2 |
| 0.1 | 1.5 | PID CIRCADIAN PATHWAY | Circadian rhythm pathway |
| 0.1 | 1.4 | PID RANBP2 PATHWAY | Sumoylation by RanBP2 regulates transcriptional repression |
| 0.1 | 23.6 | NABA SECRETED FACTORS | Genes encoding secreted soluble factors |
| 0.1 | 1.2 | PID P38 ALPHA BETA PATHWAY | Regulation of p38-alpha and p38-beta |
| 0.1 | 6.0 | PID SMAD2 3NUCLEAR PATHWAY | Regulation of nuclear SMAD2/3 signaling |
| 0.1 | 4.0 | PID P53 REGULATION PATHWAY | p53 pathway |
| 0.0 | 1.2 | ST TUMOR NECROSIS FACTOR PATHWAY | Tumor Necrosis Factor Pathway. |
| 0.0 | 1.7 | PID LIS1 PATHWAY | Lissencephaly gene (LIS1) in neuronal migration and development |
| 0.0 | 1.5 | PID ATF2 PATHWAY | ATF-2 transcription factor network |
| 0.0 | 1.8 | PID AP1 PATHWAY | AP-1 transcription factor network |
| 0.0 | 1.3 | PID INTEGRIN A4B1 PATHWAY | Alpha4 beta1 integrin signaling events |
| 0.0 | 2.0 | PID PLK1 PATHWAY | PLK1 signaling events |
| 0.0 | 3.9 | PID P53 DOWNSTREAM PATHWAY | Direct p53 effectors |
| 0.0 | 2.1 | PID AR PATHWAY | Coregulation of Androgen receptor activity |
| 0.0 | 0.5 | PID BARD1 PATHWAY | BARD1 signaling events |
| 0.0 | 0.5 | PID RB 1PATHWAY | Regulation of retinoblastoma protein |
Gene overrepresentation in curated gene sets: REACTOME pathways category:
| Log-likelihood per target | Total log-likelihood | Term | Description |
|---|---|---|---|
| 1.3 | 54.6 | REACTOME SIGNAL REGULATORY PROTEIN SIRP FAMILY INTERACTIONS | Genes involved in Signal regulatory protein (SIRP) family interactions |
| 1.2 | 13.2 | REACTOME ENDOSOMAL VACUOLAR PATHWAY | Genes involved in Endosomal/Vacuolar pathway |
| 0.9 | 104.0 | REACTOME IMMUNOREGULATORY INTERACTIONS BETWEEN A LYMPHOID AND A NON LYMPHOID CELL | Genes involved in Immunoregulatory interactions between a Lymphoid and a non-Lymphoid cell |
| 0.9 | 22.7 | REACTOME ACTIVATION OF IRF3 IRF7 MEDIATED BY TBK1 IKK EPSILON | Genes involved in Activation of IRF3/IRF7 mediated by TBK1/IKK epsilon |
| 0.7 | 18.4 | REACTOME NFKB ACTIVATION THROUGH FADD RIP1 PATHWAY MEDIATED BY CASPASE 8 AND10 | Genes involved in NF-kB activation through FADD/RIP-1 pathway mediated by caspase-8 and -10 |
| 0.7 | 16.3 | REACTOME P2Y RECEPTORS | Genes involved in P2Y receptors |
| 0.7 | 39.3 | REACTOME LATENT INFECTION OF HOMO SAPIENS WITH MYCOBACTERIUM TUBERCULOSIS | Genes involved in Latent infection of Homo sapiens with Mycobacterium tuberculosis |
| 0.6 | 16.7 | REACTOME CD28 DEPENDENT VAV1 PATHWAY | Genes involved in CD28 dependent Vav1 pathway |
| 0.6 | 6.3 | REACTOME PECAM1 INTERACTIONS | Genes involved in PECAM1 interactions |
| 0.6 | 6.7 | REACTOME PLATELET ADHESION TO EXPOSED COLLAGEN | Genes involved in Platelet Adhesion to exposed collagen |
| 0.6 | 33.7 | REACTOME BASIGIN INTERACTIONS | Genes involved in Basigin interactions |
| 0.5 | 10.2 | REACTOME GRB2 SOS PROVIDES LINKAGE TO MAPK SIGNALING FOR INTERGRINS | Genes involved in GRB2:SOS provides linkage to MAPK signaling for Intergrins |
| 0.5 | 7.7 | REACTOME REMOVAL OF THE FLAP INTERMEDIATE FROM THE C STRAND | Genes involved in Removal of the Flap Intermediate from the C-strand |
| 0.5 | 30.2 | REACTOME GPVI MEDIATED ACTIVATION CASCADE | Genes involved in GPVI-mediated activation cascade |
| 0.4 | 9.0 | REACTOME THE NLRP3 INFLAMMASOME | Genes involved in The NLRP3 inflammasome |
| 0.4 | 12.9 | REACTOME ACTIVATION OF BH3 ONLY PROTEINS | Genes involved in Activation of BH3-only proteins |
| 0.4 | 24.5 | REACTOME CELL SURFACE INTERACTIONS AT THE VASCULAR WALL | Genes involved in Cell surface interactions at the vascular wall |
| 0.4 | 3.8 | REACTOME REGULATION OF KIT SIGNALING | Genes involved in Regulation of KIT signaling |
| 0.4 | 13.4 | REACTOME IL RECEPTOR SHC SIGNALING | Genes involved in Interleukin receptor SHC signaling |
| 0.4 | 6.1 | REACTOME IL 7 SIGNALING | Genes involved in Interleukin-7 signaling |
| 0.4 | 2.3 | REACTOME COMMON PATHWAY | Genes involved in Common Pathway |
| 0.4 | 8.3 | REACTOME EICOSANOID LIGAND BINDING RECEPTORS | Genes involved in Eicosanoid ligand-binding receptors |
| 0.4 | 10.2 | REACTOME GENERATION OF SECOND MESSENGER MOLECULES | Genes involved in Generation of second messenger molecules |
| 0.4 | 12.1 | REACTOME ANTIGEN ACTIVATES B CELL RECEPTOR LEADING TO GENERATION OF SECOND MESSENGERS | Genes involved in Antigen Activates B Cell Receptor Leading to Generation of Second Messengers |
| 0.4 | 3.2 | REACTOME TRAF6 MEDIATED IRF7 ACTIVATION | Genes involved in TRAF6 mediated IRF7 activation |
| 0.3 | 26.5 | REACTOME CHEMOKINE RECEPTORS BIND CHEMOKINES | Genes involved in Chemokine receptors bind chemokines |
| 0.3 | 6.9 | REACTOME VITAMIN B5 PANTOTHENATE METABOLISM | Genes involved in Vitamin B5 (pantothenate) metabolism |
| 0.3 | 2.5 | REACTOME IRAK1 RECRUITS IKK COMPLEX | Genes involved in IRAK1 recruits IKK complex |
| 0.3 | 46.0 | REACTOME PEPTIDE CHAIN ELONGATION | Genes involved in Peptide chain elongation |
| 0.3 | 7.0 | REACTOME PURINE SALVAGE | Genes involved in Purine salvage |
| 0.2 | 74.7 | REACTOME SIGNALING BY RHO GTPASES | Genes involved in Signaling by Rho GTPases |
| 0.2 | 7.0 | REACTOME PROTEOLYTIC CLEAVAGE OF SNARE COMPLEX PROTEINS | Genes involved in Proteolytic cleavage of SNARE complex proteins |
| 0.2 | 1.4 | REACTOME SPRY REGULATION OF FGF SIGNALING | Genes involved in Spry regulation of FGF signaling |
| 0.2 | 3.3 | REACTOME TRYPTOPHAN CATABOLISM | Genes involved in Tryptophan catabolism |
| 0.2 | 23.1 | REACTOME INTERFERON ALPHA BETA SIGNALING | Genes involved in Interferon alpha/beta signaling |
| 0.2 | 5.0 | REACTOME IL 3 5 AND GM CSF SIGNALING | Genes involved in Interleukin-3, 5 and GM-CSF signaling |
| 0.2 | 3.3 | REACTOME SIGNALING BY SCF KIT | Genes involved in Signaling by SCF-KIT |
| 0.2 | 6.9 | REACTOME ENDOSOMAL SORTING COMPLEX REQUIRED FOR TRANSPORT ESCRT | Genes involved in Endosomal Sorting Complex Required For Transport (ESCRT) |
| 0.2 | 7.2 | REACTOME N GLYCAN ANTENNAE ELONGATION IN THE MEDIAL TRANS GOLGI | Genes involved in N-glycan antennae elongation in the medial/trans-Golgi |
| 0.2 | 1.9 | REACTOME NUCLEOTIDE LIKE PURINERGIC RECEPTORS | Genes involved in Nucleotide-like (purinergic) receptors |
| 0.2 | 6.4 | REACTOME SIGNALING BY HIPPO | Genes involved in Signaling by Hippo |
| 0.2 | 36.0 | REACTOME G ALPHA I SIGNALLING EVENTS | Genes involved in G alpha (i) signalling events |
| 0.1 | 1.9 | REACTOME NRIF SIGNALS CELL DEATH FROM THE NUCLEUS | Genes involved in NRIF signals cell death from the nucleus |
| 0.1 | 5.1 | REACTOME SHC1 EVENTS IN ERBB4 SIGNALING | Genes involved in SHC1 events in ERBB4 signaling |
| 0.1 | 8.6 | REACTOME IL1 SIGNALING | Genes involved in Interleukin-1 signaling |
| 0.1 | 1.4 | REACTOME SYNTHESIS OF PIPS AT THE LATE ENDOSOME MEMBRANE | Genes involved in Synthesis of PIPs at the late endosome membrane |
| 0.1 | 2.3 | REACTOME INTRINSIC PATHWAY | Genes involved in Intrinsic Pathway |
| 0.1 | 4.7 | REACTOME NEPHRIN INTERACTIONS | Genes involved in Nephrin interactions |
| 0.1 | 3.5 | REACTOME PROCESSING OF INTRONLESS PRE MRNAS | Genes involved in Processing of Intronless Pre-mRNAs |
| 0.1 | 1.6 | REACTOME CD28 DEPENDENT PI3K AKT SIGNALING | Genes involved in CD28 dependent PI3K/Akt signaling |
| 0.1 | 1.5 | REACTOME PROCESSING OF CAPPED INTRONLESS PRE MRNA | Genes involved in Processing of Capped Intronless Pre-mRNA |
| 0.1 | 18.1 | REACTOME CLASS A1 RHODOPSIN LIKE RECEPTORS | Genes involved in Class A/1 (Rhodopsin-like receptors) |
| 0.1 | 3.2 | REACTOME SYNTHESIS OF PIPS AT THE GOLGI MEMBRANE | Genes involved in Synthesis of PIPs at the Golgi membrane |
| 0.1 | 3.2 | REACTOME TRANSPORT TO THE GOLGI AND SUBSEQUENT MODIFICATION | Genes involved in Transport to the Golgi and subsequent modification |
| 0.1 | 1.5 | REACTOME DOWNSTREAM TCR SIGNALING | Genes involved in Downstream TCR signaling |
| 0.1 | 1.7 | REACTOME INTEGRATION OF PROVIRUS | Genes involved in Integration of provirus |
| 0.1 | 2.6 | REACTOME CYTOSOLIC SULFONATION OF SMALL MOLECULES | Genes involved in Cytosolic sulfonation of small molecules |
| 0.1 | 2.7 | REACTOME FANCONI ANEMIA PATHWAY | Genes involved in Fanconi Anemia pathway |
| 0.1 | 2.2 | REACTOME MRNA DECAY BY 5 TO 3 EXORIBONUCLEASE | Genes involved in mRNA Decay by 5' to 3' Exoribonuclease |
| 0.1 | 1.1 | REACTOME COPI MEDIATED TRANSPORT | Genes involved in COPI Mediated Transport |
| 0.1 | 4.2 | REACTOME LYSOSOME VESICLE BIOGENESIS | Genes involved in Lysosome Vesicle Biogenesis |
| 0.1 | 0.2 | REACTOME ACTIVATED TAK1 MEDIATES P38 MAPK ACTIVATION | Genes involved in activated TAK1 mediates p38 MAPK activation |
| 0.1 | 2.1 | REACTOME ORGANIC CATION ANION ZWITTERION TRANSPORT | Genes involved in Organic cation/anion/zwitterion transport |
| 0.1 | 13.3 | REACTOME FACTORS INVOLVED IN MEGAKARYOCYTE DEVELOPMENT AND PLATELET PRODUCTION | Genes involved in Factors involved in megakaryocyte development and platelet production |
| 0.1 | 1.5 | REACTOME REGULATION OF RHEB GTPASE ACTIVITY BY AMPK | Genes involved in Regulation of Rheb GTPase activity by AMPK |
| 0.1 | 4.6 | REACTOME MEIOTIC SYNAPSIS | Genes involved in Meiotic Synapsis |
| 0.1 | 0.5 | REACTOME PROCESSIVE SYNTHESIS ON THE LAGGING STRAND | Genes involved in Processive synthesis on the lagging strand |
| 0.1 | 0.8 | REACTOME REGULATION OF WATER BALANCE BY RENAL AQUAPORINS | Genes involved in Regulation of Water Balance by Renal Aquaporins |
| 0.1 | 5.8 | REACTOME RESPONSE TO ELEVATED PLATELET CYTOSOLIC CA2 | Genes involved in Response to elevated platelet cytosolic Ca2+ |
| 0.0 | 1.2 | REACTOME P38MAPK EVENTS | Genes involved in p38MAPK events |
| 0.0 | 0.9 | REACTOME THE ACTIVATION OF ARYLSULFATASES | Genes involved in The activation of arylsulfatases |
| 0.0 | 1.5 | REACTOME PRE NOTCH PROCESSING IN GOLGI | Genes involved in Pre-NOTCH Processing in Golgi |
| 0.0 | 0.8 | REACTOME XENOBIOTICS | Genes involved in Xenobiotics |
| 0.0 | 1.3 | REACTOME PHOSPHORYLATION OF THE APC C | Genes involved in Phosphorylation of the APC/C |
| 0.0 | 1.5 | REACTOME MRNA SPLICING MINOR PATHWAY | Genes involved in mRNA Splicing - Minor Pathway |
| 0.0 | 0.6 | REACTOME ENDOGENOUS STEROLS | Genes involved in Endogenous sterols |
| 0.0 | 4.1 | REACTOME TRANSCRIPTIONAL REGULATION OF WHITE ADIPOCYTE DIFFERENTIATION | Genes involved in Transcriptional Regulation of White Adipocyte Differentiation |
| 0.0 | 1.9 | REACTOME PHASE1 FUNCTIONALIZATION OF COMPOUNDS | Genes involved in Phase 1 - Functionalization of compounds |
| 0.0 | 1.4 | REACTOME DOWNREGULATION OF TGF BETA RECEPTOR SIGNALING | Genes involved in Downregulation of TGF-beta receptor signaling |
| 0.0 | 2.8 | REACTOME TOLL RECEPTOR CASCADES | Genes involved in Toll Receptor Cascades |
| 0.0 | 1.2 | REACTOME DEADENYLATION OF MRNA | Genes involved in Deadenylation of mRNA |
| 0.0 | 1.9 | REACTOME CHONDROITIN SULFATE DERMATAN SULFATE METABOLISM | Genes involved in Chondroitin sulfate/dermatan sulfate metabolism |
| 0.0 | 0.8 | REACTOME CHOLESTEROL BIOSYNTHESIS | Genes involved in Cholesterol biosynthesis |
| 0.0 | 2.3 | REACTOME NUCLEAR RECEPTOR TRANSCRIPTION PATHWAY | Genes involved in Nuclear Receptor transcription pathway |
| 0.0 | 0.9 | REACTOME TRANSPORT OF VITAMINS NUCLEOSIDES AND RELATED MOLECULES | Genes involved in Transport of vitamins, nucleosides, and related molecules |
| 0.0 | 1.0 | REACTOME GLUCONEOGENESIS | Genes involved in Gluconeogenesis |
| 0.0 | 0.2 | REACTOME BILE SALT AND ORGANIC ANION SLC TRANSPORTERS | Genes involved in Bile salt and organic anion SLC transporters |
| 0.0 | 0.7 | REACTOME ACTIVATION OF CHAPERONE GENES BY XBP1S | Genes involved in Activation of Chaperone Genes by XBP1(S) |