|
chr19_-_45322867
Show fit
|
57.00 |
ENST00000221476.4
|
CKM
|
creatine kinase, M-type
|
|
chr15_-_34795541
Show fit
|
44.24 |
ENST00000290378.6
|
ACTC1
|
actin alpha cardiac muscle 1
|
|
chr1_-_229434086
Show fit
|
37.31 |
ENST00000366684.7
ENST00000684723.1
ENST00000366683.4
|
ACTA1
|
actin alpha 1, skeletal muscle
|
|
chr20_+_36541484
Show fit
|
34.33 |
ENST00000346786.2
|
MYL9
|
myosin light chain 9
|
|
chr20_+_36541511
Show fit
|
34.06 |
ENST00000279022.7
|
MYL9
|
myosin light chain 9
|
|
chr2_+_73892967
Show fit
|
32.07 |
ENST00000409731.7
ENST00000409918.5
ENST00000442912.5
ENST00000345517.8
ENST00000409624.1
|
ACTG2
|
actin gamma 2, smooth muscle
|
|
chr19_+_11539894
Show fit
|
29.57 |
ENST00000586059.5
|
CNN1
|
calponin 1
|
|
chr19_-_35757009
Show fit
|
24.95 |
ENST00000587965.1
ENST00000004982.6
|
HSPB6
|
heat shock protein family B (small) member 6
|
|
chr14_-_93976550
Show fit
|
21.75 |
ENST00000555019.6
|
ASB2
|
ankyrin repeat and SOCS box containing 2
|
|
chr14_-_93976719
Show fit
|
18.74 |
ENST00000555287.1
|
ASB2
|
ankyrin repeat and SOCS box containing 2
|
|
chr10_-_29634964
Show fit
|
17.89 |
ENST00000375398.6
ENST00000355867.8
|
SVIL
|
supervillin
|
|
chr8_+_85438850
Show fit
|
16.47 |
ENST00000285381.3
|
CA3
|
carbonic anhydrase 3
|
|
chr10_+_86668501
Show fit
|
15.58 |
ENST00000623056.4
ENST00000263066.11
ENST00000429277.7
ENST00000361373.9
ENST00000372066.8
ENST00000372056.8
ENST00000623007.3
|
LDB3
|
LIM domain binding 3
|
|
chr17_+_35147807
Show fit
|
15.52 |
ENST00000394570.7
ENST00000268876.9
|
UNC45B
|
unc-45 myosin chaperone B
|
|
chr10_-_129964240
Show fit
|
15.43 |
ENST00000440978.2
ENST00000355311.10
|
EBF3
|
EBF transcription factor 3
|
|
chr3_-_52452828
Show fit
|
15.40 |
ENST00000496590.1
|
TNNC1
|
troponin C1, slow skeletal and cardiac type
|
|
chr1_-_207911384
Show fit
|
15.25 |
ENST00000356522.4
|
CD34
|
CD34 molecule
|
|
chr6_-_123636997
Show fit
|
13.61 |
ENST00000546248.5
|
TRDN
|
triadin
|
|
chr1_-_207911027
Show fit
|
13.51 |
ENST00000310833.12
|
CD34
|
CD34 molecule
|
|
chr2_+_88067818
Show fit
|
13.41 |
ENST00000444564.2
ENST00000419482.7
|
SMYD1
|
SET and MYND domain containing 1
|
|
chr2_-_105398978
Show fit
|
13.40 |
ENST00000408995.5
ENST00000530340.6
ENST00000393353.7
ENST00000322142.13
ENST00000344213.9
ENST00000358129.8
|
FHL2
|
four and a half LIM domains 2
|
|
chr11_+_117199363
Show fit
|
12.80 |
ENST00000392951.9
ENST00000525531.5
ENST00000278968.10
|
TAGLN
|
transgelin
|
|
chr6_-_123636979
Show fit
|
12.35 |
ENST00000662930.1
|
TRDN
|
triadin
|
|
chr2_-_105438503
Show fit
|
12.22 |
ENST00000393352.7
ENST00000607522.1
|
FHL2
|
four and a half LIM domains 2
|
|
chr18_-_3219849
Show fit
|
12.12 |
ENST00000261606.11
|
MYOM1
|
myomesin 1
|
|
chr19_-_4518465
Show fit
|
11.84 |
ENST00000633942.1
|
PLIN4
|
perilipin 4
|
|
chr3_-_46863435
Show fit
|
11.78 |
ENST00000395869.5
ENST00000653454.1
ENST00000292327.6
|
MYL3
|
myosin light chain 3
|
|
chr2_-_127675065
Show fit
|
11.74 |
ENST00000545738.6
ENST00000409808.6
|
LIMS2
|
LIM zinc finger domain containing 2
|
|
chr18_-_3219961
Show fit
|
11.58 |
ENST00000356443.9
|
MYOM1
|
myomesin 1
|
|
chr6_-_123636923
Show fit
|
11.48 |
ENST00000334268.9
|
TRDN
|
triadin
|
|
chr3_-_99876104
Show fit
|
10.82 |
ENST00000471562.1
ENST00000495625.2
|
FILIP1L
|
filamin A interacting protein 1 like
|
|
chr7_-_80919017
Show fit
|
10.80 |
ENST00000265361.8
|
SEMA3C
|
semaphorin 3C
|
|
chr2_-_127675459
Show fit
|
10.43 |
ENST00000355119.9
|
LIMS2
|
LIM zinc finger domain containing 2
|
|
chr14_-_23408265
Show fit
|
10.28 |
ENST00000405093.9
|
MYH6
|
myosin heavy chain 6
|
|
chr16_+_30372291
Show fit
|
10.27 |
ENST00000568749.5
|
MYLPF
|
myosin light chain, phosphorylatable, fast skeletal muscle
|
|
chr3_-_99876193
Show fit
|
9.85 |
ENST00000383694.3
|
FILIP1L
|
filamin A interacting protein 1 like
|
|
chr10_-_17617326
Show fit
|
9.42 |
ENST00000326961.6
ENST00000361271.8
|
HACD1
|
3-hydroxyacyl-CoA dehydratase 1
|
|
chr10_-_88952763
Show fit
|
8.82 |
ENST00000224784.10
|
ACTA2
|
actin alpha 2, smooth muscle
|
|
chr10_+_122163426
Show fit
|
8.77 |
ENST00000360561.7
|
TACC2
|
transforming acidic coiled-coil containing protein 2
|
|
chr6_-_123636906
Show fit
|
8.62 |
ENST00000628709.2
|
TRDN
|
triadin
|
|
chr12_+_52051402
Show fit
|
8.43 |
ENST00000243050.5
ENST00000550763.1
ENST00000394825.6
ENST00000394824.2
ENST00000548232.1
ENST00000562373.1
|
NR4A1
|
nuclear receptor subfamily 4 group A member 1
|
|
chr2_+_88067849
Show fit
|
8.04 |
ENST00000438570.1
|
SMYD1
|
SET and MYND domain containing 1
|
|
chr1_+_15758768
Show fit
|
7.79 |
ENST00000483633.6
ENST00000502739.5
ENST00000375766.8
ENST00000431771.6
|
FBLIM1
|
filamin binding LIM protein 1
|
|
chr15_-_65067938
Show fit
|
7.64 |
ENST00000421977.7
ENST00000220062.9
|
RASL12
|
RAS like family 12
|
|
chr19_+_13024573
Show fit
|
7.54 |
ENST00000358552.7
ENST00000360105.8
ENST00000588228.5
ENST00000676441.1
ENST00000591028.1
|
NFIX
|
nuclear factor I X
|
|
chr15_+_96330691
Show fit
|
7.48 |
ENST00000394166.8
|
NR2F2
|
nuclear receptor subfamily 2 group F member 2
|
|
chr17_-_29622893
Show fit
|
7.30 |
ENST00000345068.9
ENST00000584602.1
ENST00000388767.8
ENST00000580212.6
|
CORO6
|
coronin 6
|
|
chr10_-_17617235
Show fit
|
7.19 |
ENST00000466335.1
|
HACD1
|
3-hydroxyacyl-CoA dehydratase 1
|
|
chrX_-_32412220
Show fit
|
7.15 |
ENST00000619831.5
|
DMD
|
dystrophin
|
|
chr7_-_27143672
Show fit
|
6.96 |
ENST00000222726.4
|
HOXA5
|
homeobox A5
|
|
chr10_+_73998104
Show fit
|
6.94 |
ENST00000372755.7
ENST00000211998.10
|
VCL
|
vinculin
|
|
chr8_+_2045058
Show fit
|
6.79 |
ENST00000523438.1
|
MYOM2
|
myomesin 2
|
|
chr4_+_87006988
Show fit
|
6.75 |
ENST00000307808.10
|
AFF1
|
AF4/FMR2 family member 1
|
|
chr1_+_19644284
Show fit
|
6.70 |
ENST00000375136.8
|
NBL1
|
NBL1, DAN family BMP antagonist
|
|
chr7_-_44141285
Show fit
|
6.63 |
ENST00000458240.5
ENST00000223364.7
|
MYL7
|
myosin light chain 7
|
|
chr7_-_44141074
Show fit
|
6.51 |
ENST00000457314.5
ENST00000447951.1
ENST00000431007.1
|
MYL7
|
myosin light chain 7
|
|
chr5_-_170389634
Show fit
|
6.20 |
ENST00000521859.1
|
KCNMB1
|
potassium calcium-activated channel subfamily M regulatory beta subunit 1
|
|
chr6_-_123636966
Show fit
|
6.07 |
ENST00000542443.5
|
TRDN
|
triadin
|
|
chr4_+_185143258
Show fit
|
5.98 |
ENST00000281456.11
|
SLC25A4
|
solute carrier family 25 member 4
|
|
chr5_+_151025343
Show fit
|
5.97 |
ENST00000521632.1
|
GPX3
|
glutathione peroxidase 3
|
|
chr16_+_66379225
Show fit
|
5.92 |
ENST00000563425.2
|
CDH5
|
cadherin 5
|
|
chr3_+_188212931
Show fit
|
5.41 |
ENST00000618621.4
ENST00000640853.1
|
LPP
|
LIM domain containing preferred translocation partner in lipoma
|
|
chr7_-_108003122
Show fit
|
5.40 |
ENST00000393559.2
ENST00000222399.11
ENST00000676777.1
ENST00000439976.6
ENST00000393560.5
ENST00000677793.1
ENST00000679244.1
|
LAMB1
|
laminin subunit beta 1
|
|
chr4_+_87006736
Show fit
|
5.38 |
ENST00000544085.6
|
AFF1
|
AF4/FMR2 family member 1
|
|
chr3_+_188212703
Show fit
|
5.29 |
ENST00000443217.5
|
LPP
|
LIM domain containing preferred translocation partner in lipoma
|
|
chr1_-_11847772
Show fit
|
5.27 |
ENST00000376480.7
ENST00000610706.1
|
NPPA
|
natriuretic peptide A
|
|
chr19_+_13023958
Show fit
|
5.17 |
ENST00000587760.5
ENST00000585575.5
|
NFIX
|
nuclear factor I X
|
|
chr7_+_114414997
Show fit
|
5.12 |
ENST00000462331.5
ENST00000393491.7
ENST00000403559.8
ENST00000408937.7
ENST00000393498.6
ENST00000393495.7
ENST00000378237.7
|
FOXP2
|
forkhead box P2
|
|
chr10_+_31321152
Show fit
|
4.83 |
ENST00000446923.7
|
ZEB1
|
zinc finger E-box binding homeobox 1
|
|
chr8_+_2045037
Show fit
|
4.77 |
ENST00000262113.9
|
MYOM2
|
myomesin 2
|
|
chr2_-_160200251
Show fit
|
4.73 |
ENST00000428609.6
ENST00000409967.6
ENST00000283249.7
|
ITGB6
|
integrin subunit beta 6
|
|
chr6_+_151239951
Show fit
|
4.72 |
ENST00000402676.7
|
AKAP12
|
A-kinase anchoring protein 12
|
|
chr17_-_29622732
Show fit
|
4.22 |
ENST00000683819.1
ENST00000492276.7
|
CORO6
|
coronin 6
|
|
chr19_+_45467988
Show fit
|
4.21 |
ENST00000615753.4
ENST00000585836.5
ENST00000417353.6
ENST00000591858.5
ENST00000443841.6
ENST00000590335.1
ENST00000353609.8
|
FOSB
|
FosB proto-oncogene, AP-1 transcription factor subunit
|
|
chr6_+_151240368
Show fit
|
4.19 |
ENST00000253332.5
|
AKAP12
|
A-kinase anchoring protein 12
|
|
chr2_+_100562941
Show fit
|
4.17 |
ENST00000264254.11
|
PDCL3
|
phosducin like 3
|
|
chr10_+_69318831
Show fit
|
3.97 |
ENST00000359426.7
|
HK1
|
hexokinase 1
|
|
chr5_-_33891941
Show fit
|
3.84 |
ENST00000352040.7
ENST00000504830.6
|
ADAMTS12
|
ADAM metallopeptidase with thrombospondin type 1 motif 12
|
|
chr17_-_42979993
Show fit
|
3.80 |
ENST00000409103.5
ENST00000360221.8
ENST00000454303.1
ENST00000591916.7
ENST00000451885.3
|
PTGES3L-AARSD1
PTGES3L
|
PTGES3L-AARSD1 readthrough
prostaglandin E synthase 3 like
|
|
chr19_+_13024626
Show fit
|
3.67 |
ENST00000586873.1
|
NFIX
|
nuclear factor I X
|
|
chr2_+_26692686
Show fit
|
3.65 |
ENST00000620977.1
ENST00000302909.4
|
KCNK3
|
potassium two pore domain channel subfamily K member 3
|
|
chr14_-_89417148
Show fit
|
3.62 |
ENST00000557258.6
|
FOXN3
|
forkhead box N3
|
|
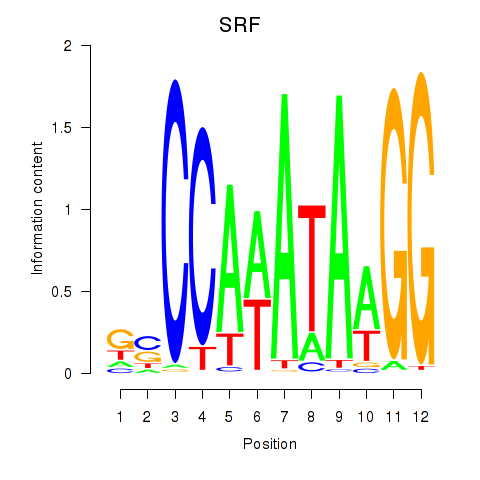
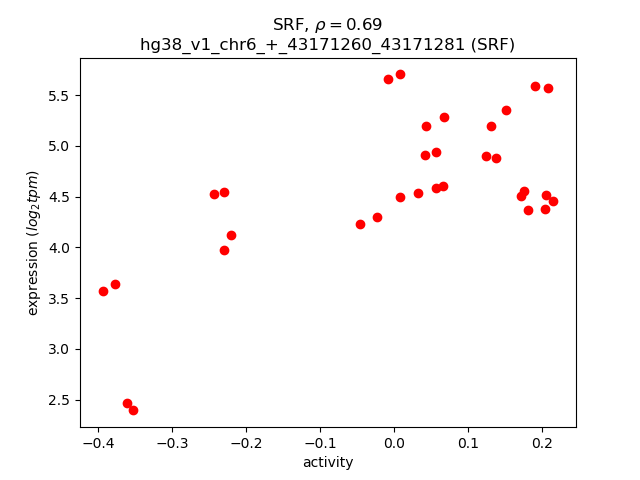
chr6_+_43171260
Show fit
|
3.58 |
ENST00000265354.6
|
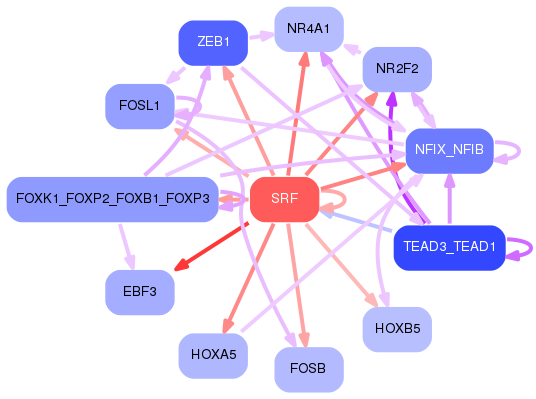
SRF
|
serum response factor
|
|
chr3_-_123620571
Show fit
|
3.57 |
ENST00000583087.5
|
MYLK
|
myosin light chain kinase
|
|
chr19_+_53869384
Show fit
|
3.55 |
ENST00000391769.2
|
MYADM
|
myeloid associated differentiation marker
|
|
chr19_+_16067016
Show fit
|
3.54 |
ENST00000589897.1
|
TPM4
|
tropomyosin 4
|
|
chr17_-_10657302
Show fit
|
3.42 |
ENST00000583535.6
|
MYH3
|
myosin heavy chain 3
|
|
chr5_-_177496802
Show fit
|
3.39 |
ENST00000506161.5
|
PDLIM7
|
PDZ and LIM domain 7
|
|
chr5_+_66958870
Show fit
|
3.32 |
ENST00000405643.5
ENST00000407621.1
ENST00000432426.5
|
MAST4
|
microtubule associated serine/threonine kinase family member 4
|
|
chr3_-_123620496
Show fit
|
3.31 |
ENST00000578202.1
|
MYLK
|
myosin light chain kinase
|
|
chr19_+_53869439
Show fit
|
3.28 |
ENST00000391768.2
|
MYADM
|
myeloid associated differentiation marker
|
|
chrX_-_11265975
Show fit
|
3.20 |
ENST00000303025.10
ENST00000657361.1
|
ARHGAP6
|
Rho GTPase activating protein 6
|
|
chr5_-_33892013
Show fit
|
3.18 |
ENST00000515401.1
|
ADAMTS12
|
ADAM metallopeptidase with thrombospondin type 1 motif 12
|
|
chr7_-_94655993
Show fit
|
3.18 |
ENST00000647110.1
ENST00000647048.1
ENST00000643020.1
ENST00000644682.1
ENST00000646119.1
ENST00000646265.1
ENST00000645445.1
ENST00000647334.1
ENST00000645262.1
ENST00000428696.7
ENST00000647096.1
ENST00000642394.1
ENST00000645725.1
ENST00000647351.1
ENST00000646943.1
ENST00000648936.2
ENST00000642707.1
ENST00000645109.1
ENST00000646489.1
ENST00000642933.1
ENST00000643128.1
ENST00000445866.7
ENST00000645101.1
ENST00000644116.1
ENST00000642441.1
ENST00000646879.1
ENST00000647018.1
|
SGCE
|
sarcoglycan epsilon
|
|
chr16_+_30065753
Show fit
|
3.14 |
ENST00000642816.3
ENST00000643777.4
ENST00000569798.5
|
ALDOA
|
aldolase, fructose-bisphosphate A
|
|
chr11_-_65900413
Show fit
|
3.12 |
ENST00000448083.6
ENST00000531493.5
ENST00000532401.1
|
FOSL1
|
FOS like 1, AP-1 transcription factor subunit
|
|
chr2_-_160200310
Show fit
|
3.05 |
ENST00000620391.4
|
ITGB6
|
integrin subunit beta 6
|
|
chr16_+_30065777
Show fit
|
3.04 |
ENST00000395240.7
ENST00000566846.5
|
ALDOA
|
aldolase, fructose-bisphosphate A
|
|
chr11_-_47352693
Show fit
|
3.03 |
ENST00000256993.8
ENST00000399249.6
ENST00000545968.6
|
MYBPC3
|
myosin binding protein C3
|
|
chr19_+_1026566
Show fit
|
2.95 |
ENST00000562015.5
ENST00000263097.9
ENST00000348419.7
ENST00000565096.6
ENST00000562958.6
ENST00000568865.3
ENST00000606983.5
ENST00000562075.6
ENST00000607102.1
|
CNN2
|
calponin 2
|
|
chr7_-_94656160
Show fit
|
2.92 |
ENST00000644609.1
ENST00000643272.1
ENST00000646137.1
ENST00000646098.1
ENST00000643193.1
ENST00000437425.7
ENST00000644551.1
ENST00000415788.3
|
SGCE
|
sarcoglycan epsilon
|
|
chr7_-_94656197
Show fit
|
2.92 |
ENST00000643903.1
ENST00000644122.1
ENST00000447873.6
ENST00000644816.1
ENST00000644375.1
|
SGCE
|
sarcoglycan epsilon
|
|
chr5_-_177496845
Show fit
|
2.90 |
ENST00000506537.1
|
PDLIM7
|
PDZ and LIM domain 7
|
|
chr1_-_89126066
Show fit
|
2.89 |
ENST00000370466.4
|
GBP2
|
guanylate binding protein 2
|
|
chr1_-_11848345
Show fit
|
2.88 |
ENST00000376476.1
|
NPPA
|
natriuretic peptide A
|
|
chr5_+_96742183
Show fit
|
2.84 |
ENST00000509259.5
ENST00000503828.5
|
CAST
|
calpastatin
|
|
chr19_+_57389839
Show fit
|
2.73 |
ENST00000366197.9
ENST00000336128.12
ENST00000596282.5
ENST00000597400.5
ENST00000598895.5
ENST00000596617.5
|
ZNF548
ENSG00000269533.5
|
zinc finger protein 548
novel transcript
|
|
chr3_+_188212641
Show fit
|
2.72 |
ENST00000420410.5
|
LPP
|
LIM domain containing preferred translocation partner in lipoma
|
|
chr16_-_11281322
Show fit
|
2.67 |
ENST00000312511.4
|
PRM1
|
protamine 1
|
|
chr11_-_2141238
Show fit
|
2.66 |
ENST00000434045.6
|
IGF2
|
insulin like growth factor 2
|
|
chr9_-_76906041
Show fit
|
2.57 |
ENST00000443509.6
ENST00000428286.5
ENST00000376713.3
|
PRUNE2
|
prune homolog 2 with BCH domain
|
|
chr4_+_87007175
Show fit
|
2.54 |
ENST00000511722.5
|
AFF1
|
AF4/FMR2 family member 1
|
|
chr11_-_2140967
Show fit
|
2.52 |
ENST00000381389.5
|
IGF2
|
insulin like growth factor 2
|
|
chr17_-_42980393
Show fit
|
2.32 |
ENST00000409446.8
ENST00000409399.6
ENST00000421990.7
|
PTGES3L
PTGES3L-AARSD1
|
prostaglandin E synthase 3 like
PTGES3L-AARSD1 readthrough
|
|
chr7_+_114414809
Show fit
|
2.24 |
ENST00000350908.9
|
FOXP2
|
forkhead box P2
|
|
chr8_+_96584920
Show fit
|
2.17 |
ENST00000521590.5
|
SDC2
|
syndecan 2
|
|
chr10_-_16817362
Show fit
|
2.16 |
ENST00000377921.7
ENST00000345264.10
|
RSU1
|
Ras suppressor protein 1
|
|
chr17_-_48593748
Show fit
|
2.09 |
ENST00000239151.6
|
HOXB5
|
homeobox B5
|
|
chr12_-_50222694
Show fit
|
2.05 |
ENST00000552783.5
|
LIMA1
|
LIM domain and actin binding 1
|
|
chr2_-_96145431
Show fit
|
1.97 |
ENST00000288943.5
|
DUSP2
|
dual specificity phosphatase 2
|
|
chr19_+_16067526
Show fit
|
1.92 |
ENST00000646974.2
|
TPM4
|
tropomyosin 4
|
|
chr13_+_27251545
Show fit
|
1.90 |
ENST00000311549.11
|
RPL21
|
ribosomal protein L21
|
|
chr20_+_4721901
Show fit
|
1.86 |
ENST00000305817.3
|
PRND
|
prion like protein doppel
|
|
chr9_-_76906090
Show fit
|
1.84 |
ENST00000376718.8
|
PRUNE2
|
prune homolog 2 with BCH domain
|
|
chr11_-_65900375
Show fit
|
1.75 |
ENST00000312562.7
|
FOSL1
|
FOS like 1, AP-1 transcription factor subunit
|
|
chr22_-_35961623
Show fit
|
1.71 |
ENST00000408983.2
|
RBFOX2
|
RNA binding fox-1 homolog 2
|
|
chr12_-_50222348
Show fit
|
1.70 |
ENST00000552823.5
ENST00000552909.5
|
LIMA1
|
LIM domain and actin binding 1
|
|
chr2_-_231125032
Show fit
|
1.69 |
ENST00000258400.4
|
HTR2B
|
5-hydroxytryptamine receptor 2B
|
|
chr5_-_58999885
Show fit
|
1.67 |
ENST00000317118.12
|
PDE4D
|
phosphodiesterase 4D
|
|
chr10_-_16817443
Show fit
|
1.63 |
ENST00000602389.1
|
RSU1
|
Ras suppressor protein 1
|
|
chr12_-_11310420
Show fit
|
1.61 |
ENST00000621732.4
ENST00000445719.2
ENST00000279575.7
|
PRB4
|
proline rich protein BstNI subfamily 4
|
|
chr10_+_6144883
Show fit
|
1.60 |
ENST00000379789.8
|
PFKFB3
|
6-phosphofructo-2-kinase/fructose-2,6-biphosphatase 3
|
|
chr2_+_219496128
Show fit
|
1.49 |
ENST00000651166.2
|
SPEGNB
|
SPEG neighbor
|
|
chr19_+_53869623
Show fit
|
1.44 |
ENST00000414489.1
|
MYADM
|
myeloid associated differentiation marker
|
|
chr13_+_27251569
Show fit
|
1.43 |
ENST00000272274.8
ENST00000319826.8
ENST00000326092.8
|
RPL21
|
ribosomal protein L21
|
|
chr1_+_167630093
Show fit
|
1.43 |
ENST00000537350.5
ENST00000361496.3
ENST00000367854.8
|
RCSD1
|
RCSD domain containing 1
|
|
chr15_+_45114324
Show fit
|
1.43 |
ENST00000323030.6
|
DUOXA2
|
dual oxidase maturation factor 2
|
|
chr6_-_3751703
Show fit
|
1.40 |
ENST00000380283.5
|
PXDC1
|
PX domain containing 1
|
|
chr14_+_104800573
Show fit
|
1.37 |
ENST00000555360.1
|
ZBTB42
|
zinc finger and BTB domain containing 42
|
|
chr7_+_112480853
Show fit
|
1.25 |
ENST00000439068.6
ENST00000312849.4
|
LSMEM1
|
leucine rich single-pass membrane protein 1
|
|
chr7_+_107891135
Show fit
|
1.16 |
ENST00000639772.1
ENST00000440410.5
ENST00000437604.6
ENST00000205402.10
|
DLD
|
dihydrolipoamide dehydrogenase
|
|
chr9_+_36136416
Show fit
|
1.16 |
ENST00000396613.7
|
GLIPR2
|
GLI pathogenesis related 2
|
|
chr7_+_143381286
Show fit
|
1.10 |
ENST00000449630.5
ENST00000322764.10
ENST00000457235.5
|
ZYX
|
zyxin
|
|
chr5_+_138439020
Show fit
|
1.06 |
ENST00000378339.7
ENST00000254901.9
ENST00000506158.5
|
REEP2
|
receptor accessory protein 2
|
|
chr22_+_37608716
Show fit
|
1.05 |
ENST00000381756.9
|
GGA1
|
golgi associated, gamma adaptin ear containing, ARF binding protein 1
|
|
chr3_-_157503574
Show fit
|
0.99 |
ENST00000494677.5
ENST00000468233.5
|
VEPH1
|
ventricular zone expressed PH domain containing 1
|
|
chr10_+_110497898
Show fit
|
0.95 |
ENST00000369583.4
|
DUSP5
|
dual specificity phosphatase 5
|
|
chr3_-_9792691
Show fit
|
0.93 |
ENST00000343450.2
|
TADA3
|
transcriptional adaptor 3
|
|
chr2_-_160200289
Show fit
|
0.88 |
ENST00000409872.1
|
ITGB6
|
integrin subunit beta 6
|
|
chr2_-_207167220
Show fit
|
0.84 |
ENST00000421199.5
ENST00000457962.5
|
KLF7
|
Kruppel like factor 7
|
|
chr14_+_75278820
Show fit
|
0.79 |
ENST00000554617.1
ENST00000554212.5
ENST00000535987.5
ENST00000303562.9
ENST00000555242.1
|
FOS
|
Fos proto-oncogene, AP-1 transcription factor subunit
|
|
chr9_+_36136703
Show fit
|
0.76 |
ENST00000377960.9
ENST00000377959.5
|
GLIPR2
|
GLI pathogenesis related 2
|
|
chr1_+_223701607
Show fit
|
0.73 |
ENST00000434648.5
|
CAPN2
|
calpain 2
|
|
chr1_+_11934651
Show fit
|
0.70 |
ENST00000449038.5
ENST00000196061.5
ENST00000429000.6
|
PLOD1
|
procollagen-lysine,2-oxoglutarate 5-dioxygenase 1
|
|
chr18_-_56651122
Show fit
|
0.66 |
ENST00000590954.5
|
TXNL1
|
thioredoxin like 1
|
|
chr9_+_36136752
Show fit
|
0.66 |
ENST00000619700.1
|
GLIPR2
|
GLI pathogenesis related 2
|
|
chr22_+_45318791
Show fit
|
0.62 |
ENST00000424557.1
|
FAM118A
|
family with sequence similarity 118 member A
|
|
chr7_+_143381561
Show fit
|
0.59 |
ENST00000354434.8
|
ZYX
|
zyxin
|
|
chr1_+_223701582
Show fit
|
0.58 |
ENST00000433674.6
|
CAPN2
|
calpain 2
|
|
chr19_-_17245889
Show fit
|
0.56 |
ENST00000291442.4
|
NR2F6
|
nuclear receptor subfamily 2 group F member 6
|
|
chr11_-_72112750
Show fit
|
0.52 |
ENST00000545680.5
ENST00000543587.5
ENST00000538393.5
ENST00000535234.5
ENST00000227618.8
ENST00000535503.5
|
ANAPC15
|
anaphase promoting complex subunit 15
|
|
chr14_+_104801082
Show fit
|
0.51 |
ENST00000342537.8
|
ZBTB42
|
zinc finger and BTB domain containing 42
|
|
chr10_-_62816309
Show fit
|
0.50 |
ENST00000411732.3
|
EGR2
|
early growth response 2
|
|
chr22_+_45318420
Show fit
|
0.50 |
ENST00000427777.1
|
FAM118A
|
family with sequence similarity 118 member A
|
|
chr1_-_23014024
Show fit
|
0.48 |
ENST00000440767.2
ENST00000622840.1
|
TEX46
|
testis expressed 46
|
|
chr3_-_9792779
Show fit
|
0.48 |
ENST00000439043.1
|
TADA3
|
transcriptional adaptor 3
|
|
chr22_+_37608826
Show fit
|
0.46 |
ENST00000405147.7
ENST00000343632.9
ENST00000429218.5
ENST00000325180.12
|
GGA1
|
golgi associated, gamma adaptin ear containing, ARF binding protein 1
|
|
chr7_-_520216
Show fit
|
0.38 |
ENST00000405692.2
|
PDGFA
|
platelet derived growth factor subunit A
|
|
chr7_+_149719345
Show fit
|
0.35 |
ENST00000497895.5
|
KRBA1
|
KRAB-A domain containing 1
|
|
chr10_+_19489054
Show fit
|
0.32 |
ENST00000377265.3
|
MALRD1
|
MAM and LDL receptor class A domain containing 1
|
|
chr17_-_4967790
Show fit
|
0.30 |
ENST00000575142.5
ENST00000206020.8
|
SPAG7
|
sperm associated antigen 7
|
|
chr19_+_57670242
Show fit
|
0.28 |
ENST00000612521.1
|
ZSCAN4
|
zinc finger and SCAN domain containing 4
|
|
chr5_-_124744513
Show fit
|
0.26 |
ENST00000504926.5
|
ZNF608
|
zinc finger protein 608
|
|
chr1_-_248755754
Show fit
|
0.25 |
ENST00000590317.4
|
LYPD8
|
LY6/PLAUR domain containing 8
|
|
chr8_-_22693469
Show fit
|
0.18 |
ENST00000317216.3
|
EGR3
|
early growth response 3
|
|
chrX_-_104254921
Show fit
|
0.09 |
ENST00000372588.4
|
ESX1
|
ESX homeobox 1
|
|
chr11_-_65900539
Show fit
|
0.08 |
ENST00000534222.1
|
FOSL1
|
FOS like 1, AP-1 transcription factor subunit
|
|
chr15_+_83107572
Show fit
|
0.06 |
ENST00000379390.10
ENST00000322019.14
ENST00000565774.5
ENST00000565982.1
|
TM6SF1
|
transmembrane 6 superfamily member 1
|
|
chr2_+_190927649
Show fit
|
0.04 |
ENST00000409428.5
ENST00000409215.5
|
GLS
|
glutaminase
|
|
chr14_+_74239447
Show fit
|
0.03 |
ENST00000261980.3
|
VSX2
|
visual system homeobox 2
|
|
chr1_-_89065357
Show fit
|
0.02 |
ENST00000681280.1
|
GBP1
|
guanylate binding protein 1
|
|
chr1_+_76074698
Show fit
|
0.02 |
ENST00000328299.4
|
ST6GALNAC3
|
ST6 N-acetylgalactosaminide alpha-2,6-sialyltransferase 3
|
|
chr2_+_206159884
Show fit
|
0.01 |
ENST00000392222.7
|
EEF1B2
|
eukaryotic translation elongation factor 1 beta 2
|
