Project
Illumina Body Map 2 (GSE30611)
Navigation
Downloads
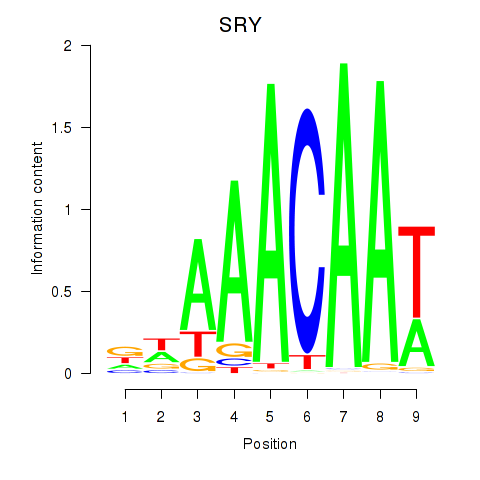
Results for SRY
Z-value: 0.97
Motif logo
Transcription factors associated with SRY
| Gene Symbol | Gene ID | Gene Info |
|---|---|---|
|
SRY
|
ENSG00000184895.8 | sex determining region Y |
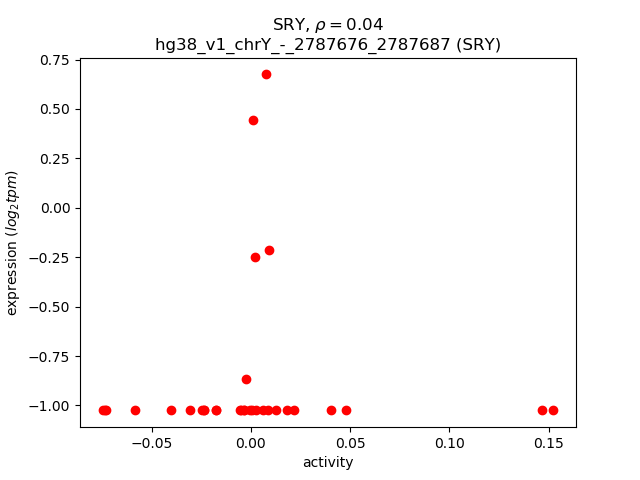
Activity-expression correlation:
| Gene | Promoter | Pearson corr. coef. | P-value | Plot |
|---|---|---|---|---|
| SRY | hg38_v1_chrY_-_2787676_2787687 | 0.04 | 8.4e-01 | Click! |
Activity profile of SRY motif
Sorted Z-values of SRY motif
| Promoter | Log-likelihood | Transcript | Gene | Gene Info |
|---|---|---|---|---|
| chr3_+_39467598 | 3.79 |
ENST00000428261.5
ENST00000420739.5 ENST00000415443.5 ENST00000447324.5 ENST00000383754.7 |
MOBP
|
myelin associated oligodendrocyte basic protein |
| chr10_+_11164961 | 3.72 |
ENST00000399850.7
ENST00000417956.6 |
CELF2
|
CUGBP Elav-like family member 2 |
| chr21_-_31558977 | 2.74 |
ENST00000286827.7
ENST00000541036.5 |
TIAM1
|
TIAM Rac1 associated GEF 1 |
| chr3_+_39467672 | 2.74 |
ENST00000436143.6
ENST00000441980.6 ENST00000682069.1 ENST00000311042.10 |
MOBP
|
myelin associated oligodendrocyte basic protein |
| chrX_+_108045050 | 2.69 |
ENST00000458383.1
ENST00000217957.10 |
VSIG1
|
V-set and immunoglobulin domain containing 1 |
| chr7_+_28412511 | 2.58 |
ENST00000357727.7
|
CREB5
|
cAMP responsive element binding protein 5 |
| chr11_+_112961247 | 2.43 |
ENST00000621518.4
ENST00000618266.4 ENST00000615112.4 ENST00000615285.4 ENST00000619839.4 ENST00000401611.6 ENST00000621128.4 |
NCAM1
|
neural cell adhesion molecule 1 |
| chrX_+_108044967 | 2.32 |
ENST00000415430.7
|
VSIG1
|
V-set and immunoglobulin domain containing 1 |
| chr11_-_118225002 | 2.31 |
ENST00000356289.10
ENST00000526620.5 |
JAML
|
junction adhesion molecule like |
| chr14_-_59630582 | 2.27 |
ENST00000395090.5
|
RTN1
|
reticulon 1 |
| chr21_-_31160904 | 2.22 |
ENST00000636887.1
|
TIAM1
|
TIAM Rac1 associated GEF 1 |
| chr5_-_147056010 | 2.14 |
ENST00000394414.5
|
PPP2R2B
|
protein phosphatase 2 regulatory subunit Bbeta |
| chr1_-_39901996 | 2.08 |
ENST00000397332.2
|
MYCL
|
MYCL proto-oncogene, bHLH transcription factor |
| chr1_-_39901861 | 2.05 |
ENST00000372816.3
ENST00000372815.1 |
MYCL
|
MYCL proto-oncogene, bHLH transcription factor |
| chr10_+_97319250 | 2.05 |
ENST00000371021.5
|
FRAT1
|
FRAT regulator of WNT signaling pathway 1 |
| chr10_+_11165088 | 2.05 |
ENST00000608830.5
|
CELF2
|
CUGBP Elav-like family member 2 |
| chr5_-_147782681 | 2.04 |
ENST00000616793.5
ENST00000333010.6 ENST00000265272.9 |
JAKMIP2
|
janus kinase and microtubule interacting protein 2 |
| chr5_-_147055968 | 2.03 |
ENST00000336640.10
|
PPP2R2B
|
protein phosphatase 2 regulatory subunit Bbeta |
| chr9_-_89436476 | 2.00 |
ENST00000420681.6
|
SEMA4D
|
semaphorin 4D |
| chr13_-_99258366 | 1.99 |
ENST00000397470.5
ENST00000397473.7 |
GPR18
|
G protein-coupled receptor 18 |
| chr22_+_19723525 | 1.94 |
ENST00000366425.4
|
GP1BB
|
glycoprotein Ib platelet subunit beta |
| chrX_-_19670983 | 1.92 |
ENST00000379716.5
|
SH3KBP1
|
SH3 domain containing kinase binding protein 1 |
| chr5_-_111756245 | 1.88 |
ENST00000447165.6
|
NREP
|
neuronal regeneration related protein |
| chr12_+_94148553 | 1.83 |
ENST00000258526.9
|
PLXNC1
|
plexin C1 |
| chr3_-_71304741 | 1.80 |
ENST00000484350.5
|
FOXP1
|
forkhead box P1 |
| chr7_+_106865263 | 1.71 |
ENST00000440650.6
ENST00000496166.6 ENST00000473541.5 |
PIK3CG
|
phosphatidylinositol-4,5-bisphosphate 3-kinase catalytic subunit gamma |
| chr5_-_150086427 | 1.70 |
ENST00000543093.1
|
CSF1R
|
colony stimulating factor 1 receptor |
| chr10_-_97334698 | 1.69 |
ENST00000371019.4
|
FRAT2
|
FRAT regulator of WNT signaling pathway 2 |
| chr14_-_89494051 | 1.67 |
ENST00000555034.5
ENST00000553904.1 |
FOXN3
|
forkhead box N3 |
| chr13_-_46142834 | 1.66 |
ENST00000674665.1
|
LCP1
|
lymphocyte cytosolic protein 1 |
| chr12_-_121536069 | 1.63 |
ENST00000538379.5
ENST00000541318.1 ENST00000541511.1 |
KDM2B
|
lysine demethylase 2B |
| chr9_-_89436439 | 1.62 |
ENST00000418828.1
|
SEMA4D
|
semaphorin 4D |
| chr7_+_80638633 | 1.57 |
ENST00000447544.7
ENST00000482059.6 |
CD36
|
CD36 molecule |
| chr1_+_84164962 | 1.56 |
ENST00000614872.4
ENST00000394839.6 |
PRKACB
|
protein kinase cAMP-activated catalytic subunit beta |
| chr5_-_147081428 | 1.56 |
ENST00000394413.7
|
PPP2R2B
|
protein phosphatase 2 regulatory subunit Bbeta |
| chr2_-_60546162 | 1.55 |
ENST00000489183.1
ENST00000647469.1 ENST00000642180.1 |
BCL11A
|
BAF chromatin remodeling complex subunit BCL11A |
| chr1_+_40374648 | 1.55 |
ENST00000372708.5
|
SMAP2
|
small ArfGAP2 |
| chr11_-_134412234 | 1.50 |
ENST00000312527.9
|
B3GAT1
|
beta-1,3-glucuronyltransferase 1 |
| chr5_-_150086511 | 1.47 |
ENST00000675795.1
|
CSF1R
|
colony stimulating factor 1 receptor |
| chr17_-_64390592 | 1.45 |
ENST00000563523.5
|
PECAM1
|
platelet and endothelial cell adhesion molecule 1 |
| chr1_+_84164370 | 1.43 |
ENST00000446538.5
ENST00000610703.4 ENST00000370682.7 ENST00000394838.6 ENST00000432111.5 |
PRKACB
|
protein kinase cAMP-activated catalytic subunit beta |
| chr1_+_84164891 | 1.38 |
ENST00000413538.5
ENST00000417530.5 |
PRKACB
|
protein kinase cAMP-activated catalytic subunit beta |
| chr5_-_147081462 | 1.37 |
ENST00000508267.5
ENST00000504198.5 |
PPP2R2B
|
protein phosphatase 2 regulatory subunit Bbeta |
| chr10_+_69088096 | 1.37 |
ENST00000242465.4
|
SRGN
|
serglycin |
| chr11_-_46826842 | 1.34 |
ENST00000526496.1
|
CKAP5
|
cytoskeleton associated protein 5 |
| chr10_+_113125536 | 1.33 |
ENST00000349937.7
|
TCF7L2
|
transcription factor 7 like 2 |
| chr15_-_34318761 | 1.33 |
ENST00000290209.9
|
SLC12A6
|
solute carrier family 12 member 6 |
| chr7_-_78771058 | 1.30 |
ENST00000628781.1
|
MAGI2
|
membrane associated guanylate kinase, WW and PDZ domain containing 2 |
| chr4_-_108166750 | 1.30 |
ENST00000515500.5
|
LEF1
|
lymphoid enhancer binding factor 1 |
| chr22_+_39901075 | 1.29 |
ENST00000344138.9
|
GRAP2
|
GRB2 related adaptor protein 2 |
| chr10_-_14571969 | 1.28 |
ENST00000488576.5
ENST00000472095.5 |
FAM107B
|
family with sequence similarity 107 member B |
| chr5_+_138337511 | 1.28 |
ENST00000434981.6
|
FAM53C
|
family with sequence similarity 53 member C |
| chr7_+_106865474 | 1.27 |
ENST00000359195.3
|
PIK3CG
|
phosphatidylinositol-4,5-bisphosphate 3-kinase catalytic subunit gamma |
| chr10_+_11165475 | 1.27 |
ENST00000609692.5
ENST00000354897.3 |
CELF2
|
CUGBP Elav-like family member 2 |
| chr3_+_115623502 | 1.27 |
ENST00000305124.11
ENST00000393780.3 |
GAP43
|
growth associated protein 43 |
| chr16_+_53435612 | 1.27 |
ENST00000544405.6
|
RBL2
|
RB transcriptional corepressor like 2 |
| chr13_-_74133892 | 1.26 |
ENST00000377669.7
|
KLF12
|
Kruppel like factor 12 |
| chr14_+_22281097 | 1.24 |
ENST00000390465.2
|
TRAV38-2DV8
|
T cell receptor alpha variable 38-2/delta variable 8 |
| chr20_-_54028692 | 1.22 |
ENST00000448484.5
|
BCAS1
|
brain enriched myelin associated protein 1 |
| chr5_+_126777112 | 1.22 |
ENST00000261366.10
ENST00000492190.5 ENST00000395354.1 |
LMNB1
|
lamin B1 |
| chr4_-_108166715 | 1.19 |
ENST00000510624.5
|
LEF1
|
lymphoid enhancer binding factor 1 |
| chr10_-_14572313 | 1.18 |
ENST00000479731.5
ENST00000468492.5 |
FAM107B
|
family with sequence similarity 107 member B |
| chr21_-_17819386 | 1.17 |
ENST00000400559.7
ENST00000400558.7 |
C21orf91
|
chromosome 21 open reading frame 91 |
| chr1_+_84164669 | 1.17 |
ENST00000450730.5
|
PRKACB
|
protein kinase cAMP-activated catalytic subunit beta |
| chr1_+_50108856 | 1.17 |
ENST00000650764.1
ENST00000494555.2 ENST00000371824.7 ENST00000371823.8 ENST00000652693.1 |
ELAVL4
|
ELAV like RNA binding protein 4 |
| chr7_-_78771108 | 1.17 |
ENST00000626691.2
|
MAGI2
|
membrane associated guanylate kinase, WW and PDZ domain containing 2 |
| chr2_+_74002685 | 1.16 |
ENST00000305799.8
|
TET3
|
tet methylcytosine dioxygenase 3 |
| chr5_+_134524305 | 1.15 |
ENST00000431355.2
|
JADE2
|
jade family PHD finger 2 |
| chr21_-_17819343 | 1.13 |
ENST00000284881.9
|
C21orf91
|
chromosome 21 open reading frame 91 |
| chr2_-_144516397 | 1.12 |
ENST00000638128.1
|
ZEB2
|
zinc finger E-box binding homeobox 2 |
| chr10_-_14572087 | 1.12 |
ENST00000482277.5
ENST00000378462.5 |
FAM107B
|
family with sequence similarity 107 member B |
| chr11_+_112961402 | 1.11 |
ENST00000613217.4
ENST00000316851.12 ENST00000620046.4 ENST00000531044.5 ENST00000529356.5 |
NCAM1
|
neural cell adhesion molecule 1 |
| chr12_-_75209814 | 1.09 |
ENST00000549446.6
|
KCNC2
|
potassium voltage-gated channel subfamily C member 2 |
| chr11_+_128694052 | 1.09 |
ENST00000527786.7
ENST00000534087.3 |
FLI1
|
Fli-1 proto-oncogene, ETS transcription factor |
| chr10_-_14572123 | 1.08 |
ENST00000378465.7
ENST00000452706.6 ENST00000622567.4 ENST00000378458.6 |
FAM107B
|
family with sequence similarity 107 member B |
| chr11_+_128693887 | 1.06 |
ENST00000281428.12
|
FLI1
|
Fli-1 proto-oncogene, ETS transcription factor |
| chr1_+_35807974 | 1.05 |
ENST00000373210.4
|
AGO4
|
argonaute RISC component 4 |
| chr12_-_76423256 | 1.05 |
ENST00000546946.5
|
OSBPL8
|
oxysterol binding protein like 8 |
| chr1_+_226063466 | 1.04 |
ENST00000666609.1
ENST00000661429.1 |
H3-3A
|
H3.3 histone A |
| chr17_+_78041043 | 1.03 |
ENST00000588549.1
|
TNRC6C
|
trinucleotide repeat containing adaptor 6C |
| chr11_-_46119787 | 1.02 |
ENST00000529782.5
ENST00000532010.5 ENST00000525438.5 ENST00000533757.5 ENST00000527782.5 |
PHF21A
|
PHD finger protein 21A |
| chr10_+_110207587 | 1.00 |
ENST00000332674.9
ENST00000453116.5 |
MXI1
|
MAX interactor 1, dimerization protein |
| chr1_+_50106265 | 1.00 |
ENST00000357083.8
|
ELAVL4
|
ELAV like RNA binding protein 4 |
| chr2_-_144516154 | 0.99 |
ENST00000637304.1
|
ZEB2
|
zinc finger E-box binding homeobox 2 |
| chr5_+_138338256 | 0.98 |
ENST00000513056.5
ENST00000239906.10 ENST00000511276.1 |
FAM53C
|
family with sequence similarity 53 member C |
| chr8_+_66493556 | 0.97 |
ENST00000305454.8
ENST00000522977.5 ENST00000480005.1 |
VXN
|
vexin |
| chr1_+_84164684 | 0.96 |
ENST00000370680.5
|
PRKACB
|
protein kinase cAMP-activated catalytic subunit beta |
| chr12_-_389249 | 0.95 |
ENST00000535014.5
ENST00000543507.1 ENST00000544760.1 ENST00000399788.7 |
KDM5A
|
lysine demethylase 5A |
| chr12_-_75209701 | 0.93 |
ENST00000350228.6
ENST00000298972.5 |
KCNC2
|
potassium voltage-gated channel subfamily C member 2 |
| chr7_+_80638510 | 0.92 |
ENST00000433696.6
ENST00000538969.5 ENST00000544133.5 |
CD36
|
CD36 molecule |
| chr2_-_2331225 | 0.91 |
ENST00000648627.1
ENST00000649663.1 ENST00000650560.1 ENST00000428368.7 ENST00000648316.1 ENST00000648665.1 ENST00000649313.1 ENST00000399161.7 ENST00000647738.2 |
MYT1L
|
myelin transcription factor 1 like |
| chr5_-_147782518 | 0.91 |
ENST00000507386.5
|
JAKMIP2
|
janus kinase and microtubule interacting protein 2 |
| chr5_+_179732811 | 0.91 |
ENST00000292599.4
|
MAML1
|
mastermind like transcriptional coactivator 1 |
| chr7_-_78770859 | 0.91 |
ENST00000636717.1
|
MAGI2
|
membrane associated guanylate kinase, WW and PDZ domain containing 2 |
| chr8_+_66493514 | 0.90 |
ENST00000521495.5
|
VXN
|
vexin |
| chr2_-_151289871 | 0.88 |
ENST00000414946.1
|
NMI
|
N-myc and STAT interactor |
| chr2_+_86441341 | 0.88 |
ENST00000312912.10
ENST00000409064.5 |
KDM3A
|
lysine demethylase 3A |
| chr11_+_36296281 | 0.87 |
ENST00000530639.6
|
PRR5L
|
proline rich 5 like |
| chr8_+_21919731 | 0.86 |
ENST00000521303.5
|
XPO7
|
exportin 7 |
| chr4_-_184474037 | 0.85 |
ENST00000510814.5
ENST00000507523.5 ENST00000506230.5 |
IRF2
|
interferon regulatory factor 2 |
| chr1_+_50105666 | 0.84 |
ENST00000651347.1
|
ELAVL4
|
ELAV like RNA binding protein 4 |
| chr12_+_389334 | 0.83 |
ENST00000540180.5
ENST00000422000.5 ENST00000535052.5 |
CCDC77
|
coiled-coil domain containing 77 |
| chr1_+_66332004 | 0.82 |
ENST00000371045.9
ENST00000531025.5 ENST00000526197.5 |
PDE4B
|
phosphodiesterase 4B |
| chr12_+_59664677 | 0.81 |
ENST00000548610.5
|
SLC16A7
|
solute carrier family 16 member 7 |
| chr12_-_75209422 | 0.80 |
ENST00000393288.2
ENST00000540018.5 |
KCNC2
|
potassium voltage-gated channel subfamily C member 2 |
| chr11_+_22338333 | 0.79 |
ENST00000263160.4
|
SLC17A6
|
solute carrier family 17 member 6 |
| chr17_-_59151794 | 0.79 |
ENST00000584089.1
|
SKA2
|
spindle and kinetochore associated complex subunit 2 |
| chr8_-_132059378 | 0.79 |
ENST00000254627.4
|
OC90
|
otoconin 90 |
| chr20_-_44521989 | 0.79 |
ENST00000342374.5
ENST00000255175.5 |
SERINC3
|
serine incorporator 3 |
| chr7_+_30145789 | 0.78 |
ENST00000324489.5
|
MTURN
|
maturin, neural progenitor differentiation regulator homolog |
| chr5_-_88824266 | 0.78 |
ENST00000509373.1
ENST00000636541.1 |
MEF2C
|
myocyte enhancer factor 2C |
| chr1_-_156248084 | 0.78 |
ENST00000652405.1
ENST00000335852.6 ENST00000540423.5 ENST00000612424.4 ENST00000613336.4 ENST00000623241.3 |
PAQR6
|
progestin and adipoQ receptor family member 6 |
| chr15_-_70097874 | 0.78 |
ENST00000557997.5
ENST00000317509.12 ENST00000451782.7 ENST00000627388.2 |
TLE3
|
TLE family member 3, transcriptional corepressor |
| chr7_+_131285041 | 0.77 |
ENST00000429546.5
|
MKLN1
|
muskelin 1 |
| chr14_-_22819721 | 0.77 |
ENST00000554517.5
ENST00000285850.11 ENST00000397529.6 ENST00000555702.5 |
SLC7A7
|
solute carrier family 7 member 7 |
| chr7_+_143288215 | 0.77 |
ENST00000619992.4
ENST00000310447.10 |
CASP2
|
caspase 2 |
| chr7_+_143288364 | 0.76 |
ENST00000392925.6
|
CASP2
|
caspase 2 |
| chr2_+_190408324 | 0.76 |
ENST00000417958.5
ENST00000432036.5 ENST00000392328.6 |
MFSD6
|
major facilitator superfamily domain containing 6 |
| chr10_+_58334998 | 0.76 |
ENST00000373910.9
|
UBE2D1
|
ubiquitin conjugating enzyme E2 D1 |
| chr14_-_89417148 | 0.76 |
ENST00000557258.6
|
FOXN3
|
forkhead box N3 |
| chr16_-_15643024 | 0.74 |
ENST00000540441.6
|
MARF1
|
meiosis regulator and mRNA stability factor 1 |
| chr11_-_119729158 | 0.74 |
ENST00000264025.8
|
NECTIN1
|
nectin cell adhesion molecule 1 |
| chr17_-_42276341 | 0.74 |
ENST00000293328.8
|
STAT5B
|
signal transducer and activator of transcription 5B |
| chr1_-_156248013 | 0.73 |
ENST00000368270.2
|
PAQR6
|
progestin and adipoQ receptor family member 6 |
| chr12_-_49110666 | 0.73 |
ENST00000547675.5
|
LMBR1L
|
limb development membrane protein 1 like |
| chr1_+_32651485 | 0.72 |
ENST00000490500.5
ENST00000445722.2 |
RBBP4
|
RB binding protein 4, chromatin remodeling factor |
| chr3_-_136194456 | 0.71 |
ENST00000434835.2
|
MSL2
|
MSL complex subunit 2 |
| chr20_-_53995929 | 0.71 |
ENST00000422805.1
|
BCAS1
|
brain enriched myelin associated protein 1 |
| chr4_+_169660062 | 0.71 |
ENST00000507875.5
ENST00000613795.4 |
CLCN3
|
chloride voltage-gated channel 3 |
| chr1_-_156248038 | 0.71 |
ENST00000470198.5
ENST00000292291.10 ENST00000356983.7 |
PAQR6
|
progestin and adipoQ receptor family member 6 |
| chr10_+_58334976 | 0.71 |
ENST00000615793.1
|
UBE2D1
|
ubiquitin conjugating enzyme E2 D1 |
| chr6_-_42451261 | 0.71 |
ENST00000372917.8
ENST00000340840.6 ENST00000354325.2 |
TRERF1
|
transcriptional regulating factor 1 |
| chr6_+_83853576 | 0.71 |
ENST00000369687.2
|
RIPPLY2
|
ripply transcriptional repressor 2 |
| chr2_-_2331336 | 0.70 |
ENST00000648933.1
ENST00000644820.1 |
MYT1L
|
myelin transcription factor 1 like |
| chr11_+_112961480 | 0.69 |
ENST00000621850.4
|
NCAM1
|
neural cell adhesion molecule 1 |
| chr17_-_39607876 | 0.68 |
ENST00000302584.5
|
NEUROD2
|
neuronal differentiation 2 |
| chr9_-_127980976 | 0.67 |
ENST00000373095.6
|
FAM102A
|
family with sequence similarity 102 member A |
| chr11_-_13440243 | 0.67 |
ENST00000530907.5
|
BTBD10
|
BTB domain containing 10 |
| chr1_+_87328860 | 0.67 |
ENST00000370544.10
|
LMO4
|
LIM domain only 4 |
| chr15_+_90001300 | 0.66 |
ENST00000268154.9
|
ZNF710
|
zinc finger protein 710 |
| chr14_-_56805648 | 0.66 |
ENST00000554788.5
ENST00000554845.1 ENST00000408990.8 |
OTX2
|
orthodenticle homeobox 2 |
| chr2_-_191847068 | 0.65 |
ENST00000304141.5
|
CAVIN2
|
caveolae associated protein 2 |
| chr5_-_88824334 | 0.64 |
ENST00000506716.5
|
MEF2C
|
myocyte enhancer factor 2C |
| chr14_-_55411817 | 0.64 |
ENST00000247178.6
|
ATG14
|
autophagy related 14 |
| chr3_-_33659097 | 0.63 |
ENST00000461133.8
ENST00000496954.2 |
CLASP2
|
cytoplasmic linker associated protein 2 |
| chr5_-_11589019 | 0.63 |
ENST00000511377.5
|
CTNND2
|
catenin delta 2 |
| chr8_+_78591222 | 0.62 |
ENST00000518467.1
|
PKIA
|
cAMP-dependent protein kinase inhibitor alpha |
| chr4_+_118034480 | 0.61 |
ENST00000296499.6
|
NDST3
|
N-deacetylase and N-sulfotransferase 3 |
| chr2_-_165203870 | 0.61 |
ENST00000639244.1
ENST00000409101.7 ENST00000668657.1 |
SCN3A
|
sodium voltage-gated channel alpha subunit 3 |
| chr15_+_76336755 | 0.59 |
ENST00000290759.9
|
ISL2
|
ISL LIM homeobox 2 |
| chrX_-_111412162 | 0.58 |
ENST00000637570.1
ENST00000356220.8 ENST00000636035.2 ENST00000637453.1 ENST00000635795.1 |
DCX
|
doublecortin |
| chr11_+_67240047 | 0.58 |
ENST00000530342.2
|
KDM2A
|
lysine demethylase 2A |
| chr1_-_107688492 | 0.58 |
ENST00000415432.6
|
VAV3
|
vav guanine nucleotide exchange factor 3 |
| chr5_+_163505564 | 0.58 |
ENST00000421814.6
ENST00000518095.5 ENST00000321757.11 |
MAT2B
|
methionine adenosyltransferase 2B |
| chr12_+_389378 | 0.57 |
ENST00000543504.5
|
CCDC77
|
coiled-coil domain containing 77 |
| chr20_+_18145083 | 0.57 |
ENST00000489634.2
|
KAT14
|
lysine acetyltransferase 14 |
| chr5_-_180803830 | 0.57 |
ENST00000427865.2
ENST00000514283.1 |
MGAT1
|
alpha-1,3-mannosyl-glycoprotein 2-beta-N-acetylglucosaminyltransferase |
| chrX_+_28587411 | 0.57 |
ENST00000378993.6
|
IL1RAPL1
|
interleukin 1 receptor accessory protein like 1 |
| chr1_+_147902789 | 0.56 |
ENST00000369235.2
|
GJA8
|
gap junction protein alpha 8 |
| chr12_+_50085325 | 0.56 |
ENST00000551966.5
ENST00000550477.5 ENST00000394963.9 |
SMARCD1
|
SWI/SNF related, matrix associated, actin dependent regulator of chromatin, subfamily d, member 1 |
| chr16_+_30395400 | 0.56 |
ENST00000320159.2
ENST00000613509.2 |
ZNF48
|
zinc finger protein 48 |
| chr1_+_99850485 | 0.54 |
ENST00000370165.7
ENST00000370163.7 ENST00000294724.8 |
AGL
|
amylo-alpha-1, 6-glucosidase, 4-alpha-glucanotransferase |
| chr11_-_73141275 | 0.54 |
ENST00000422375.1
|
FCHSD2
|
FCH and double SH3 domains 2 |
| chr1_-_193186599 | 0.53 |
ENST00000367434.5
|
B3GALT2
|
beta-1,3-galactosyltransferase 2 |
| chr2_+_86720282 | 0.53 |
ENST00000283632.5
|
RMND5A
|
required for meiotic nuclear division 5 homolog A |
| chrX_+_78747705 | 0.53 |
ENST00000614823.5
ENST00000435339.3 ENST00000514744.5 |
LPAR4
|
lysophosphatidic acid receptor 4 |
| chr19_+_1942454 | 0.53 |
ENST00000591752.5
|
CSNK1G2
|
casein kinase 1 gamma 2 |
| chr5_-_41794547 | 0.52 |
ENST00000510634.5
|
OXCT1
|
3-oxoacid CoA-transferase 1 |
| chr14_-_23435652 | 0.52 |
ENST00000355349.4
|
MYH7
|
myosin heavy chain 7 |
| chr6_-_31684040 | 0.52 |
ENST00000375863.7
|
LY6G5C
|
lymphocyte antigen 6 family member G5C |
| chr15_-_55270249 | 0.51 |
ENST00000568803.1
|
RAB27A
|
RAB27A, member RAS oncogene family |
| chr10_-_32378720 | 0.51 |
ENST00000375110.6
|
EPC1
|
enhancer of polycomb homolog 1 |
| chr3_-_33659441 | 0.51 |
ENST00000650653.1
ENST00000480013.6 |
CLASP2
|
cytoplasmic linker associated protein 2 |
| chr19_+_10602436 | 0.51 |
ENST00000590382.5
ENST00000407327.8 |
SLC44A2
|
solute carrier family 44 member 2 |
| chr12_+_11649666 | 0.51 |
ENST00000396373.9
|
ETV6
|
ETS variant transcription factor 6 |
| chr6_-_116545658 | 0.50 |
ENST00000368602.4
|
TRAPPC3L
|
trafficking protein particle complex 3 like |
| chr16_-_69356306 | 0.50 |
ENST00000563634.1
|
ENSG00000260371.1
|
novel protein |
| chr14_-_52552493 | 0.50 |
ENST00000281741.9
ENST00000557374.1 |
TXNDC16
|
thioredoxin domain containing 16 |
| chr17_+_39653080 | 0.50 |
ENST00000443521.1
|
STARD3
|
StAR related lipid transfer domain containing 3 |
| chr16_-_68448491 | 0.50 |
ENST00000561749.1
ENST00000219334.10 |
SMPD3
|
sphingomyelin phosphodiesterase 3 |
| chr4_-_112516176 | 0.49 |
ENST00000313341.4
|
NEUROG2
|
neurogenin 2 |
| chr8_+_24294107 | 0.49 |
ENST00000437154.6
|
ADAM28
|
ADAM metallopeptidase domain 28 |
| chrX_-_24672654 | 0.49 |
ENST00000379145.5
|
PCYT1B
|
phosphate cytidylyltransferase 1, choline, beta |
| chr2_-_207165923 | 0.48 |
ENST00000309446.11
|
KLF7
|
Kruppel like factor 7 |
| chr3_-_71493500 | 0.48 |
ENST00000648380.1
ENST00000650295.1 |
FOXP1
|
forkhead box P1 |
| chr3_+_179148341 | 0.48 |
ENST00000263967.4
|
PIK3CA
|
phosphatidylinositol-4,5-bisphosphate 3-kinase catalytic subunit alpha |
| chr18_+_75210789 | 0.47 |
ENST00000580243.3
|
TSHZ1
|
teashirt zinc finger homeobox 1 |
| chr14_+_58427686 | 0.47 |
ENST00000650904.1
ENST00000652326.2 ENST00000554463.5 ENST00000555833.5 |
KIAA0586
|
KIAA0586 |
| chr1_+_25338294 | 0.47 |
ENST00000374358.5
|
TMEM50A
|
transmembrane protein 50A |
| chr9_-_95509241 | 0.46 |
ENST00000331920.11
|
PTCH1
|
patched 1 |
| chr11_+_131911396 | 0.46 |
ENST00000425719.6
ENST00000374784.5 |
NTM
|
neurotrimin |
| chr2_-_159616442 | 0.46 |
ENST00000541068.6
ENST00000392783.7 ENST00000392782.5 |
BAZ2B
|
bromodomain adjacent to zinc finger domain 2B |
| chr16_+_6019585 | 0.46 |
ENST00000547372.5
|
RBFOX1
|
RNA binding fox-1 homolog 1 |
| chr17_-_64390852 | 0.46 |
ENST00000563924.6
|
PECAM1
|
platelet and endothelial cell adhesion molecule 1 |
| chr11_-_82997394 | 0.45 |
ENST00000525117.5
ENST00000532548.5 |
RAB30
|
RAB30, member RAS oncogene family |
| chrX_+_100584928 | 0.45 |
ENST00000373031.5
|
TNMD
|
tenomodulin |
| chr5_-_138338325 | 0.45 |
ENST00000510119.1
ENST00000513970.5 |
CDC25C
|
cell division cycle 25C |
| chr8_-_115661667 | 0.44 |
ENST00000395713.6
|
TRPS1
|
transcriptional repressor GATA binding 1 |
| chr3_-_183400538 | 0.44 |
ENST00000640043.1
|
MCF2L2
|
MCF.2 cell line derived transforming sequence-like 2 |
| chr8_+_24294044 | 0.44 |
ENST00000265769.9
|
ADAM28
|
ADAM metallopeptidase domain 28 |
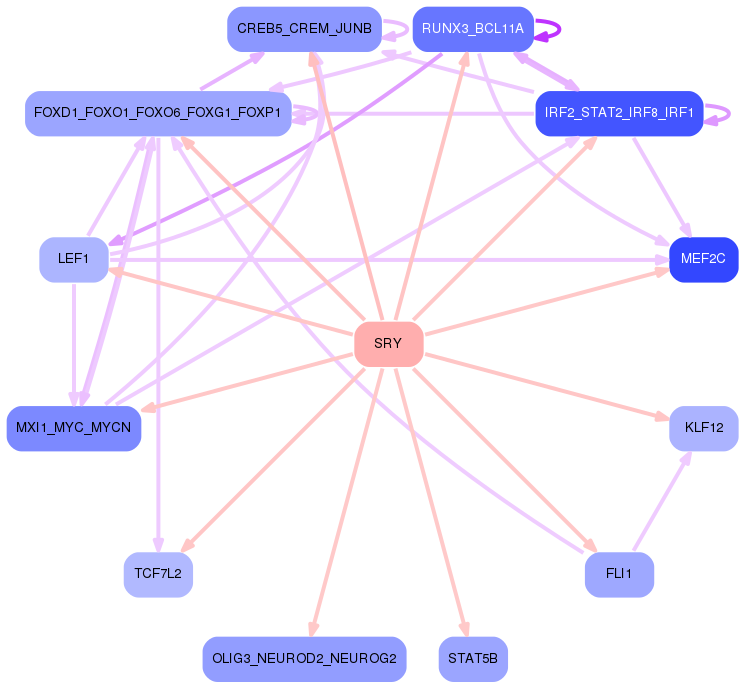
Network of associatons between targets according to the STRING database.

First level regulatory network of SRY
Gene Ontology Analysis
Gene overrepresentation in biological process category:
| Log-likelihood per target | Total log-likelihood | Term | Description |
|---|---|---|---|
| 1.7 | 5.0 | GO:1900149 | positive regulation of Schwann cell migration(GO:1900149) regulation of Schwann cell chemotaxis(GO:1904266) positive regulation of Schwann cell chemotaxis(GO:1904268) Schwann cell chemotaxis(GO:1990751) |
| 0.7 | 2.8 | GO:0038060 | nitric oxide-cGMP-mediated signaling pathway(GO:0038060) |
| 0.7 | 2.0 | GO:0002305 | gamma-delta intraepithelial T cell differentiation(GO:0002304) CD8-positive, gamma-delta intraepithelial T cell differentiation(GO:0002305) |
| 0.7 | 6.5 | GO:0097338 | response to clozapine(GO:0097338) |
| 0.6 | 3.6 | GO:1900220 | semaphorin-plexin signaling pathway involved in bone trabecula morphogenesis(GO:1900220) |
| 0.5 | 4.1 | GO:0045607 | regulation of auditory receptor cell differentiation(GO:0045607) regulation of mechanoreceptor differentiation(GO:0045631) regulation of inner ear receptor cell differentiation(GO:2000980) |
| 0.5 | 3.0 | GO:0010897 | negative regulation of triglyceride catabolic process(GO:0010897) |
| 0.5 | 1.4 | GO:0033364 | mast cell secretory granule organization(GO:0033364) |
| 0.4 | 6.5 | GO:0030050 | vesicle transport along actin filament(GO:0030050) |
| 0.4 | 1.2 | GO:0044725 | chromatin reprogramming in the zygote(GO:0044725) |
| 0.4 | 2.5 | GO:0061153 | trachea submucosa development(GO:0061152) trachea gland development(GO:0061153) |
| 0.3 | 1.9 | GO:0072011 | glomerular endothelium development(GO:0072011) |
| 0.3 | 1.6 | GO:0021993 | initiation of neural tube closure(GO:0021993) |
| 0.3 | 3.2 | GO:0038145 | macrophage colony-stimulating factor signaling pathway(GO:0038145) |
| 0.3 | 1.6 | GO:2000173 | regulation of neuron remodeling(GO:1904799) negative regulation of neuron remodeling(GO:1904800) negative regulation of branching morphogenesis of a nerve(GO:2000173) |
| 0.3 | 2.3 | GO:0035696 | monocyte extravasation(GO:0035696) |
| 0.3 | 7.1 | GO:0070262 | peptidyl-serine dephosphorylation(GO:0070262) |
| 0.2 | 1.7 | GO:1903435 | positive regulation of constitutive secretory pathway(GO:1903435) |
| 0.2 | 0.9 | GO:0060922 | atrioventricular node development(GO:0003162) cardiac septum cell differentiation(GO:0003292) atrioventricular node cell differentiation(GO:0060922) atrioventricular node cell development(GO:0060928) |
| 0.2 | 0.9 | GO:0045355 | negative regulation of interferon-alpha biosynthetic process(GO:0045355) positive regulation of protein K48-linked ubiquitination(GO:1902524) |
| 0.2 | 0.9 | GO:0046292 | formaldehyde metabolic process(GO:0046292) |
| 0.2 | 0.8 | GO:0002904 | positive regulation of B cell apoptotic process(GO:0002904) |
| 0.2 | 0.6 | GO:0021524 | visceral motor neuron differentiation(GO:0021524) |
| 0.2 | 1.5 | GO:0035234 | ectopic germ cell programmed cell death(GO:0035234) |
| 0.2 | 2.5 | GO:0072564 | response to linoleic acid(GO:0070543) blood microparticle formation(GO:0072564) regulation of blood microparticle formation(GO:2000332) positive regulation of blood microparticle formation(GO:2000334) |
| 0.2 | 1.3 | GO:0042539 | hypotonic salinity response(GO:0042539) cellular hypotonic salinity response(GO:0071477) |
| 0.2 | 3.6 | GO:0003402 | planar cell polarity pathway involved in axis elongation(GO:0003402) |
| 0.2 | 5.0 | GO:0030277 | maintenance of gastrointestinal epithelium(GO:0030277) |
| 0.2 | 0.7 | GO:2000297 | negative regulation of synapse maturation(GO:2000297) |
| 0.2 | 0.8 | GO:1903613 | regulation of protein tyrosine phosphatase activity(GO:1903613) positive regulation of protein tyrosine phosphatase activity(GO:1903615) |
| 0.2 | 2.1 | GO:1902748 | melanocyte migration(GO:0097324) positive regulation of lens fiber cell differentiation(GO:1902748) |
| 0.2 | 1.0 | GO:0034721 | negative regulation of histone deacetylation(GO:0031064) histone H3-K4 demethylation, trimethyl-H3-K4-specific(GO:0034721) |
| 0.1 | 0.4 | GO:0035990 | tendon cell differentiation(GO:0035990) tendon formation(GO:0035992) |
| 0.1 | 0.6 | GO:0006556 | S-adenosylmethionine biosynthetic process(GO:0006556) |
| 0.1 | 0.7 | GO:0048388 | endosomal lumen acidification(GO:0048388) |
| 0.1 | 1.0 | GO:0090625 | mRNA cleavage involved in gene silencing by siRNA(GO:0090625) |
| 0.1 | 0.5 | GO:0014724 | regulation of twitch skeletal muscle contraction(GO:0014724) |
| 0.1 | 1.4 | GO:0003172 | primary heart field specification(GO:0003138) sinoatrial valve development(GO:0003172) sinoatrial valve morphogenesis(GO:0003185) |
| 0.1 | 0.6 | GO:0016240 | autophagosome docking(GO:0016240) |
| 0.1 | 2.3 | GO:0032625 | interleukin-21 production(GO:0032625) interleukin-21 secretion(GO:0072619) |
| 0.1 | 0.7 | GO:0045588 | positive regulation of gamma-delta T cell differentiation(GO:0045588) |
| 0.1 | 0.9 | GO:0060023 | soft palate development(GO:0060023) |
| 0.1 | 7.2 | GO:0006376 | mRNA splice site selection(GO:0006376) |
| 0.1 | 1.3 | GO:0030951 | establishment or maintenance of microtubule cytoskeleton polarity(GO:0030951) |
| 0.1 | 1.3 | GO:0048625 | myoblast fate commitment(GO:0048625) |
| 0.1 | 0.3 | GO:0021530 | spinal cord oligodendrocyte cell differentiation(GO:0021529) spinal cord oligodendrocyte cell fate specification(GO:0021530) |
| 0.1 | 1.3 | GO:0016198 | axon choice point recognition(GO:0016198) |
| 0.1 | 0.3 | GO:0097198 | histone H3-K36 trimethylation(GO:0097198) |
| 0.1 | 0.8 | GO:0009597 | detection of virus(GO:0009597) |
| 0.1 | 1.0 | GO:0090204 | protein localization to nuclear pore(GO:0090204) |
| 0.1 | 3.5 | GO:1904886 | beta-catenin destruction complex disassembly(GO:1904886) |
| 0.1 | 0.8 | GO:0006848 | pyruvate transport(GO:0006848) pyruvate transmembrane transport(GO:1901475) |
| 0.1 | 0.6 | GO:0006049 | UDP-N-acetylglucosamine catabolic process(GO:0006049) |
| 0.1 | 1.4 | GO:0048096 | chromatin-mediated maintenance of transcription(GO:0048096) |
| 0.1 | 0.8 | GO:0098700 | neurotransmitter loading into synaptic vesicle(GO:0098700) |
| 0.1 | 0.4 | GO:0018076 | N-terminal peptidyl-lysine acetylation(GO:0018076) |
| 0.1 | 0.5 | GO:0010157 | response to chlorate(GO:0010157) |
| 0.1 | 0.8 | GO:0000821 | regulation of arginine metabolic process(GO:0000821) |
| 0.1 | 1.1 | GO:1903690 | negative regulation of wound healing, spreading of epidermal cells(GO:1903690) |
| 0.1 | 0.4 | GO:2000653 | regulation of genetic imprinting(GO:2000653) |
| 0.1 | 2.1 | GO:0035855 | megakaryocyte development(GO:0035855) |
| 0.1 | 1.0 | GO:0045974 | miRNA mediated inhibition of translation(GO:0035278) negative regulation of translation, ncRNA-mediated(GO:0040033) regulation of translation, ncRNA-mediated(GO:0045974) |
| 0.1 | 0.3 | GO:0002399 | MHC class II protein complex assembly(GO:0002399) |
| 0.1 | 2.4 | GO:0097094 | craniofacial suture morphogenesis(GO:0097094) |
| 0.1 | 0.2 | GO:0006097 | glyoxylate cycle(GO:0006097) |
| 0.1 | 1.2 | GO:0043983 | histone H4-K12 acetylation(GO:0043983) |
| 0.1 | 1.7 | GO:0071803 | positive regulation of podosome assembly(GO:0071803) |
| 0.1 | 0.7 | GO:0006335 | DNA replication-dependent nucleosome assembly(GO:0006335) DNA replication-dependent nucleosome organization(GO:0034723) |
| 0.1 | 0.5 | GO:0046952 | ketone body catabolic process(GO:0046952) |
| 0.1 | 0.7 | GO:0032525 | somite rostral/caudal axis specification(GO:0032525) |
| 0.1 | 0.5 | GO:0007296 | vitellogenesis(GO:0007296) |
| 0.1 | 0.3 | GO:0090149 | mitochondrial membrane fission(GO:0090149) |
| 0.1 | 1.9 | GO:0007597 | blood coagulation, intrinsic pathway(GO:0007597) |
| 0.1 | 0.9 | GO:1902916 | positive regulation of protein polyubiquitination(GO:1902916) |
| 0.1 | 0.4 | GO:0090074 | negative regulation of protein homodimerization activity(GO:0090074) |
| 0.1 | 0.8 | GO:0021527 | spinal cord association neuron differentiation(GO:0021527) |
| 0.1 | 1.0 | GO:0007253 | cytoplasmic sequestering of NF-kappaB(GO:0007253) |
| 0.1 | 0.9 | GO:0032876 | negative regulation of DNA endoreduplication(GO:0032876) |
| 0.1 | 0.5 | GO:0045039 | protein import into mitochondrial inner membrane(GO:0045039) |
| 0.1 | 0.7 | GO:1902414 | protein localization to cell junction(GO:1902414) |
| 0.1 | 0.8 | GO:1901898 | negative regulation of relaxation of muscle(GO:1901078) negative regulation of relaxation of cardiac muscle(GO:1901898) |
| 0.1 | 0.4 | GO:1903288 | positive regulation of potassium ion import(GO:1903288) |
| 0.0 | 0.1 | GO:0035262 | gonad morphogenesis(GO:0035262) |
| 0.0 | 0.3 | GO:0021797 | forebrain anterior/posterior pattern specification(GO:0021797) |
| 0.0 | 0.6 | GO:2000645 | negative regulation of receptor catabolic process(GO:2000645) |
| 0.0 | 0.7 | GO:0006707 | cholesterol catabolic process(GO:0006707) sterol catabolic process(GO:0016127) |
| 0.0 | 0.4 | GO:0060125 | negative regulation of growth hormone secretion(GO:0060125) |
| 0.0 | 0.5 | GO:0006701 | progesterone biosynthetic process(GO:0006701) |
| 0.0 | 0.2 | GO:0005988 | lactose metabolic process(GO:0005988) lactose biosynthetic process(GO:0005989) |
| 0.0 | 0.2 | GO:0002528 | regulation of vascular permeability involved in acute inflammatory response(GO:0002528) |
| 0.0 | 0.5 | GO:0006657 | CDP-choline pathway(GO:0006657) |
| 0.0 | 0.5 | GO:0006682 | galactosylceramide biosynthetic process(GO:0006682) galactolipid biosynthetic process(GO:0019375) |
| 0.0 | 0.6 | GO:0015014 | heparan sulfate proteoglycan biosynthetic process, polysaccharide chain biosynthetic process(GO:0015014) |
| 0.0 | 1.1 | GO:0042994 | cytoplasmic sequestering of transcription factor(GO:0042994) |
| 0.0 | 0.2 | GO:0035947 | regulation of gluconeogenesis by regulation of transcription from RNA polymerase II promoter(GO:0035947) |
| 0.0 | 0.1 | GO:0008057 | eye pigment granule organization(GO:0008057) |
| 0.0 | 0.3 | GO:1903936 | cellular response to sodium arsenite(GO:1903936) |
| 0.0 | 0.8 | GO:0038203 | TORC2 signaling(GO:0038203) |
| 0.0 | 0.4 | GO:0043951 | negative regulation of cAMP-mediated signaling(GO:0043951) |
| 0.0 | 0.6 | GO:0097105 | presynaptic membrane assembly(GO:0097105) |
| 0.0 | 0.5 | GO:1990416 | cellular response to brain-derived neurotrophic factor stimulus(GO:1990416) |
| 0.0 | 0.5 | GO:0006685 | sphingomyelin catabolic process(GO:0006685) |
| 0.0 | 0.7 | GO:0090292 | nuclear matrix anchoring at nuclear membrane(GO:0090292) |
| 0.0 | 0.3 | GO:2000210 | positive regulation of anoikis(GO:2000210) |
| 0.0 | 0.2 | GO:0010587 | miRNA catabolic process(GO:0010587) |
| 0.0 | 0.2 | GO:2000158 | positive regulation of ubiquitin-specific protease activity(GO:2000158) |
| 0.0 | 0.1 | GO:1904017 | cellular response to Thyroglobulin triiodothyronine(GO:1904017) |
| 0.0 | 0.4 | GO:0000414 | regulation of histone H3-K36 methylation(GO:0000414) |
| 0.0 | 0.3 | GO:0072660 | maintenance of protein location in membrane(GO:0072658) maintenance of protein location in plasma membrane(GO:0072660) positive regulation of membrane depolarization during cardiac muscle cell action potential(GO:1900827) |
| 0.0 | 0.6 | GO:0070544 | histone H3-K36 demethylation(GO:0070544) |
| 0.0 | 0.5 | GO:0015871 | choline transport(GO:0015871) |
| 0.0 | 0.6 | GO:2000480 | negative regulation of cAMP-dependent protein kinase activity(GO:2000480) |
| 0.0 | 1.1 | GO:0048665 | neuron fate specification(GO:0048665) |
| 0.0 | 5.1 | GO:0060333 | interferon-gamma-mediated signaling pathway(GO:0060333) |
| 0.0 | 1.5 | GO:0050650 | chondroitin sulfate proteoglycan biosynthetic process(GO:0050650) |
| 0.0 | 0.2 | GO:1990737 | response to manganese-induced endoplasmic reticulum stress(GO:1990737) |
| 0.0 | 0.2 | GO:0033353 | S-adenosylmethionine cycle(GO:0033353) |
| 0.0 | 1.3 | GO:0071526 | semaphorin-plexin signaling pathway(GO:0071526) |
| 0.0 | 0.5 | GO:0046085 | adenosine metabolic process(GO:0046085) |
| 0.0 | 0.4 | GO:0070307 | lens fiber cell development(GO:0070307) |
| 0.0 | 0.1 | GO:0033386 | geranylgeranyl diphosphate metabolic process(GO:0033385) geranylgeranyl diphosphate biosynthetic process(GO:0033386) |
| 0.0 | 0.4 | GO:0001711 | endodermal cell fate commitment(GO:0001711) histone H2B ubiquitination(GO:0033523) |
| 0.0 | 0.1 | GO:0042245 | RNA repair(GO:0042245) |
| 0.0 | 0.6 | GO:0060575 | intestinal epithelial cell differentiation(GO:0060575) |
| 0.0 | 0.8 | GO:1903963 | arachidonic acid secretion(GO:0050482) arachidonate transport(GO:1903963) |
| 0.0 | 0.6 | GO:0097320 | membrane tubulation(GO:0097320) |
| 0.0 | 0.5 | GO:0043968 | histone H2A acetylation(GO:0043968) |
| 0.0 | 0.2 | GO:1904936 | cerebral cortex GABAergic interneuron migration(GO:0021853) interneuron migration(GO:1904936) |
| 0.0 | 0.7 | GO:0007158 | neuron cell-cell adhesion(GO:0007158) |
| 0.0 | 0.1 | GO:0071043 | exonucleolytic trimming involved in rRNA processing(GO:0000459) exonucleolytic trimming to generate mature 3'-end of 5.8S rRNA from tricistronic rRNA transcript (SSU-rRNA, 5.8S rRNA, LSU-rRNA)(GO:0000467) CUT catabolic process(GO:0071034) nuclear polyadenylation-dependent tRNA catabolic process(GO:0071038) CUT metabolic process(GO:0071043) |
| 0.0 | 0.8 | GO:0043984 | histone H4-K16 acetylation(GO:0043984) |
| 0.0 | 0.4 | GO:0043923 | positive regulation by host of viral transcription(GO:0043923) |
| 0.0 | 0.4 | GO:0010991 | negative regulation of SMAD protein complex assembly(GO:0010991) |
| 0.0 | 0.6 | GO:0031581 | hemidesmosome assembly(GO:0031581) |
| 0.0 | 1.8 | GO:0072431 | DNA damage response, signal transduction by p53 class mediator resulting in cell cycle arrest(GO:0006977) signal transduction involved in mitotic G1 DNA damage checkpoint(GO:0072431) intracellular signal transduction involved in G1 DNA damage checkpoint(GO:1902400) |
| 0.0 | 0.7 | GO:0007143 | female meiotic division(GO:0007143) |
| 0.0 | 0.8 | GO:1904837 | beta-catenin-TCF complex assembly(GO:1904837) |
| 0.0 | 0.2 | GO:0008343 | adult feeding behavior(GO:0008343) |
| 0.0 | 0.7 | GO:1900271 | regulation of long-term synaptic potentiation(GO:1900271) |
| 0.0 | 0.2 | GO:0042670 | retinal cone cell differentiation(GO:0042670) retinal cone cell development(GO:0046549) |
| 0.0 | 0.1 | GO:0070213 | protein auto-ADP-ribosylation(GO:0070213) |
| 0.0 | 0.5 | GO:0008038 | neuron recognition(GO:0008038) |
| 0.0 | 1.2 | GO:0035722 | interleukin-12-mediated signaling pathway(GO:0035722) cellular response to interleukin-12(GO:0071349) |
| 0.0 | 1.1 | GO:0006611 | protein export from nucleus(GO:0006611) |
| 0.0 | 0.8 | GO:0007274 | neuromuscular synaptic transmission(GO:0007274) |
| 0.0 | 0.5 | GO:0005980 | glycogen catabolic process(GO:0005980) |
| 0.0 | 0.6 | GO:0030890 | positive regulation of B cell proliferation(GO:0030890) |
| 0.0 | 0.2 | GO:0006451 | selenocysteine incorporation(GO:0001514) translational readthrough(GO:0006451) |
| 0.0 | 0.5 | GO:0051482 | positive regulation of cytosolic calcium ion concentration involved in phospholipase C-activating G-protein coupled signaling pathway(GO:0051482) |
| 0.0 | 0.4 | GO:0042462 | eye photoreceptor cell development(GO:0042462) |
Gene overrepresentation in cellular component category:
| Log-likelihood per target | Total log-likelihood | Term | Description |
|---|---|---|---|
| 0.7 | 3.0 | GO:0005944 | phosphatidylinositol 3-kinase complex, class IB(GO:0005944) |
| 0.4 | 3.2 | GO:1990682 | CSF1-CSF1R complex(GO:1990682) |
| 0.2 | 6.5 | GO:0005952 | cAMP-dependent protein kinase complex(GO:0005952) |
| 0.2 | 0.9 | GO:0097629 | extrinsic component of omegasome membrane(GO:0097629) |
| 0.2 | 2.0 | GO:0032584 | growth cone membrane(GO:0032584) |
| 0.2 | 0.6 | GO:0048269 | methionine adenosyltransferase complex(GO:0048269) |
| 0.2 | 3.6 | GO:1990907 | beta-catenin-TCF complex(GO:1990907) |
| 0.2 | 3.6 | GO:0036057 | filtration diaphragm(GO:0036056) slit diaphragm(GO:0036057) |
| 0.2 | 0.5 | GO:0034657 | GID complex(GO:0034657) |
| 0.1 | 7.1 | GO:0000159 | protein phosphatase type 2A complex(GO:0000159) |
| 0.1 | 0.7 | GO:0033186 | CAF-1 complex(GO:0033186) |
| 0.1 | 1.2 | GO:0005638 | lamin filament(GO:0005638) |
| 0.1 | 1.2 | GO:0001940 | male pronucleus(GO:0001940) |
| 0.1 | 1.0 | GO:0019907 | cyclin-dependent protein kinase activating kinase holoenzyme complex(GO:0019907) |
| 0.1 | 1.7 | GO:0033093 | Weibel-Palade body(GO:0033093) |
| 0.1 | 4.4 | GO:0031092 | platelet alpha granule membrane(GO:0031092) |
| 0.1 | 3.9 | GO:0044295 | axonal growth cone(GO:0044295) |
| 0.1 | 1.1 | GO:0005828 | kinetochore microtubule(GO:0005828) |
| 0.1 | 0.5 | GO:0042721 | mitochondrial inner membrane protein insertion complex(GO:0042721) |
| 0.1 | 0.9 | GO:0002193 | MAML1-RBP-Jkappa- ICN1 complex(GO:0002193) |
| 0.1 | 2.2 | GO:0000930 | gamma-tubulin complex(GO:0000930) |
| 0.1 | 1.0 | GO:0035068 | micro-ribonucleoprotein complex(GO:0035068) |
| 0.1 | 0.2 | GO:0033290 | eukaryotic 48S preinitiation complex(GO:0033290) translation initiation ternary complex(GO:0044207) |
| 0.1 | 0.8 | GO:0072487 | MSL complex(GO:0072487) |
| 0.1 | 0.5 | GO:0032777 | Piccolo NuA4 histone acetyltransferase complex(GO:0032777) |
| 0.1 | 1.4 | GO:0042588 | zymogen granule(GO:0042588) |
| 0.0 | 0.8 | GO:0000940 | condensed chromosome outer kinetochore(GO:0000940) |
| 0.0 | 1.7 | GO:0001891 | phagocytic cup(GO:0001891) |
| 0.0 | 2.8 | GO:0030673 | axolemma(GO:0030673) |
| 0.0 | 1.8 | GO:0071565 | nBAF complex(GO:0071565) |
| 0.0 | 0.5 | GO:0016593 | Cdc73/Paf1 complex(GO:0016593) |
| 0.0 | 0.4 | GO:0097651 | phosphatidylinositol 3-kinase complex, class I(GO:0097651) |
| 0.0 | 0.5 | GO:0000137 | Golgi cis cisterna(GO:0000137) |
| 0.0 | 0.9 | GO:0001518 | voltage-gated sodium channel complex(GO:0001518) |
| 0.0 | 0.5 | GO:0030008 | TRAPP complex(GO:0030008) |
| 0.0 | 0.8 | GO:0031932 | TORC2 complex(GO:0031932) |
| 0.0 | 0.7 | GO:0034993 | microtubule organizing center attachment site(GO:0034992) LINC complex(GO:0034993) |
| 0.0 | 0.5 | GO:0016281 | eukaryotic translation initiation factor 4F complex(GO:0016281) |
| 0.0 | 0.4 | GO:0005890 | sodium:potassium-exchanging ATPase complex(GO:0005890) |
| 0.0 | 1.7 | GO:0001917 | photoreceptor inner segment(GO:0001917) |
| 0.0 | 0.6 | GO:0005671 | Ada2/Gcn5/Ada3 transcription activator complex(GO:0005671) |
| 0.0 | 0.6 | GO:0032982 | myosin filament(GO:0032982) |
| 0.0 | 0.6 | GO:0005922 | connexon complex(GO:0005922) |
| 0.0 | 0.5 | GO:0044232 | organelle membrane contact site(GO:0044232) |
| 0.0 | 1.9 | GO:0000123 | histone acetyltransferase complex(GO:0000123) |
| 0.0 | 6.1 | GO:0043209 | myelin sheath(GO:0043209) |
| 0.0 | 0.3 | GO:0042613 | MHC class II protein complex(GO:0042613) |
| 0.0 | 0.2 | GO:0016602 | CCAAT-binding factor complex(GO:0016602) |
| 0.0 | 1.0 | GO:1990391 | DNA repair complex(GO:1990391) |
| 0.0 | 0.3 | GO:0070937 | CRD-mediated mRNA stability complex(GO:0070937) |
| 0.0 | 1.1 | GO:0031519 | PcG protein complex(GO:0031519) |
| 0.0 | 0.3 | GO:0033268 | node of Ranvier(GO:0033268) |
| 0.0 | 0.8 | GO:0005801 | cis-Golgi network(GO:0005801) |
Gene overrepresentation in molecular function category:
| Log-likelihood per target | Total log-likelihood | Term | Description |
|---|---|---|---|
| 0.8 | 3.2 | GO:0005011 | macrophage colony-stimulating factor receptor activity(GO:0005011) |
| 0.3 | 6.5 | GO:0019911 | structural constituent of myelin sheath(GO:0019911) |
| 0.3 | 3.6 | GO:0070699 | type II activin receptor binding(GO:0070699) |
| 0.3 | 6.5 | GO:0004691 | cAMP-dependent protein kinase activity(GO:0004691) |
| 0.2 | 1.5 | GO:0015018 | galactosylgalactosylxylosylprotein 3-beta-glucuronosyltransferase activity(GO:0015018) |
| 0.2 | 1.2 | GO:0070579 | methylcytosine dioxygenase activity(GO:0070579) |
| 0.2 | 3.1 | GO:0035005 | 1-phosphatidylinositol-4-phosphate 3-kinase activity(GO:0035005) |
| 0.2 | 2.5 | GO:0070892 | lipoteichoic acid receptor activity(GO:0070892) |
| 0.2 | 0.8 | GO:0005477 | pyruvate secondary active transmembrane transporter activity(GO:0005477) |
| 0.2 | 1.8 | GO:0035727 | lysophosphatidic acid binding(GO:0035727) |
| 0.2 | 0.7 | GO:0072320 | volume-sensitive chloride channel activity(GO:0072320) |
| 0.2 | 1.0 | GO:0034647 | histone demethylase activity (H3-trimethyl-K4 specific)(GO:0034647) |
| 0.2 | 0.5 | GO:0050146 | nucleoside phosphotransferase activity(GO:0050146) |
| 0.2 | 2.5 | GO:0030284 | estrogen receptor activity(GO:0030284) |
| 0.1 | 3.6 | GO:0030215 | semaphorin receptor binding(GO:0030215) |
| 0.1 | 0.8 | GO:0042030 | ATPase inhibitor activity(GO:0042030) |
| 0.1 | 0.5 | GO:0008260 | 3-oxoacid CoA-transferase activity(GO:0008260) |
| 0.1 | 6.0 | GO:0030676 | Rac guanyl-nucleotide exchange factor activity(GO:0030676) |
| 0.1 | 7.5 | GO:0036002 | pre-mRNA binding(GO:0036002) |
| 0.1 | 0.5 | GO:0004105 | choline-phosphate cytidylyltransferase activity(GO:0004105) |
| 0.1 | 1.8 | GO:0017154 | semaphorin receptor activity(GO:0017154) |
| 0.1 | 2.2 | GO:0051864 | histone demethylase activity (H3-K36 specific)(GO:0051864) |
| 0.1 | 0.6 | GO:0003827 | alpha-1,3-mannosylglycoprotein 2-beta-N-acetylglucosaminyltransferase activity(GO:0003827) |
| 0.1 | 1.3 | GO:0022820 | potassium:chloride symporter activity(GO:0015379) potassium ion symporter activity(GO:0022820) |
| 0.1 | 2.5 | GO:0035198 | miRNA binding(GO:0035198) |
| 0.1 | 2.8 | GO:0005251 | delayed rectifier potassium channel activity(GO:0005251) |
| 0.1 | 0.4 | GO:0004157 | dihydropyrimidinase activity(GO:0004157) |
| 0.1 | 0.2 | GO:0051990 | isocitrate dehydrogenase (NADP+) activity(GO:0004450) (R)-2-hydroxyglutarate dehydrogenase activity(GO:0051990) |
| 0.1 | 0.6 | GO:0042328 | heparan sulfate N-acetylglucosaminyltransferase activity(GO:0042328) |
| 0.1 | 0.9 | GO:0032454 | histone demethylase activity (H3-K9 specific)(GO:0032454) |
| 0.1 | 0.5 | GO:0005119 | smoothened binding(GO:0005119) hedgehog family protein binding(GO:0097108) |
| 0.1 | 3.0 | GO:0017091 | AU-rich element binding(GO:0017091) |
| 0.1 | 0.5 | GO:0015220 | choline transmembrane transporter activity(GO:0015220) |
| 0.1 | 1.3 | GO:0070016 | armadillo repeat domain binding(GO:0070016) |
| 0.1 | 0.7 | GO:0001162 | RNA polymerase II intronic transcription regulatory region sequence-specific DNA binding(GO:0001162) |
| 0.1 | 1.1 | GO:0005049 | nuclear export signal receptor activity(GO:0005049) |
| 0.1 | 7.1 | GO:0004722 | protein serine/threonine phosphatase activity(GO:0004722) |
| 0.1 | 1.7 | GO:0031489 | myosin V binding(GO:0031489) |
| 0.0 | 0.7 | GO:0046790 | virion binding(GO:0046790) |
| 0.0 | 0.8 | GO:0015194 | L-serine transmembrane transporter activity(GO:0015194) serine transmembrane transporter activity(GO:0022889) |
| 0.0 | 0.4 | GO:0050815 | phosphoserine binding(GO:0050815) |
| 0.0 | 0.5 | GO:0090599 | alpha-glucosidase activity(GO:0090599) |
| 0.0 | 1.5 | GO:0097200 | cysteine-type endopeptidase activity involved in execution phase of apoptosis(GO:0097200) |
| 0.0 | 0.6 | GO:0046975 | histone methyltransferase activity (H3-K36 specific)(GO:0046975) |
| 0.0 | 0.5 | GO:0004767 | sphingomyelin phosphodiesterase activity(GO:0004767) |
| 0.0 | 0.6 | GO:0030274 | LIM domain binding(GO:0030274) |
| 0.0 | 0.3 | GO:0043426 | MRF binding(GO:0043426) |
| 0.0 | 0.4 | GO:0005078 | MAP-kinase scaffold activity(GO:0005078) |
| 0.0 | 0.2 | GO:0004461 | lactose synthase activity(GO:0004461) |
| 0.0 | 0.3 | GO:0005223 | intracellular cGMP activated cation channel activity(GO:0005223) |
| 0.0 | 1.6 | GO:0051010 | microtubule plus-end binding(GO:0051010) |
| 0.0 | 0.8 | GO:0015174 | basic amino acid transmembrane transporter activity(GO:0015174) |
| 0.0 | 0.2 | GO:0035800 | deubiquitinase activator activity(GO:0035800) |
| 0.0 | 2.5 | GO:0070412 | R-SMAD binding(GO:0070412) |
| 0.0 | 1.2 | GO:0042605 | peptide antigen binding(GO:0042605) |
| 0.0 | 0.2 | GO:0016802 | adenosylhomocysteinase activity(GO:0004013) trialkylsulfonium hydrolase activity(GO:0016802) |
| 0.0 | 1.2 | GO:0043274 | phospholipase binding(GO:0043274) |
| 0.0 | 0.6 | GO:0019966 | interleukin-1 binding(GO:0019966) |
| 0.0 | 0.5 | GO:0052629 | phosphatidylinositol-3,5-bisphosphate 3-phosphatase activity(GO:0052629) |
| 0.0 | 0.2 | GO:0004800 | thyroxine 5'-deiodinase activity(GO:0004800) |
| 0.0 | 0.6 | GO:0005243 | gap junction channel activity(GO:0005243) |
| 0.0 | 1.6 | GO:0061631 | ubiquitin conjugating enzyme activity(GO:0061631) |
| 0.0 | 1.3 | GO:1990841 | promoter-specific chromatin binding(GO:1990841) |
| 0.0 | 0.8 | GO:0005313 | L-glutamate transmembrane transporter activity(GO:0005313) acidic amino acid transmembrane transporter activity(GO:0015172) |
| 0.0 | 0.7 | GO:0008190 | eukaryotic initiation factor 4E binding(GO:0008190) |
| 0.0 | 3.2 | GO:0001618 | virus receptor activity(GO:0001618) |
| 0.0 | 0.7 | GO:0005212 | structural constituent of eye lens(GO:0005212) |
| 0.0 | 0.9 | GO:1905030 | voltage-gated sodium channel activity(GO:0005248) voltage-gated ion channel activity involved in regulation of postsynaptic membrane potential(GO:1905030) |
| 0.0 | 1.7 | GO:0001786 | phosphatidylserine binding(GO:0001786) |
| 0.0 | 1.0 | GO:0030159 | receptor signaling complex scaffold activity(GO:0030159) |
| 0.0 | 0.8 | GO:0016805 | dipeptidase activity(GO:0016805) |
| 0.0 | 0.7 | GO:0008301 | DNA binding, bending(GO:0008301) |
| 0.0 | 0.6 | GO:0034236 | protein kinase A catalytic subunit binding(GO:0034236) |
| 0.0 | 0.5 | GO:0008499 | UDP-galactose:beta-N-acetylglucosamine beta-1,3-galactosyltransferase activity(GO:0008499) |
| 0.0 | 0.5 | GO:0030898 | actin-dependent ATPase activity(GO:0030898) |
| 0.0 | 2.3 | GO:0043621 | protein self-association(GO:0043621) |
| 0.0 | 0.8 | GO:0004623 | phospholipase A2 activity(GO:0004623) |
| 0.0 | 0.3 | GO:0022851 | GABA-gated chloride ion channel activity(GO:0022851) |
| 0.0 | 0.4 | GO:0005391 | sodium:potassium-exchanging ATPase activity(GO:0005391) |
| 0.0 | 3.0 | GO:0001158 | enhancer sequence-specific DNA binding(GO:0001158) |
| 0.0 | 0.5 | GO:0017127 | cholesterol transporter activity(GO:0017127) |
| 0.0 | 0.7 | GO:0005521 | lamin binding(GO:0005521) |
| 0.0 | 0.1 | GO:0035514 | DNA demethylase activity(GO:0035514) DNA-N1-methyladenine dioxygenase activity(GO:0043734) |
| 0.0 | 0.8 | GO:0004115 | 3',5'-cyclic-AMP phosphodiesterase activity(GO:0004115) |
| 0.0 | 0.5 | GO:0070577 | lysine-acetylated histone binding(GO:0070577) |
| 0.0 | 0.1 | GO:0004161 | dimethylallyltranstransferase activity(GO:0004161) geranyltranstransferase activity(GO:0004337) |
| 0.0 | 0.1 | GO:0030267 | hydroxypyruvate reductase activity(GO:0016618) glyoxylate reductase (NADP) activity(GO:0030267) |
| 0.0 | 1.8 | GO:0005070 | SH3/SH2 adaptor activity(GO:0005070) |
| 0.0 | 0.1 | GO:0004977 | melanocortin receptor activity(GO:0004977) |
| 0.0 | 0.2 | GO:0031432 | titin binding(GO:0031432) |
| 0.0 | 1.0 | GO:0032947 | protein complex scaffold(GO:0032947) |
Gene overrepresentation in curated gene sets: canonical pathways category:
| Log-likelihood per target | Total log-likelihood | Term | Description |
|---|---|---|---|
| 0.1 | 5.4 | PID ARF6 DOWNSTREAM PATHWAY | Arf6 downstream pathway |
| 0.1 | 7.6 | PID IL3 PATHWAY | IL3-mediated signaling events |
| 0.1 | 7.7 | PID ATR PATHWAY | ATR signaling pathway |
| 0.1 | 3.5 | PID IL8 CXCR1 PATHWAY | IL8- and CXCR1-mediated signaling events |
| 0.1 | 2.5 | ST G ALPHA S PATHWAY | G alpha s Pathway |
| 0.0 | 1.3 | PID TCR JNK PATHWAY | JNK signaling in the CD4+ TCR pathway |
| 0.0 | 1.3 | SA PTEN PATHWAY | PTEN is a tumor suppressor that dephosphorylates the lipid messenger phosphatidylinositol triphosphate. |
| 0.0 | 3.5 | PID ERBB1 INTERNALIZATION PATHWAY | Internalization of ErbB1 |
| 0.0 | 2.7 | PID TCPTP PATHWAY | Signaling events mediated by TCPTP |
| 0.0 | 4.0 | PID FGF PATHWAY | FGF signaling pathway |
| 0.0 | 1.3 | PID NCADHERIN PATHWAY | N-cadherin signaling events |
| 0.0 | 0.5 | PID CERAMIDE PATHWAY | Ceramide signaling pathway |
| 0.0 | 4.4 | WNT SIGNALING | Genes related to Wnt-mediated signal transduction |
| 0.0 | 1.9 | PID INTEGRIN3 PATHWAY | Beta3 integrin cell surface interactions |
| 0.0 | 0.6 | SA B CELL RECEPTOR COMPLEXES | Antigen binding to B cell receptors activates protein tyrosine kinases, such as the Src family, which ultimate activate MAP kinases. |
| 0.0 | 0.5 | PID LPA4 PATHWAY | LPA4-mediated signaling events |
| 0.0 | 1.4 | PID MAPK TRK PATHWAY | Trk receptor signaling mediated by the MAPK pathway |
| 0.0 | 2.8 | PID CASPASE PATHWAY | Caspase cascade in apoptosis |
| 0.0 | 0.9 | PID IL6 7 PATHWAY | IL6-mediated signaling events |
| 0.0 | 1.1 | NABA PROTEOGLYCANS | Genes encoding proteoglycans |
| 0.0 | 1.5 | PID ILK PATHWAY | Integrin-linked kinase signaling |
| 0.0 | 0.8 | PID INTEGRIN A4B1 PATHWAY | Alpha4 beta1 integrin signaling events |
| 0.0 | 0.6 | PID LIS1 PATHWAY | Lissencephaly gene (LIS1) in neuronal migration and development |
| 0.0 | 0.9 | PID PLK1 PATHWAY | PLK1 signaling events |
| 0.0 | 0.9 | PID HES HEY PATHWAY | Notch-mediated HES/HEY network |
| 0.0 | 1.3 | PID E2F PATHWAY | E2F transcription factor network |
| 0.0 | 0.6 | PID A6B1 A6B4 INTEGRIN PATHWAY | a6b1 and a6b4 Integrin signaling |
Gene overrepresentation in curated gene sets: REACTOME pathways category:
| Log-likelihood per target | Total log-likelihood | Term | Description |
|---|---|---|---|
| 0.1 | 6.5 | REACTOME PKA MEDIATED PHOSPHORYLATION OF CREB | Genes involved in PKA-mediated phosphorylation of CREB |
| 0.1 | 3.5 | REACTOME CTNNB1 PHOSPHORYLATION CASCADE | Genes involved in Beta-catenin phosphorylation cascade |
| 0.1 | 1.9 | REACTOME PLATELET SENSITIZATION BY LDL | Genes involved in Platelet sensitization by LDL |
| 0.1 | 1.9 | REACTOME PLATELET ADHESION TO EXPOSED COLLAGEN | Genes involved in Platelet Adhesion to exposed collagen |
| 0.1 | 3.9 | REACTOME NEPHRIN INTERACTIONS | Genes involved in Nephrin interactions |
| 0.1 | 2.8 | REACTOME SEMA4D INDUCED CELL MIGRATION AND GROWTH CONE COLLAPSE | Genes involved in Sema4D induced cell migration and growth-cone collapse |
| 0.1 | 4.1 | REACTOME GPVI MEDIATED ACTIVATION CASCADE | Genes involved in GPVI-mediated activation cascade |
| 0.1 | 1.9 | REACTOME EGFR DOWNREGULATION | Genes involved in EGFR downregulation |
| 0.1 | 1.4 | REACTOME ERK MAPK TARGETS | Genes involved in ERK/MAPK targets |
| 0.1 | 4.2 | REACTOME SIGNAL TRANSDUCTION BY L1 | Genes involved in Signal transduction by L1 |
| 0.1 | 2.0 | REACTOME G0 AND EARLY G1 | Genes involved in G0 and Early G1 |
| 0.0 | 1.7 | REACTOME INSULIN SYNTHESIS AND PROCESSING | Genes involved in Insulin Synthesis and Processing |
| 0.0 | 2.3 | REACTOME PRE NOTCH TRANSCRIPTION AND TRANSLATION | Genes involved in Pre-NOTCH Transcription and Translation |
| 0.0 | 6.9 | REACTOME CELL DEATH SIGNALLING VIA NRAGE NRIF AND NADE | Genes involved in Cell death signalling via NRAGE, NRIF and NADE |
| 0.0 | 1.5 | REACTOME PHOSPHORYLATION OF THE APC C | Genes involved in Phosphorylation of the APC/C |
| 0.0 | 1.6 | REACTOME GENERATION OF SECOND MESSENGER MOLECULES | Genes involved in Generation of second messenger molecules |
| 0.0 | 2.8 | REACTOME REGULATION OF INSULIN SECRETION BY GLUCAGON LIKE PEPTIDE1 | Genes involved in Regulation of Insulin Secretion by Glucagon-like Peptide-1 |
| 0.0 | 0.8 | REACTOME BILE SALT AND ORGANIC ANION SLC TRANSPORTERS | Genes involved in Bile salt and organic anion SLC transporters |
| 0.0 | 0.7 | REACTOME IL 7 SIGNALING | Genes involved in Interleukin-7 signaling |
| 0.0 | 2.8 | REACTOME MEIOTIC SYNAPSIS | Genes involved in Meiotic Synapsis |
| 0.0 | 1.0 | REACTOME OTHER SEMAPHORIN INTERACTIONS | Genes involved in Other semaphorin interactions |
| 0.0 | 0.7 | REACTOME CYCLIN A B1 ASSOCIATED EVENTS DURING G2 M TRANSITION | Genes involved in Cyclin A/B1 associated events during G2/M transition |
| 0.0 | 1.5 | REACTOME A TETRASACCHARIDE LINKER SEQUENCE IS REQUIRED FOR GAG SYNTHESIS | Genes involved in A tetrasaccharide linker sequence is required for GAG synthesis |
| 0.0 | 0.5 | REACTOME SYNTHESIS OF PIPS AT THE LATE ENDOSOME MEMBRANE | Genes involved in Synthesis of PIPs at the late endosome membrane |
| 0.0 | 1.0 | REACTOME TRAF6 MEDIATED IRF7 ACTIVATION | Genes involved in TRAF6 mediated IRF7 activation |
| 0.0 | 0.5 | REACTOME ABACAVIR TRANSPORT AND METABOLISM | Genes involved in Abacavir transport and metabolism |
| 0.0 | 1.0 | REACTOME SYNTHESIS OF PC | Genes involved in Synthesis of PC |
| 0.0 | 1.1 | REACTOME BASIGIN INTERACTIONS | Genes involved in Basigin interactions |
| 0.0 | 0.5 | REACTOME P2Y RECEPTORS | Genes involved in P2Y receptors |
| 0.0 | 0.6 | REACTOME HS GAG BIOSYNTHESIS | Genes involved in HS-GAG biosynthesis |
| 0.0 | 0.5 | REACTOME GLYCOGEN BREAKDOWN GLYCOGENOLYSIS | Genes involved in Glycogen breakdown (glycogenolysis) |
| 0.0 | 2.5 | REACTOME ANTIGEN PROCESSING CROSS PRESENTATION | Genes involved in Antigen processing-Cross presentation |
| 0.0 | 0.8 | REACTOME DARPP 32 EVENTS | Genes involved in DARPP-32 events |
| 0.0 | 0.6 | REACTOME GAP JUNCTION ASSEMBLY | Genes involved in Gap junction assembly |
| 0.0 | 2.1 | REACTOME MITOTIC PROMETAPHASE | Genes involved in Mitotic Prometaphase |
| 0.0 | 0.4 | REACTOME RECYCLING PATHWAY OF L1 | Genes involved in Recycling pathway of L1 |
| 0.0 | 0.6 | REACTOME SULFUR AMINO ACID METABOLISM | Genes involved in Sulfur amino acid metabolism |
| 0.0 | 0.5 | REACTOME SPHINGOLIPID DE NOVO BIOSYNTHESIS | Genes involved in Sphingolipid de novo biosynthesis |