Project
Illumina Body Map 2 (GSE30611)
Navigation
Downloads
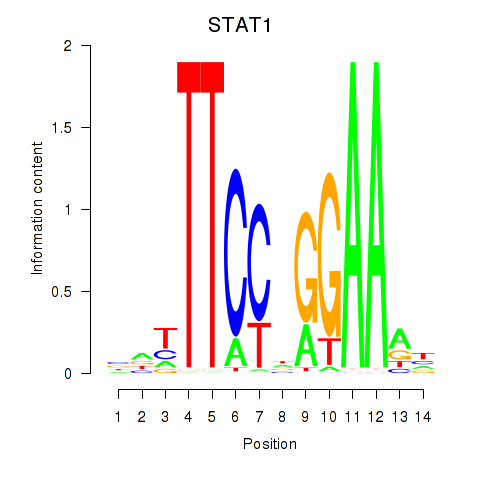
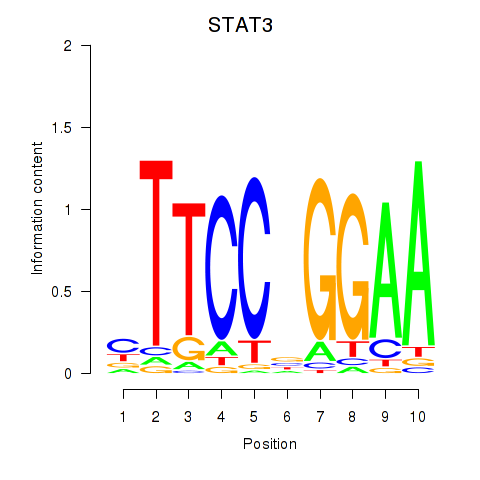
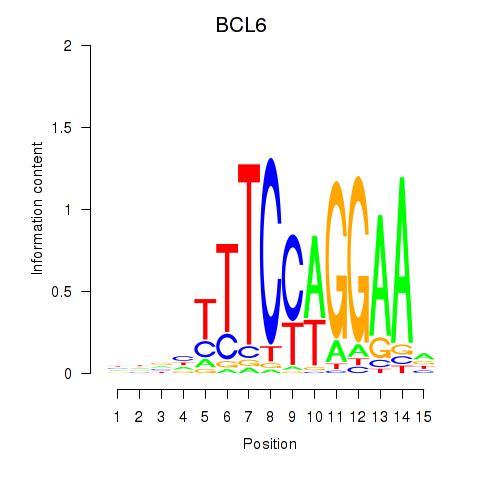
Results for STAT1_STAT3_BCL6
Z-value: 1.63
Motif logo
Transcription factors associated with STAT1_STAT3_BCL6
| Gene Symbol | Gene ID | Gene Info |
|---|---|---|
|
STAT1
|
ENSG00000115415.20 | signal transducer and activator of transcription 1 |
|
STAT3
|
ENSG00000168610.16 | signal transducer and activator of transcription 3 |
|
BCL6
|
ENSG00000113916.18 | BCL6 transcription repressor |
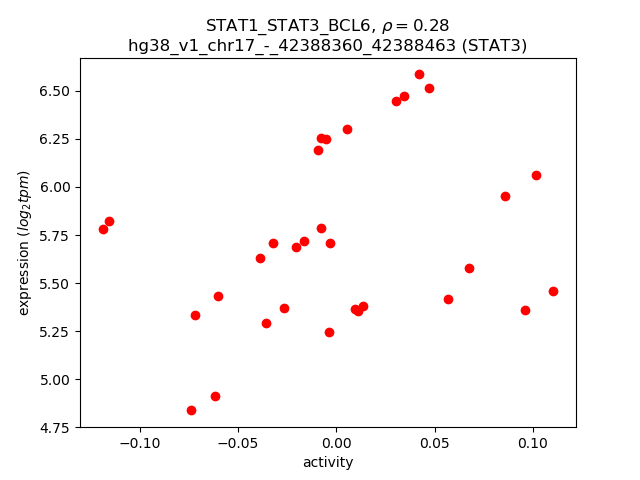
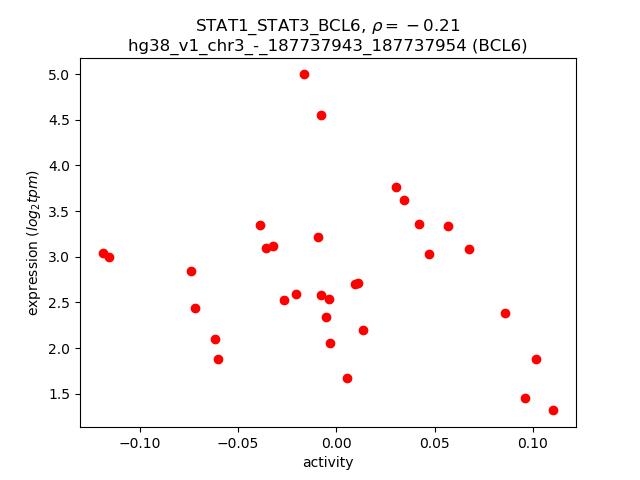
Activity-expression correlation:
| Gene | Promoter | Pearson corr. coef. | P-value | Plot |
|---|---|---|---|---|
| STAT1 | hg38_v1_chr2_-_191013955_191014112 | -0.46 | 8.0e-03 | Click! |
| STAT3 | hg38_v1_chr17_-_42388360_42388463 | 0.28 | 1.1e-01 | Click! |
| BCL6 | hg38_v1_chr3_-_187737943_187737954 | -0.21 | 2.5e-01 | Click! |
Activity profile of STAT1_STAT3_BCL6 motif
Sorted Z-values of STAT1_STAT3_BCL6 motif
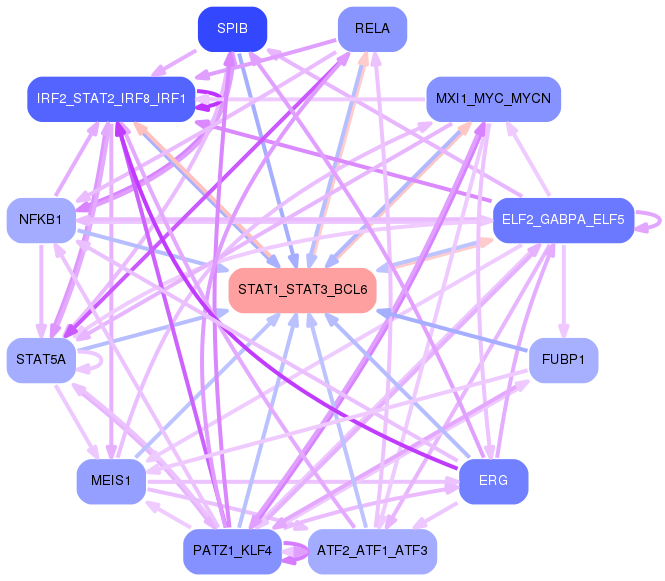
Network of associatons between targets according to the STRING database.

First level regulatory network of STAT1_STAT3_BCL6
Gene Ontology Analysis
Gene overrepresentation in biological process category:
| Log-likelihood per target | Total log-likelihood | Term | Description |
|---|---|---|---|
| 3.7 | 11.0 | GO:0060739 | mesenchymal-epithelial cell signaling involved in prostate gland development(GO:0060739) |
| 2.8 | 8.3 | GO:0007199 | G-protein coupled receptor signaling pathway coupled to cGMP nucleotide second messenger(GO:0007199) response to muscle activity involved in regulation of muscle adaptation(GO:0014873) |
| 2.3 | 6.9 | GO:2000296 | negative regulation of hydrogen peroxide catabolic process(GO:2000296) |
| 2.1 | 8.3 | GO:0060708 | spongiotrophoblast differentiation(GO:0060708) |
| 1.7 | 5.1 | GO:0002434 | immune complex clearance(GO:0002434) immune complex clearance by monocytes and macrophages(GO:0002436) regulation of immune complex clearance by monocytes and macrophages(GO:0090264) |
| 1.6 | 4.9 | GO:1990641 | response to iron ion starvation(GO:1990641) |
| 1.4 | 12.7 | GO:0045959 | regulation of complement activation, classical pathway(GO:0030450) negative regulation of complement activation, classical pathway(GO:0045959) |
| 1.0 | 5.2 | GO:0051801 | cytolysis in other organism involved in symbiotic interaction(GO:0051801) |
| 1.0 | 4.1 | GO:0001868 | regulation of complement activation, lectin pathway(GO:0001868) negative regulation of complement activation, lectin pathway(GO:0001869) |
| 1.0 | 3.0 | GO:2000502 | negative regulation of natural killer cell chemotaxis(GO:2000502) |
| 0.9 | 2.8 | GO:0050928 | negative regulation of positive chemotaxis(GO:0050928) |
| 0.9 | 12.4 | GO:0043152 | induction of bacterial agglutination(GO:0043152) |
| 0.8 | 17.1 | GO:0017187 | peptidyl-glutamic acid carboxylation(GO:0017187) protein carboxylation(GO:0018214) |
| 0.7 | 4.9 | GO:2000860 | positive regulation of mineralocorticoid secretion(GO:2000857) positive regulation of aldosterone secretion(GO:2000860) |
| 0.7 | 5.4 | GO:0071727 | toll-like receptor TLR1:TLR2 signaling pathway(GO:0038123) response to triacyl bacterial lipopeptide(GO:0071725) cellular response to triacyl bacterial lipopeptide(GO:0071727) |
| 0.7 | 3.3 | GO:0061073 | ciliary body morphogenesis(GO:0061073) |
| 0.7 | 2.0 | GO:0031247 | actin rod assembly(GO:0031247) |
| 0.6 | 2.5 | GO:1902161 | positive regulation of cyclic nucleotide-gated ion channel activity(GO:1902161) |
| 0.6 | 3.5 | GO:0008218 | bioluminescence(GO:0008218) |
| 0.5 | 2.2 | GO:1901165 | positive regulation of trophoblast cell migration(GO:1901165) |
| 0.5 | 3.6 | GO:0098706 | ferric iron import into cell(GO:0097461) ferric iron import across plasma membrane(GO:0098706) |
| 0.5 | 1.5 | GO:0003193 | pulmonary valve formation(GO:0003193) foramen ovale closure(GO:0035922) regulation of bundle of His cell action potential(GO:0098905) |
| 0.5 | 4.9 | GO:0006001 | fructose catabolic process(GO:0006001) fructose catabolic process to hydroxyacetone phosphate and glyceraldehyde-3-phosphate(GO:0061624) |
| 0.5 | 2.4 | GO:0030070 | insulin processing(GO:0030070) |
| 0.4 | 1.3 | GO:0032827 | negative regulation of natural killer cell differentiation(GO:0032824) negative regulation of natural killer cell differentiation involved in immune response(GO:0032827) |
| 0.4 | 1.6 | GO:0035744 | T-helper 1 cell cytokine production(GO:0035744) |
| 0.4 | 2.0 | GO:0035790 | platelet-derived growth factor receptor-alpha signaling pathway(GO:0035790) |
| 0.4 | 6.5 | GO:0006957 | complement activation, alternative pathway(GO:0006957) |
| 0.4 | 1.1 | GO:0071140 | resolution of recombination intermediates(GO:0071139) resolution of mitotic recombination intermediates(GO:0071140) |
| 0.3 | 1.0 | GO:0046041 | ITP metabolic process(GO:0046041) |
| 0.3 | 1.2 | GO:1903225 | negative regulation of endodermal cell differentiation(GO:1903225) |
| 0.3 | 0.9 | GO:0050720 | interleukin-1 beta biosynthetic process(GO:0050720) |
| 0.3 | 0.9 | GO:0061569 | dADP phosphorylation(GO:0006174) dGDP phosphorylation(GO:0006186) AMP phosphorylation(GO:0006756) CDP phosphorylation(GO:0061508) dAMP phosphorylation(GO:0061565) CMP phosphorylation(GO:0061566) dCMP phosphorylation(GO:0061567) GDP phosphorylation(GO:0061568) UDP phosphorylation(GO:0061569) dCDP phosphorylation(GO:0061570) TDP phosphorylation(GO:0061571) |
| 0.3 | 1.7 | GO:0090131 | glomerular mesangial cell development(GO:0072144) mesenchyme migration(GO:0090131) |
| 0.3 | 3.4 | GO:0070836 | caveola assembly(GO:0070836) |
| 0.3 | 0.8 | GO:1903973 | negative regulation of macrophage colony-stimulating factor signaling pathway(GO:1902227) negative regulation of response to macrophage colony-stimulating factor(GO:1903970) negative regulation of cellular response to macrophage colony-stimulating factor stimulus(GO:1903973) |
| 0.3 | 2.4 | GO:0032929 | negative regulation of superoxide anion generation(GO:0032929) |
| 0.3 | 2.9 | GO:0097646 | calcitonin family receptor signaling pathway(GO:0097646) amylin receptor signaling pathway(GO:0097647) |
| 0.3 | 5.1 | GO:0061302 | smooth muscle cell-matrix adhesion(GO:0061302) |
| 0.3 | 2.1 | GO:0002925 | positive regulation of humoral immune response mediated by circulating immunoglobulin(GO:0002925) |
| 0.3 | 0.5 | GO:0002581 | negative regulation of antigen processing and presentation of peptide or polysaccharide antigen via MHC class II(GO:0002581) |
| 0.3 | 1.8 | GO:0022614 | membrane to membrane docking(GO:0022614) |
| 0.3 | 0.8 | GO:0019303 | D-ribose catabolic process(GO:0019303) |
| 0.3 | 4.5 | GO:0019388 | galactose catabolic process(GO:0019388) |
| 0.2 | 7.2 | GO:0006825 | copper ion transport(GO:0006825) |
| 0.2 | 3.3 | GO:0001867 | complement activation, lectin pathway(GO:0001867) |
| 0.2 | 1.4 | GO:0060574 | intestinal epithelial cell maturation(GO:0060574) |
| 0.2 | 0.7 | GO:0002194 | hepatocyte cell migration(GO:0002194) otic placode formation(GO:0043049) branching involved in pancreas morphogenesis(GO:0061114) acinar cell differentiation(GO:0090425) positive regulation of forebrain neuron differentiation(GO:2000979) |
| 0.2 | 0.7 | GO:1901253 | negative regulation of intracellular transport of viral material(GO:1901253) |
| 0.2 | 0.6 | GO:0035697 | CD8-positive, alpha-beta T cell extravasation(GO:0035697) CD8-positive, alpha-beta cytotoxic T cell extravasation(GO:0035698) T cell extravasation(GO:0072683) regulation of T cell extravasation(GO:2000407) regulation of CD8-positive, alpha-beta T cell extravasation(GO:2000449) regulation of CD8-positive, alpha-beta cytotoxic T cell extravasation(GO:2000452) |
| 0.2 | 1.5 | GO:0044245 | polysaccharide digestion(GO:0044245) |
| 0.2 | 1.2 | GO:0015862 | uridine transport(GO:0015862) |
| 0.2 | 0.8 | GO:1904017 | cellular response to Thyroglobulin triiodothyronine(GO:1904017) |
| 0.2 | 0.8 | GO:1904381 | Golgi apparatus mannose trimming(GO:1904381) |
| 0.2 | 3.1 | GO:0034638 | phosphatidylcholine catabolic process(GO:0034638) |
| 0.2 | 7.1 | GO:0014850 | response to muscle activity(GO:0014850) |
| 0.2 | 1.1 | GO:2000418 | positive regulation of eosinophil migration(GO:2000418) |
| 0.2 | 0.6 | GO:0019089 | negative regulation of transcription from RNA polymerase II promoter in response to UV-induced DNA damage(GO:0010768) transmission of virus(GO:0019089) dissemination or transmission of symbiont from host(GO:0044007) dissemination or transmission of organism from other organism involved in symbiotic interaction(GO:0051821) |
| 0.2 | 0.9 | GO:2000503 | positive regulation of natural killer cell chemotaxis(GO:2000503) |
| 0.2 | 4.7 | GO:0031639 | plasminogen activation(GO:0031639) |
| 0.2 | 0.5 | GO:0003032 | detection of oxygen(GO:0003032) |
| 0.2 | 0.9 | GO:0033383 | geranyl diphosphate metabolic process(GO:0033383) geranyl diphosphate biosynthetic process(GO:0033384) farnesyl diphosphate biosynthetic process(GO:0045337) |
| 0.2 | 0.7 | GO:0021569 | rhombomere 3 development(GO:0021569) |
| 0.2 | 0.6 | GO:1901842 | negative regulation of high voltage-gated calcium channel activity(GO:1901842) |
| 0.2 | 22.5 | GO:0006958 | complement activation, classical pathway(GO:0006958) |
| 0.2 | 1.7 | GO:0035754 | B cell chemotaxis(GO:0035754) |
| 0.2 | 0.8 | GO:0035359 | negative regulation of peroxisome proliferator activated receptor signaling pathway(GO:0035359) |
| 0.2 | 0.5 | GO:0043932 | ossification involved in bone remodeling(GO:0043932) |
| 0.1 | 2.7 | GO:0033623 | regulation of integrin activation(GO:0033623) |
| 0.1 | 0.7 | GO:1900194 | negative regulation of oocyte maturation(GO:1900194) |
| 0.1 | 3.0 | GO:1902222 | L-phenylalanine metabolic process(GO:0006558) L-phenylalanine catabolic process(GO:0006559) erythrose 4-phosphate/phosphoenolpyruvate family amino acid metabolic process(GO:1902221) erythrose 4-phosphate/phosphoenolpyruvate family amino acid catabolic process(GO:1902222) |
| 0.1 | 2.6 | GO:0060315 | negative regulation of ryanodine-sensitive calcium-release channel activity(GO:0060315) |
| 0.1 | 0.7 | GO:1902766 | skeletal muscle satellite cell migration(GO:1902766) |
| 0.1 | 0.5 | GO:0003095 | pressure natriuresis(GO:0003095) |
| 0.1 | 0.9 | GO:0045590 | negative regulation of regulatory T cell differentiation(GO:0045590) |
| 0.1 | 2.0 | GO:0035826 | rubidium ion transport(GO:0035826) regulation of rubidium ion transport(GO:2000680) |
| 0.1 | 0.5 | GO:0097032 | mitochondrial electron transport, succinate to ubiquinone(GO:0006121) respiratory chain complex II assembly(GO:0034552) mitochondrial respiratory chain complex II assembly(GO:0034553) mitochondrial respiratory chain complex II biogenesis(GO:0097032) |
| 0.1 | 1.4 | GO:0043129 | surfactant homeostasis(GO:0043129) |
| 0.1 | 0.5 | GO:0046035 | CMP salvage(GO:0006238) CMP biosynthetic process(GO:0009224) CMP metabolic process(GO:0046035) |
| 0.1 | 0.6 | GO:0009298 | GDP-mannose biosynthetic process(GO:0009298) |
| 0.1 | 1.2 | GO:2000467 | insulin receptor signaling pathway via phosphatidylinositol 3-kinase(GO:0038028) positive regulation of glycogen (starch) synthase activity(GO:2000467) |
| 0.1 | 0.4 | GO:0044053 | translocation of peptides or proteins into host(GO:0042000) translocation of peptides or proteins into host cell cytoplasm(GO:0044053) translocation of molecules into host(GO:0044417) translocation of peptides or proteins into other organism involved in symbiotic interaction(GO:0051808) translocation of molecules into other organism involved in symbiotic interaction(GO:0051836) |
| 0.1 | 0.5 | GO:0002408 | myeloid dendritic cell chemotaxis(GO:0002408) |
| 0.1 | 0.3 | GO:1990697 | protein depalmitoleylation(GO:1990697) |
| 0.1 | 8.6 | GO:0030212 | hyaluronan metabolic process(GO:0030212) |
| 0.1 | 0.2 | GO:0002314 | germinal center B cell differentiation(GO:0002314) |
| 0.1 | 1.5 | GO:2001300 | lipoxin metabolic process(GO:2001300) |
| 0.1 | 0.3 | GO:0044857 | plasma membrane raft assembly(GO:0044854) plasma membrane raft organization(GO:0044857) |
| 0.1 | 0.6 | GO:2000346 | negative regulation of hepatocyte proliferation(GO:2000346) |
| 0.1 | 0.3 | GO:1902616 | acyl carnitine transport(GO:0006844) acyl carnitine transmembrane transport(GO:1902616) |
| 0.1 | 0.2 | GO:0097212 | lysosomal membrane organization(GO:0097212) |
| 0.1 | 1.0 | GO:1902739 | interferon-alpha secretion(GO:0072642) regulation of interferon-alpha secretion(GO:1902739) positive regulation of interferon-alpha secretion(GO:1902741) |
| 0.1 | 0.5 | GO:0046878 | response to ozone(GO:0010193) operant conditioning(GO:0035106) positive regulation of saliva secretion(GO:0046878) |
| 0.1 | 1.7 | GO:1990573 | potassium ion import across plasma membrane(GO:1990573) |
| 0.1 | 4.1 | GO:1903846 | positive regulation of transforming growth factor beta receptor signaling pathway(GO:0030511) positive regulation of cellular response to transforming growth factor beta stimulus(GO:1903846) |
| 0.1 | 0.6 | GO:0090611 | ubiquitin-independent protein catabolic process via the multivesicular body sorting pathway(GO:0090611) |
| 0.1 | 1.1 | GO:1901409 | positive regulation of phosphorylation of RNA polymerase II C-terminal domain(GO:1901409) |
| 0.1 | 1.8 | GO:0038063 | collagen-activated tyrosine kinase receptor signaling pathway(GO:0038063) |
| 0.1 | 1.0 | GO:0010269 | response to selenium ion(GO:0010269) |
| 0.1 | 1.3 | GO:0015747 | urate transport(GO:0015747) |
| 0.1 | 2.4 | GO:0040015 | negative regulation of multicellular organism growth(GO:0040015) |
| 0.1 | 0.5 | GO:0032747 | positive regulation of interleukin-23 production(GO:0032747) |
| 0.1 | 0.3 | GO:1902896 | terminal web assembly(GO:1902896) |
| 0.1 | 2.5 | GO:0017121 | phospholipid scrambling(GO:0017121) |
| 0.1 | 1.8 | GO:0090050 | positive regulation of cell migration involved in sprouting angiogenesis(GO:0090050) |
| 0.1 | 0.3 | GO:1904425 | negative regulation of GTP binding(GO:1904425) |
| 0.1 | 0.9 | GO:0032525 | somite rostral/caudal axis specification(GO:0032525) |
| 0.1 | 0.8 | GO:0001957 | intramembranous ossification(GO:0001957) direct ossification(GO:0036072) |
| 0.1 | 1.9 | GO:0045636 | positive regulation of melanocyte differentiation(GO:0045636) |
| 0.1 | 0.6 | GO:0010739 | positive regulation of protein kinase A signaling(GO:0010739) |
| 0.1 | 0.9 | GO:0048251 | elastic fiber assembly(GO:0048251) |
| 0.1 | 0.6 | GO:0038172 | interleukin-33-mediated signaling pathway(GO:0038172) |
| 0.1 | 1.2 | GO:0060391 | positive regulation of SMAD protein import into nucleus(GO:0060391) |
| 0.1 | 0.5 | GO:0050925 | negative regulation of negative chemotaxis(GO:0050925) |
| 0.1 | 1.6 | GO:0007567 | parturition(GO:0007567) |
| 0.1 | 0.6 | GO:0010890 | positive regulation of sequestering of triglyceride(GO:0010890) |
| 0.1 | 4.2 | GO:0007205 | protein kinase C-activating G-protein coupled receptor signaling pathway(GO:0007205) |
| 0.1 | 1.0 | GO:0015014 | protein sulfation(GO:0006477) heparan sulfate proteoglycan biosynthetic process, polysaccharide chain biosynthetic process(GO:0015014) |
| 0.1 | 0.9 | GO:0019441 | tryptophan catabolic process to kynurenine(GO:0019441) |
| 0.1 | 0.4 | GO:0019075 | virus maturation(GO:0019075) |
| 0.1 | 0.4 | GO:0006050 | mannosamine metabolic process(GO:0006050) N-acetylmannosamine metabolic process(GO:0006051) |
| 0.1 | 0.2 | GO:0046521 | sphingoid catabolic process(GO:0046521) |
| 0.1 | 0.3 | GO:0045425 | positive regulation of granulocyte macrophage colony-stimulating factor biosynthetic process(GO:0045425) |
| 0.1 | 0.2 | GO:0060876 | semicircular canal formation(GO:0060876) |
| 0.1 | 0.2 | GO:0032773 | regulation of monophenol monooxygenase activity(GO:0032771) positive regulation of monophenol monooxygenase activity(GO:0032773) negative regulation of hair follicle maturation(GO:0048817) negative regulation of catagen(GO:0051796) regulation of hair cycle by canonical Wnt signaling pathway(GO:0060901) positive regulation of melanosome transport(GO:1902910) |
| 0.1 | 0.6 | GO:1904386 | response to thyroxine(GO:0097068) response to L-phenylalanine derivative(GO:1904386) |
| 0.1 | 0.4 | GO:0033615 | mitochondrial proton-transporting ATP synthase complex assembly(GO:0033615) |
| 0.1 | 1.4 | GO:0006703 | estrogen biosynthetic process(GO:0006703) |
| 0.1 | 0.1 | GO:0061198 | fungiform papilla formation(GO:0061198) |
| 0.1 | 0.7 | GO:0023035 | CD40 signaling pathway(GO:0023035) |
| 0.1 | 0.8 | GO:0030321 | transepithelial chloride transport(GO:0030321) |
| 0.1 | 0.4 | GO:0090095 | regulation of metanephric cap mesenchymal cell proliferation(GO:0090095) positive regulation of metanephric cap mesenchymal cell proliferation(GO:0090096) |
| 0.1 | 0.4 | GO:0003431 | growth plate cartilage chondrocyte development(GO:0003431) |
| 0.1 | 1.1 | GO:0035721 | intraciliary retrograde transport(GO:0035721) |
| 0.1 | 0.6 | GO:1903300 | negative regulation of glucokinase activity(GO:0033132) negative regulation of hexokinase activity(GO:1903300) |
| 0.1 | 0.5 | GO:0007296 | vitellogenesis(GO:0007296) |
| 0.1 | 1.7 | GO:0048266 | behavioral response to pain(GO:0048266) |
| 0.1 | 0.4 | GO:0098989 | NMDA selective glutamate receptor signaling pathway(GO:0098989) |
| 0.1 | 0.3 | GO:1903899 | positive regulation of PERK-mediated unfolded protein response(GO:1903899) |
| 0.1 | 0.2 | GO:0002304 | gamma-delta intraepithelial T cell differentiation(GO:0002304) CD8-positive, gamma-delta intraepithelial T cell differentiation(GO:0002305) |
| 0.1 | 0.8 | GO:0006032 | chitin metabolic process(GO:0006030) chitin catabolic process(GO:0006032) |
| 0.1 | 0.2 | GO:1990654 | sebum secreting cell proliferation(GO:1990654) |
| 0.1 | 0.5 | GO:1902527 | positive regulation of intrinsic apoptotic signaling pathway by p53 class mediator(GO:1902255) positive regulation of protein monoubiquitination(GO:1902527) |
| 0.1 | 0.4 | GO:2000814 | regulation of unidimensional cell growth(GO:0051510) negative regulation of unidimensional cell growth(GO:0051511) establishment of cell polarity regulating cell shape(GO:0071964) regulation of establishment or maintenance of cell polarity regulating cell shape(GO:2000769) positive regulation of establishment or maintenance of cell polarity regulating cell shape(GO:2000771) regulation of establishment of cell polarity regulating cell shape(GO:2000782) positive regulation of establishment of cell polarity regulating cell shape(GO:2000784) positive regulation of barbed-end actin filament capping(GO:2000814) |
| 0.1 | 0.3 | GO:0090156 | cellular sphingolipid homeostasis(GO:0090156) |
| 0.0 | 1.3 | GO:1900116 | extracellular regulation of signal transduction(GO:1900115) extracellular negative regulation of signal transduction(GO:1900116) |
| 0.0 | 0.6 | GO:0046104 | thymidine metabolic process(GO:0046104) pyrimidine deoxyribonucleoside metabolic process(GO:0046125) |
| 0.0 | 0.9 | GO:0051901 | positive regulation of mitochondrial depolarization(GO:0051901) negative regulation of vascular endothelial growth factor signaling pathway(GO:1900747) |
| 0.0 | 0.0 | GO:0009826 | unidimensional cell growth(GO:0009826) |
| 0.0 | 0.6 | GO:0045779 | negative regulation of bone resorption(GO:0045779) |
| 0.0 | 0.4 | GO:0001878 | response to yeast(GO:0001878) |
| 0.0 | 1.0 | GO:0006975 | DNA damage induced protein phosphorylation(GO:0006975) |
| 0.0 | 0.2 | GO:0039516 | modulation by virus of host molecular function(GO:0039506) suppression by virus of host molecular function(GO:0039507) suppression by virus of host catalytic activity(GO:0039513) modulation by virus of host catalytic activity(GO:0039516) suppression by virus of host cysteine-type endopeptidase activity involved in apoptotic process(GO:0039650) negative regulation by symbiont of host catalytic activity(GO:0052053) negative regulation by symbiont of host molecular function(GO:0052056) modulation by symbiont of host catalytic activity(GO:0052148) |
| 0.0 | 0.1 | GO:0035397 | helper T cell enhancement of adaptive immune response(GO:0035397) |
| 0.0 | 0.6 | GO:0001886 | endothelial cell morphogenesis(GO:0001886) |
| 0.0 | 0.5 | GO:2000189 | positive regulation of cholesterol homeostasis(GO:2000189) |
| 0.0 | 0.1 | GO:0033591 | response to L-ascorbic acid(GO:0033591) |
| 0.0 | 3.2 | GO:0071377 | cellular response to glucagon stimulus(GO:0071377) |
| 0.0 | 0.2 | GO:0003245 | growth involved in heart morphogenesis(GO:0003241) cardiac muscle tissue growth involved in heart morphogenesis(GO:0003245) |
| 0.0 | 0.4 | GO:0010724 | regulation of definitive erythrocyte differentiation(GO:0010724) definitive erythrocyte differentiation(GO:0060318) |
| 0.0 | 0.2 | GO:0003065 | positive regulation of heart rate by epinephrine(GO:0003065) |
| 0.0 | 0.1 | GO:0021757 | caudate nucleus development(GO:0021757) putamen development(GO:0021758) |
| 0.0 | 0.3 | GO:0000727 | double-strand break repair via break-induced replication(GO:0000727) |
| 0.0 | 0.2 | GO:0002329 | pre-B cell differentiation(GO:0002329) |
| 0.0 | 0.1 | GO:0070309 | lens fiber cell morphogenesis(GO:0070309) |
| 0.0 | 2.0 | GO:0007176 | regulation of epidermal growth factor-activated receptor activity(GO:0007176) |
| 0.0 | 1.1 | GO:0042832 | defense response to protozoan(GO:0042832) |
| 0.0 | 0.4 | GO:0032049 | cardiolipin biosynthetic process(GO:0032049) |
| 0.0 | 0.4 | GO:0043950 | positive regulation of cAMP-mediated signaling(GO:0043950) |
| 0.0 | 1.3 | GO:0016338 | calcium-independent cell-cell adhesion via plasma membrane cell-adhesion molecules(GO:0016338) |
| 0.0 | 0.6 | GO:0035372 | protein localization to microtubule(GO:0035372) |
| 0.0 | 0.3 | GO:0060753 | regulation of mast cell chemotaxis(GO:0060753) |
| 0.0 | 1.4 | GO:0032461 | positive regulation of protein oligomerization(GO:0032461) |
| 0.0 | 0.4 | GO:0010032 | meiotic chromosome condensation(GO:0010032) |
| 0.0 | 0.4 | GO:0033211 | adiponectin-activated signaling pathway(GO:0033211) |
| 0.0 | 0.3 | GO:0051549 | positive regulation of keratinocyte migration(GO:0051549) |
| 0.0 | 0.8 | GO:0006488 | dolichol-linked oligosaccharide biosynthetic process(GO:0006488) |
| 0.0 | 0.4 | GO:0042340 | keratan sulfate catabolic process(GO:0042340) |
| 0.0 | 0.8 | GO:0021692 | cerebellar Purkinje cell layer morphogenesis(GO:0021692) |
| 0.0 | 0.2 | GO:0000720 | pyrimidine dimer repair by nucleotide-excision repair(GO:0000720) |
| 0.0 | 2.1 | GO:0000413 | protein peptidyl-prolyl isomerization(GO:0000413) |
| 0.0 | 0.3 | GO:0045218 | zonula adherens maintenance(GO:0045218) |
| 0.0 | 0.4 | GO:1904715 | negative regulation of chaperone-mediated autophagy(GO:1904715) |
| 0.0 | 0.2 | GO:0015842 | aminergic neurotransmitter loading into synaptic vesicle(GO:0015842) |
| 0.0 | 0.1 | GO:0015887 | biotin transport(GO:0015878) pantothenate transmembrane transport(GO:0015887) |
| 0.0 | 0.0 | GO:0048850 | hypophysis morphogenesis(GO:0048850) |
| 0.0 | 1.9 | GO:0006730 | one-carbon metabolic process(GO:0006730) |
| 0.0 | 0.5 | GO:1900119 | positive regulation of execution phase of apoptosis(GO:1900119) |
| 0.0 | 0.9 | GO:0035635 | entry of bacterium into host cell(GO:0035635) |
| 0.0 | 0.5 | GO:0051601 | exocyst localization(GO:0051601) |
| 0.0 | 0.2 | GO:0071486 | cellular response to light intensity(GO:0071484) cellular response to high light intensity(GO:0071486) retinal rod cell apoptotic process(GO:0097473) |
| 0.0 | 0.2 | GO:0055129 | L-proline biosynthetic process(GO:0055129) |
| 0.0 | 0.4 | GO:1904424 | regulation of GTP binding(GO:1904424) |
| 0.0 | 0.4 | GO:0060628 | regulation of ER to Golgi vesicle-mediated transport(GO:0060628) |
| 0.0 | 0.4 | GO:0051775 | response to redox state(GO:0051775) |
| 0.0 | 0.2 | GO:0000270 | peptidoglycan metabolic process(GO:0000270) peptidoglycan catabolic process(GO:0009253) |
| 0.0 | 0.1 | GO:0019626 | cobalamin biosynthetic process(GO:0009236) short-chain fatty acid catabolic process(GO:0019626) |
| 0.0 | 0.1 | GO:1990022 | RNA polymerase II complex import to nucleus(GO:0044376) RNA polymerase III complex localization to nucleus(GO:1990022) |
| 0.0 | 0.3 | GO:0070131 | positive regulation of mitochondrial translation(GO:0070131) |
| 0.0 | 0.2 | GO:1904749 | regulation of protein localization to nucleolus(GO:1904749) |
| 0.0 | 0.6 | GO:0030322 | stabilization of membrane potential(GO:0030322) |
| 0.0 | 1.5 | GO:0050999 | regulation of nitric-oxide synthase activity(GO:0050999) |
| 0.0 | 0.7 | GO:0009235 | cobalamin metabolic process(GO:0009235) |
| 0.0 | 0.0 | GO:0052055 | modulation by symbiont of host molecular function(GO:0052055) modulation of catalytic activity in other organism involved in symbiotic interaction(GO:0052203) modulation by host of symbiont catalytic activity(GO:0052422) |
| 0.0 | 0.1 | GO:0050915 | sensory perception of sour taste(GO:0050915) |
| 0.0 | 0.4 | GO:0034384 | high-density lipoprotein particle clearance(GO:0034384) |
| 0.0 | 0.3 | GO:0060707 | trophoblast giant cell differentiation(GO:0060707) |
| 0.0 | 0.4 | GO:1900745 | positive regulation of p38MAPK cascade(GO:1900745) |
| 0.0 | 0.1 | GO:1900378 | positive regulation of melanin biosynthetic process(GO:0048023) positive regulation of secondary metabolite biosynthetic process(GO:1900378) |
| 0.0 | 0.5 | GO:0000028 | ribosomal small subunit assembly(GO:0000028) |
| 0.0 | 0.1 | GO:0071460 | cellular response to cell-matrix adhesion(GO:0071460) |
| 0.0 | 0.4 | GO:0015816 | glycine transport(GO:0015816) |
| 0.0 | 0.2 | GO:0008063 | Toll signaling pathway(GO:0008063) |
| 0.0 | 0.2 | GO:0042271 | susceptibility to natural killer cell mediated cytotoxicity(GO:0042271) |
| 0.0 | 0.6 | GO:0060716 | labyrinthine layer blood vessel development(GO:0060716) |
| 0.0 | 2.0 | GO:0090502 | RNA phosphodiester bond hydrolysis, endonucleolytic(GO:0090502) |
| 0.0 | 0.3 | GO:0036066 | protein O-linked fucosylation(GO:0036066) |
| 0.0 | 0.1 | GO:0033632 | negative regulation of extracellular matrix disassembly(GO:0010716) regulation of cell-cell adhesion mediated by integrin(GO:0033632) |
| 0.0 | 0.1 | GO:0010025 | wax biosynthetic process(GO:0010025) wax metabolic process(GO:0010166) |
| 0.0 | 0.3 | GO:0019321 | pentose metabolic process(GO:0019321) |
| 0.0 | 0.6 | GO:0048536 | spleen development(GO:0048536) |
| 0.0 | 0.4 | GO:0097067 | cellular response to thyroid hormone stimulus(GO:0097067) |
| 0.0 | 0.4 | GO:0042744 | hydrogen peroxide catabolic process(GO:0042744) |
| 0.0 | 0.4 | GO:0050962 | detection of light stimulus involved in visual perception(GO:0050908) detection of light stimulus involved in sensory perception(GO:0050962) |
| 0.0 | 0.1 | GO:0006117 | acetaldehyde metabolic process(GO:0006117) positive regulation of Schwann cell differentiation(GO:0014040) response to cobalamin(GO:0033590) |
| 0.0 | 0.1 | GO:0001992 | regulation of systemic arterial blood pressure by vasopressin(GO:0001992) |
| 0.0 | 0.2 | GO:0000722 | telomere maintenance via recombination(GO:0000722) |
| 0.0 | 0.2 | GO:0048535 | lymph node development(GO:0048535) |
| 0.0 | 0.5 | GO:0050427 | purine ribonucleoside bisphosphate metabolic process(GO:0034035) 3'-phosphoadenosine 5'-phosphosulfate metabolic process(GO:0050427) |
| 0.0 | 1.8 | GO:0034340 | response to type I interferon(GO:0034340) |
| 0.0 | 0.0 | GO:0046333 | octopamine biosynthetic process(GO:0006589) octopamine metabolic process(GO:0046333) |
| 0.0 | 0.1 | GO:0044565 | dendritic cell proliferation(GO:0044565) |
| 0.0 | 0.1 | GO:0070212 | protein poly-ADP-ribosylation(GO:0070212) |
| 0.0 | 2.3 | GO:0002576 | platelet degranulation(GO:0002576) |
| 0.0 | 0.2 | GO:0010510 | regulation of acetyl-CoA biosynthetic process from pyruvate(GO:0010510) regulation of acyl-CoA biosynthetic process(GO:0050812) |
| 0.0 | 0.0 | GO:0050883 | musculoskeletal movement, spinal reflex action(GO:0050883) |
| 0.0 | 1.5 | GO:0030521 | androgen receptor signaling pathway(GO:0030521) |
| 0.0 | 0.3 | GO:0030220 | platelet formation(GO:0030220) |
| 0.0 | 0.9 | GO:0034260 | negative regulation of GTPase activity(GO:0034260) |
| 0.0 | 0.7 | GO:0010761 | fibroblast migration(GO:0010761) |
| 0.0 | 0.1 | GO:2000124 | regulation of endocannabinoid signaling pathway(GO:2000124) |
| 0.0 | 0.4 | GO:0030488 | tRNA methylation(GO:0030488) |
Gene overrepresentation in cellular component category:
| Log-likelihood per target | Total log-likelihood | Term | Description |
|---|---|---|---|
| 1.7 | 6.9 | GO:0031838 | haptoglobin-hemoglobin complex(GO:0031838) |
| 1.7 | 5.1 | GO:0048237 | rough endoplasmic reticulum lumen(GO:0048237) alphav-beta3 integrin-vitronectin complex(GO:0071062) |
| 1.5 | 4.5 | GO:0005914 | spot adherens junction(GO:0005914) |
| 1.2 | 16.2 | GO:0005577 | fibrinogen complex(GO:0005577) |
| 1.1 | 4.3 | GO:0005602 | complement component C1 complex(GO:0005602) |
| 0.6 | 5.4 | GO:0005579 | membrane attack complex(GO:0005579) |
| 0.5 | 6.9 | GO:0030478 | actin cap(GO:0030478) |
| 0.5 | 5.4 | GO:0046696 | lipopolysaccharide receptor complex(GO:0046696) |
| 0.4 | 9.7 | GO:0031089 | platelet dense granule lumen(GO:0031089) |
| 0.4 | 2.5 | GO:0031205 | endoplasmic reticulum Sec complex(GO:0031205) |
| 0.4 | 3.0 | GO:0070435 | Shc-EGFR complex(GO:0070435) |
| 0.4 | 3.0 | GO:1903440 | calcitonin family receptor complex(GO:1903439) amylin receptor complex(GO:1903440) |
| 0.3 | 12.8 | GO:0005614 | interstitial matrix(GO:0005614) |
| 0.3 | 1.2 | GO:0005588 | collagen type V trimer(GO:0005588) |
| 0.3 | 1.4 | GO:0070557 | PCNA-p21 complex(GO:0070557) |
| 0.3 | 0.8 | GO:1990666 | PCSK9-LDLR complex(GO:1990666) |
| 0.2 | 1.7 | GO:0030485 | smooth muscle contractile fiber(GO:0030485) |
| 0.2 | 58.9 | GO:0072562 | blood microparticle(GO:0072562) |
| 0.2 | 4.0 | GO:0045179 | apical cortex(GO:0045179) |
| 0.2 | 0.8 | GO:0035517 | PR-DUB complex(GO:0035517) |
| 0.2 | 0.6 | GO:0008537 | proteasome activator complex(GO:0008537) |
| 0.2 | 1.7 | GO:0008282 | ATP-sensitive potassium channel complex(GO:0008282) |
| 0.2 | 1.1 | GO:0036021 | endolysosome lumen(GO:0036021) |
| 0.2 | 2.0 | GO:0097487 | multivesicular body, internal vesicle(GO:0097487) |
| 0.1 | 3.3 | GO:0000177 | cytoplasmic exosome (RNase complex)(GO:0000177) |
| 0.1 | 0.9 | GO:0071953 | elastic fiber(GO:0071953) |
| 0.1 | 2.0 | GO:0034663 | endoplasmic reticulum chaperone complex(GO:0034663) |
| 0.1 | 0.3 | GO:0031251 | PAN complex(GO:0031251) |
| 0.1 | 0.4 | GO:0098575 | lumenal side of lysosomal membrane(GO:0098575) |
| 0.1 | 5.1 | GO:0034451 | centriolar satellite(GO:0034451) |
| 0.1 | 13.3 | GO:0044217 | other organism(GO:0044215) other organism cell(GO:0044216) other organism part(GO:0044217) |
| 0.1 | 1.0 | GO:0033269 | internode region of axon(GO:0033269) |
| 0.1 | 1.1 | GO:0030991 | intraciliary transport particle A(GO:0030991) |
| 0.1 | 0.9 | GO:0098647 | collagen type VI trimer(GO:0005589) collagen beaded filament(GO:0098647) |
| 0.1 | 0.9 | GO:0031088 | platelet dense granule membrane(GO:0031088) |
| 0.1 | 5.1 | GO:0005834 | heterotrimeric G-protein complex(GO:0005834) |
| 0.1 | 0.6 | GO:0005610 | laminin-5 complex(GO:0005610) |
| 0.1 | 0.7 | GO:0043190 | ATP-binding cassette (ABC) transporter complex(GO:0043190) |
| 0.1 | 0.6 | GO:0042627 | chylomicron(GO:0042627) |
| 0.1 | 1.2 | GO:0005915 | zonula adherens(GO:0005915) |
| 0.1 | 0.7 | GO:0097433 | dense body(GO:0097433) |
| 0.0 | 0.7 | GO:0005587 | collagen type IV trimer(GO:0005587) |
| 0.0 | 4.6 | GO:0035580 | specific granule lumen(GO:0035580) |
| 0.0 | 6.3 | GO:0005581 | collagen trimer(GO:0005581) |
| 0.0 | 0.3 | GO:1990357 | terminal web(GO:1990357) |
| 0.0 | 0.3 | GO:0035339 | SPOTS complex(GO:0035339) |
| 0.0 | 1.2 | GO:0034364 | high-density lipoprotein particle(GO:0034364) |
| 0.0 | 1.1 | GO:0001518 | voltage-gated sodium channel complex(GO:0001518) |
| 0.0 | 0.6 | GO:0090543 | Flemming body(GO:0090543) |
| 0.0 | 1.2 | GO:0005685 | U1 snRNP(GO:0005685) |
| 0.0 | 0.2 | GO:0017109 | glutamate-cysteine ligase complex(GO:0017109) |
| 0.0 | 0.4 | GO:0000796 | condensin complex(GO:0000796) |
| 0.0 | 4.0 | GO:0005791 | rough endoplasmic reticulum(GO:0005791) |
| 0.0 | 0.4 | GO:0070449 | Cul5-RING ubiquitin ligase complex(GO:0031466) elongin complex(GO:0070449) |
| 0.0 | 0.5 | GO:0008250 | oligosaccharyltransferase complex(GO:0008250) |
| 0.0 | 0.2 | GO:0000110 | nucleotide-excision repair factor 1 complex(GO:0000110) |
| 0.0 | 2.1 | GO:0001772 | immunological synapse(GO:0001772) |
| 0.0 | 0.4 | GO:0000322 | storage vacuole(GO:0000322) |
| 0.0 | 0.8 | GO:0005849 | mRNA cleavage factor complex(GO:0005849) |
| 0.0 | 0.8 | GO:0071011 | precatalytic spliceosome(GO:0071011) |
| 0.0 | 0.3 | GO:0033018 | sarcoplasmic reticulum lumen(GO:0033018) |
| 0.0 | 0.7 | GO:0005922 | connexon complex(GO:0005922) |
| 0.0 | 0.5 | GO:0008074 | guanylate cyclase complex, soluble(GO:0008074) |
| 0.0 | 2.2 | GO:0031093 | platelet alpha granule lumen(GO:0031093) |
| 0.0 | 0.5 | GO:0005736 | DNA-directed RNA polymerase I complex(GO:0005736) |
| 0.0 | 1.0 | GO:0051233 | spindle midzone(GO:0051233) |
| 0.0 | 0.5 | GO:0036038 | MKS complex(GO:0036038) |
| 0.0 | 1.2 | GO:0098636 | protein complex involved in cell adhesion(GO:0098636) |
| 0.0 | 2.0 | GO:0034707 | chloride channel complex(GO:0034707) |
| 0.0 | 8.1 | GO:0005578 | proteinaceous extracellular matrix(GO:0005578) |
| 0.0 | 0.5 | GO:0002102 | podosome(GO:0002102) |
| 0.0 | 0.4 | GO:0097342 | ripoptosome(GO:0097342) |
| 0.0 | 1.1 | GO:0000307 | cyclin-dependent protein kinase holoenzyme complex(GO:0000307) |
| 0.0 | 0.3 | GO:0030127 | COPII vesicle coat(GO:0030127) |
| 0.0 | 0.2 | GO:0002199 | zona pellucida receptor complex(GO:0002199) |
| 0.0 | 0.6 | GO:0016327 | apicolateral plasma membrane(GO:0016327) |
| 0.0 | 27.0 | GO:0005615 | extracellular space(GO:0005615) |
| 0.0 | 0.5 | GO:0000145 | exocyst(GO:0000145) |
| 0.0 | 0.4 | GO:0032591 | dendritic spine membrane(GO:0032591) |
| 0.0 | 2.0 | GO:0005902 | microvillus(GO:0005902) |
| 0.0 | 0.1 | GO:0035525 | NF-kappaB p50/p65 complex(GO:0035525) |
| 0.0 | 0.1 | GO:0017071 | intracellular cyclic nucleotide activated cation channel complex(GO:0017071) |
| 0.0 | 0.2 | GO:0070083 | clathrin-sculpted monoamine transport vesicle(GO:0070081) clathrin-sculpted monoamine transport vesicle membrane(GO:0070083) |
| 0.0 | 0.1 | GO:0005885 | Arp2/3 protein complex(GO:0005885) |
| 0.0 | 0.7 | GO:0032420 | stereocilium(GO:0032420) |
| 0.0 | 0.4 | GO:0044295 | axonal growth cone(GO:0044295) |
| 0.0 | 0.3 | GO:0001891 | phagocytic cup(GO:0001891) |
| 0.0 | 0.2 | GO:0019773 | proteasome core complex, alpha-subunit complex(GO:0019773) |
| 0.0 | 9.7 | GO:0005925 | focal adhesion(GO:0005925) |
| 0.0 | 0.5 | GO:0022627 | cytosolic small ribosomal subunit(GO:0022627) |
| 0.0 | 0.4 | GO:0046658 | anchored component of plasma membrane(GO:0046658) |
| 0.0 | 0.2 | GO:0042613 | MHC class II protein complex(GO:0042613) |
| 0.0 | 0.2 | GO:0032059 | bleb(GO:0032059) |
| 0.0 | 0.2 | GO:0035631 | CD40 receptor complex(GO:0035631) |
Gene overrepresentation in molecular function category:
| Log-likelihood per target | Total log-likelihood | Term | Description |
|---|---|---|---|
| 1.8 | 7.0 | GO:0031727 | CCR2 chemokine receptor binding(GO:0031727) |
| 1.3 | 5.0 | GO:0061609 | fructose-1-phosphate aldolase activity(GO:0061609) |
| 1.2 | 11.0 | GO:0045545 | syndecan binding(GO:0045545) |
| 1.0 | 6.9 | GO:0030492 | hemoglobin binding(GO:0030492) |
| 0.8 | 6.8 | GO:0016019 | peptidoglycan receptor activity(GO:0016019) |
| 0.8 | 3.3 | GO:0001855 | complement component C4b binding(GO:0001855) |
| 0.7 | 7.0 | GO:0016724 | ferroxidase activity(GO:0004322) oxidoreductase activity, oxidizing metal ions, oxygen as acceptor(GO:0016724) |
| 0.6 | 2.5 | GO:0005260 | channel-conductance-controlling ATPase activity(GO:0005260) |
| 0.6 | 3.6 | GO:0052851 | cupric reductase activity(GO:0008823) ferric-chelate reductase (NADPH) activity(GO:0052851) |
| 0.6 | 4.6 | GO:0004614 | phosphoglucomutase activity(GO:0004614) |
| 0.5 | 1.5 | GO:0047391 | alkylglycerophosphoethanolamine phosphodiesterase activity(GO:0047391) |
| 0.4 | 1.3 | GO:0042007 | interleukin-18 binding(GO:0042007) |
| 0.4 | 2.3 | GO:0004522 | ribonuclease A activity(GO:0004522) |
| 0.4 | 2.2 | GO:0004505 | phenylalanine 4-monooxygenase activity(GO:0004505) |
| 0.4 | 3.0 | GO:0097643 | amylin receptor activity(GO:0097643) |
| 0.3 | 8.3 | GO:0031702 | type 1 angiotensin receptor binding(GO:0031702) |
| 0.3 | 2.0 | GO:0005017 | platelet-derived growth factor-activated receptor activity(GO:0005017) |
| 0.3 | 1.5 | GO:0055077 | gap junction hemi-channel activity(GO:0055077) gap junction channel activity involved in SA node cell-atrial cardiac muscle cell electrical coupling(GO:0086020) |
| 0.3 | 1.5 | GO:0016404 | 15-hydroxyprostaglandin dehydrogenase (NAD+) activity(GO:0016404) |
| 0.3 | 4.9 | GO:0070053 | thrombospondin receptor activity(GO:0070053) |
| 0.3 | 1.8 | GO:0004882 | androgen receptor activity(GO:0004882) |
| 0.3 | 1.7 | GO:0017098 | sulfonylurea receptor binding(GO:0017098) |
| 0.3 | 1.4 | GO:0019912 | cyclin-dependent protein kinase activating kinase activity(GO:0019912) |
| 0.3 | 1.1 | GO:0019770 | IgG receptor activity(GO:0019770) |
| 0.3 | 3.0 | GO:0048408 | epidermal growth factor binding(GO:0048408) |
| 0.3 | 1.1 | GO:0004967 | glucagon receptor activity(GO:0004967) |
| 0.3 | 2.4 | GO:0008269 | JAK pathway signal transduction adaptor activity(GO:0008269) |
| 0.3 | 0.8 | GO:0044715 | 8-oxo-dGDP phosphatase activity(GO:0044715) |
| 0.2 | 0.7 | GO:0004411 | homogentisate 1,2-dioxygenase activity(GO:0004411) |
| 0.2 | 4.9 | GO:0042301 | phosphate ion binding(GO:0042301) |
| 0.2 | 1.0 | GO:0000033 | alpha-1,3-mannosyltransferase activity(GO:0000033) |
| 0.2 | 1.1 | GO:0031728 | CCR3 chemokine receptor binding(GO:0031728) |
| 0.2 | 7.0 | GO:0005523 | tropomyosin binding(GO:0005523) |
| 0.2 | 1.4 | GO:0047045 | testosterone 17-beta-dehydrogenase (NADP+) activity(GO:0047045) |
| 0.2 | 0.6 | GO:0017129 | triglyceride binding(GO:0017129) |
| 0.2 | 1.2 | GO:0035614 | snRNA stem-loop binding(GO:0035614) |
| 0.2 | 1.7 | GO:0003854 | 3-beta-hydroxy-delta5-steroid dehydrogenase activity(GO:0003854) |
| 0.2 | 1.1 | GO:0010861 | thyroid hormone receptor activator activity(GO:0010861) thyroid hormone receptor coactivator activity(GO:0030375) |
| 0.2 | 1.0 | GO:0046899 | nucleoside triphosphate adenylate kinase activity(GO:0046899) |
| 0.2 | 0.9 | GO:0004337 | dimethylallyltranstransferase activity(GO:0004161) geranyltranstransferase activity(GO:0004337) |
| 0.2 | 2.4 | GO:0008199 | ferric iron binding(GO:0008199) |
| 0.2 | 4.4 | GO:0030247 | pattern binding(GO:0001871) polysaccharide binding(GO:0030247) |
| 0.2 | 1.5 | GO:0004064 | arylesterase activity(GO:0004064) |
| 0.1 | 0.6 | GO:0003953 | NAD+ nucleosidase activity(GO:0003953) |
| 0.1 | 1.0 | GO:0050119 | N-acetylglucosamine deacetylase activity(GO:0050119) |
| 0.1 | 2.0 | GO:0046790 | virion binding(GO:0046790) |
| 0.1 | 2.3 | GO:0004568 | chitinase activity(GO:0004568) |
| 0.1 | 0.9 | GO:0042806 | fucose binding(GO:0042806) |
| 0.1 | 0.7 | GO:0016941 | natriuretic peptide receptor activity(GO:0016941) |
| 0.1 | 1.0 | GO:0070568 | guanylyltransferase activity(GO:0070568) |
| 0.1 | 19.1 | GO:0004867 | serine-type endopeptidase inhibitor activity(GO:0004867) |
| 0.1 | 2.1 | GO:0016018 | cyclosporin A binding(GO:0016018) |
| 0.1 | 0.3 | GO:1990699 | palmitoleyl hydrolase activity(GO:1990699) |
| 0.1 | 8.6 | GO:0001784 | phosphotyrosine binding(GO:0001784) |
| 0.1 | 1.7 | GO:0015232 | heme transporter activity(GO:0015232) |
| 0.1 | 0.3 | GO:0015227 | acyl carnitine transmembrane transporter activity(GO:0015227) |
| 0.1 | 2.5 | GO:0042609 | CD4 receptor binding(GO:0042609) |
| 0.1 | 1.1 | GO:0008821 | crossover junction endodeoxyribonuclease activity(GO:0008821) |
| 0.1 | 0.8 | GO:0030229 | very-low-density lipoprotein particle receptor activity(GO:0030229) |
| 0.1 | 0.4 | GO:0047685 | amine sulfotransferase activity(GO:0047685) |
| 0.1 | 0.9 | GO:0050145 | nucleoside phosphate kinase activity(GO:0050145) |
| 0.1 | 0.5 | GO:0004995 | tachykinin receptor activity(GO:0004995) |
| 0.1 | 14.1 | GO:0004866 | endopeptidase inhibitor activity(GO:0004866) |
| 0.1 | 2.7 | GO:0004185 | serine-type carboxypeptidase activity(GO:0004185) |
| 0.1 | 0.8 | GO:0045029 | UDP-activated nucleotide receptor activity(GO:0045029) |
| 0.1 | 0.3 | GO:0019785 | ISG15-specific protease activity(GO:0019785) |
| 0.1 | 0.5 | GO:0050051 | alkane 1-monooxygenase activity(GO:0018685) leukotriene-B4 20-monooxygenase activity(GO:0050051) |
| 0.1 | 0.5 | GO:0034714 | type III transforming growth factor beta receptor binding(GO:0034714) |
| 0.1 | 0.8 | GO:0004571 | mannosyl-oligosaccharide 1,2-alpha-mannosidase activity(GO:0004571) |
| 0.1 | 0.4 | GO:0048248 | CXCR3 chemokine receptor binding(GO:0048248) |
| 0.1 | 0.6 | GO:1990050 | phosphatidic acid transporter activity(GO:1990050) |
| 0.1 | 0.3 | GO:0019150 | D-ribulokinase activity(GO:0019150) |
| 0.1 | 0.6 | GO:0002114 | interleukin-33 receptor activity(GO:0002114) |
| 0.1 | 28.0 | GO:0004252 | serine-type endopeptidase activity(GO:0004252) |
| 0.1 | 0.6 | GO:0004797 | thymidine kinase activity(GO:0004797) |
| 0.1 | 0.1 | GO:0004008 | copper-exporting ATPase activity(GO:0004008) copper-transporting ATPase activity(GO:0043682) |
| 0.1 | 0.6 | GO:0061135 | endopeptidase regulator activity(GO:0061135) |
| 0.1 | 0.6 | GO:0050815 | phosphoserine binding(GO:0050815) |
| 0.1 | 0.4 | GO:0004447 | iodide peroxidase activity(GO:0004447) |
| 0.1 | 0.6 | GO:0004704 | NF-kappaB-inducing kinase activity(GO:0004704) |
| 0.1 | 2.6 | GO:0004602 | glutathione peroxidase activity(GO:0004602) |
| 0.1 | 4.3 | GO:0005160 | transforming growth factor beta receptor binding(GO:0005160) |
| 0.1 | 1.9 | GO:0031005 | filamin binding(GO:0031005) |
| 0.1 | 1.1 | GO:0038062 | protein tyrosine kinase collagen receptor activity(GO:0038062) |
| 0.1 | 3.6 | GO:0034987 | immunoglobulin receptor binding(GO:0034987) |
| 0.1 | 0.6 | GO:0008158 | hedgehog receptor activity(GO:0008158) |
| 0.1 | 0.6 | GO:0047134 | protein-disulfide reductase activity(GO:0047134) |
| 0.1 | 8.7 | GO:0005518 | collagen binding(GO:0005518) |
| 0.1 | 0.8 | GO:0003964 | telomerase activity(GO:0003720) RNA-directed DNA polymerase activity(GO:0003964) |
| 0.1 | 0.5 | GO:0004849 | uridine kinase activity(GO:0004849) |
| 0.1 | 1.9 | GO:0031078 | histone deacetylase activity (H3-K14 specific)(GO:0031078) NAD-dependent histone deacetylase activity (H3-K14 specific)(GO:0032041) |
| 0.1 | 0.8 | GO:1901702 | urate transmembrane transporter activity(GO:0015143) salt transmembrane transporter activity(GO:1901702) |
| 0.1 | 0.4 | GO:0015450 | P-P-bond-hydrolysis-driven protein transmembrane transporter activity(GO:0015450) |
| 0.1 | 0.4 | GO:0047184 | 1-acylglycerophosphocholine O-acyltransferase activity(GO:0047184) |
| 0.1 | 0.4 | GO:0016427 | tRNA (cytosine) methyltransferase activity(GO:0016427) |
| 0.0 | 0.2 | GO:0004905 | type I interferon receptor activity(GO:0004905) |
| 0.0 | 0.8 | GO:0030169 | low-density lipoprotein particle binding(GO:0030169) |
| 0.0 | 0.2 | GO:0015222 | serotonin transmembrane transporter activity(GO:0015222) |
| 0.0 | 0.2 | GO:0001601 | peptide YY receptor activity(GO:0001601) |
| 0.0 | 1.4 | GO:0031402 | sodium ion binding(GO:0031402) |
| 0.0 | 0.8 | GO:0042975 | peroxisome proliferator activated receptor binding(GO:0042975) |
| 0.0 | 0.2 | GO:0004740 | pyruvate dehydrogenase (acetyl-transferring) kinase activity(GO:0004740) |
| 0.0 | 1.1 | GO:0016538 | cyclin-dependent protein serine/threonine kinase regulator activity(GO:0016538) |
| 0.0 | 0.5 | GO:0008046 | axon guidance receptor activity(GO:0008046) |
| 0.0 | 0.2 | GO:0004357 | glutamate-cysteine ligase activity(GO:0004357) |
| 0.0 | 1.1 | GO:0001968 | fibronectin binding(GO:0001968) |
| 0.0 | 1.0 | GO:0004181 | metallocarboxypeptidase activity(GO:0004181) |
| 0.0 | 1.2 | GO:0005159 | insulin-like growth factor receptor binding(GO:0005159) |
| 0.0 | 1.2 | GO:0005337 | nucleoside transmembrane transporter activity(GO:0005337) |
| 0.0 | 0.2 | GO:0008508 | bile acid:sodium symporter activity(GO:0008508) |
| 0.0 | 0.7 | GO:0008140 | cAMP response element binding protein binding(GO:0008140) |
| 0.0 | 0.2 | GO:1990932 | 5.8S rRNA binding(GO:1990932) |
| 0.0 | 4.6 | GO:0004222 | metalloendopeptidase activity(GO:0004222) |
| 0.0 | 0.5 | GO:0004579 | dolichyl-diphosphooligosaccharide-protein glycotransferase activity(GO:0004579) |
| 0.0 | 0.2 | GO:0097199 | cysteine-type endopeptidase activity involved in apoptotic signaling pathway(GO:0097199) |
| 0.0 | 0.2 | GO:0004735 | pyrroline-5-carboxylate reductase activity(GO:0004735) |
| 0.0 | 0.1 | GO:0005173 | stem cell factor receptor binding(GO:0005173) |
| 0.0 | 0.7 | GO:0008195 | phosphatidate phosphatase activity(GO:0008195) |
| 0.0 | 4.4 | GO:0019210 | kinase inhibitor activity(GO:0019210) |
| 0.0 | 0.7 | GO:0032036 | myosin heavy chain binding(GO:0032036) |
| 0.0 | 4.9 | GO:0005178 | integrin binding(GO:0005178) |
| 0.0 | 2.2 | GO:0030971 | receptor tyrosine kinase binding(GO:0030971) |
| 0.0 | 0.3 | GO:0008097 | 5S rRNA binding(GO:0008097) |
| 0.0 | 0.2 | GO:1990599 | 3' overhang single-stranded DNA endodeoxyribonuclease activity(GO:1990599) |
| 0.0 | 1.1 | GO:0005521 | lamin binding(GO:0005521) |
| 0.0 | 1.0 | GO:0008009 | chemokine activity(GO:0008009) |
| 0.0 | 0.6 | GO:0022841 | potassium ion leak channel activity(GO:0022841) |
| 0.0 | 0.2 | GO:0031404 | chloride ion binding(GO:0031404) |
| 0.0 | 7.5 | GO:0030674 | protein binding, bridging(GO:0030674) |
| 0.0 | 0.5 | GO:0004062 | aryl sulfotransferase activity(GO:0004062) |
| 0.0 | 0.4 | GO:0015187 | glycine transmembrane transporter activity(GO:0015187) |
| 0.0 | 0.9 | GO:0008236 | serine-type peptidase activity(GO:0008236) |
| 0.0 | 0.8 | GO:0004129 | cytochrome-c oxidase activity(GO:0004129) heme-copper terminal oxidase activity(GO:0015002) oxidoreductase activity, acting on a heme group of donors, oxygen as acceptor(GO:0016676) |
| 0.0 | 0.5 | GO:0001054 | RNA polymerase I activity(GO:0001054) |
| 0.0 | 0.1 | GO:0008523 | sodium-dependent multivitamin transmembrane transporter activity(GO:0008523) |
| 0.0 | 0.6 | GO:0016780 | phosphotransferase activity, for other substituted phosphate groups(GO:0016780) |
| 0.0 | 0.1 | GO:0031782 | melanocortin receptor binding(GO:0031779) type 3 melanocortin receptor binding(GO:0031781) type 4 melanocortin receptor binding(GO:0031782) |
| 0.0 | 0.8 | GO:0004467 | long-chain fatty acid-CoA ligase activity(GO:0004467) |
| 0.0 | 0.5 | GO:0008179 | adenylate cyclase binding(GO:0008179) |
| 0.0 | 0.3 | GO:0050692 | DBD domain binding(GO:0050692) |
| 0.0 | 0.2 | GO:0038132 | neuregulin binding(GO:0038132) |
| 0.0 | 0.3 | GO:0004089 | carbonate dehydratase activity(GO:0004089) |
| 0.0 | 0.1 | GO:0070891 | lipoteichoic acid binding(GO:0070891) |
| 0.0 | 2.6 | GO:0003730 | mRNA 3'-UTR binding(GO:0003730) |
| 0.0 | 0.2 | GO:0001075 | transcription factor activity, RNA polymerase II core promoter sequence-specific binding involved in preinitiation complex assembly(GO:0001075) |
| 0.0 | 0.2 | GO:0000213 | tRNA-intron endonuclease activity(GO:0000213) |
| 0.0 | 1.0 | GO:0032266 | phosphatidylinositol-3-phosphate binding(GO:0032266) |
| 0.0 | 0.6 | GO:0050840 | extracellular matrix binding(GO:0050840) |
| 0.0 | 0.1 | GO:0001632 | leukotriene B4 receptor activity(GO:0001632) |
| 0.0 | 0.5 | GO:0008494 | translation activator activity(GO:0008494) |
| 0.0 | 0.2 | GO:0005540 | hyaluronic acid binding(GO:0005540) |
| 0.0 | 0.5 | GO:0017049 | GTP-Rho binding(GO:0017049) |
| 0.0 | 2.1 | GO:0005179 | hormone activity(GO:0005179) |
| 0.0 | 0.4 | GO:0004143 | diacylglycerol kinase activity(GO:0004143) |
| 0.0 | 1.4 | GO:0005201 | extracellular matrix structural constituent(GO:0005201) |
| 0.0 | 0.5 | GO:0017147 | Wnt-protein binding(GO:0017147) |
| 0.0 | 0.2 | GO:0032395 | MHC class II receptor activity(GO:0032395) |
| 0.0 | 0.0 | GO:0004500 | dopamine beta-monooxygenase activity(GO:0004500) |
| 0.0 | 0.2 | GO:0016174 | NAD(P)H oxidase activity(GO:0016174) |
| 0.0 | 0.2 | GO:0016494 | C-X-C chemokine receptor activity(GO:0016494) |
| 0.0 | 0.3 | GO:0004535 | poly(A)-specific ribonuclease activity(GO:0004535) |
| 0.0 | 0.1 | GO:0008048 | calcium sensitive guanylate cyclase activator activity(GO:0008048) |
| 0.0 | 1.2 | GO:0001618 | virus receptor activity(GO:0001618) |
| 0.0 | 0.4 | GO:0001011 | transcription factor activity, sequence-specific DNA binding, RNA polymerase recruiting(GO:0001011) transcription factor activity, TFIIB-class binding(GO:0001087) |
| 0.0 | 0.2 | GO:0046625 | sphingolipid binding(GO:0046625) |
| 0.0 | 0.2 | GO:0008970 | phosphatidylcholine 1-acylhydrolase activity(GO:0008970) |
| 0.0 | 0.2 | GO:0031996 | thioesterase binding(GO:0031996) |
| 0.0 | 0.1 | GO:0000340 | RNA 7-methylguanosine cap binding(GO:0000340) |
| 0.0 | 0.5 | GO:0042169 | SH2 domain binding(GO:0042169) |
Gene overrepresentation in curated gene sets: canonical pathways category:
| Log-likelihood per target | Total log-likelihood | Term | Description |
|---|---|---|---|
| 0.4 | 32.5 | PID INTEGRIN3 PATHWAY | Beta3 integrin cell surface interactions |
| 0.3 | 4.4 | ST JAK STAT PATHWAY | Jak-STAT Pathway |
| 0.2 | 4.9 | PID THROMBIN PAR4 PATHWAY | PAR4-mediated thrombin signaling events |
| 0.2 | 10.3 | PID PRL SIGNALING EVENTS PATHWAY | Signaling events mediated by PRL |
| 0.2 | 10.5 | PID IL23 PATHWAY | IL23-mediated signaling events |
| 0.1 | 5.3 | PID TOLL ENDOGENOUS PATHWAY | Endogenous TLR signaling |
| 0.1 | 5.4 | PID PDGFRA PATHWAY | PDGFR-alpha signaling pathway |
| 0.1 | 12.7 | PID HNF3A PATHWAY | FOXA1 transcription factor network |
| 0.1 | 35.3 | NABA ECM REGULATORS | Genes encoding enzymes and their regulators involved in the remodeling of the extracellular matrix |
| 0.1 | 1.3 | PID IL2 1PATHWAY | IL2-mediated signaling events |
| 0.1 | 6.1 | PID HNF3B PATHWAY | FOXA2 and FOXA3 transcription factor networks |
| 0.1 | 8.1 | PID HIF1 TFPATHWAY | HIF-1-alpha transcription factor network |
| 0.1 | 4.1 | ST PHOSPHOINOSITIDE 3 KINASE PATHWAY | PI3K Pathway |
| 0.1 | 1.0 | NABA BASEMENT MEMBRANES | Genes encoding structural components of basement membranes |
| 0.0 | 2.4 | NABA PROTEOGLYCANS | Genes encoding proteoglycans |
| 0.0 | 1.0 | PID P38 GAMMA DELTA PATHWAY | Signaling mediated by p38-gamma and p38-delta |
| 0.0 | 1.3 | SIG INSULIN RECEPTOR PATHWAY IN CARDIAC MYOCYTES | Genes related to the insulin receptor pathway |
| 0.0 | 1.2 | PID INTEGRIN2 PATHWAY | Beta2 integrin cell surface interactions |
| 0.0 | 0.8 | SA G1 AND S PHASES | Cdk2, 4, and 6 bind cyclin D in G1, while cdk2/cyclin E promotes the G1/S transition. |
| 0.0 | 1.6 | PID IL6 7 PATHWAY | IL6-mediated signaling events |
| 0.0 | 9.6 | NABA ECM AFFILIATED | Genes encoding proteins affiliated structurally or functionally to extracellular matrix proteins |
| 0.0 | 15.8 | NABA MATRISOME ASSOCIATED | Ensemble of genes encoding ECM-associated proteins including ECM-affilaited proteins, ECM regulators and secreted factors |
| 0.0 | 1.2 | PID INTEGRIN1 PATHWAY | Beta1 integrin cell surface interactions |
| 0.0 | 9.9 | NABA ECM GLYCOPROTEINS | Genes encoding structural ECM glycoproteins |
| 0.0 | 0.8 | PID HEDGEHOG 2PATHWAY | Signaling events mediated by the Hedgehog family |
| 0.0 | 0.8 | PID KIT PATHWAY | Signaling events mediated by Stem cell factor receptor (c-Kit) |
| 0.0 | 0.9 | PID ECADHERIN KERATINOCYTE PATHWAY | E-cadherin signaling in keratinocytes |
| 0.0 | 0.7 | PID INSULIN GLUCOSE PATHWAY | Insulin-mediated glucose transport |
| 0.0 | 0.3 | PID IL8 CXCR2 PATHWAY | IL8- and CXCR2-mediated signaling events |
| 0.0 | 0.7 | PID ANGIOPOIETIN RECEPTOR PATHWAY | Angiopoietin receptor Tie2-mediated signaling |
| 0.0 | 0.6 | PID IL1 PATHWAY | IL1-mediated signaling events |
| 0.0 | 1.1 | PID PS1 PATHWAY | Presenilin action in Notch and Wnt signaling |
| 0.0 | 0.4 | PID CIRCADIAN PATHWAY | Circadian rhythm pathway |
| 0.0 | 0.2 | SIG CD40PATHWAYMAP | Genes related to CD40 signaling |
| 0.0 | 0.5 | PID BCR 5PATHWAY | BCR signaling pathway |
| 0.0 | 0.6 | PID TCR CALCIUM PATHWAY | Calcium signaling in the CD4+ TCR pathway |
| 0.0 | 0.4 | PID P38 MKK3 6PATHWAY | p38 MAPK signaling pathway |
| 0.0 | 0.7 | PID ARF6 TRAFFICKING PATHWAY | Arf6 trafficking events |
| 0.0 | 1.6 | PID CMYB PATHWAY | C-MYB transcription factor network |
| 0.0 | 0.2 | PID ERBB NETWORK PATHWAY | ErbB receptor signaling network |
Gene overrepresentation in curated gene sets: REACTOME pathways category:
| Log-likelihood per target | Total log-likelihood | Term | Description |
|---|---|---|---|
| 1.8 | 34.6 | REACTOME COMMON PATHWAY | Genes involved in Common Pathway |
| 0.6 | 14.3 | REACTOME REGULATION OF COMPLEMENT CASCADE | Genes involved in Regulation of Complement cascade |
| 0.5 | 7.6 | REACTOME CREATION OF C4 AND C2 ACTIVATORS | Genes involved in Creation of C4 and C2 activators |
| 0.5 | 5.4 | REACTOME COMPLEMENT CASCADE | Genes involved in Complement cascade |
| 0.4 | 8.3 | REACTOME IL 6 SIGNALING | Genes involved in Interleukin-6 signaling |
| 0.3 | 1.3 | REACTOME SIGNALING BY SCF KIT | Genes involved in Signaling by SCF-KIT |
| 0.3 | 7.7 | REACTOME INTRINSIC PATHWAY | Genes involved in Intrinsic Pathway |
| 0.3 | 5.0 | REACTOME IKK COMPLEX RECRUITMENT MEDIATED BY RIP1 | Genes involved in IKK complex recruitment mediated by RIP1 |
| 0.2 | 3.1 | REACTOME TRAFFICKING AND PROCESSING OF ENDOSOMAL TLR | Genes involved in Trafficking and processing of endosomal TLR |
| 0.2 | 7.2 | REACTOME METAL ION SLC TRANSPORTERS | Genes involved in Metal ion SLC transporters |
| 0.1 | 5.1 | REACTOME G BETA GAMMA SIGNALLING THROUGH PLC BETA | Genes involved in G beta:gamma signalling through PLC beta |
| 0.1 | 6.0 | REACTOME GROWTH HORMONE RECEPTOR SIGNALING | Genes involved in Growth hormone receptor signaling |
| 0.1 | 8.4 | REACTOME SMOOTH MUSCLE CONTRACTION | Genes involved in Smooth Muscle Contraction |
| 0.1 | 3.4 | REACTOME SIGNAL ATTENUATION | Genes involved in Signal attenuation |
| 0.1 | 18.0 | REACTOME INTEGRIN CELL SURFACE INTERACTIONS | Genes involved in Integrin cell surface interactions |
| 0.1 | 1.8 | REACTOME REVERSIBLE HYDRATION OF CARBON DIOXIDE | Genes involved in Reversible Hydration of Carbon Dioxide |
| 0.1 | 2.5 | REACTOME CHYLOMICRON MEDIATED LIPID TRANSPORT | Genes involved in Chylomicron-mediated lipid transport |
| 0.1 | 2.6 | REACTOME REGULATION OF INSULIN LIKE GROWTH FACTOR IGF ACTIVITY BY INSULIN LIKE GROWTH FACTOR BINDING PROTEINS IGFBPS | Genes involved in Regulation of Insulin-like Growth Factor (IGF) Activity by Insulin-like Growth Factor Binding Proteins (IGFBPs) |
| 0.1 | 1.4 | REACTOME SYNTHESIS OF BILE ACIDS AND BILE SALTS VIA 24 HYDROXYCHOLESTEROL | Genes involved in Synthesis of bile acids and bile salts via 24-hydroxycholesterol |
| 0.1 | 2.5 | REACTOME TIE2 SIGNALING | Genes involved in Tie2 Signaling |
| 0.1 | 0.9 | REACTOME TRYPTOPHAN CATABOLISM | Genes involved in Tryptophan catabolism |
| 0.1 | 4.2 | REACTOME GLYCOLYSIS | Genes involved in Glycolysis |
| 0.1 | 2.4 | REACTOME ACTIVATION OF GENES BY ATF4 | Genes involved in Activation of Genes by ATF4 |
| 0.1 | 1.6 | REACTOME AKT PHOSPHORYLATES TARGETS IN THE CYTOSOL | Genes involved in AKT phosphorylates targets in the cytosol |
| 0.0 | 2.4 | REACTOME TIGHT JUNCTION INTERACTIONS | Genes involved in Tight junction interactions |
| 0.0 | 1.5 | REACTOME ENOS ACTIVATION AND REGULATION | Genes involved in eNOS activation and regulation |
| 0.0 | 1.8 | REACTOME CELL EXTRACELLULAR MATRIX INTERACTIONS | Genes involved in Cell-extracellular matrix interactions |
| 0.0 | 2.5 | REACTOME ABC FAMILY PROTEINS MEDIATED TRANSPORT | Genes involved in ABC-family proteins mediated transport |
| 0.0 | 1.7 | REACTOME INWARDLY RECTIFYING K CHANNELS | Genes involved in Inwardly rectifying K+ channels |
| 0.0 | 9.7 | REACTOME PPARA ACTIVATES GENE EXPRESSION | Genes involved in PPARA Activates Gene Expression |
| 0.0 | 1.5 | REACTOME BIOSYNTHESIS OF THE N GLYCAN PRECURSOR DOLICHOL LIPID LINKED OLIGOSACCHARIDE LLO AND TRANSFER TO A NASCENT PROTEIN | Genes involved in Biosynthesis of the N-glycan precursor (dolichol lipid-linked oligosaccharide, LLO) and transfer to a nascent protein |
| 0.0 | 1.2 | REACTOME CTLA4 INHIBITORY SIGNALING | Genes involved in CTLA4 inhibitory signaling |
| 0.0 | 1.3 | REACTOME DEGRADATION OF THE EXTRACELLULAR MATRIX | Genes involved in Degradation of the extracellular matrix |
| 0.0 | 4.0 | REACTOME CLASS B 2 SECRETIN FAMILY RECEPTORS | Genes involved in Class B/2 (Secretin family receptors) |
| 0.0 | 2.9 | REACTOME COLLAGEN FORMATION | Genes involved in Collagen formation |
| 0.0 | 0.8 | REACTOME P2Y RECEPTORS | Genes involved in P2Y receptors |
| 0.0 | 0.8 | REACTOME CYTOSOLIC SULFONATION OF SMALL MOLECULES | Genes involved in Cytosolic sulfonation of small molecules |
| 0.0 | 0.2 | REACTOME TRAF6 MEDIATED IRF7 ACTIVATION IN TLR7 8 OR 9 SIGNALING | Genes involved in TRAF6 mediated IRF7 activation in TLR7/8 or 9 signaling |
| 0.0 | 0.8 | REACTOME PROCESSING OF INTRONLESS PRE MRNAS | Genes involved in Processing of Intronless Pre-mRNAs |
| 0.0 | 0.9 | REACTOME CS DS DEGRADATION | Genes involved in CS/DS degradation |
| 0.0 | 0.5 | REACTOME REGULATION OF IFNA SIGNALING | Genes involved in Regulation of IFNA signaling |
| 0.0 | 0.9 | REACTOME CHOLESTEROL BIOSYNTHESIS | Genes involved in Cholesterol biosynthesis |
| 0.0 | 0.7 | REACTOME GAP JUNCTION ASSEMBLY | Genes involved in Gap junction assembly |
| 0.0 | 0.4 | REACTOME KERATAN SULFATE DEGRADATION | Genes involved in Keratan sulfate degradation |
| 0.0 | 2.8 | REACTOME RESPONSE TO ELEVATED PLATELET CYTOSOLIC CA2 | Genes involved in Response to elevated platelet cytosolic Ca2+ |
| 0.0 | 0.3 | REACTOME ACTIVATION OF IRF3 IRF7 MEDIATED BY TBK1 IKK EPSILON | Genes involved in Activation of IRF3/IRF7 mediated by TBK1/IKK epsilon |
| 0.0 | 0.7 | REACTOME RIP MEDIATED NFKB ACTIVATION VIA DAI | Genes involved in RIP-mediated NFkB activation via DAI |
| 0.0 | 1.5 | REACTOME TRANSPORT OF VITAMINS NUCLEOSIDES AND RELATED MOLECULES | Genes involved in Transport of vitamins, nucleosides, and related molecules |
| 0.0 | 0.7 | REACTOME INSULIN SYNTHESIS AND PROCESSING | Genes involved in Insulin Synthesis and Processing |
| 0.0 | 1.0 | REACTOME HS GAG BIOSYNTHESIS | Genes involved in HS-GAG biosynthesis |
| 0.0 | 1.1 | REACTOME PYRIMIDINE METABOLISM | Genes involved in Pyrimidine metabolism |
| 0.0 | 2.0 | REACTOME INTERFERON ALPHA BETA SIGNALING | Genes involved in Interferon alpha/beta signaling |
| 0.0 | 0.9 | REACTOME SEMA4D INDUCED CELL MIGRATION AND GROWTH CONE COLLAPSE | Genes involved in Sema4D induced cell migration and growth-cone collapse |
| 0.0 | 0.1 | REACTOME REGULATION OF KIT SIGNALING | Genes involved in Regulation of KIT signaling |
| 0.0 | 0.6 | REACTOME DOWNSTREAM SIGNAL TRANSDUCTION | Genes involved in Downstream signal transduction |
| 0.0 | 0.4 | REACTOME CLASS C 3 METABOTROPIC GLUTAMATE PHEROMONE RECEPTORS | Genes involved in Class C/3 (Metabotropic glutamate/pheromone receptors) |
| 0.0 | 0.1 | REACTOME SYNTHESIS SECRETION AND INACTIVATION OF GLP1 | Genes involved in Synthesis, Secretion, and Inactivation of Glucagon-like Peptide-1 (GLP-1) |
| 0.0 | 1.4 | REACTOME METABOLISM OF VITAMINS AND COFACTORS | Genes involved in Metabolism of vitamins and cofactors |
| 0.0 | 0.2 | REACTOME NFKB ACTIVATION THROUGH FADD RIP1 PATHWAY MEDIATED BY CASPASE 8 AND10 | Genes involved in NF-kB activation through FADD/RIP-1 pathway mediated by caspase-8 and -10 |
| 0.0 | 0.3 | REACTOME DCC MEDIATED ATTRACTIVE SIGNALING | Genes involved in DCC mediated attractive signaling |
| 0.0 | 0.5 | REACTOME ASSOCIATION OF TRIC CCT WITH TARGET PROTEINS DURING BIOSYNTHESIS | Genes involved in Association of TriC/CCT with target proteins during biosynthesis |
| 0.0 | 0.3 | REACTOME PRESYNAPTIC NICOTINIC ACETYLCHOLINE RECEPTORS | Genes involved in Presynaptic nicotinic acetylcholine receptors |
| 0.0 | 0.5 | REACTOME RNA POL I TRANSCRIPTION TERMINATION | Genes involved in RNA Polymerase I Transcription Termination |
| 0.0 | 0.2 | REACTOME REGULATION OF PYRUVATE DEHYDROGENASE PDH COMPLEX | Genes involved in Regulation of pyruvate dehydrogenase (PDH) complex |
| 0.0 | 1.1 | REACTOME ASPARAGINE N LINKED GLYCOSYLATION | Genes involved in Asparagine N-linked glycosylation |
| 0.0 | 0.1 | REACTOME NEF MEDIATES DOWN MODULATION OF CELL SURFACE RECEPTORS BY RECRUITING THEM TO CLATHRIN ADAPTERS | Genes involved in Nef-mediates down modulation of cell surface receptors by recruiting them to clathrin adapters |
| 0.0 | 0.2 | REACTOME BILE SALT AND ORGANIC ANION SLC TRANSPORTERS | Genes involved in Bile salt and organic anion SLC transporters |
| 0.0 | 0.6 | REACTOME SMAD2 SMAD3 SMAD4 HETEROTRIMER REGULATES TRANSCRIPTION | Genes involved in SMAD2/SMAD3:SMAD4 heterotrimer regulates transcription |
| 0.0 | 1.2 | REACTOME NUCLEAR RECEPTOR TRANSCRIPTION PATHWAY | Genes involved in Nuclear Receptor transcription pathway |