Project
Illumina Body Map 2 (GSE30611)
Navigation
Downloads
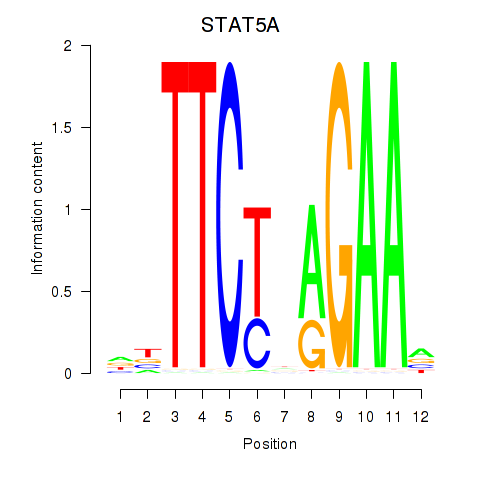
Results for STAT5A
Z-value: 1.49
Motif logo
Transcription factors associated with STAT5A
| Gene Symbol | Gene ID | Gene Info |
|---|---|---|
|
STAT5A
|
ENSG00000126561.18 | signal transducer and activator of transcription 5A |
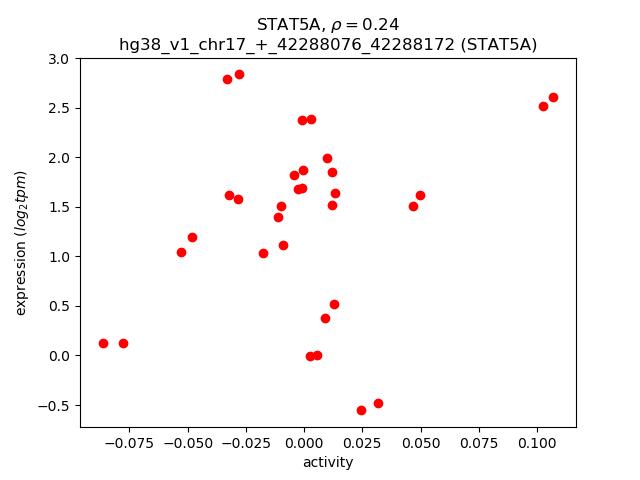
Activity-expression correlation:
| Gene | Promoter | Pearson corr. coef. | P-value | Plot |
|---|---|---|---|---|
| STAT5A | hg38_v1_chr17_+_42288076_42288172 | 0.24 | 1.8e-01 | Click! |
Activity profile of STAT5A motif
Sorted Z-values of STAT5A motif
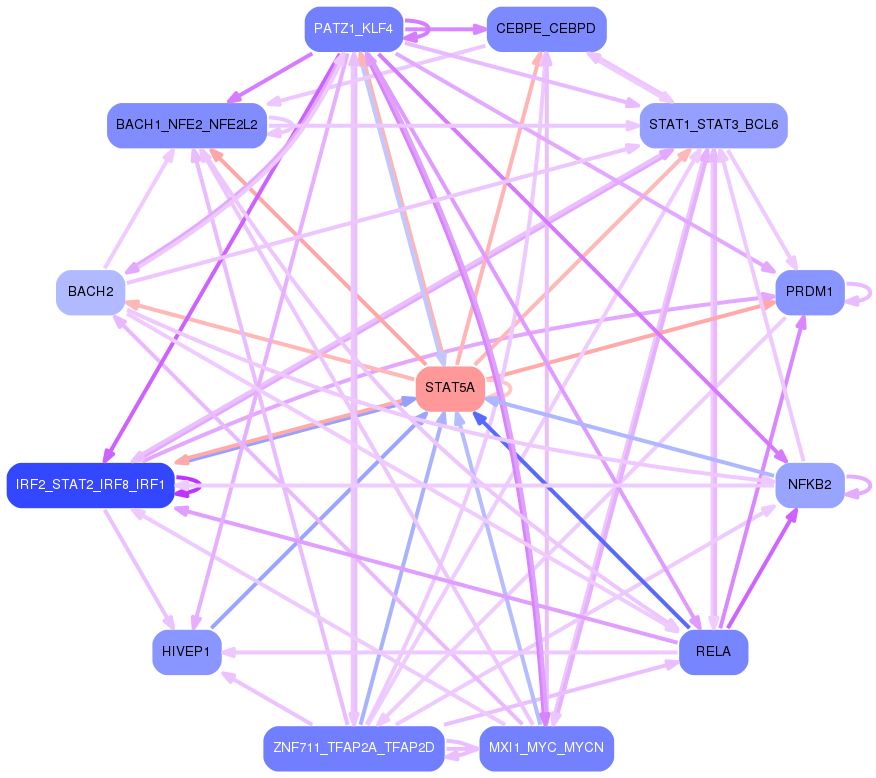
Network of associatons between targets according to the STRING database.

First level regulatory network of STAT5A
Gene Ontology Analysis
Gene overrepresentation in biological process category:
| Log-likelihood per target | Total log-likelihood | Term | Description |
|---|---|---|---|
| 3.1 | 9.3 | GO:0002728 | negative regulation of natural killer cell cytokine production(GO:0002728) |
| 1.9 | 5.7 | GO:1905204 | regulation of connective tissue replacement involved in inflammatory response wound healing(GO:1904596) negative regulation of connective tissue replacement involved in inflammatory response wound healing(GO:1904597) regulation of advanced glycation end-product receptor activity(GO:1904603) negative regulation of advanced glycation end-product receptor activity(GO:1904604) negative regulation of connective tissue replacement(GO:1905204) |
| 1.5 | 4.5 | GO:0034130 | toll-like receptor 1 signaling pathway(GO:0034130) |
| 1.5 | 7.3 | GO:0071725 | toll-like receptor TLR1:TLR2 signaling pathway(GO:0038123) response to triacyl bacterial lipopeptide(GO:0071725) cellular response to triacyl bacterial lipopeptide(GO:0071727) |
| 1.3 | 4.0 | GO:0035915 | pore formation in membrane of other organism(GO:0035915) |
| 1.2 | 4.6 | GO:0005986 | sucrose biosynthetic process(GO:0005986) |
| 1.1 | 5.6 | GO:0002357 | defense response to tumor cell(GO:0002357) |
| 1.0 | 3.1 | GO:0038178 | complement component C5a signaling pathway(GO:0038178) |
| 0.9 | 5.6 | GO:0071461 | cellular response to redox state(GO:0071461) |
| 0.9 | 5.6 | GO:0002729 | positive regulation of natural killer cell cytokine production(GO:0002729) |
| 0.9 | 3.7 | GO:0060708 | spongiotrophoblast differentiation(GO:0060708) |
| 0.9 | 6.4 | GO:2000110 | negative regulation of macrophage apoptotic process(GO:2000110) |
| 0.9 | 2.6 | GO:0015734 | taurine transport(GO:0015734) |
| 0.8 | 9.2 | GO:0060267 | positive regulation of respiratory burst(GO:0060267) |
| 0.8 | 4.1 | GO:0046013 | regulation of T cell homeostatic proliferation(GO:0046013) |
| 0.8 | 3.9 | GO:0015855 | pyrimidine nucleobase transport(GO:0015855) purine nucleobase transmembrane transport(GO:1904823) |
| 0.8 | 2.4 | GO:1990654 | sebum secreting cell proliferation(GO:1990654) |
| 0.8 | 4.7 | GO:0070269 | pyroptosis(GO:0070269) |
| 0.8 | 0.8 | GO:1902214 | regulation of interleukin-4-mediated signaling pathway(GO:1902214) |
| 0.7 | 6.6 | GO:0008626 | granzyme-mediated apoptotic signaling pathway(GO:0008626) |
| 0.7 | 3.6 | GO:0010751 | negative regulation of nitric oxide mediated signal transduction(GO:0010751) |
| 0.7 | 2.8 | GO:1902161 | positive regulation of cyclic nucleotide-gated ion channel activity(GO:1902161) |
| 0.7 | 1.3 | GO:0002876 | positive regulation of chronic inflammatory response to antigenic stimulus(GO:0002876) |
| 0.7 | 2.0 | GO:0019303 | D-ribose catabolic process(GO:0019303) |
| 0.6 | 1.9 | GO:0002581 | negative regulation of antigen processing and presentation of peptide or polysaccharide antigen via MHC class II(GO:0002581) |
| 0.6 | 2.5 | GO:0002290 | gamma-delta T cell activation involved in immune response(GO:0002290) negative regulation of interferon-beta secretion(GO:0035548) regulation of gamma-delta T cell activation involved in immune response(GO:2001191) positive regulation of gamma-delta T cell activation involved in immune response(GO:2001193) |
| 0.6 | 7.5 | GO:0016554 | cytidine to uridine editing(GO:0016554) |
| 0.6 | 2.5 | GO:0032747 | positive regulation of interleukin-23 production(GO:0032747) |
| 0.6 | 1.7 | GO:0060559 | positive regulation of vitamin metabolic process(GO:0046136) positive regulation of vitamin D biosynthetic process(GO:0060557) positive regulation of calcidiol 1-monooxygenase activity(GO:0060559) |
| 0.5 | 2.2 | GO:0043091 | L-arginine import(GO:0043091) arginine import(GO:0090467) |
| 0.5 | 3.2 | GO:0060370 | susceptibility to T cell mediated cytotoxicity(GO:0060370) |
| 0.5 | 1.6 | GO:0002769 | natural killer cell inhibitory signaling pathway(GO:0002769) |
| 0.5 | 1.6 | GO:1902688 | regulation of NAD metabolic process(GO:1902688) |
| 0.5 | 1.6 | GO:1903595 | positive regulation of histamine secretion by mast cell(GO:1903595) |
| 0.5 | 3.2 | GO:0014835 | myoblast differentiation involved in skeletal muscle regeneration(GO:0014835) positive regulation of interleukin-12 secretion(GO:2001184) |
| 0.5 | 6.2 | GO:0002291 | T cell activation via T cell receptor contact with antigen bound to MHC molecule on antigen presenting cell(GO:0002291) |
| 0.5 | 2.6 | GO:0090290 | positive regulation of osteoclast proliferation(GO:0090290) |
| 0.5 | 2.9 | GO:0038112 | interleukin-8-mediated signaling pathway(GO:0038112) |
| 0.5 | 1.9 | GO:0061580 | colon epithelial cell migration(GO:0061580) |
| 0.5 | 3.8 | GO:0097527 | necroptotic signaling pathway(GO:0097527) |
| 0.5 | 3.3 | GO:0060263 | regulation of respiratory burst(GO:0060263) |
| 0.5 | 7.0 | GO:0018377 | protein myristoylation(GO:0018377) |
| 0.5 | 1.4 | GO:1903125 | regulation of thioredoxin peroxidase activity(GO:1903123) negative regulation of thioredoxin peroxidase activity(GO:1903124) negative regulation of thioredoxin peroxidase activity by peptidyl-threonine phosphorylation(GO:1903125) Wnt signalosome assembly(GO:1904887) negative regulation of peroxidase activity(GO:2000469) |
| 0.4 | 1.3 | GO:0046110 | negative regulation of circadian sleep/wake cycle, non-REM sleep(GO:0042323) xanthine metabolic process(GO:0046110) negative regulation of mucus secretion(GO:0070256) |
| 0.4 | 2.2 | GO:2001274 | negative regulation of glucose import in response to insulin stimulus(GO:2001274) |
| 0.4 | 1.2 | GO:0002415 | immunoglobulin transcytosis in epithelial cells mediated by polymeric immunoglobulin receptor(GO:0002415) |
| 0.4 | 1.6 | GO:2000342 | negative regulation of chemokine (C-X-C motif) ligand 2 production(GO:2000342) |
| 0.4 | 5.7 | GO:0043152 | induction of bacterial agglutination(GO:0043152) |
| 0.4 | 1.2 | GO:0036292 | DNA rewinding(GO:0036292) |
| 0.4 | 1.6 | GO:0036367 | adaptation of rhodopsin mediated signaling(GO:0016062) light adaption(GO:0036367) |
| 0.4 | 1.2 | GO:0002339 | B cell selection(GO:0002339) |
| 0.4 | 1.2 | GO:0045062 | extrathymic T cell selection(GO:0045062) |
| 0.4 | 2.3 | GO:0008218 | bioluminescence(GO:0008218) |
| 0.4 | 2.3 | GO:0045959 | regulation of complement activation, classical pathway(GO:0030450) negative regulation of complement activation, classical pathway(GO:0045959) |
| 0.4 | 0.8 | GO:1902573 | positive regulation of serine-type endopeptidase activity(GO:1900005) positive regulation of serine-type peptidase activity(GO:1902573) |
| 0.4 | 1.2 | GO:0005999 | xylulose biosynthetic process(GO:0005999) |
| 0.4 | 6.8 | GO:0045059 | positive thymic T cell selection(GO:0045059) |
| 0.4 | 2.1 | GO:1903464 | negative regulation of mitotic cell cycle DNA replication(GO:1903464) |
| 0.4 | 2.8 | GO:0035655 | interleukin-18-mediated signaling pathway(GO:0035655) cellular response to interleukin-18(GO:0071351) |
| 0.3 | 3.1 | GO:0061737 | leukotriene signaling pathway(GO:0061737) |
| 0.3 | 1.0 | GO:1902769 | regulation of choline O-acetyltransferase activity(GO:1902769) positive regulation of choline O-acetyltransferase activity(GO:1902771) negative regulation of tau-protein kinase activity(GO:1902948) positive regulation of early endosome to recycling endosome transport(GO:1902955) negative regulation of aspartic-type endopeptidase activity involved in amyloid precursor protein catabolic process(GO:1902960) negative regulation of neurofibrillary tangle assembly(GO:1902997) negative regulation of aspartic-type peptidase activity(GO:1905246) |
| 0.3 | 1.0 | GO:1901301 | regulation of cargo loading into COPII-coated vesicle(GO:1901301) |
| 0.3 | 4.0 | GO:2000332 | blood microparticle formation(GO:0072564) regulation of blood microparticle formation(GO:2000332) positive regulation of blood microparticle formation(GO:2000334) |
| 0.3 | 1.6 | GO:0060474 | positive regulation of sperm motility involved in capacitation(GO:0060474) |
| 0.3 | 4.4 | GO:0002430 | complement receptor mediated signaling pathway(GO:0002430) |
| 0.3 | 0.9 | GO:1990258 | box C/D snoRNA 3'-end processing(GO:0000494) box C/D snoRNA metabolic process(GO:0033967) box C/D snoRNA processing(GO:0034963) histone glutamine methylation(GO:1990258) |
| 0.3 | 0.9 | GO:0061485 | memory T cell proliferation(GO:0061485) |
| 0.3 | 0.9 | GO:0003032 | detection of oxygen(GO:0003032) |
| 0.3 | 4.4 | GO:0044351 | macropinocytosis(GO:0044351) |
| 0.3 | 1.4 | GO:0002925 | positive regulation of humoral immune response mediated by circulating immunoglobulin(GO:0002925) |
| 0.3 | 4.6 | GO:0050861 | positive regulation of B cell receptor signaling pathway(GO:0050861) |
| 0.3 | 0.3 | GO:1902954 | regulation of early endosome to recycling endosome transport(GO:1902954) |
| 0.3 | 0.8 | GO:0016237 | lysosomal microautophagy(GO:0016237) piecemeal microautophagy of nucleus(GO:0034727) suppression by virus of host autophagy(GO:0039521) |
| 0.3 | 0.3 | GO:1903895 | negative regulation of IRE1-mediated unfolded protein response(GO:1903895) |
| 0.3 | 1.0 | GO:0061302 | smooth muscle cell-matrix adhesion(GO:0061302) |
| 0.3 | 1.3 | GO:0032416 | negative regulation of sodium:proton antiporter activity(GO:0032416) |
| 0.2 | 1.0 | GO:0072334 | UDP-galactose transport(GO:0015785) UDP-galactose transmembrane transport(GO:0072334) |
| 0.2 | 3.9 | GO:0033227 | dsRNA transport(GO:0033227) |
| 0.2 | 2.1 | GO:0006659 | phosphatidylserine biosynthetic process(GO:0006659) |
| 0.2 | 0.7 | GO:1903988 | spleen trabecula formation(GO:0060345) divalent metal ion export(GO:0070839) iron cation export(GO:1903414) ferrous iron export(GO:1903988) |
| 0.2 | 1.2 | GO:0061304 | retinal blood vessel morphogenesis(GO:0061304) endothelial cell-cell adhesion(GO:0071603) |
| 0.2 | 1.6 | GO:0032252 | secretory granule localization(GO:0032252) |
| 0.2 | 0.9 | GO:0044115 | multi-organism catabolic process(GO:0044035) development of symbiont involved in interaction with host(GO:0044115) modulation of development of symbiont involved in interaction with host(GO:0044145) negative regulation of development of symbiont involved in interaction with host(GO:0044147) metabolism of substance in other organism involved in symbiotic interaction(GO:0052214) catabolism of substance in other organism involved in symbiotic interaction(GO:0052227) metabolism of macromolecule in other organism involved in symbiotic interaction(GO:0052229) catabolism by host of symbiont macromolecule(GO:0052360) catabolism by organism of macromolecule in other organism involved in symbiotic interaction(GO:0052361) catabolism by host of symbiont protein(GO:0052362) catabolism by organism of protein in other organism involved in symbiotic interaction(GO:0052363) catabolism by host of substance in symbiont(GO:0052364) metabolism by host of symbiont macromolecule(GO:0052416) metabolism by host of symbiont protein(GO:0052417) metabolism by organism of protein in other organism involved in symbiotic interaction(GO:0052418) metabolism by host of substance in symbiont(GO:0052419) |
| 0.2 | 0.9 | GO:0097089 | methyl-branched fatty acid metabolic process(GO:0097089) |
| 0.2 | 1.6 | GO:0006269 | DNA replication, synthesis of RNA primer(GO:0006269) |
| 0.2 | 3.1 | GO:0019344 | cysteine biosynthetic process(GO:0019344) |
| 0.2 | 0.4 | GO:2001180 | negative regulation of interleukin-10 secretion(GO:2001180) |
| 0.2 | 1.6 | GO:0038172 | interleukin-33-mediated signaling pathway(GO:0038172) |
| 0.2 | 1.1 | GO:1904744 | positive regulation of telomeric DNA binding(GO:1904744) |
| 0.2 | 0.9 | GO:1904017 | cellular response to Thyroglobulin triiodothyronine(GO:1904017) |
| 0.2 | 2.0 | GO:0033632 | regulation of cell-cell adhesion mediated by integrin(GO:0033632) |
| 0.2 | 1.5 | GO:0006049 | UDP-N-acetylglucosamine catabolic process(GO:0006049) |
| 0.2 | 1.1 | GO:0014005 | microglia differentiation(GO:0014004) microglia development(GO:0014005) |
| 0.2 | 0.8 | GO:0045903 | positive regulation of translational fidelity(GO:0045903) |
| 0.2 | 0.8 | GO:0021849 | neuroblast division in subventricular zone(GO:0021849) |
| 0.2 | 1.5 | GO:0070221 | sulfide oxidation(GO:0019418) sulfide oxidation, using sulfide:quinone oxidoreductase(GO:0070221) |
| 0.2 | 0.8 | GO:1902524 | positive regulation of protein K48-linked ubiquitination(GO:1902524) |
| 0.2 | 0.6 | GO:1904268 | positive regulation of Schwann cell migration(GO:1900149) regulation of Schwann cell chemotaxis(GO:1904266) positive regulation of Schwann cell chemotaxis(GO:1904268) Schwann cell chemotaxis(GO:1990751) |
| 0.2 | 2.0 | GO:2001206 | positive regulation of osteoclast development(GO:2001206) |
| 0.2 | 0.6 | GO:1904481 | response to tetrahydrofolate(GO:1904481) cellular response to tetrahydrofolate(GO:1904482) |
| 0.2 | 1.2 | GO:0014738 | regulation of muscle hyperplasia(GO:0014738) |
| 0.2 | 1.2 | GO:0010757 | negative regulation of plasminogen activation(GO:0010757) |
| 0.2 | 1.6 | GO:0000023 | maltose metabolic process(GO:0000023) |
| 0.2 | 0.4 | GO:2000569 | T-helper 2 cell activation(GO:0035712) regulation of T-helper 2 cell activation(GO:2000569) positive regulation of T-helper 2 cell activation(GO:2000570) |
| 0.2 | 0.8 | GO:1990637 | response to prolactin(GO:1990637) |
| 0.2 | 0.6 | GO:0070408 | carbamoyl phosphate metabolic process(GO:0070408) carbamoyl phosphate biosynthetic process(GO:0070409) response to ammonia(GO:1903717) cellular response to ammonia(GO:1903718) |
| 0.2 | 0.9 | GO:0034197 | acylglycerol transport(GO:0034196) triglyceride transport(GO:0034197) |
| 0.2 | 1.1 | GO:0002457 | T cell antigen processing and presentation(GO:0002457) |
| 0.2 | 0.5 | GO:0016487 | sesquiterpenoid metabolic process(GO:0006714) sesquiterpenoid catabolic process(GO:0016107) farnesol metabolic process(GO:0016487) farnesol catabolic process(GO:0016488) regulation of testosterone biosynthetic process(GO:2000224) |
| 0.2 | 0.5 | GO:0097698 | telomere maintenance via base-excision repair(GO:0097698) |
| 0.2 | 0.9 | GO:1902904 | negative regulation of fibril organization(GO:1902904) chaperone-mediated autophagy translocation complex disassembly(GO:1904764) |
| 0.2 | 0.7 | GO:0010607 | negative regulation of cytoplasmic mRNA processing body assembly(GO:0010607) |
| 0.2 | 1.2 | GO:0038195 | urokinase plasminogen activator signaling pathway(GO:0038195) |
| 0.2 | 1.2 | GO:2000660 | negative regulation of interleukin-1-mediated signaling pathway(GO:2000660) |
| 0.2 | 0.5 | GO:0043973 | histone H3-K4 acetylation(GO:0043973) |
| 0.2 | 3.4 | GO:0019371 | cyclooxygenase pathway(GO:0019371) |
| 0.2 | 4.3 | GO:0045730 | respiratory burst(GO:0045730) |
| 0.2 | 0.5 | GO:0035508 | positive regulation of myosin-light-chain-phosphatase activity(GO:0035508) |
| 0.2 | 7.5 | GO:0035455 | response to interferon-alpha(GO:0035455) |
| 0.2 | 1.0 | GO:0060335 | positive regulation of response to interferon-gamma(GO:0060332) positive regulation of interferon-gamma-mediated signaling pathway(GO:0060335) |
| 0.2 | 0.2 | GO:0045080 | positive regulation of chemokine biosynthetic process(GO:0045080) |
| 0.2 | 1.1 | GO:0097461 | ferric iron import into cell(GO:0097461) ferric iron import across plasma membrane(GO:0098706) |
| 0.2 | 2.3 | GO:0044130 | negative regulation of growth of symbiont in host(GO:0044130) |
| 0.2 | 0.9 | GO:0033615 | mitochondrial proton-transporting ATP synthase complex assembly(GO:0033615) |
| 0.2 | 0.8 | GO:1900060 | negative regulation of sphingolipid biosynthetic process(GO:0090155) cellular sphingolipid homeostasis(GO:0090156) negative regulation of ceramide biosynthetic process(GO:1900060) |
| 0.2 | 3.2 | GO:0002717 | positive regulation of natural killer cell mediated immunity(GO:0002717) |
| 0.2 | 0.8 | GO:0043932 | ossification involved in bone remodeling(GO:0043932) |
| 0.2 | 1.1 | GO:0060399 | positive regulation of growth hormone receptor signaling pathway(GO:0060399) |
| 0.1 | 0.6 | GO:0035188 | blastocyst hatching(GO:0001835) hatching(GO:0035188) organism emergence from protective structure(GO:0071684) |
| 0.1 | 1.8 | GO:0001765 | membrane raft assembly(GO:0001765) |
| 0.1 | 0.9 | GO:2001271 | negative regulation of cysteine-type endopeptidase activity involved in execution phase of apoptosis(GO:2001271) |
| 0.1 | 1.5 | GO:0045591 | positive regulation of memory T cell differentiation(GO:0043382) positive regulation of regulatory T cell differentiation(GO:0045591) |
| 0.1 | 1.9 | GO:1903975 | regulation of glial cell migration(GO:1903975) |
| 0.1 | 1.2 | GO:0032431 | activation of phospholipase A2 activity(GO:0032431) |
| 0.1 | 1.5 | GO:0032693 | negative regulation of interleukin-10 production(GO:0032693) |
| 0.1 | 0.7 | GO:0010760 | negative regulation of macrophage chemotaxis(GO:0010760) |
| 0.1 | 1.4 | GO:0006848 | pyruvate transport(GO:0006848) pyruvate transmembrane transport(GO:1901475) |
| 0.1 | 3.4 | GO:0030889 | negative regulation of B cell proliferation(GO:0030889) |
| 0.1 | 1.4 | GO:1904386 | response to thyroxine(GO:0097068) response to L-phenylalanine derivative(GO:1904386) |
| 0.1 | 1.9 | GO:0060501 | positive regulation of epithelial cell proliferation involved in lung morphogenesis(GO:0060501) |
| 0.1 | 0.7 | GO:0090362 | positive regulation of platelet-derived growth factor production(GO:0090362) |
| 0.1 | 1.2 | GO:0045040 | protein import into mitochondrial outer membrane(GO:0045040) |
| 0.1 | 1.2 | GO:0035879 | plasma membrane lactate transport(GO:0035879) |
| 0.1 | 8.6 | GO:1900077 | negative regulation of insulin receptor signaling pathway(GO:0046627) negative regulation of cellular response to insulin stimulus(GO:1900077) |
| 0.1 | 1.8 | GO:1902563 | regulation of neutrophil degranulation(GO:0043313) regulation of neutrophil activation(GO:1902563) |
| 0.1 | 0.4 | GO:0001970 | positive regulation of activation of membrane attack complex(GO:0001970) |
| 0.1 | 1.4 | GO:0001554 | luteolysis(GO:0001554) |
| 0.1 | 1.0 | GO:0038044 | transforming growth factor-beta secretion(GO:0038044) |
| 0.1 | 0.6 | GO:0006931 | substrate-dependent cell migration, cell attachment to substrate(GO:0006931) |
| 0.1 | 0.4 | GO:0035378 | carbon dioxide transmembrane transport(GO:0035378) |
| 0.1 | 0.4 | GO:1902766 | skeletal muscle satellite cell migration(GO:1902766) |
| 0.1 | 1.8 | GO:0007172 | signal complex assembly(GO:0007172) |
| 0.1 | 0.5 | GO:0043032 | positive regulation of macrophage activation(GO:0043032) |
| 0.1 | 0.6 | GO:1904491 | protein localization to ciliary transition zone(GO:1904491) |
| 0.1 | 2.7 | GO:2000353 | positive regulation of endothelial cell apoptotic process(GO:2000353) |
| 0.1 | 0.4 | GO:0045925 | maternal aggressive behavior(GO:0002125) positive regulation of female receptivity(GO:0045925) |
| 0.1 | 0.4 | GO:0070175 | positive regulation of odontogenesis of dentin-containing tooth(GO:0042488) positive regulation of enamel mineralization(GO:0070175) |
| 0.1 | 0.2 | GO:0016240 | autophagosome docking(GO:0016240) |
| 0.1 | 0.9 | GO:0051832 | evasion or tolerance of host defenses by virus(GO:0019049) avoidance of host defenses(GO:0044413) evasion or tolerance of host defenses(GO:0044415) avoidance of defenses of other organism involved in symbiotic interaction(GO:0051832) evasion or tolerance of defenses of other organism involved in symbiotic interaction(GO:0051834) negative regulation of lung blood pressure(GO:0061767) |
| 0.1 | 1.3 | GO:0071287 | cellular response to manganese ion(GO:0071287) |
| 0.1 | 0.6 | GO:0018242 | protein O-linked glycosylation via serine(GO:0018242) |
| 0.1 | 2.5 | GO:0071803 | positive regulation of podosome assembly(GO:0071803) |
| 0.1 | 0.2 | GO:1903800 | positive regulation of production of miRNAs involved in gene silencing by miRNA(GO:1903800) |
| 0.1 | 1.2 | GO:0042269 | regulation of natural killer cell mediated cytotoxicity(GO:0042269) |
| 0.1 | 2.1 | GO:0070050 | neuron cellular homeostasis(GO:0070050) |
| 0.1 | 2.3 | GO:0038166 | angiotensin-activated signaling pathway(GO:0038166) |
| 0.1 | 1.1 | GO:0097267 | omega-hydroxylase P450 pathway(GO:0097267) |
| 0.1 | 0.2 | GO:0045994 | positive regulation of translational initiation by iron(GO:0045994) |
| 0.1 | 0.2 | GO:0042938 | dipeptide transport(GO:0042938) |
| 0.1 | 1.6 | GO:0002315 | marginal zone B cell differentiation(GO:0002315) |
| 0.1 | 1.2 | GO:0035897 | proteolysis in other organism(GO:0035897) |
| 0.1 | 0.4 | GO:1903567 | negative regulation of protein localization to cilium(GO:1903565) regulation of protein localization to ciliary membrane(GO:1903567) negative regulation of protein localization to ciliary membrane(GO:1903568) |
| 0.1 | 1.2 | GO:0048539 | bone marrow development(GO:0048539) |
| 0.1 | 0.4 | GO:0006480 | N-terminal protein amino acid methylation(GO:0006480) |
| 0.1 | 1.4 | GO:0070257 | positive regulation of mucus secretion(GO:0070257) |
| 0.1 | 0.5 | GO:0035633 | maintenance of blood-brain barrier(GO:0035633) |
| 0.1 | 0.3 | GO:1900154 | regulation of bone trabecula formation(GO:1900154) negative regulation of bone trabecula formation(GO:1900155) |
| 0.1 | 9.6 | GO:0045576 | mast cell activation(GO:0045576) |
| 0.1 | 0.7 | GO:0046618 | drug export(GO:0046618) |
| 0.1 | 1.0 | GO:0051694 | pointed-end actin filament capping(GO:0051694) |
| 0.1 | 0.3 | GO:0050976 | detection of mechanical stimulus involved in sensory perception of touch(GO:0050976) cellular response to alkaline pH(GO:0071469) |
| 0.1 | 0.5 | GO:2000672 | negative regulation of motor neuron apoptotic process(GO:2000672) |
| 0.1 | 1.3 | GO:1904715 | negative regulation of chaperone-mediated autophagy(GO:1904715) |
| 0.1 | 2.1 | GO:0070233 | negative regulation of T cell apoptotic process(GO:0070233) |
| 0.1 | 1.0 | GO:0006572 | tyrosine catabolic process(GO:0006572) |
| 0.1 | 0.3 | GO:0007518 | myoblast fate determination(GO:0007518) |
| 0.1 | 0.6 | GO:0070378 | positive regulation of ERK5 cascade(GO:0070378) |
| 0.1 | 0.3 | GO:1901052 | sarcosine metabolic process(GO:1901052) sarcosine catabolic process(GO:1901053) |
| 0.1 | 20.9 | GO:0002433 | immune response-regulating cell surface receptor signaling pathway involved in phagocytosis(GO:0002433) Fc-gamma receptor signaling pathway involved in phagocytosis(GO:0038096) |
| 0.1 | 0.4 | GO:0031064 | negative regulation of histone deacetylation(GO:0031064) |
| 0.1 | 1.0 | GO:0006686 | sphingomyelin biosynthetic process(GO:0006686) |
| 0.1 | 0.3 | GO:0045041 | protein import into mitochondrial intermembrane space(GO:0045041) |
| 0.1 | 2.4 | GO:1901741 | positive regulation of myoblast fusion(GO:1901741) |
| 0.1 | 0.3 | GO:0000103 | sulfate assimilation(GO:0000103) |
| 0.1 | 0.6 | GO:1903288 | positive regulation of potassium ion import(GO:1903288) |
| 0.1 | 1.8 | GO:0050869 | negative regulation of B cell activation(GO:0050869) |
| 0.1 | 1.3 | GO:0015747 | urate transport(GO:0015747) |
| 0.1 | 0.3 | GO:0018879 | biphenyl metabolic process(GO:0018879) |
| 0.1 | 0.4 | GO:0000270 | peptidoglycan metabolic process(GO:0000270) peptidoglycan catabolic process(GO:0009253) |
| 0.1 | 1.3 | GO:0050713 | negative regulation of interleukin-1 beta secretion(GO:0050713) |
| 0.1 | 1.3 | GO:0033148 | positive regulation of intracellular estrogen receptor signaling pathway(GO:0033148) |
| 0.1 | 0.4 | GO:0001757 | somite specification(GO:0001757) |
| 0.1 | 1.2 | GO:0015014 | heparan sulfate proteoglycan biosynthetic process, polysaccharide chain biosynthetic process(GO:0015014) |
| 0.1 | 0.3 | GO:0035038 | female pronucleus assembly(GO:0035038) |
| 0.1 | 0.4 | GO:1902896 | terminal web assembly(GO:1902896) |
| 0.1 | 1.1 | GO:0010818 | T cell chemotaxis(GO:0010818) |
| 0.1 | 0.3 | GO:0016340 | calcium-dependent cell-matrix adhesion(GO:0016340) |
| 0.1 | 0.6 | GO:0035610 | protein side chain deglutamylation(GO:0035610) |
| 0.1 | 2.2 | GO:0030322 | stabilization of membrane potential(GO:0030322) |
| 0.1 | 0.7 | GO:1900262 | regulation of DNA-directed DNA polymerase activity(GO:1900262) positive regulation of DNA-directed DNA polymerase activity(GO:1900264) |
| 0.1 | 0.3 | GO:1902269 | positive regulation of polyamine transmembrane transport(GO:1902269) |
| 0.1 | 0.3 | GO:1902994 | regulation of phospholipid efflux(GO:1902994) positive regulation of phospholipid efflux(GO:1902995) |
| 0.1 | 2.8 | GO:0032731 | positive regulation of interleukin-1 beta production(GO:0032731) |
| 0.1 | 1.9 | GO:0032695 | negative regulation of interleukin-12 production(GO:0032695) |
| 0.1 | 0.2 | GO:0045410 | positive regulation of interleukin-6 biosynthetic process(GO:0045410) |
| 0.1 | 1.2 | GO:0009120 | deoxyribonucleoside metabolic process(GO:0009120) |
| 0.1 | 0.2 | GO:0035732 | nitric oxide storage(GO:0035732) cellular response to cell-matrix adhesion(GO:0071460) |
| 0.1 | 1.6 | GO:0071361 | cellular response to ethanol(GO:0071361) |
| 0.1 | 0.3 | GO:1902530 | regulation of protein linear polyubiquitination(GO:1902528) positive regulation of protein linear polyubiquitination(GO:1902530) |
| 0.1 | 0.4 | GO:1904751 | positive regulation of protein localization to nucleolus(GO:1904751) |
| 0.1 | 2.6 | GO:0046339 | diacylglycerol metabolic process(GO:0046339) |
| 0.1 | 1.0 | GO:0040016 | embryonic cleavage(GO:0040016) |
| 0.1 | 0.9 | GO:0045779 | negative regulation of bone resorption(GO:0045779) negative regulation of bone remodeling(GO:0046851) |
| 0.1 | 0.5 | GO:0048850 | hypophysis morphogenesis(GO:0048850) |
| 0.1 | 0.6 | GO:0030210 | heparin metabolic process(GO:0030202) heparin biosynthetic process(GO:0030210) |
| 0.1 | 1.3 | GO:0050862 | positive regulation of T cell receptor signaling pathway(GO:0050862) |
| 0.1 | 0.7 | GO:0045039 | protein import into mitochondrial inner membrane(GO:0045039) |
| 0.1 | 0.9 | GO:0018401 | peptidyl-proline hydroxylation to 4-hydroxy-L-proline(GO:0018401) |
| 0.1 | 0.8 | GO:0006685 | sphingomyelin catabolic process(GO:0006685) |
| 0.1 | 0.7 | GO:0071763 | nuclear membrane organization(GO:0071763) |
| 0.1 | 0.4 | GO:0097211 | response to gonadotropin-releasing hormone(GO:0097210) cellular response to gonadotropin-releasing hormone(GO:0097211) |
| 0.1 | 0.5 | GO:0032971 | regulation of muscle filament sliding(GO:0032971) |
| 0.1 | 0.6 | GO:0072502 | cellular phosphate ion homeostasis(GO:0030643) cellular trivalent inorganic anion homeostasis(GO:0072502) |
| 0.1 | 1.2 | GO:0060736 | prostate gland growth(GO:0060736) |
| 0.1 | 0.1 | GO:0002032 | desensitization of G-protein coupled receptor protein signaling pathway by arrestin(GO:0002032) |
| 0.1 | 1.0 | GO:0060613 | fat pad development(GO:0060613) |
| 0.1 | 5.5 | GO:0031295 | T cell costimulation(GO:0031295) |
| 0.1 | 0.3 | GO:0044778 | meiotic DNA integrity checkpoint(GO:0044778) |
| 0.1 | 0.2 | GO:0036111 | very long-chain fatty-acyl-CoA metabolic process(GO:0036111) |
| 0.1 | 0.3 | GO:1903377 | negative regulation of oxidative stress-induced neuron intrinsic apoptotic signaling pathway(GO:1903377) |
| 0.1 | 1.6 | GO:0031629 | synaptic vesicle fusion to presynaptic active zone membrane(GO:0031629) vesicle fusion to plasma membrane(GO:0099500) |
| 0.1 | 5.0 | GO:0038083 | peptidyl-tyrosine autophosphorylation(GO:0038083) |
| 0.1 | 0.9 | GO:0045064 | defense response to protozoan(GO:0042832) T-helper 2 cell differentiation(GO:0045064) |
| 0.1 | 1.2 | GO:0006089 | lactate metabolic process(GO:0006089) |
| 0.1 | 0.8 | GO:0006558 | L-phenylalanine metabolic process(GO:0006558) L-phenylalanine catabolic process(GO:0006559) erythrose 4-phosphate/phosphoenolpyruvate family amino acid metabolic process(GO:1902221) erythrose 4-phosphate/phosphoenolpyruvate family amino acid catabolic process(GO:1902222) |
| 0.1 | 0.4 | GO:2001045 | negative regulation of integrin-mediated signaling pathway(GO:2001045) |
| 0.1 | 1.8 | GO:0043029 | T cell homeostasis(GO:0043029) |
| 0.1 | 1.4 | GO:0019731 | antibacterial humoral response(GO:0019731) |
| 0.1 | 0.9 | GO:0000290 | deadenylation-dependent decapping of nuclear-transcribed mRNA(GO:0000290) |
| 0.1 | 1.9 | GO:0045332 | phospholipid translocation(GO:0045332) |
| 0.1 | 0.3 | GO:1903028 | positive regulation of opsonization(GO:1903028) |
| 0.1 | 0.1 | GO:1904468 | negative regulation of tumor necrosis factor secretion(GO:1904468) |
| 0.1 | 0.5 | GO:0045198 | establishment of epithelial cell apical/basal polarity(GO:0045198) |
| 0.1 | 1.6 | GO:0071294 | cellular response to zinc ion(GO:0071294) |
| 0.1 | 0.7 | GO:0031022 | nuclear migration along microfilament(GO:0031022) |
| 0.1 | 0.7 | GO:0048007 | antigen processing and presentation of lipid antigen via MHC class Ib(GO:0048003) antigen processing and presentation, exogenous lipid antigen via MHC class Ib(GO:0048007) |
| 0.1 | 0.6 | GO:2000253 | positive regulation of feeding behavior(GO:2000253) |
| 0.1 | 1.0 | GO:0039536 | negative regulation of RIG-I signaling pathway(GO:0039536) |
| 0.1 | 0.8 | GO:1902416 | positive regulation of mRNA binding(GO:1902416) |
| 0.1 | 0.5 | GO:0036112 | medium-chain fatty-acyl-CoA metabolic process(GO:0036112) |
| 0.1 | 0.2 | GO:0018171 | peptidyl-cysteine oxidation(GO:0018171) |
| 0.1 | 0.9 | GO:0032620 | interleukin-17 production(GO:0032620) |
| 0.1 | 1.1 | GO:0050860 | negative regulation of T cell receptor signaling pathway(GO:0050860) |
| 0.1 | 0.2 | GO:0048743 | positive regulation of skeletal muscle fiber development(GO:0048743) |
| 0.1 | 0.4 | GO:1901159 | glucuronate catabolic process(GO:0006064) glucuronate catabolic process to xylulose 5-phosphate(GO:0019640) L-ascorbic acid biosynthetic process(GO:0019853) xylulose 5-phosphate metabolic process(GO:0051167) xylulose 5-phosphate biosynthetic process(GO:1901159) |
| 0.1 | 0.9 | GO:0060670 | branching involved in labyrinthine layer morphogenesis(GO:0060670) |
| 0.1 | 0.6 | GO:0086024 | adrenergic receptor signaling pathway involved in positive regulation of heart rate(GO:0086024) |
| 0.1 | 2.1 | GO:0009435 | NAD biosynthetic process(GO:0009435) |
| 0.1 | 0.8 | GO:0070327 | thyroid hormone transport(GO:0070327) |
| 0.1 | 0.4 | GO:0090245 | axis elongation involved in somitogenesis(GO:0090245) |
| 0.1 | 0.7 | GO:0032020 | ISG15-protein conjugation(GO:0032020) |
| 0.1 | 0.2 | GO:0007113 | endomitotic cell cycle(GO:0007113) |
| 0.1 | 0.6 | GO:0010606 | positive regulation of cytoplasmic mRNA processing body assembly(GO:0010606) |
| 0.1 | 0.4 | GO:0097428 | protein maturation by iron-sulfur cluster transfer(GO:0097428) |
| 0.1 | 3.1 | GO:0001958 | endochondral ossification(GO:0001958) replacement ossification(GO:0036075) |
| 0.1 | 4.0 | GO:0050853 | B cell receptor signaling pathway(GO:0050853) |
| 0.1 | 0.4 | GO:0001672 | regulation of chromatin assembly or disassembly(GO:0001672) |
| 0.1 | 0.5 | GO:0051725 | protein de-ADP-ribosylation(GO:0051725) |
| 0.1 | 1.0 | GO:0031639 | plasminogen activation(GO:0031639) |
| 0.1 | 0.7 | GO:0060056 | mammary gland involution(GO:0060056) |
| 0.1 | 1.4 | GO:0002115 | store-operated calcium entry(GO:0002115) |
| 0.1 | 0.6 | GO:0002385 | mucosal immune response(GO:0002385) |
| 0.1 | 0.7 | GO:0000012 | single strand break repair(GO:0000012) |
| 0.1 | 1.0 | GO:0090315 | negative regulation of protein targeting to membrane(GO:0090315) |
| 0.1 | 1.2 | GO:0071436 | sodium ion export(GO:0071436) |
| 0.0 | 0.2 | GO:0002326 | B cell lineage commitment(GO:0002326) |
| 0.0 | 0.2 | GO:0030961 | peptidyl-arginine hydroxylation(GO:0030961) |
| 0.0 | 0.5 | GO:2001300 | lipoxin metabolic process(GO:2001300) |
| 0.0 | 1.9 | GO:0006337 | nucleosome disassembly(GO:0006337) |
| 0.0 | 3.1 | GO:0030212 | hyaluronan metabolic process(GO:0030212) |
| 0.0 | 7.7 | GO:0002377 | immunoglobulin production(GO:0002377) |
| 0.0 | 1.0 | GO:0035435 | phosphate ion transmembrane transport(GO:0035435) |
| 0.0 | 0.1 | GO:0003193 | pulmonary valve formation(GO:0003193) foramen ovale closure(GO:0035922) regulation of bundle of His cell action potential(GO:0098905) |
| 0.0 | 0.4 | GO:0071225 | cellular response to muramyl dipeptide(GO:0071225) |
| 0.0 | 0.1 | GO:0060931 | sinoatrial node cell development(GO:0060931) |
| 0.0 | 0.7 | GO:0051546 | keratinocyte migration(GO:0051546) |
| 0.0 | 2.1 | GO:0030220 | platelet formation(GO:0030220) |
| 0.0 | 1.0 | GO:0030728 | ovulation(GO:0030728) |
| 0.0 | 0.2 | GO:0051230 | mitotic spindle disassembly(GO:0051228) spindle disassembly(GO:0051230) |
| 0.0 | 0.6 | GO:0031580 | membrane raft polarization(GO:0001766) membrane raft distribution(GO:0031580) |
| 0.0 | 0.1 | GO:0000354 | cis assembly of pre-catalytic spliceosome(GO:0000354) |
| 0.0 | 0.4 | GO:0000389 | mRNA 3'-splice site recognition(GO:0000389) |
| 0.0 | 2.0 | GO:0042035 | regulation of cytokine biosynthetic process(GO:0042035) |
| 0.0 | 0.7 | GO:1901223 | negative regulation of NIK/NF-kappaB signaling(GO:1901223) |
| 0.0 | 0.2 | GO:0018125 | peptidyl-cysteine methylation(GO:0018125) |
| 0.0 | 1.4 | GO:0042267 | natural killer cell mediated cytotoxicity(GO:0042267) |
| 0.0 | 1.1 | GO:0060334 | regulation of response to interferon-gamma(GO:0060330) regulation of interferon-gamma-mediated signaling pathway(GO:0060334) |
| 0.0 | 0.4 | GO:0034214 | protein hexamerization(GO:0034214) |
| 0.0 | 0.5 | GO:0070933 | histone H4 deacetylation(GO:0070933) |
| 0.0 | 0.3 | GO:0042226 | interleukin-6 biosynthetic process(GO:0042226) |
| 0.0 | 0.6 | GO:2001032 | regulation of double-strand break repair via nonhomologous end joining(GO:2001032) |
| 0.0 | 1.7 | GO:0032012 | regulation of ARF protein signal transduction(GO:0032012) |
| 0.0 | 1.3 | GO:0015721 | bile acid and bile salt transport(GO:0015721) |
| 0.0 | 0.8 | GO:0032926 | negative regulation of activin receptor signaling pathway(GO:0032926) |
| 0.0 | 0.4 | GO:0071474 | cellular hyperosmotic response(GO:0071474) |
| 0.0 | 0.3 | GO:0035855 | megakaryocyte development(GO:0035855) |
| 0.0 | 0.8 | GO:0015816 | glycine transport(GO:0015816) |
| 0.0 | 0.2 | GO:0046368 | GDP-L-fucose metabolic process(GO:0046368) |
| 0.0 | 1.0 | GO:0090200 | positive regulation of release of cytochrome c from mitochondria(GO:0090200) |
| 0.0 | 0.7 | GO:0001514 | selenocysteine incorporation(GO:0001514) translational readthrough(GO:0006451) |
| 0.0 | 0.1 | GO:0034553 | mitochondrial electron transport, succinate to ubiquinone(GO:0006121) respiratory chain complex II assembly(GO:0034552) mitochondrial respiratory chain complex II assembly(GO:0034553) mitochondrial respiratory chain complex II biogenesis(GO:0097032) |
| 0.0 | 0.4 | GO:0000028 | ribosomal small subunit assembly(GO:0000028) |
| 0.0 | 0.3 | GO:1904798 | positive regulation of core promoter binding(GO:1904798) |
| 0.0 | 0.3 | GO:0032483 | regulation of Rab protein signal transduction(GO:0032483) |
| 0.0 | 0.5 | GO:1901407 | regulation of phosphorylation of RNA polymerase II C-terminal domain(GO:1901407) |
| 0.0 | 0.8 | GO:0006266 | DNA ligation(GO:0006266) |
| 0.0 | 0.5 | GO:0000722 | telomere maintenance via recombination(GO:0000722) |
| 0.0 | 0.9 | GO:1901687 | glutathione derivative metabolic process(GO:1901685) glutathione derivative biosynthetic process(GO:1901687) |
| 0.0 | 0.3 | GO:0051315 | attachment of mitotic spindle microtubules to kinetochore(GO:0051315) |
| 0.0 | 0.3 | GO:0034162 | toll-like receptor 9 signaling pathway(GO:0034162) |
| 0.0 | 0.2 | GO:0036438 | maintenance of lens transparency(GO:0036438) |
| 0.0 | 1.3 | GO:0060337 | type I interferon signaling pathway(GO:0060337) cellular response to type I interferon(GO:0071357) |
| 0.0 | 0.3 | GO:0060397 | JAK-STAT cascade involved in growth hormone signaling pathway(GO:0060397) |
| 0.0 | 0.6 | GO:0035330 | regulation of hippo signaling(GO:0035330) |
| 0.0 | 0.7 | GO:0042347 | negative regulation of NF-kappaB import into nucleus(GO:0042347) |
| 0.0 | 0.5 | GO:0048742 | regulation of skeletal muscle fiber development(GO:0048742) |
| 0.0 | 0.1 | GO:0019626 | short-chain fatty acid catabolic process(GO:0019626) |
| 0.0 | 2.0 | GO:0000413 | protein peptidyl-prolyl isomerization(GO:0000413) |
| 0.0 | 0.9 | GO:1901663 | ubiquinone biosynthetic process(GO:0006744) quinone biosynthetic process(GO:1901663) |
| 0.0 | 0.1 | GO:0010430 | fatty acid omega-oxidation(GO:0010430) |
| 0.0 | 0.6 | GO:0006105 | succinate metabolic process(GO:0006105) |
| 0.0 | 0.6 | GO:0032793 | positive regulation of CREB transcription factor activity(GO:0032793) |
| 0.0 | 0.4 | GO:0010592 | positive regulation of lamellipodium assembly(GO:0010592) |
| 0.0 | 0.4 | GO:0060088 | auditory receptor cell stereocilium organization(GO:0060088) |
| 0.0 | 0.3 | GO:0017196 | N-terminal peptidyl-methionine acetylation(GO:0017196) |
| 0.0 | 0.4 | GO:0097324 | melanocyte migration(GO:0097324) positive regulation of lens fiber cell differentiation(GO:1902748) |
| 0.0 | 0.7 | GO:0006488 | dolichol-linked oligosaccharide biosynthetic process(GO:0006488) |
| 0.0 | 0.2 | GO:0090080 | positive regulation of MAPKKK cascade by fibroblast growth factor receptor signaling pathway(GO:0090080) |
| 0.0 | 1.4 | GO:0006409 | tRNA export from nucleus(GO:0006409) tRNA-containing ribonucleoprotein complex export from nucleus(GO:0071431) |
| 0.0 | 2.9 | GO:0006501 | C-terminal protein lipidation(GO:0006501) |
| 0.0 | 1.5 | GO:0042339 | keratan sulfate metabolic process(GO:0042339) |
| 0.0 | 0.2 | GO:2000002 | negative regulation of DNA damage checkpoint(GO:2000002) |
| 0.0 | 0.1 | GO:0006788 | heme oxidation(GO:0006788) |
| 0.0 | 0.5 | GO:0051383 | kinetochore organization(GO:0051383) |
| 0.0 | 1.5 | GO:0030101 | natural killer cell activation(GO:0030101) |
| 0.0 | 0.5 | GO:0060124 | positive regulation of growth hormone secretion(GO:0060124) |
| 0.0 | 0.2 | GO:0030208 | dermatan sulfate metabolic process(GO:0030205) dermatan sulfate biosynthetic process(GO:0030208) |
| 0.0 | 0.5 | GO:0043030 | regulation of macrophage activation(GO:0043030) |
| 0.0 | 0.6 | GO:0031069 | hair follicle morphogenesis(GO:0031069) |
| 0.0 | 0.3 | GO:0003406 | retinal pigment epithelium development(GO:0003406) |
| 0.0 | 0.2 | GO:0045602 | negative regulation of endothelial cell differentiation(GO:0045602) |
| 0.0 | 0.8 | GO:0051156 | glucose 6-phosphate metabolic process(GO:0051156) |
| 0.0 | 1.4 | GO:0034724 | DNA replication-independent nucleosome assembly(GO:0006336) DNA replication-independent nucleosome organization(GO:0034724) |
| 0.0 | 0.0 | GO:0019520 | aldonic acid metabolic process(GO:0019520) D-gluconate metabolic process(GO:0019521) |
| 0.0 | 0.5 | GO:0021796 | cerebral cortex regionalization(GO:0021796) |
| 0.0 | 0.7 | GO:0050908 | detection of light stimulus involved in visual perception(GO:0050908) detection of light stimulus involved in sensory perception(GO:0050962) |
| 0.0 | 0.7 | GO:0032506 | cytokinetic process(GO:0032506) |
| 0.0 | 0.4 | GO:0010801 | negative regulation of peptidyl-threonine phosphorylation(GO:0010801) |
| 0.0 | 0.7 | GO:0000289 | nuclear-transcribed mRNA poly(A) tail shortening(GO:0000289) |
| 0.0 | 0.3 | GO:0060155 | platelet dense granule organization(GO:0060155) |
| 0.0 | 0.9 | GO:0051482 | positive regulation of cytosolic calcium ion concentration involved in phospholipase C-activating G-protein coupled signaling pathway(GO:0051482) |
| 0.0 | 0.8 | GO:0007616 | long-term memory(GO:0007616) |
| 0.0 | 0.3 | GO:0036037 | CD8-positive, alpha-beta T cell activation(GO:0036037) |
| 0.0 | 5.9 | GO:0006413 | translational initiation(GO:0006413) |
| 0.0 | 0.2 | GO:0001887 | selenium compound metabolic process(GO:0001887) |
| 0.0 | 0.6 | GO:0034142 | toll-like receptor 4 signaling pathway(GO:0034142) |
| 0.0 | 1.2 | GO:0007140 | male meiosis(GO:0007140) |
| 0.0 | 1.2 | GO:0006730 | one-carbon metabolic process(GO:0006730) |
| 0.0 | 0.2 | GO:0090160 | Golgi to lysosome transport(GO:0090160) |
| 0.0 | 0.5 | GO:0043555 | regulation of translation in response to stress(GO:0043555) |
| 0.0 | 0.3 | GO:0001867 | complement activation, lectin pathway(GO:0001867) |
| 0.0 | 1.2 | GO:0007040 | lysosome organization(GO:0007040) lytic vacuole organization(GO:0080171) |
| 0.0 | 0.3 | GO:0039703 | viral RNA genome replication(GO:0039694) RNA replication(GO:0039703) |
| 0.0 | 0.4 | GO:0015937 | coenzyme A biosynthetic process(GO:0015937) |
| 0.0 | 0.3 | GO:2001241 | positive regulation of extrinsic apoptotic signaling pathway in absence of ligand(GO:2001241) |
| 0.0 | 0.7 | GO:0046856 | phosphatidylinositol dephosphorylation(GO:0046856) |
| 0.0 | 0.2 | GO:0038003 | opioid receptor signaling pathway(GO:0038003) |
| 0.0 | 0.2 | GO:0071926 | cannabinoid signaling pathway(GO:0038171) endocannabinoid signaling pathway(GO:0071926) regulation of endocannabinoid signaling pathway(GO:2000124) |
| 0.0 | 0.2 | GO:0000056 | ribosomal small subunit export from nucleus(GO:0000056) |
| 0.0 | 0.3 | GO:0072610 | interleukin-12 secretion(GO:0072610) regulation of interleukin-12 secretion(GO:2001182) |
| 0.0 | 0.2 | GO:0052696 | flavonoid glucuronidation(GO:0052696) xenobiotic glucuronidation(GO:0052697) |
| 0.0 | 0.4 | GO:0016180 | snRNA processing(GO:0016180) |
| 0.0 | 0.3 | GO:0034498 | early endosome to Golgi transport(GO:0034498) |
| 0.0 | 0.2 | GO:0006999 | nuclear pore organization(GO:0006999) nuclear pore complex assembly(GO:0051292) |
| 0.0 | 0.8 | GO:0051205 | protein insertion into membrane(GO:0051205) |
| 0.0 | 0.4 | GO:0030207 | chondroitin sulfate catabolic process(GO:0030207) |
| 0.0 | 0.2 | GO:0006621 | protein retention in ER lumen(GO:0006621) maintenance of protein localization in endoplasmic reticulum(GO:0035437) |
| 0.0 | 0.8 | GO:0007194 | negative regulation of adenylate cyclase activity(GO:0007194) |
| 0.0 | 1.0 | GO:0045071 | negative regulation of viral genome replication(GO:0045071) |
| 0.0 | 0.1 | GO:0016255 | attachment of GPI anchor to protein(GO:0016255) |
| 0.0 | 0.3 | GO:0036159 | inner dynein arm assembly(GO:0036159) |
| 0.0 | 0.1 | GO:0071374 | cellular response to parathyroid hormone stimulus(GO:0071374) |
| 0.0 | 0.1 | GO:0034421 | post-translational protein acetylation(GO:0034421) |
| 0.0 | 0.4 | GO:0070266 | necroptotic process(GO:0070266) |
| 0.0 | 0.5 | GO:0061718 | NADH regeneration(GO:0006735) canonical glycolysis(GO:0061621) glucose catabolic process to pyruvate(GO:0061718) |
| 0.0 | 0.1 | GO:0010724 | regulation of definitive erythrocyte differentiation(GO:0010724) |
| 0.0 | 0.1 | GO:0015864 | uridine transport(GO:0015862) pyrimidine nucleoside transport(GO:0015864) |
| 0.0 | 0.2 | GO:0045116 | protein neddylation(GO:0045116) |
| 0.0 | 0.3 | GO:0001502 | cartilage condensation(GO:0001502) |
| 0.0 | 0.1 | GO:0010166 | wax biosynthetic process(GO:0010025) wax metabolic process(GO:0010166) |
| 0.0 | 0.1 | GO:0032218 | riboflavin transport(GO:0032218) |
| 0.0 | 0.2 | GO:0021520 | spinal cord motor neuron cell fate specification(GO:0021520) |
Gene overrepresentation in cellular component category:
| Log-likelihood per target | Total log-likelihood | Term | Description |
|---|---|---|---|
| 2.3 | 9.2 | GO:0071757 | hexameric IgM immunoglobulin complex(GO:0071757) |
| 1.1 | 4.5 | GO:0035354 | Toll-like receptor 1-Toll-like receptor 2 protein complex(GO:0035354) |
| 0.8 | 2.5 | GO:0030936 | collagen type XIII trimer(GO:0005600) transmembrane collagen trimer(GO:0030936) |
| 0.8 | 4.7 | GO:0072557 | IPAF inflammasome complex(GO:0072557) |
| 0.7 | 4.4 | GO:0036398 | TCR signalosome(GO:0036398) |
| 0.7 | 8.6 | GO:0042105 | alpha-beta T cell receptor complex(GO:0042105) |
| 0.6 | 7.3 | GO:0046696 | lipopolysaccharide receptor complex(GO:0046696) |
| 0.6 | 5.6 | GO:0044194 | cytolytic granule(GO:0044194) |
| 0.5 | 2.8 | GO:0031205 | endoplasmic reticulum Sec complex(GO:0031205) |
| 0.5 | 6.0 | GO:0005577 | fibrinogen complex(GO:0005577) |
| 0.5 | 1.4 | GO:0099400 | cytoplasmic side of mitochondrial outer membrane(GO:0032473) caveola neck(GO:0099400) |
| 0.5 | 1.4 | GO:0032002 | interleukin-28 receptor complex(GO:0032002) |
| 0.4 | 8.1 | GO:0042613 | MHC class II protein complex(GO:0042613) |
| 0.4 | 3.6 | GO:0032010 | phagolysosome(GO:0032010) |
| 0.3 | 1.0 | GO:0048237 | rough endoplasmic reticulum lumen(GO:0048237) alphav-beta3 integrin-vitronectin complex(GO:0071062) |
| 0.3 | 1.3 | GO:0030895 | apolipoprotein B mRNA editing enzyme complex(GO:0030895) |
| 0.3 | 1.2 | GO:0005944 | phosphatidylinositol 3-kinase complex, class IB(GO:0005944) |
| 0.3 | 1.9 | GO:0032311 | angiogenin-PRI complex(GO:0032311) |
| 0.3 | 6.6 | GO:0031265 | CD95 death-inducing signaling complex(GO:0031265) |
| 0.3 | 1.3 | GO:0020003 | symbiont-containing vacuole(GO:0020003) |
| 0.2 | 2.2 | GO:0098575 | lumenal side of lysosomal membrane(GO:0098575) |
| 0.2 | 1.5 | GO:0002079 | inner acrosomal membrane(GO:0002079) |
| 0.2 | 3.3 | GO:0042101 | T cell receptor complex(GO:0042101) |
| 0.2 | 1.6 | GO:0005658 | alpha DNA polymerase:primase complex(GO:0005658) |
| 0.2 | 0.7 | GO:0031251 | PAN complex(GO:0031251) |
| 0.2 | 16.3 | GO:0001772 | immunological synapse(GO:0001772) |
| 0.2 | 1.2 | GO:0031232 | extrinsic component of external side of plasma membrane(GO:0031232) |
| 0.2 | 0.8 | GO:0034685 | integrin alphav-beta6 complex(GO:0034685) |
| 0.2 | 1.0 | GO:0032937 | SREBP-SCAP-Insig complex(GO:0032937) |
| 0.2 | 0.9 | GO:1990667 | PCSK9-AnxA2 complex(GO:1990667) |
| 0.2 | 0.9 | GO:0001651 | dense fibrillar component(GO:0001651) |
| 0.2 | 1.3 | GO:0072559 | NLRP3 inflammasome complex(GO:0072559) |
| 0.2 | 1.8 | GO:0034687 | integrin alphaL-beta2 complex(GO:0034687) |
| 0.2 | 0.7 | GO:0070701 | mucus layer(GO:0070701) |
| 0.2 | 3.4 | GO:0031089 | platelet dense granule lumen(GO:0031089) |
| 0.1 | 0.6 | GO:0097543 | ciliary inversin compartment(GO:0097543) |
| 0.1 | 0.7 | GO:0097232 | lamellar body membrane(GO:0097232) alveolar lamellar body membrane(GO:0097233) |
| 0.1 | 5.0 | GO:0042629 | mast cell granule(GO:0042629) |
| 0.1 | 0.8 | GO:0035339 | SPOTS complex(GO:0035339) |
| 0.1 | 0.8 | GO:0043625 | delta DNA polymerase complex(GO:0043625) |
| 0.1 | 0.6 | GO:0045257 | mitochondrial respiratory chain complex II, succinate dehydrogenase complex (ubiquinone)(GO:0005749) succinate dehydrogenase complex (ubiquinone)(GO:0045257) respiratory chain complex II(GO:0045273) succinate dehydrogenase complex(GO:0045281) fumarate reductase complex(GO:0045283) |
| 0.1 | 2.2 | GO:0034663 | endoplasmic reticulum chaperone complex(GO:0034663) |
| 0.1 | 0.5 | GO:0017109 | glutamate-cysteine ligase complex(GO:0017109) |
| 0.1 | 0.6 | GO:1990876 | cytoplasmic side of nuclear pore(GO:1990876) |
| 0.1 | 0.4 | GO:0005863 | striated muscle myosin thick filament(GO:0005863) |
| 0.1 | 1.2 | GO:0005742 | mitochondrial outer membrane translocase complex(GO:0005742) |
| 0.1 | 0.7 | GO:0042721 | mitochondrial inner membrane protein insertion complex(GO:0042721) |
| 0.1 | 2.5 | GO:0005845 | mRNA cap binding complex(GO:0005845) |
| 0.1 | 0.7 | GO:0070436 | Grb2-EGFR complex(GO:0070436) |
| 0.1 | 1.0 | GO:0098559 | cytoplasmic side of early endosome membrane(GO:0098559) cytoplasmic side of late endosome membrane(GO:0098560) |
| 0.1 | 1.8 | GO:0071438 | invadopodium membrane(GO:0071438) |
| 0.1 | 14.3 | GO:0035578 | azurophil granule lumen(GO:0035578) |
| 0.1 | 1.2 | GO:0097136 | Bcl-2 family protein complex(GO:0097136) |
| 0.1 | 2.8 | GO:0031233 | intrinsic component of external side of plasma membrane(GO:0031233) |
| 0.1 | 1.7 | GO:0016600 | flotillin complex(GO:0016600) |
| 0.1 | 0.4 | GO:1990796 | photoreceptor cell terminal bouton(GO:1990796) |
| 0.1 | 14.9 | GO:0035579 | specific granule membrane(GO:0035579) |
| 0.1 | 3.0 | GO:0001891 | phagocytic cup(GO:0001891) |
| 0.1 | 0.9 | GO:0042612 | MHC class I protein complex(GO:0042612) |
| 0.1 | 2.0 | GO:0060293 | P granule(GO:0043186) pole plasm(GO:0045495) germ plasm(GO:0060293) |
| 0.1 | 1.6 | GO:0008074 | guanylate cyclase complex, soluble(GO:0008074) |
| 0.1 | 0.4 | GO:0034274 | Atg12-Atg5-Atg16 complex(GO:0034274) |
| 0.1 | 0.7 | GO:0005663 | DNA replication factor C complex(GO:0005663) |
| 0.1 | 0.4 | GO:0016035 | zeta DNA polymerase complex(GO:0016035) |
| 0.1 | 4.0 | GO:0042571 | immunoglobulin complex, circulating(GO:0042571) |
| 0.1 | 1.2 | GO:0030008 | TRAPP complex(GO:0030008) |
| 0.1 | 0.9 | GO:0071144 | SMAD2-SMAD3 protein complex(GO:0071144) |
| 0.1 | 0.9 | GO:0031298 | replication fork protection complex(GO:0031298) |
| 0.1 | 0.8 | GO:0097524 | sperm plasma membrane(GO:0097524) |
| 0.1 | 1.2 | GO:0031080 | nuclear pore outer ring(GO:0031080) |
| 0.1 | 0.6 | GO:0030896 | checkpoint clamp complex(GO:0030896) |
| 0.1 | 0.2 | GO:1990357 | terminal web(GO:1990357) |
| 0.1 | 0.2 | GO:0097057 | TRAF2-GSTP1 complex(GO:0097057) |
| 0.1 | 0.6 | GO:0098554 | cytoplasmic side of endoplasmic reticulum membrane(GO:0098554) |
| 0.1 | 0.9 | GO:0008290 | F-actin capping protein complex(GO:0008290) |
| 0.1 | 18.9 | GO:0009897 | external side of plasma membrane(GO:0009897) |
| 0.1 | 0.8 | GO:1990909 | Wnt signalosome(GO:1990909) |
| 0.1 | 0.8 | GO:0042588 | zymogen granule(GO:0042588) |
| 0.1 | 1.4 | GO:0010369 | chromocenter(GO:0010369) |
| 0.1 | 4.6 | GO:0042582 | primary lysosome(GO:0005766) azurophil granule(GO:0042582) |
| 0.0 | 1.2 | GO:0036038 | MKS complex(GO:0036038) |
| 0.0 | 1.2 | GO:0005890 | sodium:potassium-exchanging ATPase complex(GO:0005890) |
| 0.0 | 0.4 | GO:0034388 | Pwp2p-containing subcomplex of 90S preribosome(GO:0034388) |
| 0.0 | 0.9 | GO:0016442 | RISC complex(GO:0016442) RNAi effector complex(GO:0031332) |
| 0.0 | 0.5 | GO:0033269 | internode region of axon(GO:0033269) |
| 0.0 | 0.3 | GO:0030430 | host cell cytoplasm(GO:0030430) host cell cytoplasm part(GO:0033655) |
| 0.0 | 0.5 | GO:0070552 | BRISC complex(GO:0070552) |
| 0.0 | 0.2 | GO:0090571 | RNA polymerase II transcription repressor complex(GO:0090571) |
| 0.0 | 1.2 | GO:0005682 | U5 snRNP(GO:0005682) |
| 0.0 | 0.3 | GO:0070545 | PeBoW complex(GO:0070545) |
| 0.0 | 2.8 | GO:0030173 | integral component of Golgi membrane(GO:0030173) |
| 0.0 | 4.4 | GO:0005811 | lipid particle(GO:0005811) |
| 0.0 | 2.6 | GO:0001533 | cornified envelope(GO:0001533) |
| 0.0 | 0.7 | GO:0001741 | XY body(GO:0001741) |
| 0.0 | 0.6 | GO:0000322 | storage vacuole(GO:0000322) |
| 0.0 | 0.6 | GO:0030015 | CCR4-NOT core complex(GO:0030015) |
| 0.0 | 0.8 | GO:0005852 | eukaryotic translation initiation factor 3 complex(GO:0005852) |
| 0.0 | 1.0 | GO:0034362 | low-density lipoprotein particle(GO:0034362) |
| 0.0 | 0.4 | GO:0005785 | signal recognition particle receptor complex(GO:0005785) |
| 0.0 | 0.4 | GO:0005686 | U2 snRNP(GO:0005686) |
| 0.0 | 0.3 | GO:0042382 | paraspeckles(GO:0042382) |
| 0.0 | 1.5 | GO:0008180 | COP9 signalosome(GO:0008180) |
| 0.0 | 0.3 | GO:0005964 | phosphorylase kinase complex(GO:0005964) |
| 0.0 | 2.1 | GO:0030670 | phagocytic vesicle membrane(GO:0030670) |
| 0.0 | 6.2 | GO:0101002 | ficolin-1-rich granule(GO:0101002) ficolin-1-rich granule lumen(GO:1904813) |
| 0.0 | 2.1 | GO:0016235 | aggresome(GO:0016235) |
| 0.0 | 0.3 | GO:0000015 | phosphopyruvate hydratase complex(GO:0000015) |
| 0.0 | 0.5 | GO:0072357 | PTW/PP1 phosphatase complex(GO:0072357) |
| 0.0 | 6.3 | GO:0001650 | fibrillar center(GO:0001650) |
| 0.0 | 0.2 | GO:0005579 | membrane attack complex(GO:0005579) |
| 0.0 | 0.7 | GO:0044322 | endoplasmic reticulum quality control compartment(GO:0044322) |
| 0.0 | 0.6 | GO:0035869 | ciliary transition zone(GO:0035869) |
| 0.0 | 1.7 | GO:0005657 | replication fork(GO:0005657) |
| 0.0 | 0.2 | GO:0044233 | ER-mitochondrion membrane contact site(GO:0044233) |
| 0.0 | 0.4 | GO:0032039 | integrator complex(GO:0032039) |
| 0.0 | 1.5 | GO:0005643 | nuclear pore(GO:0005643) |
| 0.0 | 0.2 | GO:0019907 | cyclin-dependent protein kinase activating kinase holoenzyme complex(GO:0019907) |
| 0.0 | 0.6 | GO:0005719 | nuclear euchromatin(GO:0005719) |
| 0.0 | 0.4 | GO:0032426 | stereocilium tip(GO:0032426) |
| 0.0 | 1.8 | GO:0005791 | rough endoplasmic reticulum(GO:0005791) |
| 0.0 | 1.4 | GO:0000315 | organellar large ribosomal subunit(GO:0000315) mitochondrial large ribosomal subunit(GO:0005762) |
| 0.0 | 0.1 | GO:0042765 | GPI-anchor transamidase complex(GO:0042765) |
| 0.0 | 0.6 | GO:0044295 | axonal growth cone(GO:0044295) |
| 0.0 | 0.2 | GO:0031254 | uropod(GO:0001931) cell trailing edge(GO:0031254) |
| 0.0 | 1.7 | GO:0044217 | other organism(GO:0044215) other organism cell(GO:0044216) other organism part(GO:0044217) |
| 0.0 | 0.2 | GO:0005610 | laminin-5 complex(GO:0005610) |
| 0.0 | 0.1 | GO:1990589 | ATF4-CREB1 transcription factor complex(GO:1990589) |
| 0.0 | 1.4 | GO:0045095 | keratin filament(GO:0045095) |
| 0.0 | 0.5 | GO:0005922 | connexon complex(GO:0005922) |
| 0.0 | 1.2 | GO:0055038 | recycling endosome membrane(GO:0055038) |
| 0.0 | 39.6 | GO:0005887 | integral component of plasma membrane(GO:0005887) |
| 0.0 | 0.3 | GO:0071141 | SMAD protein complex(GO:0071141) |
| 0.0 | 1.0 | GO:0001917 | photoreceptor inner segment(GO:0001917) |
| 0.0 | 0.4 | GO:0005666 | DNA-directed RNA polymerase III complex(GO:0005666) |
| 0.0 | 2.4 | GO:0032993 | protein-DNA complex(GO:0032993) |
| 0.0 | 3.5 | GO:0019897 | extrinsic component of plasma membrane(GO:0019897) |
| 0.0 | 0.2 | GO:0000347 | THO complex(GO:0000347) THO complex part of transcription export complex(GO:0000445) |
| 0.0 | 0.3 | GO:0045009 | melanosome membrane(GO:0033162) chitosome(GO:0045009) |
| 0.0 | 0.2 | GO:0008385 | IkappaB kinase complex(GO:0008385) |
| 0.0 | 0.1 | GO:0044815 | condensin complex(GO:0000796) DNA packaging complex(GO:0044815) |
| 0.0 | 0.1 | GO:0016593 | Cdc73/Paf1 complex(GO:0016593) |
Gene overrepresentation in molecular function category:
| Log-likelihood per target | Total log-likelihood | Term | Description |
|---|---|---|---|
| 1.9 | 5.7 | GO:1904599 | advanced glycation end-product binding(GO:1904599) |
| 1.3 | 9.2 | GO:0019862 | IgA binding(GO:0019862) |
| 1.2 | 4.6 | GO:0042132 | fructose 1,6-bisphosphate 1-phosphatase activity(GO:0042132) |
| 1.1 | 3.4 | GO:0004796 | thromboxane-A synthase activity(GO:0004796) 12-hydroxyheptadecatrienoic acid synthase activity(GO:0036134) |
| 1.1 | 4.5 | GO:0035663 | Toll-like receptor 2 binding(GO:0035663) |
| 1.0 | 3.1 | GO:0004878 | complement component C5a receptor activity(GO:0004878) |
| 1.0 | 7.3 | GO:0001847 | opsonin receptor activity(GO:0001847) |
| 0.9 | 2.8 | GO:0042008 | interleukin-18 receptor activity(GO:0042008) |
| 0.9 | 4.6 | GO:0030109 | HLA-B specific inhibitory MHC class I receptor activity(GO:0030109) |
| 0.9 | 2.6 | GO:0005174 | CD40 receptor binding(GO:0005174) |
| 0.9 | 2.6 | GO:0005369 | taurine transmembrane transporter activity(GO:0005368) taurine:sodium symporter activity(GO:0005369) |
| 0.9 | 4.3 | GO:0004905 | type I interferon receptor activity(GO:0004905) |
| 0.8 | 4.1 | GO:0004911 | interleukin-2 receptor activity(GO:0004911) interleukin-2 binding(GO:0019976) |
| 0.8 | 3.9 | GO:0005350 | pyrimidine nucleobase transmembrane transporter activity(GO:0005350) |
| 0.7 | 2.8 | GO:0005260 | channel-conductance-controlling ATPase activity(GO:0005260) |
| 0.7 | 2.0 | GO:0044715 | 8-oxo-dGDP phosphatase activity(GO:0044715) |
| 0.6 | 11.4 | GO:0019864 | IgG binding(GO:0019864) |
| 0.6 | 1.9 | GO:0017116 | single-stranded DNA-dependent ATP-dependent DNA helicase activity(GO:0017116) |
| 0.6 | 4.4 | GO:0004982 | N-formyl peptide receptor activity(GO:0004982) |
| 0.6 | 3.1 | GO:0031726 | CCR1 chemokine receptor binding(GO:0031726) |
| 0.6 | 5.6 | GO:0005094 | Rho GDP-dissociation inhibitor activity(GO:0005094) |
| 0.5 | 4.2 | GO:0043120 | tumor necrosis factor binding(GO:0043120) |
| 0.5 | 1.5 | GO:0050528 | acyloxyacyl hydrolase activity(GO:0050528) |
| 0.5 | 8.3 | GO:0032395 | MHC class II receptor activity(GO:0032395) |
| 0.5 | 2.9 | GO:0004918 | interleukin-8 receptor activity(GO:0004918) interleukin-8 binding(GO:0019959) |
| 0.5 | 1.4 | GO:0034211 | GTP-dependent protein kinase activity(GO:0034211) peroxidase inhibitor activity(GO:0036479) |
| 0.4 | 7.0 | GO:0001730 | 2'-5'-oligoadenylate synthetase activity(GO:0001730) |
| 0.4 | 3.5 | GO:0051032 | nucleic acid transmembrane transporter activity(GO:0051032) RNA transmembrane transporter activity(GO:0051033) |
| 0.4 | 1.2 | GO:0005150 | interleukin-1, Type I receptor binding(GO:0005150) |
| 0.4 | 3.1 | GO:0004974 | leukotriene receptor activity(GO:0004974) |
| 0.4 | 1.9 | GO:0003943 | N-acetylgalactosamine-4-sulfatase activity(GO:0003943) |
| 0.4 | 1.5 | GO:0047946 | glutamine N-acyltransferase activity(GO:0047946) |
| 0.4 | 1.5 | GO:0070224 | sulfide:quinone oxidoreductase activity(GO:0070224) |
| 0.4 | 1.4 | GO:0005477 | pyruvate secondary active transmembrane transporter activity(GO:0005477) |
| 0.3 | 2.4 | GO:0097199 | cysteine-type endopeptidase activity involved in apoptotic signaling pathway(GO:0097199) |
| 0.3 | 1.0 | GO:0004411 | homogentisate 1,2-dioxygenase activity(GO:0004411) |
| 0.3 | 4.0 | GO:0070892 | lipoteichoic acid receptor activity(GO:0070892) |
| 0.3 | 2.3 | GO:0001595 | angiotensin receptor activity(GO:0001595) angiotensin type II receptor activity(GO:0004945) |
| 0.3 | 1.3 | GO:0032089 | NACHT domain binding(GO:0032089) |
| 0.3 | 0.9 | GO:0036009 | protein-glutamine N-methyltransferase activity(GO:0036009) histone-glutamine methyltransferase activity(GO:1990259) |
| 0.3 | 0.3 | GO:0001855 | complement component C4b binding(GO:0001855) |
| 0.3 | 0.9 | GO:0050509 | N-acetylglucosaminyl-proteoglycan 4-beta-glucuronosyltransferase activity(GO:0050509) |
| 0.3 | 1.6 | GO:0001010 | transcription factor activity, sequence-specific DNA binding transcription factor recruiting(GO:0001010) |
| 0.3 | 0.8 | GO:0019779 | Atg12 activating enzyme activity(GO:0019778) Atg8 activating enzyme activity(GO:0019779) |
| 0.3 | 0.8 | GO:0004920 | interleukin-10 receptor activity(GO:0004920) |
| 0.3 | 3.6 | GO:0016176 | superoxide-generating NADPH oxidase activator activity(GO:0016176) |
| 0.3 | 1.3 | GO:0047280 | nicotinamide phosphoribosyltransferase activity(GO:0047280) |
| 0.2 | 1.0 | GO:0005459 | UDP-galactose transmembrane transporter activity(GO:0005459) |
| 0.2 | 2.1 | GO:0019834 | phospholipase A2 inhibitor activity(GO:0019834) |
| 0.2 | 0.7 | GO:0097689 | iron channel activity(GO:0097689) |
| 0.2 | 1.1 | GO:0004906 | interferon-gamma receptor activity(GO:0004906) |
| 0.2 | 3.2 | GO:0051525 | NFAT protein binding(GO:0051525) |
| 0.2 | 1.1 | GO:0048248 | CXCR3 chemokine receptor binding(GO:0048248) |
| 0.2 | 1.6 | GO:0002114 | interleukin-33 receptor activity(GO:0002114) |
| 0.2 | 4.4 | GO:0009931 | calcium-dependent protein serine/threonine kinase activity(GO:0009931) |
| 0.2 | 7.1 | GO:0005095 | GTPase inhibitor activity(GO:0005095) |
| 0.2 | 0.6 | GO:0047389 | glycerophosphocholine phosphodiesterase activity(GO:0047389) |
| 0.2 | 1.5 | GO:0003827 | alpha-1,3-mannosylglycoprotein 2-beta-N-acetylglucosaminyltransferase activity(GO:0003827) |
| 0.2 | 1.5 | GO:0030171 | voltage-gated proton channel activity(GO:0030171) |
| 0.2 | 1.2 | GO:0030377 | urokinase plasminogen activator receptor activity(GO:0030377) |
| 0.2 | 1.6 | GO:0032450 | maltose alpha-glucosidase activity(GO:0032450) |
| 0.2 | 0.8 | GO:0005136 | interleukin-4 receptor binding(GO:0005136) |
| 0.2 | 5.1 | GO:0004143 | diacylglycerol kinase activity(GO:0004143) |
| 0.2 | 1.2 | GO:0016744 | transferase activity, transferring aldehyde or ketonic groups(GO:0016744) |
| 0.2 | 1.1 | GO:0010521 | telomerase inhibitor activity(GO:0010521) |
| 0.2 | 1.1 | GO:0008823 | cupric reductase activity(GO:0008823) ferric-chelate reductase (NADPH) activity(GO:0052851) |
| 0.2 | 0.5 | GO:0045550 | geranylgeranyl reductase activity(GO:0045550) |
| 0.2 | 0.7 | GO:0055100 | adiponectin binding(GO:0055100) |
| 0.2 | 2.8 | GO:0050700 | CARD domain binding(GO:0050700) |
| 0.2 | 0.5 | GO:0035014 | phosphatidylinositol 3-kinase regulator activity(GO:0035014) 1-phosphatidylinositol-3-kinase regulator activity(GO:0046935) |
| 0.2 | 1.6 | GO:0004699 | calcium-independent protein kinase C activity(GO:0004699) |
| 0.2 | 1.0 | GO:0033188 | sphingomyelin synthase activity(GO:0033188) ceramide cholinephosphotransferase activity(GO:0047493) |
| 0.2 | 3.0 | GO:0036374 | glutathione hydrolase activity(GO:0036374) |
| 0.2 | 0.7 | GO:0070259 | tyrosyl-DNA phosphodiesterase activity(GO:0070259) |
| 0.2 | 1.0 | GO:0039552 | RIG-I binding(GO:0039552) |
| 0.2 | 1.3 | GO:0004359 | glutaminase activity(GO:0004359) |
| 0.2 | 1.8 | GO:0030369 | ICAM-3 receptor activity(GO:0030369) |
| 0.2 | 0.6 | GO:0003953 | NAD+ nucleosidase activity(GO:0003953) |
| 0.2 | 1.4 | GO:0019863 | IgE binding(GO:0019863) |
| 0.2 | 0.9 | GO:0060230 | lipoprotein lipase activator activity(GO:0060230) |
| 0.2 | 5.4 | GO:0022829 | wide pore channel activity(GO:0022829) |
| 0.1 | 0.9 | GO:0004534 | 5'-3' exoribonuclease activity(GO:0004534) |
| 0.1 | 0.6 | GO:0051538 | succinate dehydrogenase (ubiquinone) activity(GO:0008177) 3 iron, 4 sulfur cluster binding(GO:0051538) |
| 0.1 | 2.5 | GO:0019957 | C-C chemokine binding(GO:0019957) |
| 0.1 | 1.9 | GO:0008142 | oxysterol binding(GO:0008142) |
| 0.1 | 0.9 | GO:0030375 | thyroid hormone receptor activator activity(GO:0010861) thyroid hormone receptor coactivator activity(GO:0030375) |
| 0.1 | 1.6 | GO:0047134 | protein-disulfide reductase activity(GO:0047134) |
| 0.1 | 0.6 | GO:0004088 | carbamoyl-phosphate synthase (ammonia) activity(GO:0004087) carbamoyl-phosphate synthase (glutamine-hydrolyzing) activity(GO:0004088) |
| 0.1 | 0.9 | GO:0050119 | N-acetylglucosamine deacetylase activity(GO:0050119) |
| 0.1 | 0.5 | GO:0008311 | double-stranded DNA 3'-5' exodeoxyribonuclease activity(GO:0008311) |
| 0.1 | 1.6 | GO:0038049 | transcription factor activity, ligand-activated RNA polymerase II transcription factor binding(GO:0038049) |
| 0.1 | 0.9 | GO:1990932 | 5.8S rRNA binding(GO:1990932) |
| 0.1 | 0.8 | GO:0004505 | phenylalanine 4-monooxygenase activity(GO:0004505) |
| 0.1 | 0.4 | GO:0035379 | carbon dioxide transmembrane transporter activity(GO:0035379) |
| 0.1 | 0.6 | GO:0003839 | gamma-glutamylcyclotransferase activity(GO:0003839) |
| 0.1 | 1.1 | GO:0008449 | N-acetylglucosamine-6-sulfatase activity(GO:0008449) |
| 0.1 | 1.1 | GO:0008269 | JAK pathway signal transduction adaptor activity(GO:0008269) |
| 0.1 | 0.7 | GO:0015307 | drug:proton antiporter activity(GO:0015307) |
| 0.1 | 1.0 | GO:0031849 | olfactory receptor binding(GO:0031849) |
| 0.1 | 0.9 | GO:0031962 | mineralocorticoid receptor binding(GO:0031962) |
| 0.1 | 0.9 | GO:0004797 | thymidine kinase activity(GO:0004797) |
| 0.1 | 0.9 | GO:0003917 | DNA topoisomerase type I activity(GO:0003917) |
| 0.1 | 1.6 | GO:0052650 | NADP-retinol dehydrogenase activity(GO:0052650) |
| 0.1 | 1.9 | GO:0016813 | hydrolase activity, acting on carbon-nitrogen (but not peptide) bonds, in linear amidines(GO:0016813) |
| 0.1 | 1.4 | GO:0015279 | store-operated calcium channel activity(GO:0015279) |
| 0.1 | 0.5 | GO:0004464 | leukotriene-C4 synthase activity(GO:0004464) |
| 0.1 | 2.8 | GO:0097200 | cysteine-type endopeptidase activity involved in execution phase of apoptosis(GO:0097200) |
| 0.1 | 0.5 | GO:0004357 | glutamate-cysteine ligase activity(GO:0004357) |
| 0.1 | 0.4 | GO:0071885 | N-terminal protein N-methyltransferase activity(GO:0071885) |
| 0.1 | 0.4 | GO:0098770 | FBXO family protein binding(GO:0098770) |
| 0.1 | 1.2 | GO:0015266 | protein channel activity(GO:0015266) |
| 0.1 | 0.3 | GO:0097604 | temperature-gated cation channel activity(GO:0097604) |
| 0.1 | 0.6 | GO:0030298 | receptor signaling protein tyrosine kinase activator activity(GO:0030298) |
| 0.1 | 1.5 | GO:0004321 | fatty-acyl-CoA synthase activity(GO:0004321) |
| 0.1 | 0.3 | GO:0008480 | sarcosine dehydrogenase activity(GO:0008480) |
| 0.1 | 1.1 | GO:0019869 | chloride channel inhibitor activity(GO:0019869) |
| 0.1 | 0.7 | GO:0004800 | thyroxine 5'-deiodinase activity(GO:0004800) |
| 0.1 | 0.4 | GO:0035033 | histone deacetylase regulator activity(GO:0035033) |
| 0.1 | 24.8 | GO:0003823 | antigen binding(GO:0003823) |
| 0.1 | 0.9 | GO:0016174 | NAD(P)H oxidase activity(GO:0016174) |
| 0.1 | 0.3 | GO:1990239 | steroid hormone binding(GO:1990239) |
| 0.1 | 1.9 | GO:0001206 | transcriptional repressor activity, RNA polymerase II distal enhancer sequence-specific binding(GO:0001206) |
| 0.1 | 0.9 | GO:0032393 | MHC class I receptor activity(GO:0032393) |
| 0.1 | 1.3 | GO:0001135 | transcription factor activity, RNA polymerase II transcription factor recruiting(GO:0001135) |
| 0.1 | 1.7 | GO:0005436 | sodium:phosphate symporter activity(GO:0005436) |
| 0.1 | 2.1 | GO:0015125 | bile acid transmembrane transporter activity(GO:0015125) |
| 0.1 | 1.4 | GO:0005149 | interleukin-1 receptor binding(GO:0005149) |
| 0.1 | 1.4 | GO:0032453 | histone demethylase activity (H3-K4 specific)(GO:0032453) |
| 0.1 | 2.2 | GO:0022841 | potassium ion leak channel activity(GO:0022841) |
| 0.1 | 0.3 | GO:0042978 | ornithine decarboxylase activator activity(GO:0042978) |
| 0.1 | 1.6 | GO:0044548 | S100 protein binding(GO:0044548) |
| 0.1 | 0.3 | GO:0090556 | apolipoprotein A-I receptor activity(GO:0034188) phosphatidylserine-translocating ATPase activity(GO:0090556) |
| 0.1 | 0.3 | GO:0016608 | growth hormone-releasing hormone activity(GO:0016608) |
| 0.1 | 0.5 | GO:0018685 | alkane 1-monooxygenase activity(GO:0018685) |
| 0.1 | 1.3 | GO:0016997 | exo-alpha-sialidase activity(GO:0004308) alpha-sialidase activity(GO:0016997) |
| 0.1 | 0.5 | GO:0003945 | N-acetyllactosamine synthase activity(GO:0003945) |
| 0.1 | 0.9 | GO:0019826 | oxygen sensor activity(GO:0019826) |
| 0.1 | 0.8 | GO:0004396 | glucokinase activity(GO:0004340) hexokinase activity(GO:0004396) fructokinase activity(GO:0008865) mannokinase activity(GO:0019158) |
| 0.1 | 0.2 | GO:0035731 | S-nitrosoglutathione binding(GO:0035730) dinitrosyl-iron complex binding(GO:0035731) |
| 0.1 | 0.5 | GO:0016972 | thiol oxidase activity(GO:0016972) |
| 0.1 | 0.5 | GO:0003875 | ADP-ribosylarginine hydrolase activity(GO:0003875) |
| 0.1 | 1.1 | GO:0003720 | telomerase activity(GO:0003720) RNA-directed DNA polymerase activity(GO:0003964) |
| 0.1 | 1.6 | GO:0004383 | guanylate cyclase activity(GO:0004383) |
| 0.1 | 1.5 | GO:0004089 | carbonate dehydratase activity(GO:0004089) |
| 0.1 | 0.4 | GO:0019776 | Atg8 ligase activity(GO:0019776) |
| 0.1 | 0.7 | GO:0034235 | GPI anchor binding(GO:0034235) |
| 0.1 | 0.7 | GO:0004565 | beta-galactosidase activity(GO:0004565) |
| 0.1 | 1.0 | GO:0001591 | dopamine neurotransmitter receptor activity, coupled via Gi/Go(GO:0001591) |
| 0.1 | 1.5 | GO:0001161 | intronic transcription regulatory region sequence-specific DNA binding(GO:0001161) intronic transcription regulatory region DNA binding(GO:0044213) |
| 0.1 | 1.3 | GO:0042609 | CD4 receptor binding(GO:0042609) |
| 0.1 | 0.2 | GO:0005427 | proton-dependent oligopeptide secondary active transmembrane transporter activity(GO:0005427) secondary active oligopeptide transmembrane transporter activity(GO:0015322) |
| 0.1 | 0.2 | GO:0019781 | NEDD8 activating enzyme activity(GO:0019781) |
| 0.1 | 0.7 | GO:0042296 | ISG15 transferase activity(GO:0042296) |
| 0.1 | 4.3 | GO:0001784 | phosphotyrosine binding(GO:0001784) |
| 0.1 | 0.2 | GO:0033989 | 3alpha,7alpha,12alpha-trihydroxy-5beta-cholest-24-enoyl-CoA hydratase activity(GO:0033989) 17-beta-hydroxysteroid dehydrogenase (NAD+) activity(GO:0044594) |
| 0.1 | 6.4 | GO:0003743 | translation initiation factor activity(GO:0003743) |
| 0.1 | 0.7 | GO:0003689 | DNA clamp loader activity(GO:0003689) protein-DNA loading ATPase activity(GO:0033170) |
| 0.1 | 1.9 | GO:0004012 | phospholipid-translocating ATPase activity(GO:0004012) |
| 0.1 | 0.6 | GO:0004372 | glycine hydroxymethyltransferase activity(GO:0004372) threonine aldolase activity(GO:0004793) L-allo-threonine aldolase activity(GO:0008732) |
| 0.1 | 0.8 | GO:0004767 | sphingomyelin phosphodiesterase activity(GO:0004767) |
| 0.1 | 0.3 | GO:0089720 | caspase binding(GO:0089720) |
| 0.1 | 0.3 | GO:0005148 | prolactin receptor binding(GO:0005148) |
| 0.1 | 1.2 | GO:0005391 | sodium:potassium-exchanging ATPase activity(GO:0005391) |
| 0.1 | 2.3 | GO:0005123 | death receptor binding(GO:0005123) |
| 0.1 | 3.5 | GO:0043027 | cysteine-type endopeptidase inhibitor activity involved in apoptotic process(GO:0043027) |
| 0.1 | 7.5 | GO:0004715 | non-membrane spanning protein tyrosine kinase activity(GO:0004715) |
| 0.1 | 0.3 | GO:0016434 | rRNA (cytosine) methyltransferase activity(GO:0016434) |
| 0.1 | 0.6 | GO:0030345 | extracellular matrix structural constituent conferring compression resistance(GO:0030021) structural constituent of tooth enamel(GO:0030345) |
| 0.1 | 1.2 | GO:0051400 | BH domain binding(GO:0051400) |
| 0.1 | 1.0 | GO:0047144 | 2-acylglycerol-3-phosphate O-acyltransferase activity(GO:0047144) |
| 0.1 | 0.5 | GO:0017060 | 3-galactosyl-N-acetylglucosaminide 4-alpha-L-fucosyltransferase activity(GO:0017060) |
| 0.1 | 1.1 | GO:0015245 | fatty acid transporter activity(GO:0015245) |
| 0.1 | 0.5 | GO:0099580 | ion antiporter activity involved in regulation of postsynaptic membrane potential(GO:0099580) |
| 0.1 | 0.4 | GO:0047961 | glycine N-acyltransferase activity(GO:0047961) |
| 0.1 | 0.4 | GO:0070644 | vitamin D response element binding(GO:0070644) |
| 0.1 | 1.5 | GO:0001848 | complement binding(GO:0001848) |
| 0.1 | 1.3 | GO:0019992 | diacylglycerol binding(GO:0019992) |
| 0.1 | 1.5 | GO:0070330 | aromatase activity(GO:0070330) |
| 0.1 | 0.8 | GO:0060229 | lipase activator activity(GO:0060229) |
| 0.1 | 0.8 | GO:0036122 | BMP binding(GO:0036122) |
| 0.1 | 1.8 | GO:0045125 | bioactive lipid receptor activity(GO:0045125) |
| 0.1 | 3.5 | GO:0050699 | WW domain binding(GO:0050699) |
| 0.1 | 0.7 | GO:0008428 | ribonuclease inhibitor activity(GO:0008428) |
| 0.1 | 1.8 | GO:0005540 | hyaluronic acid binding(GO:0005540) |
| 0.1 | 1.3 | GO:0004000 | adenosine deaminase activity(GO:0004000) |
| 0.1 | 1.0 | GO:0030169 | low-density lipoprotein particle binding(GO:0030169) |
| 0.1 | 0.4 | GO:0005047 | signal recognition particle binding(GO:0005047) |
| 0.1 | 2.2 | GO:0017166 | vinculin binding(GO:0017166) |
| 0.0 | 0.5 | GO:0032036 | myosin heavy chain binding(GO:0032036) |
| 0.0 | 0.5 | GO:0030274 | LIM domain binding(GO:0030274) |
| 0.0 | 0.4 | GO:0043023 | ribosomal large subunit binding(GO:0043023) |
| 0.0 | 0.3 | GO:0032422 | purine-rich negative regulatory element binding(GO:0032422) |
| 0.0 | 0.5 | GO:0003951 | NAD+ kinase activity(GO:0003951) |
| 0.0 | 1.9 | GO:0005164 | tumor necrosis factor receptor binding(GO:0005164) |
| 0.0 | 0.4 | GO:0004176 | ATP-dependent peptidase activity(GO:0004176) |
| 0.0 | 0.1 | GO:0004939 | beta-adrenergic receptor activity(GO:0004939) |
| 0.0 | 6.9 | GO:0004896 | cytokine receptor activity(GO:0004896) |
| 0.0 | 1.2 | GO:0004535 | poly(A)-specific ribonuclease activity(GO:0004535) |
| 0.0 | 0.4 | GO:0004609 | phosphatidylserine decarboxylase activity(GO:0004609) |
| 0.0 | 0.5 | GO:1904929 | coreceptor activity involved in Wnt signaling pathway, planar cell polarity pathway(GO:1904929) |
| 0.0 | 0.3 | GO:0035473 | lipase binding(GO:0035473) |
| 0.0 | 0.2 | GO:1904455 | ubiquitin-specific protease activity involved in negative regulation of ERAD pathway(GO:1904455) |
| 0.0 | 0.4 | GO:0004032 | alditol:NADP+ 1-oxidoreductase activity(GO:0004032) |
| 0.0 | 2.5 | GO:1990841 | promoter-specific chromatin binding(GO:1990841) |
| 0.0 | 0.2 | GO:0047757 | chondroitin-glucuronate 5-epimerase activity(GO:0047757) |
| 0.0 | 0.5 | GO:0047498 | calcium-dependent phospholipase A2 activity(GO:0047498) |
| 0.0 | 0.8 | GO:0015187 | glycine transmembrane transporter activity(GO:0015187) |
| 0.0 | 0.3 | GO:0042030 | ATPase inhibitor activity(GO:0042030) |
| 0.0 | 0.3 | GO:0038052 | RNA polymerase II transcription factor activity, estrogen-activated sequence-specific DNA binding(GO:0038052) |
| 0.0 | 2.0 | GO:0048027 | mRNA 5'-UTR binding(GO:0048027) |
| 0.0 | 1.0 | GO:0005035 | tumor necrosis factor-activated receptor activity(GO:0005031) death receptor activity(GO:0005035) |
| 0.0 | 0.1 | GO:0035276 | ethanol binding(GO:0035276) |
| 0.0 | 0.8 | GO:0005049 | nuclear export signal receptor activity(GO:0005049) |
| 0.0 | 4.2 | GO:0001618 | virus receptor activity(GO:0001618) |
| 0.0 | 0.8 | GO:0005522 | profilin binding(GO:0005522) |
| 0.0 | 0.8 | GO:0048185 | activin binding(GO:0048185) |
| 0.0 | 0.9 | GO:0030296 | protein tyrosine kinase activator activity(GO:0030296) |
| 0.0 | 0.6 | GO:1902282 | voltage-gated potassium channel activity involved in ventricular cardiac muscle cell action potential repolarization(GO:1902282) |
| 0.0 | 0.3 | GO:0045029 | UDP-activated nucleotide receptor activity(GO:0045029) |
| 0.0 | 2.4 | GO:0003755 | peptidyl-prolyl cis-trans isomerase activity(GO:0003755) |
| 0.0 | 1.7 | GO:0005484 | SNAP receptor activity(GO:0005484) |
| 0.0 | 0.6 | GO:0042809 | vitamin D receptor binding(GO:0042809) |
| 0.0 | 1.7 | GO:0005086 | ARF guanyl-nucleotide exchange factor activity(GO:0005086) |
| 0.0 | 1.6 | GO:0003785 | actin monomer binding(GO:0003785) |
| 0.0 | 0.9 | GO:0015035 | protein disulfide oxidoreductase activity(GO:0015035) |
| 0.0 | 0.6 | GO:0008140 | cAMP response element binding protein binding(GO:0008140) |
| 0.0 | 0.2 | GO:0019788 | NEDD8 transferase activity(GO:0019788) |
| 0.0 | 0.6 | GO:0016505 | peptidase activator activity involved in apoptotic process(GO:0016505) |
| 0.0 | 0.3 | GO:0004689 | phosphorylase kinase activity(GO:0004689) |
| 0.0 | 0.5 | GO:0031435 | mitogen-activated protein kinase kinase kinase binding(GO:0031435) |
| 0.0 | 0.7 | GO:0052629 | phosphatidylinositol-3,5-bisphosphate 3-phosphatase activity(GO:0052629) |
| 0.0 | 0.3 | GO:0004634 | phosphopyruvate hydratase activity(GO:0004634) |
| 0.0 | 8.2 | GO:0004252 | serine-type endopeptidase activity(GO:0004252) |
| 0.0 | 4.8 | GO:0004860 | protein kinase inhibitor activity(GO:0004860) |
| 0.0 | 0.8 | GO:0048018 | receptor agonist activity(GO:0048018) |
| 0.0 | 1.8 | GO:0030374 | ligand-dependent nuclear receptor transcription coactivator activity(GO:0030374) |
| 0.0 | 7.1 | GO:0019902 | phosphatase binding(GO:0019902) |
| 0.0 | 4.6 | GO:0005178 | integrin binding(GO:0005178) |
| 0.0 | 1.9 | GO:0019843 | rRNA binding(GO:0019843) |
| 0.0 | 0.8 | GO:0045294 | alpha-catenin binding(GO:0045294) |
| 0.0 | 0.5 | GO:0008199 | ferric iron binding(GO:0008199) |
| 0.0 | 0.3 | GO:0015143 | urate transmembrane transporter activity(GO:0015143) salt transmembrane transporter activity(GO:1901702) |
| 0.0 | 0.2 | GO:0008109 | N-acetyllactosaminide beta-1,6-N-acetylglucosaminyltransferase activity(GO:0008109) |
| 0.0 | 0.2 | GO:1990825 | sequence-specific mRNA binding(GO:1990825) |
| 0.0 | 3.9 | GO:0004867 | serine-type endopeptidase inhibitor activity(GO:0004867) |
| 0.0 | 1.3 | GO:0030676 | Rac guanyl-nucleotide exchange factor activity(GO:0030676) |
| 0.0 | 1.8 | GO:0043022 | ribosome binding(GO:0043022) |
| 0.0 | 0.8 | GO:0004864 | protein phosphatase inhibitor activity(GO:0004864) |
| 0.0 | 0.3 | GO:0035005 | 1-phosphatidylinositol-4-phosphate 3-kinase activity(GO:0035005) |
| 0.0 | 0.2 | GO:0035613 | RNA stem-loop binding(GO:0035613) |
| 0.0 | 5.4 | GO:0001078 | transcriptional repressor activity, RNA polymerase II core promoter proximal region sequence-specific binding(GO:0001078) |
| 0.0 | 0.7 | GO:0043539 | protein serine/threonine kinase activator activity(GO:0043539) |
| 0.0 | 0.2 | GO:0004459 | L-lactate dehydrogenase activity(GO:0004459) |
| 0.0 | 0.4 | GO:0003836 | beta-galactoside (CMP) alpha-2,3-sialyltransferase activity(GO:0003836) |
| 0.0 | 1.1 | GO:0051539 | 4 iron, 4 sulfur cluster binding(GO:0051539) |
| 0.0 | 0.6 | GO:0004653 | polypeptide N-acetylgalactosaminyltransferase activity(GO:0004653) |
| 0.0 | 0.3 | GO:0005537 | mannose binding(GO:0005537) |
| 0.0 | 4.1 | GO:0005125 | cytokine activity(GO:0005125) |
| 0.0 | 0.2 | GO:0016846 | carbon-sulfur lyase activity(GO:0016846) |
| 0.0 | 0.3 | GO:0003708 | retinoic acid receptor activity(GO:0003708) |
| 0.0 | 0.8 | GO:0008536 | Ran GTPase binding(GO:0008536) |
| 0.0 | 0.2 | GO:0017151 | DEAD/H-box RNA helicase binding(GO:0017151) |
| 0.0 | 0.1 | GO:1990763 | arrestin family protein binding(GO:1990763) |
| 0.0 | 10.3 | GO:0046982 | protein heterodimerization activity(GO:0046982) |
| 0.0 | 1.1 | GO:0004866 | endopeptidase inhibitor activity(GO:0004866) |
| 0.0 | 1.5 | GO:0005544 | calcium-dependent phospholipid binding(GO:0005544) |
| 0.0 | 0.1 | GO:0070137 | ubiquitin-like protein-specific endopeptidase activity(GO:0070137) SUMO-specific endopeptidase activity(GO:0070139) |
| 0.0 | 0.5 | GO:0030331 | estrogen receptor binding(GO:0030331) |
| 0.0 | 0.4 | GO:0004697 | protein kinase C activity(GO:0004697) |
| 0.0 | 0.3 | GO:0008329 | signaling pattern recognition receptor activity(GO:0008329) pattern recognition receptor activity(GO:0038187) |
| 0.0 | 1.2 | GO:0000979 | RNA polymerase II core promoter sequence-specific DNA binding(GO:0000979) |
| 0.0 | 0.1 | GO:0004392 | heme oxygenase (decyclizing) activity(GO:0004392) |
| 0.0 | 1.9 | GO:0003727 | single-stranded RNA binding(GO:0003727) |
| 0.0 | 0.1 | GO:0016841 | ammonia-lyase activity(GO:0016841) |
| 0.0 | 0.3 | GO:0008195 | phosphatidate phosphatase activity(GO:0008195) |
| 0.0 | 0.4 | GO:0001056 | RNA polymerase III activity(GO:0001056) |
| 0.0 | 0.4 | GO:0031698 | beta-2 adrenergic receptor binding(GO:0031698) |
| 0.0 | 0.3 | GO:0016832 | aldehyde-lyase activity(GO:0016832) |
| 0.0 | 0.1 | GO:0004305 | ethanolamine kinase activity(GO:0004305) |
| 0.0 | 0.1 | GO:0004774 | succinate-CoA ligase activity(GO:0004774) succinate-CoA ligase (ADP-forming) activity(GO:0004775) |
| 0.0 | 0.1 | GO:0047756 | chondroitin 4-sulfotransferase activity(GO:0047756) |
| 0.0 | 1.0 | GO:0031593 | polyubiquitin binding(GO:0031593) |
| 0.0 | 0.1 | GO:0008048 | calcium sensitive guanylate cyclase activator activity(GO:0008048) |
| 0.0 | 0.3 | GO:0046966 | thyroid hormone receptor binding(GO:0046966) |
| 0.0 | 0.2 | GO:0004985 | opioid receptor activity(GO:0004985) |
| 0.0 | 0.3 | GO:0000014 | single-stranded DNA endodeoxyribonuclease activity(GO:0000014) |
| 0.0 | 0.3 | GO:0005487 | nucleocytoplasmic transporter activity(GO:0005487) |
| 0.0 | 1.3 | GO:0004843 | thiol-dependent ubiquitin-specific protease activity(GO:0004843) |
| 0.0 | 0.7 | GO:0016831 | carboxy-lyase activity(GO:0016831) |
| 0.0 | 0.1 | GO:1990050 | phosphatidic acid transporter activity(GO:1990050) |
| 0.0 | 0.1 | GO:0050291 | sphingosine N-acyltransferase activity(GO:0050291) |
| 0.0 | 0.4 | GO:0030515 | snoRNA binding(GO:0030515) |
| 0.0 | 0.2 | GO:0016500 | protein-hormone receptor activity(GO:0016500) |
| 0.0 | 0.1 | GO:0004468 | lysine N-acetyltransferase activity, acting on acetyl phosphate as donor(GO:0004468) |
| 0.0 | 0.6 | GO:0008028 | monocarboxylic acid transmembrane transporter activity(GO:0008028) |
| 0.0 | 0.3 | GO:0004709 | MAP kinase kinase kinase activity(GO:0004709) |
Gene overrepresentation in curated gene sets: canonical pathways category:
| Log-likelihood per target | Total log-likelihood | Term | Description |
|---|---|---|---|
| 0.5 | 8.7 | ST INTERFERON GAMMA PATHWAY | Interferon gamma pathway. |
| 0.4 | 19.5 | SA CASPASE CASCADE | Apoptosis is mediated by caspases, cysteine proteases arranged in a proteolytic cascade. |
| 0.3 | 14.5 | PID TOLL ENDOGENOUS PATHWAY | Endogenous TLR signaling |
| 0.3 | 16.5 | PID INTEGRIN2 PATHWAY | Beta2 integrin cell surface interactions |
| 0.3 | 15.6 | PID IL12 STAT4 PATHWAY | IL12 signaling mediated by STAT4 |
| 0.2 | 5.0 | PID TCR JNK PATHWAY | JNK signaling in the CD4+ TCR pathway |
| 0.2 | 0.6 | PID AR NONGENOMIC PATHWAY | Nongenotropic Androgen signaling |
| 0.1 | 7.9 | PID P38 MK2 PATHWAY | p38 signaling mediated by MAPKAP kinases |
| 0.1 | 0.8 | ST TYPE I INTERFERON PATHWAY | Type I Interferon (alpha/beta IFN) Pathway |
| 0.1 | 5.3 | SA MMP CYTOKINE CONNECTION | Cytokines can induce activation of matrix metalloproteinases, which degrade extracellular matrix. |
| 0.1 | 7.1 | PID IL8 CXCR2 PATHWAY | IL8- and CXCR2-mediated signaling events |
| 0.1 | 4.7 | PID IL1 PATHWAY | IL1-mediated signaling events |
| 0.1 | 1.5 | PID TCR CALCIUM PATHWAY | Calcium signaling in the CD4+ TCR pathway |
| 0.1 | 5.7 | PID AMB2 NEUTROPHILS PATHWAY | amb2 Integrin signaling |
| 0.1 | 5.6 | PID UPA UPAR PATHWAY | Urokinase-type plasminogen activator (uPA) and uPAR-mediated signaling |
| 0.1 | 11.1 | PID IL4 2PATHWAY | IL4-mediated signaling events |
| 0.1 | 3.1 | PID CD8 TCR PATHWAY | TCR signaling in naïve CD8+ T cells |
| 0.1 | 5.1 | PID CD8 TCR DOWNSTREAM PATHWAY | Downstream signaling in naïve CD8+ T cells |
| 0.1 | 6.2 | PID CASPASE PATHWAY | Caspase cascade in apoptosis |
| 0.1 | 0.5 | SA G1 AND S PHASES | Cdk2, 4, and 6 bind cyclin D in G1, while cdk2/cyclin E promotes the G1/S transition. |
| 0.1 | 1.2 | SA PROGRAMMED CELL DEATH | Programmed cell death, or apoptosis, eliminates damaged or unneeded cells. |
| 0.1 | 4.4 | PID FCER1 PATHWAY | Fc-epsilon receptor I signaling in mast cells |
| 0.1 | 5.1 | PID NFAT TFPATHWAY | Calcineurin-regulated NFAT-dependent transcription in lymphocytes |
| 0.1 | 2.4 | ST PHOSPHOINOSITIDE 3 KINASE PATHWAY | PI3K Pathway |
| 0.1 | 1.5 | PID NFKAPPAB CANONICAL PATHWAY | Canonical NF-kappaB pathway |
| 0.1 | 1.1 | PID IL2 STAT5 PATHWAY | IL2 signaling events mediated by STAT5 |
| 0.1 | 1.1 | PID IL2 1PATHWAY | IL2-mediated signaling events |
| 0.1 | 2.7 | PID NFAT 3PATHWAY | Role of Calcineurin-dependent NFAT signaling in lymphocytes |
| 0.1 | 0.8 | PID INTEGRIN5 PATHWAY | Beta5 beta6 beta7 and beta8 integrin cell surface interactions |
| 0.0 | 1.3 | SA PTEN PATHWAY | PTEN is a tumor suppressor that dephosphorylates the lipid messenger phosphatidylinositol triphosphate. |
| 0.0 | 3.7 | PID SYNDECAN 1 PATHWAY | Syndecan-1-mediated signaling events |
| 0.0 | 4.2 | PID HIF1 TFPATHWAY | HIF-1-alpha transcription factor network |
| 0.0 | 1.6 | PID ENDOTHELIN PATHWAY | Endothelins |
| 0.0 | 1.4 | SIG PIP3 SIGNALING IN B LYMPHOCYTES | Genes related to PIP3 signaling in B lymphocytes |
| 0.0 | 0.9 | PID GMCSF PATHWAY | GMCSF-mediated signaling events |
| 0.0 | 2.0 | PID HIF2PATHWAY | HIF-2-alpha transcription factor network |
| 0.0 | 1.4 | PID FRA PATHWAY | Validated transcriptional targets of AP1 family members Fra1 and Fra2 |
| 0.0 | 0.3 | PID TCPTP PATHWAY | Signaling events mediated by TCPTP |
| 0.0 | 0.6 | PID SYNDECAN 3 PATHWAY | Syndecan-3-mediated signaling events |
| 0.0 | 1.3 | PID WNT CANONICAL PATHWAY | Canonical Wnt signaling pathway |
| 0.0 | 0.9 | NABA COLLAGENS | Genes encoding collagen proteins |
| 0.0 | 2.6 | PID HNF3A PATHWAY | FOXA1 transcription factor network |
| 0.0 | 2.3 | PID RAC1 PATHWAY | RAC1 signaling pathway |
| 0.0 | 0.6 | PID EPHA2 FWD PATHWAY | EPHA2 forward signaling |
| 0.0 | 0.7 | ST JNK MAPK PATHWAY | JNK MAPK Pathway |
| 0.0 | 0.8 | PID IL6 7 PATHWAY | IL6-mediated signaling events |
| 0.0 | 1.0 | PID RHOA PATHWAY | RhoA signaling pathway |
| 0.0 | 0.6 | PID P38 MKK3 6PATHWAY | p38 MAPK signaling pathway |
| 0.0 | 0.9 | PID ATM PATHWAY | ATM pathway |
| 0.0 | 0.6 | PID CXCR3 PATHWAY | CXCR3-mediated signaling events |
| 0.0 | 1.0 | PID MET PATHWAY | Signaling events mediated by Hepatocyte Growth Factor Receptor (c-Met) |
| 0.0 | 0.5 | PID ANGIOPOIETIN RECEPTOR PATHWAY | Angiopoietin receptor Tie2-mediated signaling |
| 0.0 | 0.7 | PID WNT SIGNALING PATHWAY | Wnt signaling network |
| 0.0 | 1.6 | PID TELOMERASE PATHWAY | Regulation of Telomerase |
| 0.0 | 1.3 | PID PDGFRB PATHWAY | PDGFR-beta signaling pathway |
| 0.0 | 1.7 | PID MYC ACTIV PATHWAY | Validated targets of C-MYC transcriptional activation |
| 0.0 | 0.5 | PID NOTCH PATHWAY | Notch signaling pathway |
| 0.0 | 0.3 | PID IL23 PATHWAY | IL23-mediated signaling events |
| 0.0 | 1.8 | PID SMAD2 3NUCLEAR PATHWAY | Regulation of nuclear SMAD2/3 signaling |
| 0.0 | 3.0 | PID P53 DOWNSTREAM PATHWAY | Direct p53 effectors |
| 0.0 | 0.8 | PID AURORA A PATHWAY | Aurora A signaling |
| 0.0 | 0.2 | PID ERB GENOMIC PATHWAY | Validated nuclear estrogen receptor beta network |
| 0.0 | 6.0 | NABA SECRETED FACTORS | Genes encoding secreted soluble factors |
| 0.0 | 0.4 | PID PRL SIGNALING EVENTS PATHWAY | Signaling events mediated by PRL |
| 0.0 | 0.4 | PID REELIN PATHWAY | Reelin signaling pathway |
| 0.0 | 0.3 | ST G ALPHA S PATHWAY | G alpha s Pathway |
| 0.0 | 0.6 | PID LKB1 PATHWAY | LKB1 signaling events |
| 0.0 | 0.2 | ST DIFFERENTIATION PATHWAY IN PC12 CELLS | Differentiation Pathway in PC12 Cells; this is a specific case of PAC1 Receptor Pathway. |
Gene overrepresentation in curated gene sets: REACTOME pathways category:
| Log-likelihood per target | Total log-likelihood | Term | Description |
|---|---|---|---|
| 0.6 | 13.1 | REACTOME TRANSLOCATION OF ZAP 70 TO IMMUNOLOGICAL SYNAPSE | Genes involved in Translocation of ZAP-70 to Immunological synapse |
| 0.4 | 4.4 | REACTOME TRAF6 MEDIATED IRF7 ACTIVATION IN TLR7 8 OR 9 SIGNALING | Genes involved in TRAF6 mediated IRF7 activation in TLR7/8 or 9 signaling |
| 0.4 | 7.0 | REACTOME IKK COMPLEX RECRUITMENT MEDIATED BY RIP1 | Genes involved in IKK complex recruitment mediated by RIP1 |
| 0.3 | 9.4 | REACTOME ACTIVATED TAK1 MEDIATES P38 MAPK ACTIVATION | Genes involved in activated TAK1 mediates p38 MAPK activation |
| 0.3 | 36.3 | REACTOME IMMUNOREGULATORY INTERACTIONS BETWEEN A LYMPHOID AND A NON LYMPHOID CELL | Genes involved in Immunoregulatory interactions between a Lymphoid and a non-Lymphoid cell |
| 0.3 | 5.4 | REACTOME COMMON PATHWAY | Genes involved in Common Pathway |
| 0.2 | 5.7 | REACTOME TAK1 ACTIVATES NFKB BY PHOSPHORYLATION AND ACTIVATION OF IKKS COMPLEX | Genes involved in TAK1 activates NFkB by phosphorylation and activation of IKKs complex |
| 0.2 | 1.4 | REACTOME ELEVATION OF CYTOSOLIC CA2 LEVELS | Genes involved in Elevation of cytosolic Ca2+ levels |
| 0.2 | 1.3 | REACTOME PD1 SIGNALING | Genes involved in PD-1 signaling |
| 0.2 | 11.3 | REACTOME GROWTH HORMONE RECEPTOR SIGNALING | Genes involved in Growth hormone receptor signaling |
| 0.2 | 9.6 | REACTOME DEFENSINS | Genes involved in Defensins |
| 0.2 | 6.6 | REACTOME EXTRINSIC PATHWAY FOR APOPTOSIS | Genes involved in Extrinsic Pathway for Apoptosis |
| 0.2 | 4.5 | REACTOME REGULATION OF COMPLEMENT CASCADE | Genes involved in Regulation of Complement cascade |
| 0.2 | 17.3 | REACTOME INTERFERON ALPHA BETA SIGNALING | Genes involved in Interferon alpha/beta signaling |
| 0.2 | 5.1 | REACTOME GENERATION OF SECOND MESSENGER MOLECULES | Genes involved in Generation of second messenger molecules |
| 0.2 | 8.7 | REACTOME EFFECTS OF PIP2 HYDROLYSIS | Genes involved in Effects of PIP2 hydrolysis |
| 0.1 | 8.1 | REACTOME INTRINSIC PATHWAY FOR APOPTOSIS | Genes involved in Intrinsic Pathway for Apoptosis |
| 0.1 | 6.5 | REACTOME IL1 SIGNALING | Genes involved in Interleukin-1 signaling |
| 0.1 | 3.0 | REACTOME INFLAMMASOMES | Genes involved in Inflammasomes |
| 0.1 | 2.4 | REACTOME RECYCLING OF BILE ACIDS AND SALTS | Genes involved in Recycling of bile acids and salts |
| 0.1 | 3.1 | REACTOME EICOSANOID LIGAND BINDING RECEPTORS | Genes involved in Eicosanoid ligand-binding receptors |
| 0.1 | 1.8 | REACTOME RECEPTOR LIGAND BINDING INITIATES THE SECOND PROTEOLYTIC CLEAVAGE OF NOTCH RECEPTOR | Genes involved in Receptor-ligand binding initiates the second proteolytic cleavage of Notch receptor |
| 0.1 | 4.3 | REACTOME GRB2 SOS PROVIDES LINKAGE TO MAPK SIGNALING FOR INTERGRINS | Genes involved in GRB2:SOS provides linkage to MAPK signaling for Intergrins |
| 0.1 | 2.5 | REACTOME TANDEM PORE DOMAIN POTASSIUM CHANNELS | Genes involved in Tandem pore domain potassium channels |
| 0.1 | 5.2 | REACTOME SEMA4D INDUCED CELL MIGRATION AND GROWTH CONE COLLAPSE | Genes involved in Sema4D induced cell migration and growth-cone collapse |
| 0.1 | 1.1 | REACTOME REGULATION OF IFNG SIGNALING | Genes involved in Regulation of IFNG signaling |
| 0.1 | 6.3 | REACTOME CHEMOKINE RECEPTORS BIND CHEMOKINES | Genes involved in Chemokine receptors bind chemokines |
| 0.1 | 1.5 | REACTOME REVERSIBLE HYDRATION OF CARBON DIOXIDE | Genes involved in Reversible Hydration of Carbon Dioxide |
| 0.1 | 4.3 | REACTOME LYSOSOME VESICLE BIOGENESIS | Genes involved in Lysosome Vesicle Biogenesis |
| 0.1 | 4.1 | REACTOME IL RECEPTOR SHC SIGNALING | Genes involved in Interleukin receptor SHC signaling |
| 0.1 | 2.0 | REACTOME PROTEOLYTIC CLEAVAGE OF SNARE COMPLEX PROTEINS | Genes involved in Proteolytic cleavage of SNARE complex proteins |
| 0.1 | 3.9 | REACTOME GLUTATHIONE CONJUGATION | Genes involved in Glutathione conjugation |
| 0.1 | 1.6 | REACTOME THE ACTIVATION OF ARYLSULFATASES | Genes involved in The activation of arylsulfatases |
| 0.1 | 2.6 | REACTOME NA CL DEPENDENT NEUROTRANSMITTER TRANSPORTERS | Genes involved in Na+/Cl- dependent neurotransmitter transporters |
| 0.1 | 1.5 | REACTOME ACYL CHAIN REMODELLING OF PG | Genes involved in Acyl chain remodelling of PG |
| 0.1 | 1.4 | REACTOME BILE SALT AND ORGANIC ANION SLC TRANSPORTERS | Genes involved in Bile salt and organic anion SLC transporters |
| 0.1 | 1.1 | REACTOME POL SWITCHING | Genes involved in Polymerase switching |
| 0.1 | 0.5 | REACTOME SYNTHESIS OF BILE ACIDS AND BILE SALTS VIA 24 HYDROXYCHOLESTEROL | Genes involved in Synthesis of bile acids and bile salts via 24-hydroxycholesterol |
| 0.1 | 8.8 | REACTOME TRANSCRIPTIONAL REGULATION OF WHITE ADIPOCYTE DIFFERENTIATION | Genes involved in Transcriptional Regulation of White Adipocyte Differentiation |
| 0.1 | 4.4 | REACTOME GLUCONEOGENESIS | Genes involved in Gluconeogenesis |
| 0.1 | 1.1 | REACTOME CELL DEATH SIGNALLING VIA NRAGE NRIF AND NADE | Genes involved in Cell death signalling via NRAGE, NRIF and NADE |
| 0.1 | 2.1 | REACTOME AMYLOIDS | Genes involved in Amyloids |
| 0.1 | 0.8 | REACTOME HORMONE LIGAND BINDING RECEPTORS | Genes involved in Hormone ligand-binding receptors |
| 0.1 | 3.9 | REACTOME CYTOCHROME P450 ARRANGED BY SUBSTRATE TYPE | Genes involved in Cytochrome P450 - arranged by substrate type |
| 0.1 | 1.7 | REACTOME PKA MEDIATED PHOSPHORYLATION OF CREB | Genes involved in PKA-mediated phosphorylation of CREB |
| 0.0 | 1.3 | REACTOME PURINE SALVAGE | Genes involved in Purine salvage |
| 0.0 | 0.5 | REACTOME PLATELET CALCIUM HOMEOSTASIS | Genes involved in Platelet calcium homeostasis |
| 0.0 | 2.2 | REACTOME SYNTHESIS OF PIPS AT THE PLASMA MEMBRANE | Genes involved in Synthesis of PIPs at the plasma membrane |
| 0.0 | 3.2 | REACTOME ION TRANSPORT BY P TYPE ATPASES | Genes involved in Ion transport by P-type ATPases |
| 0.0 | 0.4 | REACTOME NOD1 2 SIGNALING PATHWAY | Genes involved in NOD1/2 Signaling Pathway |
| 0.0 | 0.6 | REACTOME TRYPTOPHAN CATABOLISM | Genes involved in Tryptophan catabolism |
| 0.0 | 2.8 | REACTOME MITOCHONDRIAL PROTEIN IMPORT | Genes involved in Mitochondrial Protein Import |
| 0.0 | 0.4 | REACTOME HS GAG DEGRADATION | Genes involved in HS-GAG degradation |
| 0.0 | 0.9 | REACTOME DESTABILIZATION OF MRNA BY TRISTETRAPROLIN TTP | Genes involved in Destabilization of mRNA by Tristetraprolin (TTP) |
| 0.0 | 1.0 | REACTOME ORGANIC CATION ANION ZWITTERION TRANSPORT | Genes involved in Organic cation/anion/zwitterion transport |
| 0.0 | 1.8 | REACTOME HS GAG BIOSYNTHESIS | Genes involved in HS-GAG biosynthesis |
| 0.0 | 0.8 | REACTOME SIGNALING BY FGFR1 FUSION MUTANTS | Genes involved in Signaling by FGFR1 fusion mutants |
| 0.0 | 0.3 | REACTOME REGULATION OF ORNITHINE DECARBOXYLASE ODC | Genes involved in Regulation of ornithine decarboxylase (ODC) |
| 0.0 | 1.9 | REACTOME GLYCOSPHINGOLIPID METABOLISM | Genes involved in Glycosphingolipid metabolism |
| 0.0 | 3.3 | REACTOME ANTIVIRAL MECHANISM BY IFN STIMULATED GENES | Genes involved in Antiviral mechanism by IFN-stimulated genes |
| 0.0 | 1.3 | REACTOME TERMINATION OF O GLYCAN BIOSYNTHESIS | Genes involved in Termination of O-glycan biosynthesis |
| 0.0 | 1.7 | REACTOME LATENT INFECTION OF HOMO SAPIENS WITH MYCOBACTERIUM TUBERCULOSIS | Genes involved in Latent infection of Homo sapiens with Mycobacterium tuberculosis |
| 0.0 | 0.6 | REACTOME HYALURONAN UPTAKE AND DEGRADATION | Genes involved in Hyaluronan uptake and degradation |
| 0.0 | 0.7 | REACTOME CITRIC ACID CYCLE TCA CYCLE | Genes involved in Citric acid cycle (TCA cycle) |
| 0.0 | 1.6 | REACTOME MRNA SPLICING MINOR PATHWAY | Genes involved in mRNA Splicing - Minor Pathway |
| 0.0 | 1.4 | REACTOME RECYCLING PATHWAY OF L1 | Genes involved in Recycling pathway of L1 |
| 0.0 | 1.4 | REACTOME SPHINGOLIPID DE NOVO BIOSYNTHESIS | Genes involved in Sphingolipid de novo biosynthesis |
| 0.0 | 0.5 | REACTOME PASSIVE TRANSPORT BY AQUAPORINS | Genes involved in Passive Transport by Aquaporins |
| 0.0 | 0.4 | REACTOME AMINE COMPOUND SLC TRANSPORTERS | Genes involved in Amine compound SLC transporters |
| 0.0 | 0.5 | REACTOME BASE FREE SUGAR PHOSPHATE REMOVAL VIA THE SINGLE NUCLEOTIDE REPLACEMENT PATHWAY | Genes involved in Base-free sugar-phosphate removal via the single-nucleotide replacement pathway |
| 0.0 | 1.3 | REACTOME DOWNREGULATION OF SMAD2 3 SMAD4 TRANSCRIPTIONAL ACTIVITY | Genes involved in Downregulation of SMAD2/3:SMAD4 transcriptional activity |
| 0.0 | 0.4 | REACTOME RNA POL III CHAIN ELONGATION | Genes involved in RNA Polymerase III Chain Elongation |
| 0.0 | 1.4 | REACTOME TRANSPORT TO THE GOLGI AND SUBSEQUENT MODIFICATION | Genes involved in Transport to the Golgi and subsequent modification |
| 0.0 | 0.3 | REACTOME INHIBITION OF REPLICATION INITIATION OF DAMAGED DNA BY RB1 E2F1 | Genes involved in Inhibition of replication initiation of damaged DNA by RB1/E2F1 |
| 0.0 | 1.7 | REACTOME FORMATION OF THE TERNARY COMPLEX AND SUBSEQUENTLY THE 43S COMPLEX | Genes involved in Formation of the ternary complex, and subsequently, the 43S complex |
| 0.0 | 0.2 | REACTOME SYNTHESIS OF BILE ACIDS AND BILE SALTS VIA 7ALPHA HYDROXYCHOLESTEROL | Genes involved in Synthesis of bile acids and bile salts via 7alpha-hydroxycholesterol |
| 0.0 | 0.6 | REACTOME GAP JUNCTION ASSEMBLY | Genes involved in Gap junction assembly |
| 0.0 | 0.7 | REACTOME METABOLISM OF STEROID HORMONES AND VITAMINS A AND D | Genes involved in Metabolism of steroid hormones and vitamins A and D |
| 0.0 | 0.5 | REACTOME AMINE DERIVED HORMONES | Genes involved in Amine-derived hormones |
| 0.0 | 0.4 | REACTOME VITAMIN B5 PANTOTHENATE METABOLISM | Genes involved in Vitamin B5 (pantothenate) metabolism |
| 0.0 | 0.7 | REACTOME G0 AND EARLY G1 | Genes involved in G0 and Early G1 |
| 0.0 | 0.5 | REACTOME SYNTHESIS OF PE | Genes involved in Synthesis of PE |
| 0.0 | 0.4 | REACTOME MEIOTIC RECOMBINATION | Genes involved in Meiotic Recombination |
| 0.0 | 0.2 | REACTOME NEP NS2 INTERACTS WITH THE CELLULAR EXPORT MACHINERY | Genes involved in NEP/NS2 Interacts with the Cellular Export Machinery |
| 0.0 | 0.3 | REACTOME G2 M DNA DAMAGE CHECKPOINT | Genes involved in G2/M DNA damage checkpoint |
| 0.0 | 0.2 | REACTOME COPI MEDIATED TRANSPORT | Genes involved in COPI Mediated Transport |
| 0.0 | 0.8 | REACTOME PYRIMIDINE METABOLISM | Genes involved in Pyrimidine metabolism |
| 0.0 | 1.7 | REACTOME MHC CLASS II ANTIGEN PRESENTATION | Genes involved in MHC class II antigen presentation |
| 0.0 | 4.8 | REACTOME SIGNALING BY RHO GTPASES | Genes involved in Signaling by Rho GTPases |
| 0.0 | 1.6 | REACTOME PEPTIDE CHAIN ELONGATION | Genes involved in Peptide chain elongation |
| 0.0 | 1.1 | REACTOME METABOLISM OF VITAMINS AND COFACTORS | Genes involved in Metabolism of vitamins and cofactors |
| 0.0 | 0.6 | REACTOME INTERFERON SIGNALING | Genes involved in Interferon Signaling |
| 0.0 | 0.5 | REACTOME BASIGIN INTERACTIONS | Genes involved in Basigin interactions |
| 0.0 | 0.4 | REACTOME PERK REGULATED GENE EXPRESSION | Genes involved in PERK regulated gene expression |
| 0.0 | 0.6 | REACTOME O LINKED GLYCOSYLATION OF MUCINS | Genes involved in O-linked glycosylation of mucins |
| 0.0 | 0.1 | REACTOME NUCLEAR SIGNALING BY ERBB4 | Genes involved in Nuclear signaling by ERBB4 |
| 0.0 | 0.5 | REACTOME POST TRANSLATIONAL MODIFICATION SYNTHESIS OF GPI ANCHORED PROTEINS | Genes involved in Post-translational modification: synthesis of GPI-anchored proteins |
| 0.0 | 0.3 | REACTOME GLYCOGEN BREAKDOWN GLYCOGENOLYSIS | Genes involved in Glycogen breakdown (glycogenolysis) |