Project
Illumina Body Map 2 (GSE30611)
Navigation
Downloads
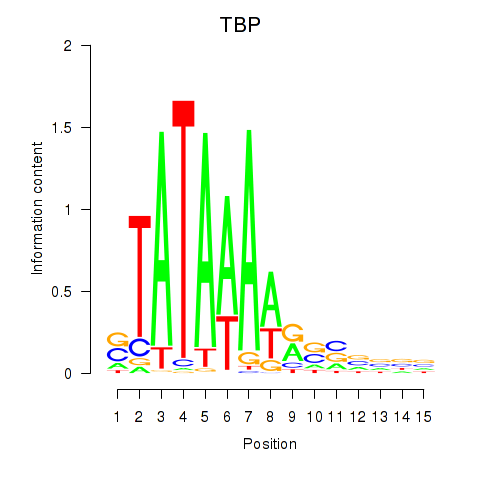
Results for TBP
Z-value: 3.31
Motif logo
Transcription factors associated with TBP
| Gene Symbol | Gene ID | Gene Info |
|---|---|---|
|
TBP
|
ENSG00000112592.14 | TATA-box binding protein |
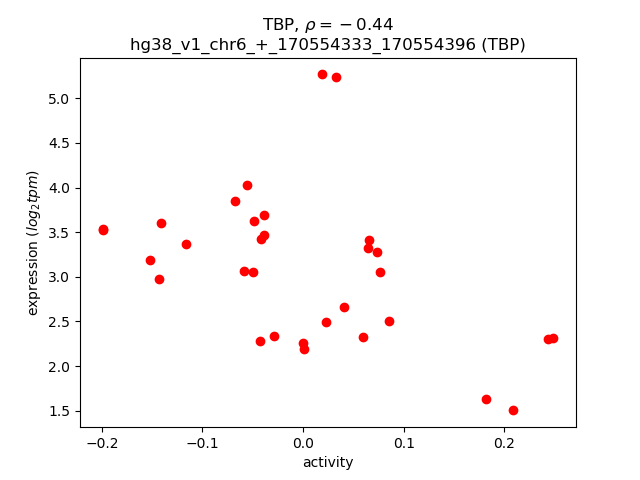
Activity-expression correlation:
| Gene | Promoter | Pearson corr. coef. | P-value | Plot |
|---|---|---|---|---|
| TBP | hg38_v1_chr6_+_170554333_170554396 | -0.44 | 1.1e-02 | Click! |
Activity profile of TBP motif
Sorted Z-values of TBP motif
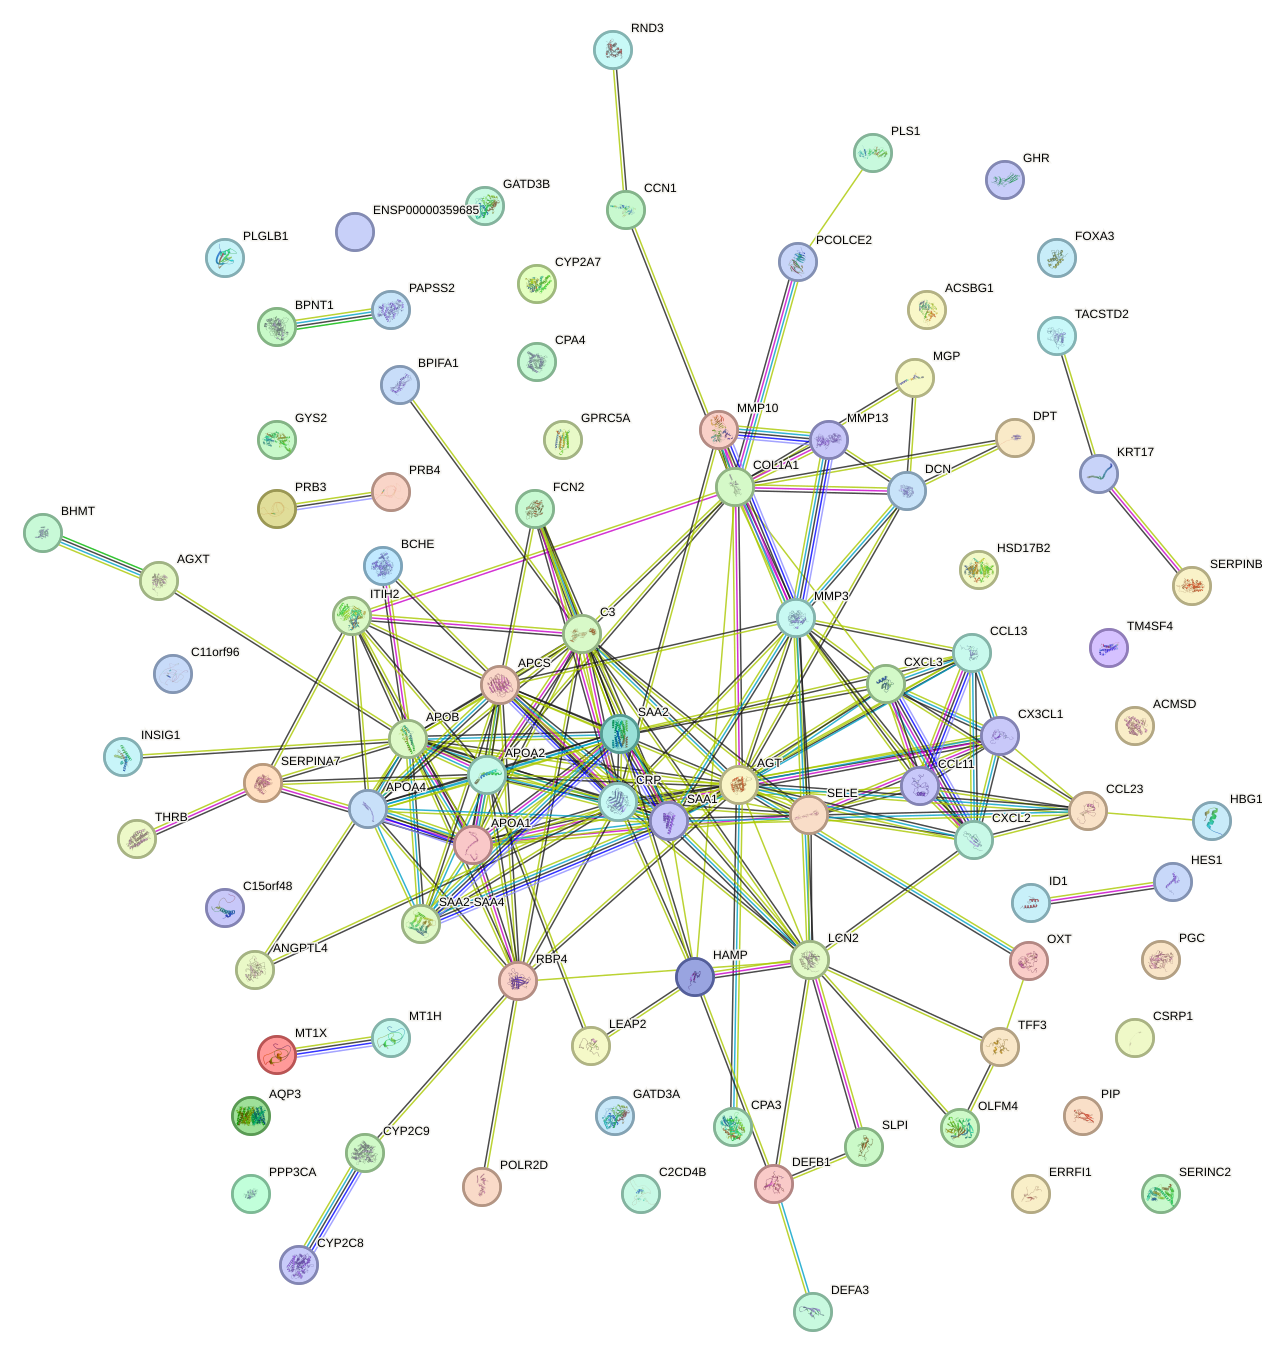
Network of associatons between targets according to the STRING database.
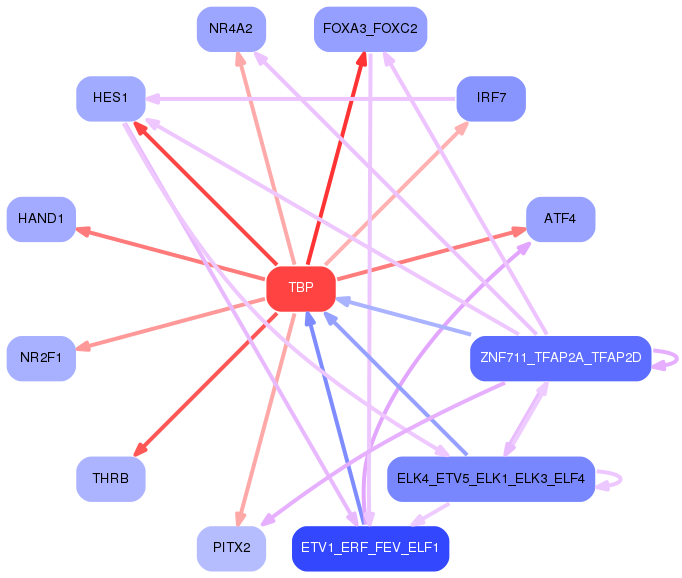
First level regulatory network of TBP
Gene Ontology Analysis
Gene overrepresentation in biological process category:
| Log-likelihood per target | Total log-likelihood | Term | Description |
|---|---|---|---|
| 7.7 | 23.2 | GO:1903015 | regulation of exo-alpha-sialidase activity(GO:1903015) |
| 3.5 | 10.5 | GO:0051041 | positive regulation of calcium-independent cell-cell adhesion(GO:0051041) |
| 3.5 | 17.3 | GO:0010903 | negative regulation of very-low-density lipoprotein particle remodeling(GO:0010903) |
| 3.3 | 9.9 | GO:0014016 | neuroblast differentiation(GO:0014016) |
| 2.8 | 11.2 | GO:0030185 | nitric oxide transport(GO:0030185) |
| 2.4 | 7.3 | GO:0006579 | amino-acid betaine catabolic process(GO:0006579) |
| 2.3 | 16.0 | GO:0048807 | female genitalia morphogenesis(GO:0048807) |
| 2.3 | 6.9 | GO:1990641 | response to iron ion starvation(GO:1990641) |
| 2.2 | 17.9 | GO:0034371 | chylomicron remodeling(GO:0034371) |
| 2.2 | 6.7 | GO:0000103 | sulfate assimilation(GO:0000103) |
| 2.2 | 6.6 | GO:0001794 | type IIa hypersensitivity(GO:0001794) regulation of type IIa hypersensitivity(GO:0001796) positive regulation of activation of membrane attack complex(GO:0001970) type II hypersensitivity(GO:0002445) regulation of type II hypersensitivity(GO:0002892) |
| 2.2 | 4.3 | GO:0090264 | immune complex clearance(GO:0002434) immune complex clearance by monocytes and macrophages(GO:0002436) regulation of immune complex clearance by monocytes and macrophages(GO:0090264) |
| 2.1 | 6.3 | GO:0007199 | G-protein coupled receptor signaling pathway coupled to cGMP nucleotide second messenger(GO:0007199) response to muscle activity involved in regulation of muscle adaptation(GO:0014873) |
| 2.1 | 2.1 | GO:0035378 | carbon dioxide transmembrane transport(GO:0035378) |
| 1.9 | 5.8 | GO:1900155 | regulation of bone trabecula formation(GO:1900154) negative regulation of bone trabecula formation(GO:1900155) |
| 1.9 | 20.7 | GO:0097267 | omega-hydroxylase P450 pathway(GO:0097267) |
| 1.7 | 5.2 | GO:0035425 | autocrine signaling(GO:0035425) |
| 1.6 | 7.9 | GO:0060474 | positive regulation of sperm motility involved in capacitation(GO:0060474) |
| 1.5 | 4.5 | GO:0042668 | auditory receptor cell fate determination(GO:0042668) negative regulation of auditory receptor cell differentiation(GO:0045608) regulation of timing of neuron differentiation(GO:0060164) negative regulation of pro-B cell differentiation(GO:2000974) |
| 1.4 | 4.3 | GO:0002125 | maternal aggressive behavior(GO:0002125) |
| 1.4 | 7.0 | GO:0010621 | negative regulation of transcription by transcription factor localization(GO:0010621) |
| 1.4 | 4.2 | GO:1901301 | regulation of cargo loading into COPII-coated vesicle(GO:1901301) |
| 1.3 | 5.3 | GO:0061394 | regulation of transcription from RNA polymerase II promoter in response to arsenic-containing substance(GO:0061394) |
| 1.3 | 4.0 | GO:1902688 | regulation of NAD metabolic process(GO:1902688) |
| 1.3 | 6.6 | GO:0015891 | iron chelate transport(GO:0015688) siderophore transport(GO:0015891) |
| 1.2 | 4.6 | GO:0044010 | biofilm formation(GO:0042710) single-species biofilm formation(GO:0044010) single-species biofilm formation in or on host organism(GO:0044407) regulation of single-species biofilm formation(GO:1900190) negative regulation of single-species biofilm formation(GO:1900191) regulation of single-species biofilm formation in or on host organism(GO:1900228) negative regulation of single-species biofilm formation in or on host organism(GO:1900229) |
| 1.1 | 8.0 | GO:0090191 | negative regulation of branching involved in ureteric bud morphogenesis(GO:0090191) |
| 1.1 | 11.5 | GO:0008050 | female courtship behavior(GO:0008050) |
| 1.1 | 4.5 | GO:0044691 | tooth eruption(GO:0044691) |
| 1.1 | 3.4 | GO:0051066 | dihydrobiopterin metabolic process(GO:0051066) |
| 1.1 | 3.3 | GO:0006589 | octopamine biosynthetic process(GO:0006589) homoiothermy(GO:0042309) octopamine metabolic process(GO:0046333) |
| 1.1 | 22.7 | GO:0006703 | estrogen biosynthetic process(GO:0006703) |
| 1.0 | 3.0 | GO:0060723 | spongiotrophoblast cell proliferation(GO:0060720) regulation of spongiotrophoblast cell proliferation(GO:0060721) cell proliferation involved in embryonic placenta development(GO:0060722) regulation of cell proliferation involved in embryonic placenta development(GO:0060723) |
| 1.0 | 3.0 | GO:0071676 | negative regulation of mononuclear cell migration(GO:0071676) |
| 1.0 | 2.9 | GO:0033861 | negative regulation of NAD(P)H oxidase activity(GO:0033861) negative regulation of respiratory burst involved in inflammatory response(GO:0060266) |
| 0.9 | 3.8 | GO:0070295 | renal water absorption(GO:0070295) |
| 0.9 | 4.6 | GO:0035962 | response to interleukin-13(GO:0035962) |
| 0.9 | 2.7 | GO:0003218 | cardiac left ventricle formation(GO:0003218) |
| 0.9 | 4.4 | GO:1902896 | terminal web assembly(GO:1902896) |
| 0.9 | 3.5 | GO:0002501 | peptide antigen assembly with MHC protein complex(GO:0002501) |
| 0.9 | 5.2 | GO:0002803 | positive regulation of antimicrobial peptide production(GO:0002225) positive regulation of antibacterial peptide production(GO:0002803) |
| 0.8 | 0.8 | GO:2000405 | negative regulation of T cell migration(GO:2000405) |
| 0.8 | 26.2 | GO:0071294 | cellular response to zinc ion(GO:0071294) |
| 0.8 | 69.6 | GO:0006953 | acute-phase response(GO:0006953) |
| 0.8 | 4.8 | GO:1904217 | regulation of CDP-diacylglycerol-serine O-phosphatidyltransferase activity(GO:1904217) positive regulation of CDP-diacylglycerol-serine O-phosphatidyltransferase activity(GO:1904219) positive regulation of serine C-palmitoyltransferase activity(GO:1904222) |
| 0.7 | 2.2 | GO:0000294 | nuclear-transcribed mRNA catabolic process, endonucleolytic cleavage-dependent decay(GO:0000294) regulation of miRNA catabolic process(GO:2000625) positive regulation of miRNA catabolic process(GO:2000627) |
| 0.7 | 2.2 | GO:0100012 | regulation of heart induction(GO:0090381) regulation of heart induction by canonical Wnt signaling pathway(GO:0100012) regulation of midbrain dopaminergic neuron differentiation(GO:1904956) |
| 0.7 | 2.2 | GO:0060279 | negative regulation of B cell differentiation(GO:0045578) positive regulation of ovulation(GO:0060279) |
| 0.7 | 6.7 | GO:0051005 | negative regulation of lipoprotein lipase activity(GO:0051005) |
| 0.6 | 1.9 | GO:1901492 | positive regulation of lymphangiogenesis(GO:1901492) |
| 0.6 | 5.7 | GO:0000255 | allantoin metabolic process(GO:0000255) |
| 0.6 | 0.6 | GO:0061033 | secretion by lung epithelial cell involved in lung growth(GO:0061033) |
| 0.6 | 8.6 | GO:0001887 | selenium compound metabolic process(GO:0001887) |
| 0.6 | 1.8 | GO:1903988 | spleen trabecula formation(GO:0060345) iron cation export(GO:1903414) ferrous iron export(GO:1903988) |
| 0.6 | 1.8 | GO:0090031 | positive regulation of steroid hormone biosynthetic process(GO:0090031) |
| 0.6 | 17.1 | GO:0015671 | oxygen transport(GO:0015671) |
| 0.6 | 2.3 | GO:0001897 | cytolysis by symbiont of host cells(GO:0001897) regulation of cytolysis in other organism(GO:0051710) cytolysis in other organism involved in symbiotic interaction(GO:0051801) |
| 0.6 | 6.9 | GO:2000334 | blood microparticle formation(GO:0072564) regulation of blood microparticle formation(GO:2000332) positive regulation of blood microparticle formation(GO:2000334) |
| 0.6 | 1.2 | GO:0042270 | protection from natural killer cell mediated cytotoxicity(GO:0042270) |
| 0.6 | 0.6 | GO:1904432 | positive regulation of iron ion transport(GO:0034758) positive regulation of iron ion transmembrane transport(GO:0034761) regulation of iron ion import(GO:1900390) regulation of ferrous iron import into cell(GO:1903989) positive regulation of ferrous iron import into cell(GO:1903991) regulation of ferrous iron binding(GO:1904432) positive regulation of ferrous iron binding(GO:1904434) regulation of transferrin receptor binding(GO:1904435) positive regulation of transferrin receptor binding(GO:1904437) regulation of ferrous iron import across plasma membrane(GO:1904438) positive regulation of ferrous iron import across plasma membrane(GO:1904440) |
| 0.6 | 6.1 | GO:0043589 | skin morphogenesis(GO:0043589) |
| 0.5 | 6.0 | GO:0043654 | recognition of apoptotic cell(GO:0043654) |
| 0.5 | 1.6 | GO:0097029 | mature conventional dendritic cell differentiation(GO:0097029) |
| 0.5 | 24.1 | GO:0019731 | antibacterial humoral response(GO:0019731) |
| 0.5 | 1.6 | GO:0042489 | negative regulation of odontogenesis of dentin-containing tooth(GO:0042489) |
| 0.5 | 5.2 | GO:0061624 | fructose catabolic process(GO:0006001) fructose catabolic process to hydroxyacetone phosphate and glyceraldehyde-3-phosphate(GO:0061624) |
| 0.5 | 2.0 | GO:0002541 | activation of plasma proteins involved in acute inflammatory response(GO:0002541) |
| 0.5 | 8.2 | GO:0019373 | epoxygenase P450 pathway(GO:0019373) |
| 0.5 | 2.6 | GO:0072144 | glomerular mesangial cell development(GO:0072144) |
| 0.5 | 5.0 | GO:1902527 | positive regulation of intrinsic apoptotic signaling pathway by p53 class mediator(GO:1902255) positive regulation of protein monoubiquitination(GO:1902527) |
| 0.5 | 2.0 | GO:0018153 | isopeptide cross-linking via N6-(L-isoglutamyl)-L-lysine(GO:0018153) isopeptide cross-linking(GO:0018262) |
| 0.5 | 2.5 | GO:0022614 | membrane to membrane docking(GO:0022614) |
| 0.5 | 1.9 | GO:0051795 | positive regulation of catagen(GO:0051795) |
| 0.5 | 13.9 | GO:0090023 | positive regulation of neutrophil chemotaxis(GO:0090023) positive regulation of neutrophil migration(GO:1902624) |
| 0.5 | 3.8 | GO:0010727 | negative regulation of hydrogen peroxide metabolic process(GO:0010727) |
| 0.5 | 11.8 | GO:0051798 | positive regulation of hair follicle development(GO:0051798) |
| 0.5 | 7.0 | GO:2000389 | regulation of neutrophil extravasation(GO:2000389) |
| 0.4 | 1.7 | GO:0018277 | protein deamination(GO:0018277) |
| 0.4 | 2.6 | GO:0035948 | positive regulation of gluconeogenesis by positive regulation of transcription from RNA polymerase II promoter(GO:0035948) |
| 0.4 | 1.2 | GO:0060127 | subthalamic nucleus development(GO:0021763) prolactin secreting cell differentiation(GO:0060127) superior vena cava morphogenesis(GO:0060578) |
| 0.4 | 6.0 | GO:0070327 | thyroid hormone transport(GO:0070327) |
| 0.4 | 2.4 | GO:0001692 | histamine metabolic process(GO:0001692) |
| 0.4 | 1.1 | GO:1900135 | positive regulation of renin secretion into blood stream(GO:1900135) |
| 0.4 | 2.2 | GO:0099640 | axo-dendritic protein transport(GO:0099640) |
| 0.4 | 7.4 | GO:0007175 | negative regulation of epidermal growth factor-activated receptor activity(GO:0007175) |
| 0.3 | 1.0 | GO:0032917 | polyamine acetylation(GO:0032917) spermidine acetylation(GO:0032918) |
| 0.3 | 1.7 | GO:0035106 | operant conditioning(GO:0035106) |
| 0.3 | 2.7 | GO:1902998 | regulation of neuronal signal transduction(GO:1902847) positive regulation of neurofibrillary tangle assembly(GO:1902998) |
| 0.3 | 4.9 | GO:0045842 | positive regulation of mitotic metaphase/anaphase transition(GO:0045842) positive regulation of mitotic sister chromatid separation(GO:1901970) positive regulation of metaphase/anaphase transition of cell cycle(GO:1902101) |
| 0.3 | 5.1 | GO:0043587 | tongue morphogenesis(GO:0043587) |
| 0.3 | 2.7 | GO:0097577 | intracellular sequestering of iron ion(GO:0006880) sequestering of iron ion(GO:0097577) |
| 0.3 | 1.2 | GO:0046968 | peptide antigen transport(GO:0046968) |
| 0.3 | 1.2 | GO:0021538 | epithalamus development(GO:0021538) habenula development(GO:0021986) |
| 0.3 | 1.7 | GO:2000860 | positive regulation of mineralocorticoid secretion(GO:2000857) positive regulation of aldosterone secretion(GO:2000860) |
| 0.3 | 3.4 | GO:0019441 | tryptophan catabolic process to kynurenine(GO:0019441) |
| 0.3 | 1.1 | GO:0036414 | protein citrullination(GO:0018101) histone citrullination(GO:0036414) |
| 0.3 | 0.5 | GO:0034395 | regulation of transcription from RNA polymerase II promoter in response to iron(GO:0034395) |
| 0.3 | 3.7 | GO:1905232 | cellular response to L-glutamate(GO:1905232) |
| 0.3 | 8.4 | GO:0050901 | leukocyte tethering or rolling(GO:0050901) |
| 0.3 | 3.6 | GO:0044130 | negative regulation of growth of symbiont in host(GO:0044130) negative regulation of growth of symbiont involved in interaction with host(GO:0044146) |
| 0.3 | 1.0 | GO:0010430 | fatty acid omega-oxidation(GO:0010430) |
| 0.3 | 3.0 | GO:0046813 | receptor-mediated virion attachment to host cell(GO:0046813) |
| 0.3 | 0.8 | GO:0051039 | histone displacement(GO:0001207) positive regulation of transcription involved in meiotic cell cycle(GO:0051039) |
| 0.2 | 10.4 | GO:0001580 | detection of chemical stimulus involved in sensory perception of bitter taste(GO:0001580) |
| 0.2 | 1.7 | GO:0034124 | regulation of MyD88-dependent toll-like receptor signaling pathway(GO:0034124) |
| 0.2 | 4.5 | GO:0006957 | complement activation, alternative pathway(GO:0006957) |
| 0.2 | 12.4 | GO:0048247 | lymphocyte chemotaxis(GO:0048247) |
| 0.2 | 0.7 | GO:0048058 | compound eye corneal lens development(GO:0048058) |
| 0.2 | 2.3 | GO:0036343 | psychomotor behavior(GO:0036343) |
| 0.2 | 4.3 | GO:1900747 | negative regulation of vascular endothelial growth factor signaling pathway(GO:1900747) |
| 0.2 | 5.5 | GO:1900745 | positive regulation of p38MAPK cascade(GO:1900745) |
| 0.2 | 2.6 | GO:0030643 | cellular phosphate ion homeostasis(GO:0030643) cellular trivalent inorganic anion homeostasis(GO:0072502) |
| 0.2 | 5.2 | GO:0002003 | angiotensin maturation(GO:0002003) |
| 0.2 | 1.9 | GO:0070236 | negative regulation of activation-induced cell death of T cells(GO:0070236) |
| 0.2 | 3.6 | GO:0015939 | pantothenate metabolic process(GO:0015939) |
| 0.2 | 0.4 | GO:0010897 | negative regulation of triglyceride catabolic process(GO:0010897) |
| 0.2 | 3.3 | GO:0006032 | chitin metabolic process(GO:0006030) chitin catabolic process(GO:0006032) |
| 0.2 | 0.8 | GO:0060455 | negative regulation of gastric acid secretion(GO:0060455) |
| 0.2 | 1.9 | GO:2000271 | positive regulation of fibroblast apoptotic process(GO:2000271) |
| 0.2 | 1.7 | GO:0061737 | leukotriene signaling pathway(GO:0061737) |
| 0.2 | 1.1 | GO:0060298 | positive regulation of sarcomere organization(GO:0060298) |
| 0.2 | 4.6 | GO:0030277 | maintenance of gastrointestinal epithelium(GO:0030277) |
| 0.2 | 12.0 | GO:0030212 | hyaluronan metabolic process(GO:0030212) |
| 0.2 | 0.3 | GO:0071288 | cellular response to mercury ion(GO:0071288) |
| 0.2 | 0.7 | GO:0006566 | threonine metabolic process(GO:0006566) |
| 0.2 | 3.5 | GO:0003417 | growth plate cartilage development(GO:0003417) |
| 0.1 | 0.4 | GO:0036388 | pre-replicative complex assembly involved in nuclear cell cycle DNA replication(GO:0006267) pre-replicative complex assembly(GO:0036388) pre-replicative complex assembly involved in cell cycle DNA replication(GO:1902299) |
| 0.1 | 5.8 | GO:0010667 | negative regulation of cardiac muscle cell apoptotic process(GO:0010667) |
| 0.1 | 0.8 | GO:0090206 | negative regulation of cholesterol biosynthetic process(GO:0045541) negative regulation of cholesterol metabolic process(GO:0090206) |
| 0.1 | 0.4 | GO:0001992 | regulation of systemic arterial blood pressure by vasopressin(GO:0001992) |
| 0.1 | 1.4 | GO:0071421 | manganese ion transmembrane transport(GO:0071421) |
| 0.1 | 3.9 | GO:0001502 | cartilage condensation(GO:0001502) |
| 0.1 | 1.3 | GO:0050703 | interleukin-1 alpha secretion(GO:0050703) |
| 0.1 | 8.5 | GO:0050829 | defense response to Gram-negative bacterium(GO:0050829) |
| 0.1 | 0.7 | GO:1900042 | positive regulation of interleukin-2 secretion(GO:1900042) |
| 0.1 | 0.3 | GO:0001978 | regulation of systemic arterial blood pressure by carotid sinus baroreceptor feedback(GO:0001978) baroreceptor response to increased systemic arterial blood pressure(GO:0001983) |
| 0.1 | 0.2 | GO:0036496 | regulation of translational initiation by eIF2 alpha dephosphorylation(GO:0036496) |
| 0.1 | 1.4 | GO:0016554 | cytidine to uridine editing(GO:0016554) |
| 0.1 | 1.4 | GO:0006537 | glutamate biosynthetic process(GO:0006537) |
| 0.1 | 1.0 | GO:0035986 | senescence-associated heterochromatin focus assembly(GO:0035986) |
| 0.1 | 1.3 | GO:0046125 | thymidine metabolic process(GO:0046104) pyrimidine deoxyribonucleoside metabolic process(GO:0046125) |
| 0.1 | 3.6 | GO:0030728 | ovulation(GO:0030728) |
| 0.1 | 0.9 | GO:0030263 | apoptotic chromosome condensation(GO:0030263) |
| 0.1 | 9.6 | GO:0042246 | tissue regeneration(GO:0042246) |
| 0.1 | 0.3 | GO:0060032 | notochord regression(GO:0060032) |
| 0.1 | 4.3 | GO:0070884 | regulation of calcineurin-NFAT signaling cascade(GO:0070884) |
| 0.1 | 0.5 | GO:0010269 | response to selenium ion(GO:0010269) |
| 0.1 | 1.8 | GO:0061000 | negative regulation of dendritic spine development(GO:0061000) |
| 0.1 | 1.0 | GO:1904948 | midbrain dopaminergic neuron differentiation(GO:1904948) |
| 0.1 | 4.3 | GO:0050873 | brown fat cell differentiation(GO:0050873) |
| 0.1 | 12.3 | GO:0070268 | cornification(GO:0070268) |
| 0.1 | 0.2 | GO:0021524 | visceral motor neuron differentiation(GO:0021524) |
| 0.1 | 1.3 | GO:0039536 | negative regulation of RIG-I signaling pathway(GO:0039536) |
| 0.1 | 1.1 | GO:0006776 | vitamin A metabolic process(GO:0006776) |
| 0.1 | 7.2 | GO:0005978 | glycogen biosynthetic process(GO:0005978) glucan biosynthetic process(GO:0009250) |
| 0.1 | 5.1 | GO:0031424 | keratinization(GO:0031424) |
| 0.1 | 0.3 | GO:0032667 | interleukin-23 production(GO:0032627) regulation of interleukin-23 production(GO:0032667) positive regulation of interleukin-23 production(GO:0032747) |
| 0.1 | 0.9 | GO:0048251 | elastic fiber assembly(GO:0048251) |
| 0.1 | 0.3 | GO:0035585 | calcium-mediated signaling using extracellular calcium source(GO:0035585) |
| 0.1 | 0.7 | GO:0050957 | equilibrioception(GO:0050957) |
| 0.1 | 0.2 | GO:1901420 | negative regulation of vitamin D receptor signaling pathway(GO:0070563) negative regulation of response to alcohol(GO:1901420) |
| 0.1 | 1.3 | GO:0034587 | piRNA metabolic process(GO:0034587) |
| 0.1 | 1.9 | GO:0031629 | synaptic vesicle fusion to presynaptic active zone membrane(GO:0031629) vesicle fusion to plasma membrane(GO:0099500) |
| 0.1 | 0.5 | GO:0070365 | hepatocyte differentiation(GO:0070365) |
| 0.1 | 5.0 | GO:0048791 | calcium ion-regulated exocytosis of neurotransmitter(GO:0048791) |
| 0.1 | 1.7 | GO:0030199 | collagen fibril organization(GO:0030199) |
| 0.1 | 0.5 | GO:0097012 | cellular response to granulocyte macrophage colony-stimulating factor stimulus(GO:0097011) response to granulocyte macrophage colony-stimulating factor(GO:0097012) |
| 0.1 | 0.2 | GO:0090131 | mesenchyme migration(GO:0090131) |
| 0.1 | 4.9 | GO:0030574 | collagen catabolic process(GO:0030574) |
| 0.1 | 0.2 | GO:0006106 | fumarate metabolic process(GO:0006106) glycerol biosynthetic process(GO:0006114) aspartate biosynthetic process(GO:0006532) aspartate catabolic process(GO:0006533) |
| 0.1 | 0.2 | GO:0045065 | cytotoxic T cell differentiation(GO:0045065) |
| 0.0 | 0.0 | GO:0001831 | trophectodermal cellular morphogenesis(GO:0001831) proximal/distal axis specification(GO:0009946) |
| 0.0 | 1.8 | GO:0019730 | antimicrobial humoral response(GO:0019730) |
| 0.0 | 0.3 | GO:0006102 | isocitrate metabolic process(GO:0006102) response to isolation stress(GO:0035900) |
| 0.0 | 0.6 | GO:2001288 | positive regulation of caveolin-mediated endocytosis(GO:2001288) |
| 0.0 | 0.6 | GO:0032071 | regulation of endodeoxyribonuclease activity(GO:0032071) |
| 0.0 | 4.1 | GO:0007585 | respiratory gaseous exchange(GO:0007585) |
| 0.0 | 0.5 | GO:1900121 | negative regulation of receptor binding(GO:1900121) |
| 0.0 | 3.6 | GO:0001895 | retina homeostasis(GO:0001895) |
| 0.0 | 0.6 | GO:0030903 | notochord development(GO:0030903) |
| 0.0 | 2.4 | GO:0034314 | Arp2/3 complex-mediated actin nucleation(GO:0034314) |
| 0.0 | 0.6 | GO:0048672 | positive regulation of collateral sprouting(GO:0048672) |
| 0.0 | 0.3 | GO:0060988 | lipid tube assembly(GO:0060988) |
| 0.0 | 0.2 | GO:0038031 | non-canonical Wnt signaling pathway via MAPK cascade(GO:0038030) non-canonical Wnt signaling pathway via JNK cascade(GO:0038031) |
| 0.0 | 1.3 | GO:1901687 | glutathione derivative metabolic process(GO:1901685) glutathione derivative biosynthetic process(GO:1901687) |
| 0.0 | 3.2 | GO:0010761 | fibroblast migration(GO:0010761) |
| 0.0 | 0.2 | GO:0015853 | adenine transport(GO:0015853) |
| 0.0 | 1.3 | GO:1900153 | regulation of nuclear-transcribed mRNA catabolic process, deadenylation-dependent decay(GO:1900151) positive regulation of nuclear-transcribed mRNA catabolic process, deadenylation-dependent decay(GO:1900153) |
| 0.0 | 5.6 | GO:0010811 | positive regulation of cell-substrate adhesion(GO:0010811) |
| 0.0 | 3.2 | GO:0016266 | O-glycan processing(GO:0016266) |
| 0.0 | 0.8 | GO:0000028 | ribosomal small subunit assembly(GO:0000028) |
| 0.0 | 0.3 | GO:1900165 | negative regulation of interleukin-6 secretion(GO:1900165) |
| 0.0 | 0.7 | GO:0006123 | mitochondrial electron transport, cytochrome c to oxygen(GO:0006123) |
| 0.0 | 1.5 | GO:0051496 | positive regulation of stress fiber assembly(GO:0051496) |
| 0.0 | 1.2 | GO:0060325 | face morphogenesis(GO:0060325) |
| 0.0 | 0.6 | GO:0051290 | protein heterotetramerization(GO:0051290) |
| 0.0 | 0.6 | GO:0003334 | keratinocyte development(GO:0003334) |
| 0.0 | 1.0 | GO:0000027 | ribosomal large subunit assembly(GO:0000027) |
| 0.0 | 0.3 | GO:0010668 | ectodermal cell differentiation(GO:0010668) |
| 0.0 | 0.7 | GO:2000272 | negative regulation of receptor activity(GO:2000272) |
| 0.0 | 0.2 | GO:0061590 | calcium activated phospholipid scrambling(GO:0061588) calcium activated phosphatidylcholine scrambling(GO:0061590) calcium activated galactosylceramide scrambling(GO:0061591) |
| 0.0 | 0.7 | GO:0009648 | photoperiodism(GO:0009648) |
| 0.0 | 0.4 | GO:0071243 | cellular response to arsenic-containing substance(GO:0071243) |
| 0.0 | 2.4 | GO:0030449 | regulation of complement activation(GO:0030449) |
| 0.0 | 0.8 | GO:0034694 | response to prostaglandin(GO:0034694) |
| 0.0 | 0.7 | GO:0039703 | viral RNA genome replication(GO:0039694) RNA replication(GO:0039703) |
| 0.0 | 0.1 | GO:0060356 | leucine import(GO:0060356) |
| 0.0 | 1.4 | GO:0097031 | NADH dehydrogenase complex assembly(GO:0010257) mitochondrial respiratory chain complex I assembly(GO:0032981) mitochondrial respiratory chain complex I biogenesis(GO:0097031) |
| 0.0 | 0.1 | GO:0035519 | protein K29-linked ubiquitination(GO:0035519) |
| 0.0 | 0.9 | GO:0006198 | cAMP catabolic process(GO:0006198) |
| 0.0 | 0.3 | GO:0007076 | mitotic chromosome condensation(GO:0007076) |
| 0.0 | 0.3 | GO:0042744 | hydrogen peroxide catabolic process(GO:0042744) |
| 0.0 | 1.4 | GO:1902017 | regulation of cilium assembly(GO:1902017) |
| 0.0 | 0.2 | GO:1904936 | cerebral cortex GABAergic interneuron migration(GO:0021853) cerebral cortex GABAergic interneuron development(GO:0021894) interneuron migration(GO:1904936) |
| 0.0 | 1.3 | GO:0002181 | cytoplasmic translation(GO:0002181) |
| 0.0 | 0.2 | GO:0006228 | UTP biosynthetic process(GO:0006228) |
| 0.0 | 1.0 | GO:0006614 | SRP-dependent cotranslational protein targeting to membrane(GO:0006614) |
| 0.0 | 0.4 | GO:0006783 | heme biosynthetic process(GO:0006783) |
| 0.0 | 2.9 | GO:0001678 | cellular glucose homeostasis(GO:0001678) |
| 0.0 | 0.1 | GO:0030261 | chromosome condensation(GO:0030261) |
| 0.0 | 0.3 | GO:0045671 | negative regulation of osteoclast differentiation(GO:0045671) |
| 0.0 | 0.0 | GO:1900158 | negative regulation of chondrocyte development(GO:0061182) regulation of bone mineralization involved in bone maturation(GO:1900157) negative regulation of bone mineralization involved in bone maturation(GO:1900158) |
| 0.0 | 2.4 | GO:0010952 | positive regulation of peptidase activity(GO:0010952) |
| 0.0 | 0.2 | GO:0018298 | protein-chromophore linkage(GO:0018298) |
| 0.0 | 0.9 | GO:0000381 | regulation of alternative mRNA splicing, via spliceosome(GO:0000381) |
| 0.0 | 0.2 | GO:0032897 | negative regulation of viral transcription(GO:0032897) |
| 0.0 | 1.1 | GO:0031295 | T cell costimulation(GO:0031295) |
| 0.0 | 0.1 | GO:0006348 | chromatin silencing at telomere(GO:0006348) |
Gene overrepresentation in cellular component category:
| Log-likelihood per target | Total log-likelihood | Term | Description |
|---|---|---|---|
| 2.8 | 11.2 | GO:0031838 | haptoglobin-hemoglobin complex(GO:0031838) |
| 2.1 | 16.8 | GO:0034363 | intermediate-density lipoprotein particle(GO:0034363) |
| 1.9 | 5.7 | GO:0070195 | growth hormone receptor complex(GO:0070195) |
| 1.8 | 5.3 | GO:1990617 | CHOP-ATF4 complex(GO:1990617) |
| 1.7 | 79.3 | GO:0034364 | high-density lipoprotein particle(GO:0034364) |
| 1.6 | 7.9 | GO:1990742 | microvesicle(GO:1990742) |
| 1.5 | 4.5 | GO:0005584 | collagen type I trimer(GO:0005584) |
| 1.2 | 17.1 | GO:0005833 | hemoglobin complex(GO:0005833) |
| 0.8 | 4.2 | GO:0032937 | SREBP-SCAP-Insig complex(GO:0032937) |
| 0.7 | 4.4 | GO:1990357 | terminal web(GO:1990357) |
| 0.7 | 2.2 | GO:0043512 | inhibin complex(GO:0043511) inhibin A complex(GO:0043512) |
| 0.7 | 2.7 | GO:0070288 | intracellular ferritin complex(GO:0008043) ferritin complex(GO:0070288) |
| 0.5 | 9.9 | GO:0005641 | nuclear envelope lumen(GO:0005641) |
| 0.5 | 1.9 | GO:0034677 | integrin alpha7-beta1 complex(GO:0034677) |
| 0.5 | 4.2 | GO:0016012 | sarcoglycan complex(GO:0016012) |
| 0.4 | 3.5 | GO:0042824 | MHC class I peptide loading complex(GO:0042824) |
| 0.4 | 8.0 | GO:0031089 | platelet dense granule lumen(GO:0031089) |
| 0.4 | 2.6 | GO:0030485 | smooth muscle contractile fiber(GO:0030485) |
| 0.3 | 1.4 | GO:0030895 | apolipoprotein B mRNA editing enzyme complex(GO:0030895) |
| 0.3 | 6.9 | GO:0045179 | apical cortex(GO:0045179) |
| 0.3 | 4.3 | GO:0005589 | collagen type VI trimer(GO:0005589) collagen beaded filament(GO:0098647) |
| 0.3 | 6.8 | GO:0042589 | zymogen granule membrane(GO:0042589) |
| 0.3 | 3.0 | GO:0005610 | laminin-5 complex(GO:0005610) |
| 0.3 | 4.1 | GO:0097208 | alveolar lamellar body(GO:0097208) |
| 0.3 | 1.7 | GO:0044753 | amphisome(GO:0044753) |
| 0.3 | 1.3 | GO:0036501 | UFD1-NPL4 complex(GO:0036501) |
| 0.2 | 24.8 | GO:0035580 | specific granule lumen(GO:0035580) |
| 0.2 | 2.1 | GO:0005579 | membrane attack complex(GO:0005579) |
| 0.2 | 56.5 | GO:0072562 | blood microparticle(GO:0072562) |
| 0.2 | 2.2 | GO:0042406 | extrinsic component of endoplasmic reticulum membrane(GO:0042406) |
| 0.2 | 3.0 | GO:0042584 | chromaffin granule membrane(GO:0042584) |
| 0.2 | 16.1 | GO:0045095 | keratin filament(GO:0045095) |
| 0.2 | 2.0 | GO:0032593 | insulin-responsive compartment(GO:0032593) |
| 0.2 | 5.6 | GO:0005614 | interstitial matrix(GO:0005614) |
| 0.1 | 6.9 | GO:0031092 | platelet alpha granule membrane(GO:0031092) |
| 0.1 | 0.4 | GO:0005656 | nuclear pre-replicative complex(GO:0005656) pre-replicative complex(GO:0036387) |
| 0.1 | 4.9 | GO:0005680 | anaphase-promoting complex(GO:0005680) |
| 0.1 | 1.4 | GO:0030061 | mitochondrial crista(GO:0030061) |
| 0.1 | 8.0 | GO:0009925 | basal plasma membrane(GO:0009925) |
| 0.1 | 0.2 | GO:0070701 | mucus layer(GO:0070701) |
| 0.1 | 1.0 | GO:0035985 | senescence-associated heterochromatin focus(GO:0035985) |
| 0.1 | 5.2 | GO:0034451 | centriolar satellite(GO:0034451) |
| 0.1 | 4.4 | GO:0044322 | endoplasmic reticulum quality control compartment(GO:0044322) |
| 0.1 | 0.7 | GO:0070876 | SOSS complex(GO:0070876) |
| 0.1 | 2.4 | GO:0005885 | Arp2/3 protein complex(GO:0005885) |
| 0.1 | 13.3 | GO:0035578 | azurophil granule lumen(GO:0035578) |
| 0.1 | 0.8 | GO:0043196 | varicosity(GO:0043196) |
| 0.1 | 0.6 | GO:0005971 | ribonucleoside-diphosphate reductase complex(GO:0005971) |
| 0.1 | 152.6 | GO:0005615 | extracellular space(GO:0005615) |
| 0.1 | 2.4 | GO:0031093 | platelet alpha granule lumen(GO:0031093) |
| 0.1 | 0.9 | GO:0043205 | microfibril(GO:0001527) fibril(GO:0043205) |
| 0.1 | 2.6 | GO:0005921 | gap junction(GO:0005921) |
| 0.1 | 1.1 | GO:0042613 | MHC class II protein complex(GO:0042613) |
| 0.1 | 0.2 | GO:0071817 | MMXD complex(GO:0071817) |
| 0.0 | 3.9 | GO:0035577 | azurophil granule membrane(GO:0035577) |
| 0.0 | 2.4 | GO:0001533 | cornified envelope(GO:0001533) |
| 0.0 | 0.7 | GO:0045275 | mitochondrial respiratory chain complex III(GO:0005750) respiratory chain complex III(GO:0045275) |
| 0.0 | 11.0 | GO:0005578 | proteinaceous extracellular matrix(GO:0005578) |
| 0.0 | 3.4 | GO:0043198 | dendritic shaft(GO:0043198) |
| 0.0 | 0.9 | GO:0005686 | U2 snRNP(GO:0005686) |
| 0.0 | 3.9 | GO:0005882 | intermediate filament(GO:0005882) |
| 0.0 | 4.3 | GO:0030864 | cortical actin cytoskeleton(GO:0030864) |
| 0.0 | 0.3 | GO:1990745 | EARP complex(GO:1990745) |
| 0.0 | 1.7 | GO:0001772 | immunological synapse(GO:0001772) |
| 0.0 | 1.8 | GO:0031201 | SNARE complex(GO:0031201) |
| 0.0 | 1.1 | GO:0005796 | Golgi lumen(GO:0005796) |
| 0.0 | 0.6 | GO:0031616 | spindle pole centrosome(GO:0031616) |
| 0.0 | 0.7 | GO:0010369 | chromocenter(GO:0010369) |
| 0.0 | 3.3 | GO:0005814 | centriole(GO:0005814) |
| 0.0 | 1.4 | GO:0022627 | cytosolic small ribosomal subunit(GO:0022627) |
| 0.0 | 2.0 | GO:0022625 | cytosolic large ribosomal subunit(GO:0022625) |
| 0.0 | 2.0 | GO:0000313 | organellar ribosome(GO:0000313) mitochondrial ribosome(GO:0005761) |
| 0.0 | 13.9 | GO:0048471 | perinuclear region of cytoplasm(GO:0048471) |
| 0.0 | 1.6 | GO:0001750 | photoreceptor outer segment(GO:0001750) |
| 0.0 | 20.8 | GO:0005789 | endoplasmic reticulum membrane(GO:0005789) |
| 0.0 | 0.7 | GO:0002102 | podosome(GO:0002102) |
| 0.0 | 0.3 | GO:1990454 | L-type voltage-gated calcium channel complex(GO:1990454) |
| 0.0 | 8.3 | GO:0005925 | focal adhesion(GO:0005925) |
| 0.0 | 0.7 | GO:0030286 | dynein complex(GO:0030286) |
Gene overrepresentation in molecular function category:
| Log-likelihood per target | Total log-likelihood | Term | Description |
|---|---|---|---|
| 5.0 | 20.0 | GO:0033265 | choline binding(GO:0033265) |
| 4.7 | 23.6 | GO:0047006 | 17-alpha,20-alpha-dihydroxypregn-4-en-3-one dehydrogenase activity(GO:0047006) |
| 3.6 | 18.0 | GO:0033695 | oxidoreductase activity, acting on CH or CH2 groups, quinone or similar compound as acceptor(GO:0033695) caffeine oxidase activity(GO:0034875) |
| 3.5 | 10.5 | GO:0031737 | CX3C chemokine receptor binding(GO:0031737) |
| 3.5 | 17.3 | GO:0070653 | high-density lipoprotein particle receptor binding(GO:0070653) |
| 3.3 | 26.7 | GO:0001849 | complement component C1q binding(GO:0001849) |
| 2.2 | 6.6 | GO:0035375 | zymogen binding(GO:0035375) |
| 2.0 | 7.9 | GO:0031731 | CCR6 chemokine receptor binding(GO:0031731) |
| 1.9 | 9.7 | GO:0031726 | CCR1 chemokine receptor binding(GO:0031726) |
| 1.5 | 10.8 | GO:0030492 | hemoglobin binding(GO:0030492) |
| 1.5 | 12.1 | GO:0035473 | lipase binding(GO:0035473) |
| 1.3 | 11.8 | GO:0042289 | MHC class II protein binding(GO:0042289) |
| 1.3 | 5.2 | GO:0061609 | fructose-1-phosphate aldolase activity(GO:0061609) |
| 1.2 | 58.8 | GO:0042056 | chemoattractant activity(GO:0042056) |
| 1.1 | 3.3 | GO:0004500 | dopamine beta-monooxygenase activity(GO:0004500) |
| 1.1 | 4.3 | GO:0031727 | CCR2 chemokine receptor binding(GO:0031727) |
| 1.0 | 15.5 | GO:0045236 | CXCR chemokine receptor binding(GO:0045236) |
| 1.0 | 6.2 | GO:0060228 | phosphatidylcholine-sterol O-acyltransferase activator activity(GO:0060228) |
| 0.9 | 7.3 | GO:0008172 | S-methyltransferase activity(GO:0008172) |
| 0.9 | 3.6 | GO:0017159 | pantetheine hydrolase activity(GO:0017159) |
| 0.9 | 17.4 | GO:0005344 | oxygen transporter activity(GO:0005344) |
| 0.9 | 18.8 | GO:0019841 | retinol binding(GO:0019841) |
| 0.8 | 4.2 | GO:0031728 | CCR3 chemokine receptor binding(GO:0031728) |
| 0.7 | 2.1 | GO:0035379 | carbon dioxide transmembrane transporter activity(GO:0035379) |
| 0.7 | 1.4 | GO:0016639 | oxidoreductase activity, acting on the CH-NH2 group of donors, NAD or NADP as acceptor(GO:0016639) |
| 0.6 | 1.8 | GO:0097689 | iron channel activity(GO:0097689) |
| 0.6 | 6.9 | GO:0070892 | lipoteichoic acid receptor activity(GO:0070892) |
| 0.6 | 10.8 | GO:0008391 | arachidonic acid monooxygenase activity(GO:0008391) arachidonic acid epoxygenase activity(GO:0008392) |
| 0.6 | 2.2 | GO:0008426 | protein kinase C inhibitor activity(GO:0008426) |
| 0.5 | 1.6 | GO:0008903 | hydroxypyruvate isomerase activity(GO:0008903) |
| 0.5 | 11.5 | GO:0070324 | thyroid hormone binding(GO:0070324) |
| 0.5 | 3.8 | GO:0015254 | glycerol channel activity(GO:0015254) |
| 0.5 | 1.6 | GO:0016497 | substance K receptor activity(GO:0016497) |
| 0.5 | 6.1 | GO:0035251 | UDP-glucosyltransferase activity(GO:0035251) |
| 0.5 | 7.1 | GO:0033691 | sialic acid binding(GO:0033691) |
| 0.5 | 4.3 | GO:0008597 | calcium-dependent protein serine/threonine phosphatase regulator activity(GO:0008597) |
| 0.5 | 8.5 | GO:0019864 | IgG binding(GO:0019864) |
| 0.4 | 2.5 | GO:0000293 | ferric-chelate reductase activity(GO:0000293) |
| 0.3 | 1.0 | GO:0004145 | diamine N-acetyltransferase activity(GO:0004145) |
| 0.3 | 7.2 | GO:0008430 | selenium binding(GO:0008430) |
| 0.3 | 0.3 | GO:0015168 | glycerol transmembrane transporter activity(GO:0015168) |
| 0.3 | 3.4 | GO:0019238 | cyclohydrolase activity(GO:0019238) |
| 0.3 | 2.3 | GO:0004966 | galanin receptor activity(GO:0004966) |
| 0.3 | 3.0 | GO:0043237 | laminin-1 binding(GO:0043237) |
| 0.3 | 0.9 | GO:0061505 | DNA topoisomerase type II (ATP-hydrolyzing) activity(GO:0003918) DNA topoisomerase II activity(GO:0061505) |
| 0.3 | 4.8 | GO:0015194 | L-serine transmembrane transporter activity(GO:0015194) serine transmembrane transporter activity(GO:0022889) |
| 0.3 | 1.4 | GO:0042015 | interleukin-20 binding(GO:0042015) |
| 0.3 | 1.9 | GO:0004366 | glycerol-3-phosphate O-acyltransferase activity(GO:0004366) |
| 0.3 | 4.5 | GO:0048407 | platelet-derived growth factor binding(GO:0048407) |
| 0.3 | 44.1 | GO:0004867 | serine-type endopeptidase inhibitor activity(GO:0004867) |
| 0.2 | 2.2 | GO:0034711 | inhibin binding(GO:0034711) |
| 0.2 | 2.8 | GO:0042301 | phosphate ion binding(GO:0042301) |
| 0.2 | 4.5 | GO:0043522 | leucine zipper domain binding(GO:0043522) |
| 0.2 | 1.1 | GO:0004668 | protein-arginine deiminase activity(GO:0004668) |
| 0.2 | 9.4 | GO:0070064 | proline-rich region binding(GO:0070064) |
| 0.2 | 1.1 | GO:0031735 | CCR10 chemokine receptor binding(GO:0031735) |
| 0.2 | 1.9 | GO:0098639 | collagen binding involved in cell-matrix adhesion(GO:0098639) |
| 0.2 | 0.8 | GO:0045569 | TRAIL binding(GO:0045569) |
| 0.2 | 4.9 | GO:0034450 | ubiquitin-ubiquitin ligase activity(GO:0034450) |
| 0.2 | 6.0 | GO:0001871 | pattern binding(GO:0001871) polysaccharide binding(GO:0030247) |
| 0.2 | 7.0 | GO:0070628 | proteasome binding(GO:0070628) |
| 0.2 | 3.3 | GO:0004568 | chitinase activity(GO:0004568) |
| 0.2 | 7.6 | GO:0070566 | adenylyltransferase activity(GO:0070566) |
| 0.2 | 0.8 | GO:0051431 | histone deacetylase regulator activity(GO:0035033) corticotropin-releasing hormone receptor 2 binding(GO:0051431) |
| 0.2 | 1.7 | GO:0010997 | anaphase-promoting complex binding(GO:0010997) |
| 0.2 | 2.2 | GO:0048019 | receptor antagonist activity(GO:0048019) |
| 0.2 | 1.8 | GO:0070700 | BMP receptor binding(GO:0070700) |
| 0.2 | 1.7 | GO:0004720 | protein-lysine 6-oxidase activity(GO:0004720) |
| 0.2 | 0.7 | GO:0030550 | acetylcholine receptor inhibitor activity(GO:0030550) |
| 0.2 | 6.8 | GO:0004181 | metallocarboxypeptidase activity(GO:0004181) |
| 0.2 | 3.3 | GO:0008199 | ferric iron binding(GO:0008199) |
| 0.2 | 1.3 | GO:0004797 | thymidine kinase activity(GO:0004797) |
| 0.1 | 0.7 | GO:0004556 | alpha-amylase activity(GO:0004556) |
| 0.1 | 23.8 | GO:0005518 | collagen binding(GO:0005518) |
| 0.1 | 2.9 | GO:0004089 | carbonate dehydratase activity(GO:0004089) |
| 0.1 | 1.7 | GO:0044323 | retinoic acid-responsive element binding(GO:0044323) |
| 0.1 | 1.4 | GO:0005384 | manganese ion transmembrane transporter activity(GO:0005384) |
| 0.1 | 1.3 | GO:0036435 | K48-linked polyubiquitin binding(GO:0036435) |
| 0.1 | 1.1 | GO:0004957 | prostaglandin E receptor activity(GO:0004957) |
| 0.1 | 0.5 | GO:0004461 | lactose synthase activity(GO:0004461) |
| 0.1 | 0.5 | GO:0004392 | heme oxygenase (decyclizing) activity(GO:0004392) |
| 0.1 | 2.7 | GO:0051787 | misfolded protein binding(GO:0051787) |
| 0.1 | 0.3 | GO:0005135 | interleukin-3 receptor binding(GO:0005135) |
| 0.1 | 0.7 | GO:0015562 | efflux transmembrane transporter activity(GO:0015562) |
| 0.1 | 3.2 | GO:0005212 | structural constituent of eye lens(GO:0005212) |
| 0.1 | 0.7 | GO:0030060 | L-malate dehydrogenase activity(GO:0030060) |
| 0.1 | 1.7 | GO:1990459 | transferrin receptor binding(GO:1990459) |
| 0.1 | 3.0 | GO:0004653 | polypeptide N-acetylgalactosaminyltransferase activity(GO:0004653) |
| 0.1 | 0.8 | GO:0008048 | calcium sensitive guanylate cyclase activator activity(GO:0008048) |
| 0.1 | 1.2 | GO:0097157 | pre-mRNA intronic binding(GO:0097157) |
| 0.1 | 2.7 | GO:0035925 | mRNA 3'-UTR AU-rich region binding(GO:0035925) |
| 0.1 | 0.3 | GO:0031716 | calcitonin receptor binding(GO:0031716) |
| 0.1 | 1.1 | GO:0032395 | MHC class II receptor activity(GO:0032395) |
| 0.1 | 1.2 | GO:0033612 | receptor serine/threonine kinase binding(GO:0033612) |
| 0.1 | 0.3 | GO:0051538 | 3 iron, 4 sulfur cluster binding(GO:0051538) |
| 0.1 | 0.8 | GO:0016721 | superoxide dismutase activity(GO:0004784) oxidoreductase activity, acting on superoxide radicals as acceptor(GO:0016721) |
| 0.1 | 1.2 | GO:0043008 | ATP-dependent protein binding(GO:0043008) |
| 0.1 | 2.1 | GO:0004190 | aspartic-type endopeptidase activity(GO:0004190) |
| 0.1 | 0.5 | GO:0004046 | aminoacylase activity(GO:0004046) |
| 0.1 | 1.1 | GO:0016004 | phospholipase activator activity(GO:0016004) |
| 0.1 | 22.5 | GO:0004252 | serine-type endopeptidase activity(GO:0004252) |
| 0.1 | 4.0 | GO:0004601 | peroxidase activity(GO:0004601) |
| 0.1 | 0.1 | GO:0004995 | tachykinin receptor activity(GO:0004995) |
| 0.1 | 0.6 | GO:0043023 | ribosomal large subunit binding(GO:0043023) |
| 0.1 | 0.7 | GO:0046790 | virion binding(GO:0046790) |
| 0.1 | 0.2 | GO:0015207 | ATP:ADP antiporter activity(GO:0005471) adenine transmembrane transporter activity(GO:0015207) |
| 0.1 | 5.7 | GO:0005544 | calcium-dependent phospholipid binding(GO:0005544) |
| 0.1 | 0.2 | GO:0080130 | L-aspartate:2-oxoglutarate aminotransferase activity(GO:0004069) L-phenylalanine:2-oxoglutarate aminotransferase activity(GO:0080130) |
| 0.0 | 1.0 | GO:0004861 | cyclin-dependent protein serine/threonine kinase inhibitor activity(GO:0004861) |
| 0.0 | 0.7 | GO:0035005 | 1-phosphatidylinositol-4-phosphate 3-kinase activity(GO:0035005) |
| 0.0 | 1.2 | GO:0004000 | adenosine deaminase activity(GO:0004000) |
| 0.0 | 1.6 | GO:0005035 | tumor necrosis factor-activated receptor activity(GO:0005031) death receptor activity(GO:0005035) |
| 0.0 | 1.1 | GO:0003707 | steroid hormone receptor activity(GO:0003707) |
| 0.0 | 0.8 | GO:0030169 | low-density lipoprotein particle binding(GO:0030169) |
| 0.0 | 4.7 | GO:0005201 | extracellular matrix structural constituent(GO:0005201) |
| 0.0 | 3.6 | GO:0001105 | RNA polymerase II transcription coactivator activity(GO:0001105) |
| 0.0 | 4.7 | GO:0097110 | scaffold protein binding(GO:0097110) |
| 0.0 | 1.7 | GO:0070530 | K63-linked polyubiquitin binding(GO:0070530) |
| 0.0 | 1.2 | GO:0001530 | lipopolysaccharide binding(GO:0001530) |
| 0.0 | 0.3 | GO:0005540 | hyaluronic acid binding(GO:0005540) |
| 0.0 | 1.8 | GO:0003785 | actin monomer binding(GO:0003785) |
| 0.0 | 2.7 | GO:0043425 | bHLH transcription factor binding(GO:0043425) |
| 0.0 | 1.3 | GO:0017134 | fibroblast growth factor binding(GO:0017134) |
| 0.0 | 1.4 | GO:0017166 | vinculin binding(GO:0017166) |
| 0.0 | 1.3 | GO:0004364 | glutathione transferase activity(GO:0004364) |
| 0.0 | 4.5 | GO:0051087 | chaperone binding(GO:0051087) |
| 0.0 | 1.8 | GO:0005484 | SNAP receptor activity(GO:0005484) |
| 0.0 | 1.0 | GO:0005527 | macrolide binding(GO:0005527) FK506 binding(GO:0005528) |
| 0.0 | 1.5 | GO:0030371 | translation repressor activity(GO:0030371) |
| 0.0 | 0.1 | GO:0046870 | cadmium ion binding(GO:0046870) |
| 0.0 | 0.6 | GO:0019871 | sodium channel inhibitor activity(GO:0019871) |
| 0.0 | 4.1 | GO:0002020 | protease binding(GO:0002020) |
| 0.0 | 6.5 | GO:0003735 | structural constituent of ribosome(GO:0003735) |
| 0.0 | 0.4 | GO:0005000 | vasopressin receptor activity(GO:0005000) |
| 0.0 | 0.4 | GO:0003688 | DNA replication origin binding(GO:0003688) 3'-5' DNA helicase activity(GO:0043138) |
| 0.0 | 0.3 | GO:0086056 | voltage-gated calcium channel activity involved in AV node cell action potential(GO:0086056) |
| 0.0 | 8.7 | GO:0030246 | carbohydrate binding(GO:0030246) |
| 0.0 | 0.9 | GO:0004115 | 3',5'-cyclic-AMP phosphodiesterase activity(GO:0004115) |
| 0.0 | 0.7 | GO:0015002 | cytochrome-c oxidase activity(GO:0004129) heme-copper terminal oxidase activity(GO:0015002) oxidoreductase activity, acting on a heme group of donors, oxygen as acceptor(GO:0016676) |
| 0.0 | 0.8 | GO:0070577 | lysine-acetylated histone binding(GO:0070577) |
| 0.0 | 0.4 | GO:0009931 | calcium-dependent protein serine/threonine kinase activity(GO:0009931) calcium-dependent protein kinase activity(GO:0010857) |
| 0.0 | 2.3 | GO:0051082 | unfolded protein binding(GO:0051082) |
| 0.0 | 0.7 | GO:0008569 | ATP-dependent microtubule motor activity, minus-end-directed(GO:0008569) |
| 0.0 | 0.5 | GO:0005068 | transmembrane receptor protein tyrosine kinase adaptor activity(GO:0005068) |
| 0.0 | 0.3 | GO:0071933 | Arp2/3 complex binding(GO:0071933) |
| 0.0 | 1.8 | GO:0001618 | virus receptor activity(GO:0001618) |
| 0.0 | 1.3 | GO:0030170 | pyridoxal phosphate binding(GO:0030170) |
| 0.0 | 17.3 | GO:0008270 | zinc ion binding(GO:0008270) |
| 0.0 | 0.0 | GO:0004773 | steryl-sulfatase activity(GO:0004773) |
| 0.0 | 0.2 | GO:0008020 | G-protein coupled photoreceptor activity(GO:0008020) |
| 0.0 | 0.8 | GO:0015485 | cholesterol binding(GO:0015485) |
| 0.0 | 0.7 | GO:0061631 | ubiquitin conjugating enzyme activity(GO:0061631) |
| 0.0 | 0.2 | GO:0072542 | protein phosphatase activator activity(GO:0072542) |
Gene overrepresentation in curated gene sets: canonical pathways category:
| Log-likelihood per target | Total log-likelihood | Term | Description |
|---|---|---|---|
| 0.4 | 19.3 | PID TOLL ENDOGENOUS PATHWAY | Endogenous TLR signaling |
| 0.2 | 6.6 | PID ERB GENOMIC PATHWAY | Validated nuclear estrogen receptor beta network |
| 0.2 | 3.0 | PID INTEGRIN4 PATHWAY | Alpha6 beta4 integrin-ligand interactions |
| 0.2 | 22.2 | PID HNF3A PATHWAY | FOXA1 transcription factor network |
| 0.2 | 12.4 | PID PRL SIGNALING EVENTS PATHWAY | Signaling events mediated by PRL |
| 0.2 | 20.7 | PID HES HEY PATHWAY | Notch-mediated HES/HEY network |
| 0.2 | 17.0 | PID FRA PATHWAY | Validated transcriptional targets of AP1 family members Fra1 and Fra2 |
| 0.2 | 0.7 | ST DIFFERENTIATION PATHWAY IN PC12 CELLS | Differentiation Pathway in PC12 Cells; this is a specific case of PAC1 Receptor Pathway. |
| 0.2 | 10.7 | PID UPA UPAR PATHWAY | Urokinase-type plasminogen activator (uPA) and uPAR-mediated signaling |
| 0.2 | 5.5 | ST ADRENERGIC | Adrenergic Pathway |
| 0.2 | 10.8 | PID RXR VDR PATHWAY | RXR and RAR heterodimerization with other nuclear receptor |
| 0.1 | 10.2 | PID HNF3B PATHWAY | FOXA2 and FOXA3 transcription factor networks |
| 0.1 | 10.1 | PID IL6 7 PATHWAY | IL6-mediated signaling events |
| 0.1 | 4.5 | PID LYMPH ANGIOGENESIS PATHWAY | VEGFR3 signaling in lymphatic endothelium |
| 0.1 | 5.8 | NABA PROTEOGLYCANS | Genes encoding proteoglycans |
| 0.1 | 6.5 | PID CXCR3 PATHWAY | CXCR3-mediated signaling events |
| 0.1 | 8.2 | PID ATF2 PATHWAY | ATF-2 transcription factor network |
| 0.1 | 6.0 | ST GRANULE CELL SURVIVAL PATHWAY | Granule Cell Survival Pathway is a specific case of more general PAC1 Receptor Pathway. |
| 0.1 | 3.9 | PID IL23 PATHWAY | IL23-mediated signaling events |
| 0.1 | 36.0 | NABA ECM REGULATORS | Genes encoding enzymes and their regulators involved in the remodeling of the extracellular matrix |
| 0.1 | 6.1 | PID IL12 2PATHWAY | IL12-mediated signaling events |
| 0.1 | 28.0 | NABA ECM GLYCOPROTEINS | Genes encoding structural ECM glycoproteins |
| 0.1 | 2.4 | PID WNT SIGNALING PATHWAY | Wnt signaling network |
| 0.1 | 2.0 | PID PI3KCI AKT PATHWAY | Class I PI3K signaling events mediated by Akt |
| 0.1 | 29.5 | NABA SECRETED FACTORS | Genes encoding secreted soluble factors |
| 0.1 | 1.7 | PID INTEGRIN2 PATHWAY | Beta2 integrin cell surface interactions |
| 0.1 | 5.2 | PID REG GR PATHWAY | Glucocorticoid receptor regulatory network |
| 0.1 | 2.2 | PID P38 MK2 PATHWAY | p38 signaling mediated by MAPKAP kinases |
| 0.1 | 2.3 | SIG BCR SIGNALING PATHWAY | Members of the BCR signaling pathway |
| 0.0 | 3.1 | PID IL4 2PATHWAY | IL4-mediated signaling events |
| 0.0 | 3.7 | PID RAC1 PATHWAY | RAC1 signaling pathway |
| 0.0 | 13.4 | NABA MATRISOME ASSOCIATED | Ensemble of genes encoding ECM-associated proteins including ECM-affilaited proteins, ECM regulators and secreted factors |
| 0.0 | 2.5 | PID EPHB FWD PATHWAY | EPHB forward signaling |
| 0.0 | 3.8 | PID ECADHERIN STABILIZATION PATHWAY | Stabilization and expansion of the E-cadherin adherens junction |
| 0.0 | 3.2 | PID ILK PATHWAY | Integrin-linked kinase signaling |
| 0.0 | 0.5 | PID MYC PATHWAY | C-MYC pathway |
| 0.0 | 0.7 | PID SYNDECAN 3 PATHWAY | Syndecan-3-mediated signaling events |
| 0.0 | 1.7 | PID CXCR4 PATHWAY | CXCR4-mediated signaling events |
| 0.0 | 2.3 | NABA CORE MATRISOME | Ensemble of genes encoding core extracellular matrix including ECM glycoproteins, collagens and proteoglycans |
| 0.0 | 0.8 | PID TRAIL PATHWAY | TRAIL signaling pathway |
| 0.0 | 0.4 | PID INTEGRIN1 PATHWAY | Beta1 integrin cell surface interactions |
| 0.0 | 2.3 | PID TRKR PATHWAY | Neurotrophic factor-mediated Trk receptor signaling |
| 0.0 | 2.2 | PID MYC REPRESS PATHWAY | Validated targets of C-MYC transcriptional repression |
| 0.0 | 0.9 | PID DELTA NP63 PATHWAY | Validated transcriptional targets of deltaNp63 isoforms |
| 0.0 | 0.6 | PID BARD1 PATHWAY | BARD1 signaling events |
| 0.0 | 0.4 | ST ERK1 ERK2 MAPK PATHWAY | ERK1/ERK2 MAPK Pathway |
| 0.0 | 0.9 | PID PDGFRB PATHWAY | PDGFR-beta signaling pathway |
Gene overrepresentation in curated gene sets: REACTOME pathways category:
| Log-likelihood per target | Total log-likelihood | Term | Description |
|---|---|---|---|
| 1.2 | 29.0 | REACTOME CHYLOMICRON MEDIATED LIPID TRANSPORT | Genes involved in Chylomicron-mediated lipid transport |
| 1.1 | 20.7 | REACTOME XENOBIOTICS | Genes involved in Xenobiotics |
| 1.0 | 46.3 | REACTOME AMYLOIDS | Genes involved in Amyloids |
| 0.8 | 19.1 | REACTOME INITIAL TRIGGERING OF COMPLEMENT | Genes involved in Initial triggering of complement |
| 0.5 | 7.3 | REACTOME TRYPTOPHAN CATABOLISM | Genes involved in Tryptophan catabolism |
| 0.5 | 8.8 | REACTOME ACTIVATION OF CHAPERONE GENES BY ATF6 ALPHA | Genes involved in Activation of Chaperone Genes by ATF6-alpha |
| 0.5 | 11.0 | REACTOME SYNTHESIS SECRETION AND DEACYLATION OF GHRELIN | Genes involved in Synthesis, Secretion, and Deacylation of Ghrelin |
| 0.4 | 0.4 | REACTOME PEPTIDE LIGAND BINDING RECEPTORS | Genes involved in Peptide ligand-binding receptors |
| 0.4 | 14.8 | REACTOME DEGRADATION OF THE EXTRACELLULAR MATRIX | Genes involved in Degradation of the extracellular matrix |
| 0.3 | 26.6 | REACTOME CHEMOKINE RECEPTORS BIND CHEMOKINES | Genes involved in Chemokine receptors bind chemokines |
| 0.3 | 3.4 | REACTOME TETRAHYDROBIOPTERIN BH4 SYNTHESIS RECYCLING SALVAGE AND REGULATION | Genes involved in Tetrahydrobiopterin (BH4) synthesis, recycling, salvage and regulation |
| 0.3 | 13.2 | REACTOME DEFENSINS | Genes involved in Defensins |
| 0.3 | 6.5 | REACTOME PLATELET ADHESION TO EXPOSED COLLAGEN | Genes involved in Platelet Adhesion to exposed collagen |
| 0.2 | 6.7 | REACTOME CYTOSOLIC SULFONATION OF SMALL MOLECULES | Genes involved in Cytosolic sulfonation of small molecules |
| 0.2 | 4.1 | REACTOME PASSIVE TRANSPORT BY AQUAPORINS | Genes involved in Passive Transport by Aquaporins |
| 0.2 | 5.2 | REACTOME COMPLEMENT CASCADE | Genes involved in Complement cascade |
| 0.2 | 2.2 | REACTOME GLYCOPROTEIN HORMONES | Genes involved in Glycoprotein hormones |
| 0.2 | 2.9 | REACTOME REVERSIBLE HYDRATION OF CARBON DIOXIDE | Genes involved in Reversible Hydration of Carbon Dioxide |
| 0.1 | 4.9 | REACTOME PHOSPHORYLATION OF THE APC C | Genes involved in Phosphorylation of the APC/C |
| 0.1 | 4.5 | REACTOME PROLACTIN RECEPTOR SIGNALING | Genes involved in Prolactin receptor signaling |
| 0.1 | 4.3 | REACTOME CS DS DEGRADATION | Genes involved in CS/DS degradation |
| 0.1 | 2.8 | REACTOME INCRETIN SYNTHESIS SECRETION AND INACTIVATION | Genes involved in Incretin Synthesis, Secretion, and Inactivation |
| 0.1 | 9.7 | REACTOME REGULATION OF BETA CELL DEVELOPMENT | Genes involved in Regulation of beta-cell development |
| 0.1 | 1.3 | REACTOME REGULATION OF ORNITHINE DECARBOXYLASE ODC | Genes involved in Regulation of ornithine decarboxylase (ODC) |
| 0.1 | 2.5 | REACTOME SEMA3A PLEXIN REPULSION SIGNALING BY INHIBITING INTEGRIN ADHESION | Genes involved in SEMA3A-Plexin repulsion signaling by inhibiting Integrin adhesion |
| 0.1 | 14.1 | REACTOME TRANSCRIPTIONAL REGULATION OF WHITE ADIPOCYTE DIFFERENTIATION | Genes involved in Transcriptional Regulation of White Adipocyte Differentiation |
| 0.1 | 3.0 | REACTOME ACTIVATION OF RAC | Genes involved in Activation of Rac |
| 0.1 | 11.8 | REACTOME NUCLEAR RECEPTOR TRANSCRIPTION PATHWAY | Genes involved in Nuclear Receptor transcription pathway |
| 0.1 | 2.0 | REACTOME AMINE DERIVED HORMONES | Genes involved in Amine-derived hormones |
| 0.1 | 1.1 | REACTOME PROSTANOID LIGAND RECEPTORS | Genes involved in Prostanoid ligand receptors |
| 0.1 | 17.2 | REACTOME FACTORS INVOLVED IN MEGAKARYOCYTE DEVELOPMENT AND PLATELET PRODUCTION | Genes involved in Factors involved in megakaryocyte development and platelet production |
| 0.1 | 5.0 | REACTOME IRON UPTAKE AND TRANSPORT | Genes involved in Iron uptake and transport |
| 0.1 | 7.3 | REACTOME COLLAGEN FORMATION | Genes involved in Collagen formation |
| 0.1 | 4.6 | REACTOME GLUCONEOGENESIS | Genes involved in Gluconeogenesis |
| 0.1 | 1.8 | REACTOME ABCA TRANSPORTERS IN LIPID HOMEOSTASIS | Genes involved in ABCA transporters in lipid homeostasis |
| 0.1 | 2.6 | REACTOME SULFUR AMINO ACID METABOLISM | Genes involved in Sulfur amino acid metabolism |
| 0.1 | 3.4 | REACTOME GLUCOSE METABOLISM | Genes involved in Glucose metabolism |
| 0.1 | 1.0 | REACTOME ETHANOL OXIDATION | Genes involved in Ethanol oxidation |
| 0.0 | 0.7 | REACTOME DIGESTION OF DIETARY CARBOHYDRATE | Genes involved in Digestion of dietary carbohydrate |
| 0.0 | 4.2 | REACTOME O LINKED GLYCOSYLATION OF MUCINS | Genes involved in O-linked glycosylation of mucins |
| 0.0 | 1.9 | REACTOME SYNTHESIS OF PA | Genes involved in Synthesis of PA |
| 0.0 | 2.3 | REACTOME AMINE COMPOUND SLC TRANSPORTERS | Genes involved in Amine compound SLC transporters |
| 0.0 | 4.0 | REACTOME PPARA ACTIVATES GENE EXPRESSION | Genes involved in PPARA Activates Gene Expression |
| 0.0 | 1.3 | REACTOME PYRIMIDINE METABOLISM | Genes involved in Pyrimidine metabolism |
| 0.0 | 1.3 | REACTOME GLUTATHIONE CONJUGATION | Genes involved in Glutathione conjugation |
| 0.0 | 1.0 | REACTOME G1 S SPECIFIC TRANSCRIPTION | Genes involved in G1/S-Specific Transcription |
| 0.0 | 3.4 | REACTOME INTERFERON GAMMA SIGNALING | Genes involved in Interferon gamma signaling |
| 0.0 | 0.7 | REACTOME ABC FAMILY PROTEINS MEDIATED TRANSPORT | Genes involved in ABC-family proteins mediated transport |
| 0.0 | 0.5 | REACTOME REGULATION OF SIGNALING BY CBL | Genes involved in Regulation of signaling by CBL |
| 0.0 | 0.2 | REACTOME INTERACTIONS OF VPR WITH HOST CELLULAR PROTEINS | Genes involved in Interactions of Vpr with host cellular proteins |
| 0.0 | 1.4 | REACTOME FORMATION OF THE TERNARY COMPLEX AND SUBSEQUENTLY THE 43S COMPLEX | Genes involved in Formation of the ternary complex, and subsequently, the 43S complex |
| 0.0 | 1.0 | REACTOME G1 PHASE | Genes involved in G1 Phase |
| 0.0 | 1.5 | REACTOME DESTABILIZATION OF MRNA BY AUF1 HNRNP D0 | Genes involved in Destabilization of mRNA by AUF1 (hnRNP D0) |
| 0.0 | 4.4 | REACTOME G ALPHA Q SIGNALLING EVENTS | Genes involved in G alpha (q) signalling events |
| 0.0 | 1.4 | REACTOME RESPIRATORY ELECTRON TRANSPORT | Genes involved in Respiratory electron transport |
| 0.0 | 0.2 | REACTOME OPSINS | Genes involved in Opsins |
| 0.0 | 0.7 | REACTOME SYNTHESIS OF PIPS AT THE PLASMA MEMBRANE | Genes involved in Synthesis of PIPs at the plasma membrane |
| 0.0 | 0.3 | REACTOME IL RECEPTOR SHC SIGNALING | Genes involved in Interleukin receptor SHC signaling |