Project
Illumina Body Map 2 (GSE30611)
Navigation
Downloads
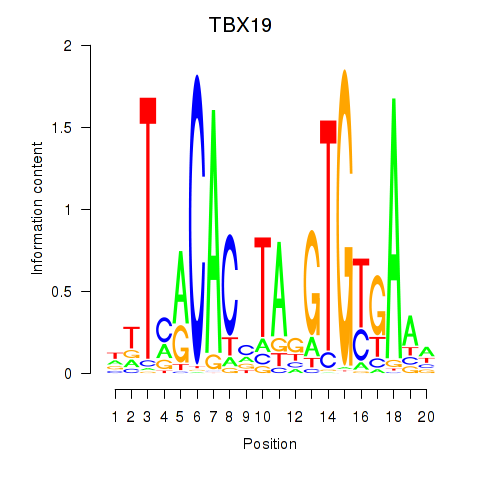
Results for TBX19
Z-value: 1.32
Motif logo
Transcription factors associated with TBX19
| Gene Symbol | Gene ID | Gene Info |
|---|---|---|
|
TBX19
|
ENSG00000143178.13 | T-box transcription factor 19 |
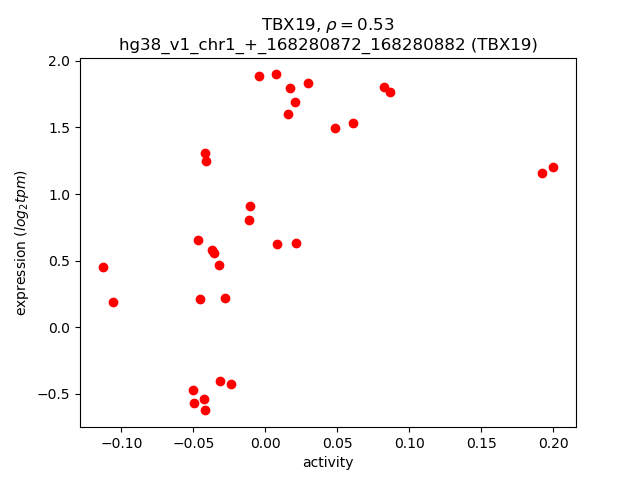
Activity-expression correlation:
| Gene | Promoter | Pearson corr. coef. | P-value | Plot |
|---|---|---|---|---|
| TBX19 | hg38_v1_chr1_+_168280872_168280882 | 0.53 | 2.0e-03 | Click! |
Activity profile of TBX19 motif
Sorted Z-values of TBX19 motif
| Promoter | Log-likelihood | Transcript | Gene | Gene Info |
|---|---|---|---|---|
| chr5_+_55024250 | 12.45 |
ENST00000231009.3
|
GZMK
|
granzyme K |
| chr14_-_106185387 | 9.29 |
ENST00000390605.2
|
IGHV1-18
|
immunoglobulin heavy variable 1-18 |
| chr1_+_116754422 | 6.39 |
ENST00000369478.4
ENST00000369477.1 |
CD2
|
CD2 molecule |
| chr14_-_106154113 | 6.00 |
ENST00000390603.2
|
IGHV3-15
|
immunoglobulin heavy variable 3-15 |
| chr5_+_35856883 | 5.84 |
ENST00000506850.5
ENST00000303115.8 ENST00000511982.1 |
IL7R
|
interleukin 7 receptor |
| chr12_-_9607903 | 5.53 |
ENST00000229402.4
|
KLRB1
|
killer cell lectin like receptor B1 |
| chr1_+_207454230 | 5.40 |
ENST00000367058.7
ENST00000367059.3 ENST00000367057.8 |
CR2
|
complement C3d receptor 2 |
| chrX_+_12906639 | 5.25 |
ENST00000311912.5
|
TLR8
|
toll like receptor 8 |
| chr14_+_20781139 | 5.11 |
ENST00000304677.3
|
RNASE6
|
ribonuclease A family member k6 |
| chr5_+_96876480 | 4.87 |
ENST00000437043.8
ENST00000379904.8 |
ERAP2
|
endoplasmic reticulum aminopeptidase 2 |
| chr2_-_89027700 | 4.85 |
ENST00000483158.1
|
IGKV3-11
|
immunoglobulin kappa variable 3-11 |
| chr7_+_142560423 | 4.85 |
ENST00000620569.1
|
TRBV12-3
|
T cell receptor beta variable 12-3 |
| chr2_+_90114838 | 4.77 |
ENST00000417279.3
|
IGKV3D-15
|
immunoglobulin kappa variable 3D-15 |
| chr1_-_160647037 | 4.67 |
ENST00000302035.11
|
SLAMF1
|
signaling lymphocytic activation molecule family member 1 |
| chr14_-_106360320 | 4.66 |
ENST00000390615.2
|
IGHV3-33
|
immunoglobulin heavy variable 3-33 |
| chr1_+_160796157 | 4.63 |
ENST00000263285.11
ENST00000368039.2 |
LY9
|
lymphocyte antigen 9 |
| chr19_-_7702124 | 4.63 |
ENST00000597921.6
|
FCER2
|
Fc fragment of IgE receptor II |
| chr19_-_7702139 | 4.60 |
ENST00000346664.9
|
FCER2
|
Fc fragment of IgE receptor II |
| chr7_+_142345412 | 4.37 |
ENST00000390392.3
|
TRBV4-2
|
T cell receptor beta variable 4-2 |
| chr7_+_142492121 | 4.36 |
ENST00000390374.3
|
TRBV7-6
|
T cell receptor beta variable 7-6 |
| chr21_+_38256698 | 4.13 |
ENST00000613499.4
ENST00000612702.4 ENST00000398925.5 ENST00000398928.5 ENST00000328656.8 ENST00000443341.5 |
KCNJ15
|
potassium inwardly rectifying channel subfamily J member 15 |
| chr5_+_96875978 | 4.05 |
ENST00000510373.5
|
ERAP2
|
endoplasmic reticulum aminopeptidase 2 |
| chr1_-_161069666 | 3.89 |
ENST00000368016.7
|
ARHGAP30
|
Rho GTPase activating protein 30 |
| chr1_-_160646958 | 3.80 |
ENST00000538290.2
|
SLAMF1
|
signaling lymphocytic activation molecule family member 1 |
| chr6_-_36547400 | 3.77 |
ENST00000229812.8
|
STK38
|
serine/threonine kinase 38 |
| chr12_+_8123609 | 3.69 |
ENST00000229332.12
|
CLEC4A
|
C-type lectin domain family 4 member A |
| chr14_-_106511856 | 3.69 |
ENST00000390622.2
|
IGHV1-46
|
immunoglobulin heavy variable 1-46 |
| chr2_-_112836702 | 3.67 |
ENST00000416750.1
ENST00000263341.7 ENST00000418817.5 |
IL1B
|
interleukin 1 beta |
| chr1_-_161069962 | 3.50 |
ENST00000368015.1
|
ARHGAP30
|
Rho GTPase activating protein 30 |
| chr15_-_55289756 | 3.50 |
ENST00000336787.6
|
RAB27A
|
RAB27A, member RAS oncogene family |
| chr22_+_39926591 | 3.49 |
ENST00000420971.5
|
GRAP2
|
GRB2 related adaptor protein 2 |
| chr9_-_114388020 | 3.49 |
ENST00000312033.3
|
AKNA
|
AT-hook transcription factor |
| chr1_+_153990749 | 3.39 |
ENST00000651669.1
|
RPS27
|
ribosomal protein S27 |
| chr2_-_88861563 | 3.28 |
ENST00000624935.3
ENST00000390241.3 |
ENSG00000240040.6
IGKJ2
|
novel transcript immunoglobulin kappa joining 2 |
| chr10_-_119536533 | 3.20 |
ENST00000392865.5
|
RGS10
|
regulator of G protein signaling 10 |
| chr1_-_160647287 | 3.11 |
ENST00000235739.6
|
SLAMF1
|
signaling lymphocytic activation molecule family member 1 |
| chr7_+_142450941 | 3.06 |
ENST00000390368.2
|
TRBV6-5
|
T cell receptor beta variable 6-5 |
| chr19_-_54313074 | 3.02 |
ENST00000486742.2
ENST00000432233.8 |
LILRA5
|
leukocyte immunoglobulin like receptor A5 |
| chr1_-_161069857 | 2.98 |
ENST00000368013.8
|
ARHGAP30
|
Rho GTPase activating protein 30 |
| chr5_-_100903252 | 2.81 |
ENST00000231461.10
|
ST8SIA4
|
ST8 alpha-N-acetyl-neuraminide alpha-2,8-sialyltransferase 4 |
| chr2_+_143129379 | 2.79 |
ENST00000295095.11
|
ARHGAP15
|
Rho GTPase activating protein 15 |
| chr4_+_15703057 | 2.56 |
ENST00000265016.9
ENST00000382346.7 |
BST1
|
bone marrow stromal cell antigen 1 |
| chr2_+_90234809 | 2.51 |
ENST00000443397.5
|
IGKV3D-7
|
immunoglobulin kappa variable 3D-7 |
| chrX_+_108045050 | 2.44 |
ENST00000458383.1
ENST00000217957.10 |
VSIG1
|
V-set and immunoglobulin domain containing 1 |
| chr7_-_38354517 | 2.43 |
ENST00000390345.2
|
TRGV4
|
T cell receptor gamma variable 4 |
| chr12_+_8123837 | 2.37 |
ENST00000345999.9
ENST00000352620.9 ENST00000360500.5 |
CLEC4A
|
C-type lectin domain family 4 member A |
| chr12_-_110689751 | 2.34 |
ENST00000439744.6
ENST00000549442.5 |
HVCN1
|
hydrogen voltage gated channel 1 |
| chr1_+_168280872 | 2.30 |
ENST00000367821.8
|
TBX19
|
T-box transcription factor 19 |
| chr12_-_48925483 | 2.29 |
ENST00000550765.6
ENST00000552878.5 ENST00000453172.2 |
FKBP11
|
FKBP prolyl isomerase 11 |
| chr1_+_100345018 | 2.27 |
ENST00000635056.2
ENST00000647005.1 |
CDC14A
|
cell division cycle 14A |
| chr19_+_49487510 | 2.21 |
ENST00000679106.1
ENST00000621674.4 ENST00000391857.9 ENST00000678510.1 ENST00000467825.2 |
RPL13A
|
ribosomal protein L13a |
| chr1_-_120051714 | 2.18 |
ENST00000579475.7
|
NOTCH2
|
notch receptor 2 |
| chr2_-_88861920 | 2.16 |
ENST00000390242.2
|
IGKJ1
|
immunoglobulin kappa joining 1 |
| chr5_-_100903214 | 2.09 |
ENST00000451528.2
|
ST8SIA4
|
ST8 alpha-N-acetyl-neuraminide alpha-2,8-sialyltransferase 4 |
| chr2_+_89851723 | 2.09 |
ENST00000429992.2
|
IGKV2D-40
|
immunoglobulin kappa variable 2D-40 |
| chr6_-_46735693 | 2.08 |
ENST00000537365.1
|
PLA2G7
|
phospholipase A2 group VII |
| chr2_-_85409805 | 2.06 |
ENST00000449030.5
|
CAPG
|
capping actin protein, gelsolin like |
| chr10_-_93482194 | 2.05 |
ENST00000358334.9
ENST00000371488.3 |
MYOF
|
myoferlin |
| chr10_-_93482326 | 2.03 |
ENST00000359263.9
|
MYOF
|
myoferlin |
| chr6_-_2841853 | 1.91 |
ENST00000380739.6
|
SERPINB1
|
serpin family B member 1 |
| chr10_-_93482287 | 1.88 |
ENST00000371489.5
|
MYOF
|
myoferlin |
| chr8_+_109362453 | 1.86 |
ENST00000378402.10
|
PKHD1L1
|
PKHD1 like 1 |
| chr22_+_44677044 | 1.85 |
ENST00000006251.11
|
PRR5
|
proline rich 5 |
| chr2_-_88979016 | 1.84 |
ENST00000390247.2
|
IGKV3-7
|
immunoglobulin kappa variable 3-7 (non-functional) |
| chr1_+_158930778 | 1.76 |
ENST00000458222.5
|
PYHIN1
|
pyrin and HIN domain family member 1 |
| chr18_+_63887698 | 1.76 |
ENST00000457692.5
ENST00000299502.9 ENST00000413956.5 |
SERPINB2
|
serpin family B member 2 |
| chr5_-_78985288 | 1.74 |
ENST00000264914.10
|
ARSB
|
arylsulfatase B |
| chr2_-_213151590 | 1.69 |
ENST00000374319.8
ENST00000457361.5 ENST00000451136.6 ENST00000434687.6 |
IKZF2
|
IKAROS family zinc finger 2 |
| chr5_-_131532993 | 1.68 |
ENST00000504575.5
ENST00000513227.5 |
RAPGEF6
|
Rap guanine nucleotide exchange factor 6 |
| chr19_-_2292024 | 1.63 |
ENST00000585527.1
|
LINGO3
|
leucine rich repeat and Ig domain containing 3 |
| chr6_-_42746054 | 1.63 |
ENST00000372876.2
|
TBCC
|
tubulin folding cofactor C |
| chr22_+_44677077 | 1.59 |
ENST00000403581.5
|
PRR5
|
proline rich 5 |
| chr17_-_39926839 | 1.56 |
ENST00000394169.5
|
ORMDL3
|
ORMDL sphingolipid biosynthesis regulator 3 |
| chr18_-_2982873 | 1.51 |
ENST00000584915.1
|
LPIN2
|
lipin 2 |
| chr1_+_32292067 | 1.48 |
ENST00000373548.8
ENST00000428704.1 |
HDAC1
|
histone deacetylase 1 |
| chr12_-_57006476 | 1.48 |
ENST00000300101.3
|
ZBTB39
|
zinc finger and BTB domain containing 39 |
| chr5_-_178232759 | 1.47 |
ENST00000308158.10
|
PHYKPL
|
5-phosphohydroxy-L-lysine phospho-lyase |
| chr16_-_74700845 | 1.47 |
ENST00000308807.12
ENST00000573267.1 |
MLKL
|
mixed lineage kinase domain like pseudokinase |
| chr11_-_22625804 | 1.43 |
ENST00000327470.6
|
FANCF
|
FA complementation group F |
| chr9_+_75890664 | 1.41 |
ENST00000376767.7
ENST00000674117.1 ENST00000376752.8 |
PCSK5
|
proprotein convertase subtilisin/kexin type 5 |
| chr10_-_12195837 | 1.41 |
ENST00000444732.1
ENST00000378940.7 ENST00000491614.6 |
NUDT5
|
nudix hydrolase 5 |
| chrX_+_108044967 | 1.36 |
ENST00000415430.7
|
VSIG1
|
V-set and immunoglobulin domain containing 1 |
| chr1_-_176207220 | 1.35 |
ENST00000367669.8
|
COP1
|
COP1 E3 ubiquitin ligase |
| chr16_-_11598464 | 1.35 |
ENST00000571627.5
|
LITAF
|
lipopolysaccharide induced TNF factor |
| chr10_-_12195821 | 1.33 |
ENST00000378937.7
ENST00000378927.7 |
NUDT5
|
nudix hydrolase 5 |
| chr20_+_45207025 | 1.33 |
ENST00000372781.4
|
SEMG1
|
semenogelin 1 |
| chr16_+_33827140 | 1.32 |
ENST00000562905.2
|
IGHV3OR16-13
|
immunoglobulin heavy variable 3/OR16-13 (non-functional) |
| chr3_+_31981740 | 1.31 |
ENST00000360311.5
|
ZNF860
|
zinc finger protein 860 |
| chr12_-_10453330 | 1.31 |
ENST00000347831.9
ENST00000359151.8 |
KLRC1
|
killer cell lectin like receptor C1 |
| chr2_+_171453122 | 1.29 |
ENST00000611110.4
ENST00000339506.7 |
DCAF17
|
DDB1 and CUL4 associated factor 17 |
| chr1_+_78620432 | 1.25 |
ENST00000370751.10
ENST00000459784.6 ENST00000680110.1 ENST00000680295.1 |
IFI44L
|
interferon induced protein 44 like |
| chr4_-_15681454 | 1.20 |
ENST00000507899.1
ENST00000510802.5 |
FBXL5
|
F-box and leucine rich repeat protein 5 |
| chr5_-_178232537 | 1.16 |
ENST00000476170.2
ENST00000323594.8 |
PHYKPL
|
5-phosphohydroxy-L-lysine phospho-lyase |
| chr12_-_8066331 | 1.15 |
ENST00000546241.1
ENST00000307637.5 |
C3AR1
|
complement C3a receptor 1 |
| chr12_+_112906777 | 1.12 |
ENST00000452357.7
ENST00000445409.7 |
OAS1
|
2'-5'-oligoadenylate synthetase 1 |
| chr11_+_72227881 | 1.10 |
ENST00000538751.5
ENST00000541756.5 |
INPPL1
|
inositol polyphosphate phosphatase like 1 |
| chr10_-_5185104 | 1.10 |
ENST00000648824.1
ENST00000650030.1 |
AKR1C8P
|
aldo-keto reductase family 1 member C8, pseudogene |
| chr5_-_176034680 | 1.03 |
ENST00000514861.5
|
THOC3
|
THO complex 3 |
| chr15_-_68229658 | 1.03 |
ENST00000565471.6
ENST00000637494.1 ENST00000636314.1 ENST00000637667.1 ENST00000564752.1 ENST00000566347.5 ENST00000249806.11 ENST00000562767.2 |
CLN6
ENSG00000260007.3
|
CLN6 transmembrane ER protein novel protein |
| chr15_+_67125707 | 1.02 |
ENST00000540846.6
|
SMAD3
|
SMAD family member 3 |
| chr6_-_26216673 | 1.00 |
ENST00000541790.3
|
H2BC8
|
H2B clustered histone 8 |
| chrX_+_120604084 | 0.99 |
ENST00000371317.10
|
MCTS1
|
MCTS1 re-initiation and release factor |
| chr2_+_71453538 | 0.99 |
ENST00000258104.8
|
DYSF
|
dysferlin |
| chr2_+_3575250 | 0.99 |
ENST00000645674.2
|
RPS7
|
ribosomal protein S7 |
| chr20_-_46363174 | 0.98 |
ENST00000372227.5
|
SLC35C2
|
solute carrier family 35 member C2 |
| chr7_+_149147422 | 0.97 |
ENST00000475153.6
|
ZNF398
|
zinc finger protein 398 |
| chr7_-_47539240 | 0.97 |
ENST00000450444.5
|
TNS3
|
tensin 3 |
| chr21_+_29300111 | 0.96 |
ENST00000451655.5
|
BACH1
|
BTB domain and CNC homolog 1 |
| chr7_+_93906557 | 0.95 |
ENST00000248572.10
ENST00000429473.1 ENST00000430875.1 ENST00000428834.1 |
GNGT1
|
G protein subunit gamma transducin 1 |
| chr1_+_150926336 | 0.95 |
ENST00000271640.9
ENST00000448029.5 ENST00000368962.6 ENST00000534805.5 ENST00000368969.8 ENST00000368963.5 ENST00000498193.5 |
SETDB1
|
SET domain bifurcated histone lysine methyltransferase 1 |
| chr5_-_95081482 | 0.95 |
ENST00000312216.12
ENST00000512425.5 ENST00000505208.5 ENST00000429576.6 ENST00000508509.5 ENST00000510732.5 |
MCTP1
|
multiple C2 and transmembrane domain containing 1 |
| chr9_-_97922487 | 0.94 |
ENST00000455506.1
ENST00000375117.8 ENST00000375119.8 ENST00000611338.4 |
TRMO
|
tRNA methyltransferase O |
| chr5_-_78985249 | 0.94 |
ENST00000565165.2
|
ARSB
|
arylsulfatase B |
| chr1_+_78620722 | 0.91 |
ENST00000679848.1
|
IFI44L
|
interferon induced protein 44 like |
| chr19_-_46023046 | 0.91 |
ENST00000008938.5
|
PGLYRP1
|
peptidoglycan recognition protein 1 |
| chr17_-_41140487 | 0.87 |
ENST00000345847.4
|
KRTAP4-6
|
keratin associated protein 4-6 |
| chr14_-_106875069 | 0.87 |
ENST00000390639.2
|
IGHV7-81
|
immunoglobulin heavy variable 7-81 (non-functional) |
| chr19_-_44304968 | 0.87 |
ENST00000591609.1
ENST00000589799.5 ENST00000291182.9 ENST00000650576.1 ENST00000589248.5 |
ZNF235
|
zinc finger protein 235 |
| chr1_+_212285383 | 0.85 |
ENST00000261461.7
|
PPP2R5A
|
protein phosphatase 2 regulatory subunit B'alpha |
| chr6_-_31684040 | 0.85 |
ENST00000375863.7
|
LY6G5C
|
lymphocyte antigen 6 family member G5C |
| chr17_+_38717424 | 0.84 |
ENST00000615858.1
|
MLLT6
|
MLLT6, PHD finger containing |
| chr1_+_25616780 | 0.84 |
ENST00000374332.9
|
MAN1C1
|
mannosidase alpha class 1C member 1 |
| chr18_-_21600645 | 0.84 |
ENST00000269214.10
|
ESCO1
|
establishment of sister chromatid cohesion N-acetyltransferase 1 |
| chr21_+_29300770 | 0.83 |
ENST00000447177.5
|
BACH1
|
BTB domain and CNC homolog 1 |
| chr14_-_106507476 | 0.82 |
ENST00000390621.3
|
IGHV1-45
|
immunoglobulin heavy variable 1-45 |
| chr1_+_171512032 | 0.82 |
ENST00000426496.6
|
PRRC2C
|
proline rich coiled-coil 2C |
| chr1_-_150697128 | 0.82 |
ENST00000427665.1
ENST00000271732.8 |
GOLPH3L
|
golgi phosphoprotein 3 like |
| chr13_+_50909745 | 0.80 |
ENST00000422660.6
ENST00000645188.1 ENST00000646731.1 ENST00000643774.1 ENST00000646960.1 ENST00000637648.2 ENST00000336617.8 |
RNASEH2B
|
ribonuclease H2 subunit B |
| chr1_+_206083540 | 0.79 |
ENST00000603378.5
ENST00000603488.5 |
RHEX
|
regulator of hemoglobinization and erythroid cell expansion |
| chr19_-_344786 | 0.77 |
ENST00000264819.7
|
MIER2
|
MIER family member 2 |
| chr8_+_32548210 | 0.77 |
ENST00000523079.5
ENST00000650919.1 |
NRG1
|
neuregulin 1 |
| chr3_+_46163465 | 0.75 |
ENST00000357422.2
|
CCR3
|
C-C motif chemokine receptor 3 |
| chr6_+_85449584 | 0.75 |
ENST00000369651.7
|
NT5E
|
5'-nucleotidase ecto |
| chr11_-_59668981 | 0.75 |
ENST00000300146.10
|
PATL1
|
PAT1 homolog 1, processing body mRNA decay factor |
| chr2_-_200888993 | 0.75 |
ENST00000409264.6
ENST00000392283.9 |
PPIL3
|
peptidylprolyl isomerase like 3 |
| chr1_-_150974867 | 0.74 |
ENST00000271688.10
|
CERS2
|
ceramide synthase 2 |
| chr11_-_65121780 | 0.74 |
ENST00000525297.5
ENST00000529259.1 |
FAU
|
FAU ubiquitin like and ribosomal protein S30 fusion |
| chr9_+_75890639 | 0.74 |
ENST00000545128.5
|
PCSK5
|
proprotein convertase subtilisin/kexin type 5 |
| chr18_+_62539511 | 0.72 |
ENST00000586834.1
|
ZCCHC2
|
zinc finger CCHC-type containing 2 |
| chr8_-_19682576 | 0.72 |
ENST00000332246.10
|
CSGALNACT1
|
chondroitin sulfate N-acetylgalactosaminyltransferase 1 |
| chr11_+_57657736 | 0.71 |
ENST00000529773.2
ENST00000533905.1 ENST00000525602.1 ENST00000533682.2 ENST00000302731.4 |
CLP1
|
cleavage factor polyribonucleotide kinase subunit 1 |
| chr3_-_71493500 | 0.71 |
ENST00000648380.1
ENST00000650295.1 |
FOXP1
|
forkhead box P1 |
| chr20_+_3209469 | 0.68 |
ENST00000380113.8
ENST00000455664.6 ENST00000399838.3 |
ITPA
|
inosine triphosphatase |
| chr19_-_38847423 | 0.67 |
ENST00000647557.1
|
HNRNPL
|
heterogeneous nuclear ribonucleoprotein L |
| chr1_-_100132892 | 0.67 |
ENST00000287482.6
|
SASS6
|
SAS-6 centriolar assembly protein |
| chr16_+_20674493 | 0.64 |
ENST00000561584.5
|
ACSM3
|
acyl-CoA synthetase medium chain family member 3 |
| chr19_-_40090860 | 0.63 |
ENST00000599972.1
ENST00000450241.6 ENST00000595687.6 ENST00000340963.9 |
ZNF780A
|
zinc finger protein 780A |
| chr19_+_4247074 | 0.62 |
ENST00000262962.12
|
YJU2
|
YJU2 splicing factor homolog |
| chr6_-_26285526 | 0.61 |
ENST00000377727.2
|
H4C8
|
H4 clustered histone 8 |
| chr4_+_26319636 | 0.61 |
ENST00000342295.6
ENST00000506956.5 ENST00000512671.6 ENST00000345843.8 |
RBPJ
|
recombination signal binding protein for immunoglobulin kappa J region |
| chr1_+_100133135 | 0.61 |
ENST00000370143.5
ENST00000370141.7 |
TRMT13
|
tRNA methyltransferase 13 homolog |
| chr9_-_113410666 | 0.59 |
ENST00000374171.5
|
POLE3
|
DNA polymerase epsilon 3, accessory subunit |
| chr6_-_38639898 | 0.59 |
ENST00000481247.6
|
BTBD9
|
BTB domain containing 9 |
| chr7_-_47539591 | 0.59 |
ENST00000442536.6
ENST00000458317.6 |
TNS3
|
tensin 3 |
| chr7_-_148883474 | 0.57 |
ENST00000476773.5
|
EZH2
|
enhancer of zeste 2 polycomb repressive complex 2 subunit |
| chr14_+_58427686 | 0.54 |
ENST00000650904.1
ENST00000652326.2 ENST00000554463.5 ENST00000555833.5 |
KIAA0586
|
KIAA0586 |
| chr6_+_26216928 | 0.54 |
ENST00000303910.4
|
H2AC8
|
H2A clustered histone 8 |
| chr17_+_46511511 | 0.52 |
ENST00000576629.5
|
LRRC37A2
|
leucine rich repeat containing 37 member A2 |
| chr1_-_167553745 | 0.51 |
ENST00000370509.5
|
CREG1
|
cellular repressor of E1A stimulated genes 1 |
| chr10_-_11532275 | 0.50 |
ENST00000277575.5
|
USP6NL
|
USP6 N-terminal like |
| chr16_+_84768246 | 0.50 |
ENST00000569925.1
ENST00000567526.1 |
USP10
|
ubiquitin specific peptidase 10 |
| chr2_-_200889266 | 0.50 |
ENST00000443398.5
ENST00000286175.12 ENST00000409449.5 |
PPIL3
|
peptidylprolyl isomerase like 3 |
| chr6_+_42879610 | 0.47 |
ENST00000493763.7
ENST00000304734.9 |
RPL7L1
|
ribosomal protein L7 like 1 |
| chr20_-_5113032 | 0.47 |
ENST00000379299.6
ENST00000379286.6 ENST00000379279.6 ENST00000379283.6 |
TMEM230
|
transmembrane protein 230 |
| chr1_-_63523175 | 0.47 |
ENST00000371092.7
ENST00000271002.15 |
ITGB3BP
|
integrin subunit beta 3 binding protein |
| chr3_-_101320558 | 0.47 |
ENST00000193391.8
|
IMPG2
|
interphotoreceptor matrix proteoglycan 2 |
| chr12_+_104287015 | 0.45 |
ENST00000529546.5
ENST00000529751.1 ENST00000528079.6 ENST00000526580.5 |
TXNRD1
|
thioredoxin reductase 1 |
| chr19_-_40090921 | 0.45 |
ENST00000595508.1
ENST00000414720.6 ENST00000455521.5 ENST00000595773.5 ENST00000683561.1 |
ENSG00000269749.1
ZNF780A
|
novel transcript zinc finger protein 780A |
| chr20_-_5113067 | 0.44 |
ENST00000342308.10
ENST00000612323.4 ENST00000202834.11 |
TMEM230
|
transmembrane protein 230 |
| chr16_-_86555021 | 0.44 |
ENST00000565482.1
ENST00000564364.5 ENST00000561989.5 ENST00000568037.5 ENST00000634347.1 ENST00000543303.6 ENST00000381214.9 ENST00000360900.11 ENST00000546093.5 ENST00000569000.5 ENST00000562994.5 ENST00000561522.1 |
MTHFSD
|
methenyltetrahydrofolate synthetase domain containing |
| chr17_-_41047267 | 0.43 |
ENST00000542137.1
ENST00000391419.3 |
KRTAP2-1
|
keratin associated protein 2-1 |
| chrX_+_130401962 | 0.43 |
ENST00000305536.11
ENST00000370947.1 |
RBMX2
|
RNA binding motif protein X-linked 2 |
| chr17_-_64505357 | 0.39 |
ENST00000583212.2
ENST00000578190.5 ENST00000579091.5 ENST00000583239.6 |
DDX5
|
DEAD-box helicase 5 |
| chr4_+_25648011 | 0.38 |
ENST00000645788.1
|
SLC34A2
|
solute carrier family 34 member 2 |
| chr1_+_40691689 | 0.38 |
ENST00000427410.6
ENST00000447388.7 ENST00000425457.6 ENST00000453631.5 ENST00000456393.6 |
NFYC
|
nuclear transcription factor Y subunit gamma |
| chr8_+_132962986 | 0.38 |
ENST00000518058.1
|
TG
|
thyroglobulin |
| chr20_-_462485 | 0.37 |
ENST00000681414.1
ENST00000680050.1 ENST00000681129.1 ENST00000354200.5 ENST00000679895.1 ENST00000681551.1 ENST00000681539.1 |
TBC1D20
|
TBC1 domain family member 20 |
| chr2_-_200889136 | 0.37 |
ENST00000409361.5
|
PPIL3
|
peptidylprolyl isomerase like 3 |
| chr11_+_119121559 | 0.37 |
ENST00000350777.7
ENST00000529988.5 ENST00000527410.3 |
HINFP
|
histone H4 transcription factor |
| chr1_+_113929600 | 0.36 |
ENST00000369558.5
ENST00000369561.8 |
HIPK1
|
homeodomain interacting protein kinase 1 |
| chr13_+_50909905 | 0.34 |
ENST00000644034.1
ENST00000645955.1 |
RNASEH2B
|
ribonuclease H2 subunit B |
| chr3_-_98035295 | 0.33 |
ENST00000621172.4
|
GABRR3
|
gamma-aminobutyric acid type A receptor subunit rho3 |
| chr6_-_116829037 | 0.32 |
ENST00000368549.7
ENST00000530250.1 ENST00000310357.8 |
GPRC6A
|
G protein-coupled receptor class C group 6 member A |
| chr5_-_115626161 | 0.32 |
ENST00000282382.8
|
TMED7-TICAM2
|
TMED7-TICAM2 readthrough |
| chrX_-_139832235 | 0.30 |
ENST00000327569.7
ENST00000361648.6 |
ATP11C
|
ATPase phospholipid transporting 11C |
| chr16_-_66550005 | 0.30 |
ENST00000527284.6
|
TK2
|
thymidine kinase 2 |
| chr19_+_37371152 | 0.28 |
ENST00000483919.5
ENST00000588911.5 ENST00000587349.1 |
ZNF527
|
zinc finger protein 527 |
| chr7_+_77122609 | 0.28 |
ENST00000285871.5
|
CCDC146
|
coiled-coil domain containing 146 |
| chr17_+_6756035 | 0.27 |
ENST00000361842.8
ENST00000574907.5 |
XAF1
|
XIAP associated factor 1 |
| chr15_-_60479080 | 0.27 |
ENST00000560072.5
ENST00000560406.5 ENST00000560520.1 ENST00000261520.9 |
ICE2
|
interactor of little elongation complex ELL subunit 2 |
| chrX_-_19970298 | 0.26 |
ENST00000379687.7
ENST00000379682.8 |
BCLAF3
|
BCLAF1 and THRAP3 family member 3 |
| chr6_-_15586006 | 0.26 |
ENST00000462989.6
|
DTNBP1
|
dystrobrevin binding protein 1 |
| chr12_+_52069967 | 0.25 |
ENST00000336854.9
ENST00000550604.1 ENST00000553049.5 ENST00000548915.1 |
ATG101
|
autophagy related 101 |
| chr2_+_200889411 | 0.25 |
ENST00000409357.5
ENST00000409129.2 |
NIF3L1
|
NGG1 interacting factor 3 like 1 |
| chr11_-_56614874 | 0.24 |
ENST00000641076.1
|
OR5M1
|
olfactory receptor family 5 subfamily M member 1 |
| chr7_-_76626127 | 0.24 |
ENST00000454397.1
|
POMZP3
|
POM121 and ZP3 fusion |
| chr15_+_30625966 | 0.24 |
ENST00000428041.4
|
ARHGAP11B
|
Rho GTPase activating protein 11B |
| chr3_-_47513677 | 0.24 |
ENST00000296149.9
|
ELP6
|
elongator acetyltransferase complex subunit 6 |
| chr16_-_66549839 | 0.24 |
ENST00000527800.6
ENST00000677555.1 ENST00000563369.6 |
TK2
|
thymidine kinase 2 |
| chr7_-_151440008 | 0.23 |
ENST00000491928.1
ENST00000644350.1 ENST00000337323.3 |
CRYGN
|
crystallin gamma N |
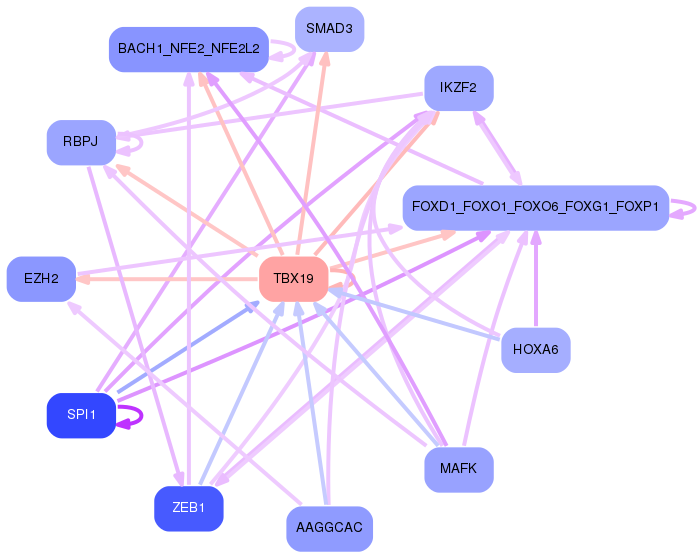
Network of associatons between targets according to the STRING database.

First level regulatory network of TBX19
Gene Ontology Analysis
Gene overrepresentation in biological process category:
| Log-likelihood per target | Total log-likelihood | Term | Description |
|---|---|---|---|
| 2.9 | 11.6 | GO:0035744 | T-helper 1 cell cytokine production(GO:0035744) |
| 1.3 | 9.2 | GO:0002925 | positive regulation of humoral immune response mediated by circulating immunoglobulin(GO:0002925) |
| 1.2 | 3.7 | GO:0046136 | positive regulation of vitamin metabolic process(GO:0046136) positive regulation of vitamin D biosynthetic process(GO:0060557) positive regulation of calcidiol 1-monooxygenase activity(GO:0060559) |
| 1.0 | 5.2 | GO:0045356 | positive regulation of interferon-alpha biosynthetic process(GO:0045356) |
| 0.9 | 2.7 | GO:0019303 | D-ribose catabolic process(GO:0019303) |
| 0.7 | 1.3 | GO:1900005 | positive regulation of serine-type endopeptidase activity(GO:1900005) positive regulation of serine-type peptidase activity(GO:1902573) |
| 0.6 | 6.4 | GO:0030885 | regulation of myeloid dendritic cell activation(GO:0030885) |
| 0.6 | 8.9 | GO:0019885 | antigen processing and presentation of endogenous peptide antigen via MHC class I(GO:0019885) |
| 0.5 | 3.5 | GO:1903435 | positive regulation of constitutive secretory pathway(GO:1903435) |
| 0.4 | 5.8 | GO:0001915 | negative regulation of T cell mediated cytotoxicity(GO:0001915) |
| 0.4 | 1.8 | GO:0061580 | colon epithelial cell migration(GO:0061580) |
| 0.4 | 6.5 | GO:0002430 | complement receptor mediated signaling pathway(GO:0002430) |
| 0.4 | 7.0 | GO:0001778 | plasma membrane repair(GO:0001778) |
| 0.3 | 2.1 | GO:0034441 | plasma lipoprotein particle oxidation(GO:0034441) |
| 0.3 | 1.6 | GO:0090156 | cellular sphingolipid homeostasis(GO:0090156) |
| 0.3 | 0.9 | GO:0051714 | negative regulation of natural killer cell differentiation(GO:0032824) negative regulation of natural killer cell differentiation involved in immune response(GO:0032827) positive regulation of cytolysis in other organism(GO:0051714) |
| 0.3 | 1.8 | GO:0000117 | regulation of transcription involved in G2/M transition of mitotic cell cycle(GO:0000117) |
| 0.2 | 4.9 | GO:0001574 | ganglioside biosynthetic process(GO:0001574) |
| 0.2 | 2.2 | GO:0032455 | renal response to blood flow involved in circulatory renin-angiotensin regulation of systemic arterial blood pressure(GO:0001999) renin secretion into blood stream(GO:0002001) nerve growth factor processing(GO:0032455) |
| 0.2 | 3.1 | GO:0001731 | formation of translation preinitiation complex(GO:0001731) |
| 0.2 | 0.7 | GO:0046041 | ITP metabolic process(GO:0046041) |
| 0.2 | 4.6 | GO:0032740 | positive regulation of interleukin-17 production(GO:0032740) |
| 0.2 | 18.3 | GO:0006910 | phagocytosis, recognition(GO:0006910) |
| 0.2 | 0.8 | GO:1904381 | Golgi apparatus mannose trimming(GO:1904381) |
| 0.2 | 0.6 | GO:0036333 | hepatocyte homeostasis(GO:0036333) response to tetrachloromethane(GO:1904772) |
| 0.2 | 0.7 | GO:1900148 | Schwann cell proliferation involved in axon regeneration(GO:0014011) negative regulation of Schwann cell migration(GO:1900148) regulation of Schwann cell proliferation involved in axon regeneration(GO:1905044) negative regulation of Schwann cell proliferation involved in axon regeneration(GO:1905045) |
| 0.2 | 3.4 | GO:0038203 | TORC2 signaling(GO:0038203) |
| 0.2 | 0.5 | GO:0035526 | retrograde transport, plasma membrane to Golgi(GO:0035526) |
| 0.2 | 0.8 | GO:0034421 | post-translational protein acetylation(GO:0034421) |
| 0.2 | 1.5 | GO:0061198 | fungiform papilla formation(GO:0061198) |
| 0.2 | 3.8 | GO:0030277 | maintenance of gastrointestinal epithelium(GO:0030277) |
| 0.1 | 15.3 | GO:0006958 | complement activation, classical pathway(GO:0006958) |
| 0.1 | 3.4 | GO:0000028 | ribosomal small subunit assembly(GO:0000028) |
| 0.1 | 1.0 | GO:0061767 | negative regulation of lung blood pressure(GO:0061767) |
| 0.1 | 2.6 | GO:0006554 | lysine catabolic process(GO:0006554) |
| 0.1 | 0.7 | GO:0050653 | chondroitin sulfate proteoglycan biosynthetic process, polysaccharide chain biosynthetic process(GO:0050653) |
| 0.1 | 2.3 | GO:0051256 | mitotic spindle midzone assembly(GO:0051256) |
| 0.1 | 1.6 | GO:0007023 | post-chaperonin tubulin folding pathway(GO:0007023) |
| 0.1 | 0.8 | GO:0046086 | AMP catabolic process(GO:0006196) adenosine biosynthetic process(GO:0046086) |
| 0.1 | 3.2 | GO:0007213 | G-protein coupled acetylcholine receptor signaling pathway(GO:0007213) |
| 0.1 | 0.9 | GO:0090309 | positive regulation of methylation-dependent chromatin silencing(GO:0090309) |
| 0.1 | 2.2 | GO:0002315 | marginal zone B cell differentiation(GO:0002315) |
| 0.1 | 0.7 | GO:0046092 | deoxycytidine metabolic process(GO:0046092) |
| 0.1 | 1.0 | GO:1902255 | positive regulation of intrinsic apoptotic signaling pathway by p53 class mediator(GO:1902255) |
| 0.1 | 4.6 | GO:0019731 | antibacterial humoral response(GO:0019731) |
| 0.1 | 0.7 | GO:0030423 | targeting of mRNA for destruction involved in RNA interference(GO:0030423) |
| 0.1 | 2.1 | GO:0071803 | positive regulation of podosome assembly(GO:0071803) |
| 0.1 | 1.0 | GO:0007042 | lysosomal lumen acidification(GO:0007042) |
| 0.1 | 2.3 | GO:0071294 | cellular response to zinc ion(GO:0071294) |
| 0.1 | 1.0 | GO:0015781 | pyrimidine nucleotide-sugar transport(GO:0015781) |
| 0.1 | 2.6 | GO:0090022 | regulation of neutrophil chemotaxis(GO:0090022) |
| 0.1 | 0.9 | GO:0090219 | negative regulation of lipid kinase activity(GO:0090219) |
| 0.1 | 0.8 | GO:0048194 | Golgi vesicle budding(GO:0048194) |
| 0.1 | 0.4 | GO:0070309 | lens fiber cell morphogenesis(GO:0070309) |
| 0.1 | 0.6 | GO:1900242 | regulation of synaptic vesicle endocytosis(GO:1900242) |
| 0.1 | 1.0 | GO:0046784 | viral mRNA export from host cell nucleus(GO:0046784) |
| 0.1 | 1.1 | GO:2000001 | regulation of DNA damage checkpoint(GO:2000001) |
| 0.1 | 8.3 | GO:0031295 | T cell costimulation(GO:0031295) |
| 0.1 | 0.6 | GO:0060844 | arterial endothelial cell fate commitment(GO:0060844) positive regulation of ephrin receptor signaling pathway(GO:1901189) positive regulation of canonical Wnt signaling pathway involved in cardiac muscle cell fate commitment(GO:1901297) positive regulation of canonical Wnt signaling pathway involved in heart development(GO:1905068) |
| 0.1 | 4.1 | GO:0010107 | potassium ion import(GO:0010107) |
| 0.1 | 3.9 | GO:0000413 | protein peptidyl-prolyl isomerization(GO:0000413) |
| 0.1 | 0.3 | GO:0002329 | pre-B cell differentiation(GO:0002329) |
| 0.0 | 1.7 | GO:0090557 | establishment of endothelial intestinal barrier(GO:0090557) |
| 0.0 | 1.5 | GO:0006646 | phosphatidylethanolamine biosynthetic process(GO:0006646) |
| 0.0 | 9.1 | GO:0002377 | immunoglobulin production(GO:0002377) |
| 0.0 | 0.8 | GO:0021842 | directional guidance of interneurons involved in migration from the subpallium to the cortex(GO:0021840) chemorepulsion involved in interneuron migration from the subpallium to the cortex(GO:0021842) ERBB3 signaling pathway(GO:0038129) |
| 0.0 | 0.7 | GO:0000290 | deadenylation-dependent decapping of nuclear-transcribed mRNA(GO:0000290) |
| 0.0 | 0.3 | GO:0042796 | snRNA transcription from RNA polymerase III promoter(GO:0042796) |
| 0.0 | 1.5 | GO:0030488 | tRNA methylation(GO:0030488) |
| 0.0 | 0.2 | GO:0035803 | egg coat formation(GO:0035803) |
| 0.0 | 0.7 | GO:0072619 | interleukin-21 production(GO:0032625) interleukin-21 secretion(GO:0072619) |
| 0.0 | 1.2 | GO:0031146 | SCF-dependent proteasomal ubiquitin-dependent protein catabolic process(GO:0031146) |
| 0.0 | 2.3 | GO:0021983 | pituitary gland development(GO:0021983) |
| 0.0 | 1.3 | GO:0042347 | negative regulation of NF-kappaB import into nucleus(GO:0042347) |
| 0.0 | 0.5 | GO:0001887 | selenium compound metabolic process(GO:0001887) |
| 0.0 | 0.4 | GO:0072502 | cellular phosphate ion homeostasis(GO:0030643) cellular trivalent inorganic anion homeostasis(GO:0072502) |
| 0.0 | 0.4 | GO:0015705 | iodide transport(GO:0015705) |
| 0.0 | 5.8 | GO:0002223 | stimulatory C-type lectin receptor signaling pathway(GO:0002223) |
| 0.0 | 3.8 | GO:0043407 | negative regulation of MAP kinase activity(GO:0043407) |
| 0.0 | 0.4 | GO:1903800 | positive regulation of production of miRNAs involved in gene silencing by miRNA(GO:1903800) |
| 0.0 | 0.2 | GO:0070376 | regulation of ERK5 cascade(GO:0070376) positive regulation of ERK5 cascade(GO:0070378) |
| 0.0 | 1.4 | GO:0036297 | interstrand cross-link repair(GO:0036297) |
| 0.0 | 1.1 | GO:0046856 | phosphatidylinositol dephosphorylation(GO:0046856) |
| 0.0 | 0.3 | GO:0000463 | maturation of LSU-rRNA from tricistronic rRNA transcript (SSU-rRNA, 5.8S rRNA, LSU-rRNA)(GO:0000463) |
| 0.0 | 1.5 | GO:0070266 | necroptotic process(GO:0070266) |
| 0.0 | 1.6 | GO:0048286 | lung alveolus development(GO:0048286) |
| 0.0 | 1.0 | GO:0022400 | regulation of rhodopsin mediated signaling pathway(GO:0022400) |
| 0.0 | 0.4 | GO:0008298 | intracellular mRNA localization(GO:0008298) |
| 0.0 | 0.3 | GO:0060155 | platelet dense granule organization(GO:0060155) |
| 0.0 | 1.6 | GO:0035722 | interleukin-12-mediated signaling pathway(GO:0035722) cellular response to interleukin-12(GO:0071349) |
| 0.0 | 0.6 | GO:0032201 | telomere maintenance via semi-conservative replication(GO:0032201) |
| 0.0 | 11.7 | GO:0051056 | regulation of small GTPase mediated signal transduction(GO:0051056) |
| 0.0 | 0.1 | GO:0045415 | negative regulation of interleukin-8 biosynthetic process(GO:0045415) |
| 0.0 | 0.8 | GO:0060216 | definitive hemopoiesis(GO:0060216) |
| 0.0 | 0.2 | GO:0006384 | transcription initiation from RNA polymerase III promoter(GO:0006384) |
| 0.0 | 0.7 | GO:0007099 | centriole replication(GO:0007099) |
| 0.0 | 0.5 | GO:0019985 | translesion synthesis(GO:0019985) |
| 0.0 | 1.1 | GO:0045071 | negative regulation of viral genome replication(GO:0045071) |
| 0.0 | 0.5 | GO:0034080 | CENP-A containing nucleosome assembly(GO:0034080) CENP-A containing chromatin organization(GO:0061641) |
| 0.0 | 0.3 | GO:0035456 | response to interferon-beta(GO:0035456) |
Gene overrepresentation in cellular component category:
| Log-likelihood per target | Total log-likelihood | Term | Description |
|---|---|---|---|
| 0.3 | 18.3 | GO:0042571 | immunoglobulin complex, circulating(GO:0042571) |
| 0.3 | 1.6 | GO:0035339 | SPOTS complex(GO:0035339) |
| 0.2 | 2.2 | GO:0097452 | GAIT complex(GO:0097452) |
| 0.2 | 3.5 | GO:0033093 | Weibel-Palade body(GO:0033093) |
| 0.2 | 5.2 | GO:0036020 | endolysosome membrane(GO:0036020) |
| 0.2 | 1.1 | GO:0032299 | ribonuclease H2 complex(GO:0032299) |
| 0.2 | 2.3 | GO:0060091 | kinocilium(GO:0060091) |
| 0.2 | 0.9 | GO:0097013 | phagocytic vesicle lumen(GO:0097013) |
| 0.1 | 2.1 | GO:0008290 | F-actin capping protein complex(GO:0008290) |
| 0.1 | 3.4 | GO:0031932 | TORC2 complex(GO:0031932) |
| 0.1 | 1.3 | GO:0098559 | cytoplasmic side of early endosome membrane(GO:0098559) cytoplasmic side of late endosome membrane(GO:0098560) |
| 0.1 | 0.7 | GO:0000214 | tRNA-intron endonuclease complex(GO:0000214) |
| 0.1 | 6.5 | GO:0046658 | anchored component of plasma membrane(GO:0046658) |
| 0.1 | 2.6 | GO:0001931 | uropod(GO:0001931) cell trailing edge(GO:0031254) |
| 0.1 | 0.6 | GO:0008622 | epsilon DNA polymerase complex(GO:0008622) |
| 0.1 | 1.4 | GO:0043240 | Fanconi anaemia nuclear complex(GO:0043240) |
| 0.1 | 1.0 | GO:0071144 | SMAD2-SMAD3 protein complex(GO:0071144) |
| 0.1 | 0.7 | GO:0098536 | deuterosome(GO:0098536) |
| 0.1 | 1.0 | GO:0000445 | THO complex(GO:0000347) THO complex part of transcription export complex(GO:0000445) |
| 0.1 | 2.1 | GO:0034362 | low-density lipoprotein particle(GO:0034362) |
| 0.1 | 26.0 | GO:0009897 | external side of plasma membrane(GO:0009897) |
| 0.1 | 5.2 | GO:0022627 | cytosolic small ribosomal subunit(GO:0022627) |
| 0.1 | 0.3 | GO:0035363 | histone locus body(GO:0035363) |
| 0.1 | 0.5 | GO:0033165 | interphotoreceptor matrix(GO:0033165) |
| 0.1 | 1.5 | GO:0016580 | Sin3 complex(GO:0016580) |
| 0.0 | 0.6 | GO:0002193 | MAML1-RBP-Jkappa- ICN1 complex(GO:0002193) |
| 0.0 | 0.2 | GO:0042720 | mitochondrial inner membrane peptidase complex(GO:0042720) |
| 0.0 | 0.4 | GO:0016602 | CCAAT-binding factor complex(GO:0016602) |
| 0.0 | 1.6 | GO:0032391 | photoreceptor connecting cilium(GO:0032391) |
| 0.0 | 0.2 | GO:0071006 | U2-type catalytic step 1 spliceosome(GO:0071006) |
| 0.0 | 4.6 | GO:0005901 | caveola(GO:0005901) |
| 0.0 | 1.0 | GO:0097381 | photoreceptor disc membrane(GO:0097381) |
| 0.0 | 0.6 | GO:0045120 | pronucleus(GO:0045120) |
| 0.0 | 4.9 | GO:0072562 | blood microparticle(GO:0072562) |
| 0.0 | 1.9 | GO:0030173 | integral component of Golgi membrane(GO:0030173) |
| 0.0 | 11.0 | GO:0005788 | endoplasmic reticulum lumen(GO:0005788) |
| 0.0 | 1.1 | GO:0080008 | Cul4-RING E3 ubiquitin ligase complex(GO:0080008) |
| 0.0 | 0.4 | GO:0071141 | SMAD protein complex(GO:0071141) |
| 0.0 | 3.5 | GO:0035579 | specific granule membrane(GO:0035579) |
| 0.0 | 0.8 | GO:0030014 | CCR4-NOT complex(GO:0030014) |
| 0.0 | 2.2 | GO:0005796 | Golgi lumen(GO:0005796) |
| 0.0 | 0.2 | GO:0033588 | Elongator holoenzyme complex(GO:0033588) |
| 0.0 | 0.4 | GO:0005686 | U2 snRNP(GO:0005686) |
| 0.0 | 1.8 | GO:0031463 | Cul3-RING ubiquitin ligase complex(GO:0031463) |
| 0.0 | 3.9 | GO:0001650 | fibrillar center(GO:0001650) |
| 0.0 | 0.9 | GO:0000159 | protein phosphatase type 2A complex(GO:0000159) |
| 0.0 | 1.3 | GO:0045095 | keratin filament(GO:0045095) |
| 0.0 | 1.0 | GO:0005801 | cis-Golgi network(GO:0005801) |
| 0.0 | 0.2 | GO:0042575 | DNA polymerase complex(GO:0042575) |
| 0.0 | 2.5 | GO:0043679 | axon terminus(GO:0043679) |
| 0.0 | 1.1 | GO:0030315 | T-tubule(GO:0030315) |
| 0.0 | 0.5 | GO:0001917 | photoreceptor inner segment(GO:0001917) |
| 0.0 | 2.8 | GO:0031234 | extrinsic component of cytoplasmic side of plasma membrane(GO:0031234) |
Gene overrepresentation in molecular function category:
| Log-likelihood per target | Total log-likelihood | Term | Description |
|---|---|---|---|
| 1.9 | 5.8 | GO:0004917 | interleukin-7 receptor activity(GO:0004917) |
| 0.9 | 9.2 | GO:0019863 | IgE binding(GO:0019863) |
| 0.9 | 2.7 | GO:0044715 | 8-oxo-dGDP phosphatase activity(GO:0044715) |
| 0.6 | 2.6 | GO:0003953 | NAD+ nucleosidase activity(GO:0003953) |
| 0.5 | 4.9 | GO:0003828 | alpha-N-acetylneuraminate alpha-2,8-sialyltransferase activity(GO:0003828) |
| 0.4 | 2.6 | GO:0008453 | alanine-glyoxylate transaminase activity(GO:0008453) |
| 0.4 | 6.5 | GO:0004875 | complement receptor activity(GO:0004875) |
| 0.4 | 1.8 | GO:0003943 | N-acetylgalactosamine-4-sulfatase activity(GO:0003943) |
| 0.3 | 2.3 | GO:0030171 | voltage-gated proton channel activity(GO:0030171) |
| 0.3 | 8.9 | GO:0070006 | metalloaminopeptidase activity(GO:0070006) |
| 0.3 | 1.3 | GO:0023024 | MHC class I protein complex binding(GO:0023024) |
| 0.3 | 18.3 | GO:0034987 | immunoglobulin receptor binding(GO:0034987) |
| 0.2 | 2.1 | GO:0003847 | 1-alkyl-2-acetylglycerophosphocholine esterase activity(GO:0003847) |
| 0.2 | 0.9 | GO:0008745 | N-acetylmuramoyl-L-alanine amidase activity(GO:0008745) |
| 0.2 | 3.7 | GO:0005149 | interleukin-1 receptor binding(GO:0005149) |
| 0.2 | 39.0 | GO:0003823 | antigen binding(GO:0003823) |
| 0.2 | 2.2 | GO:0038049 | transcription factor activity, ligand-activated RNA polymerase II transcription factor binding(GO:0038049) |
| 0.2 | 4.1 | GO:0015467 | G-protein activated inward rectifier potassium channel activity(GO:0015467) |
| 0.2 | 0.9 | GO:0016426 | tRNA (adenine) methyltransferase activity(GO:0016426) |
| 0.1 | 0.7 | GO:0008955 | peptidoglycan glycosyltransferase activity(GO:0008955) |
| 0.1 | 0.7 | GO:0046404 | ATP-dependent polydeoxyribonucleotide 5'-hydroxyl-kinase activity(GO:0046404) polydeoxyribonucleotide kinase activity(GO:0051733) ATP-dependent polynucleotide kinase activity(GO:0051734) |
| 0.1 | 0.7 | GO:0035529 | NADH pyrophosphatase activity(GO:0035529) |
| 0.1 | 3.8 | GO:0031435 | mitogen-activated protein kinase kinase kinase binding(GO:0031435) |
| 0.1 | 1.0 | GO:0031962 | mineralocorticoid receptor binding(GO:0031962) |
| 0.1 | 0.5 | GO:0098626 | methylselenol reductase activity(GO:0098625) methylseleninic acid reductase activity(GO:0098626) |
| 0.1 | 3.5 | GO:0031489 | myosin V binding(GO:0031489) |
| 0.1 | 1.0 | GO:1990948 | ligase inhibitor activity(GO:0055104) ubiquitin ligase inhibitor activity(GO:1990948) |
| 0.1 | 0.8 | GO:0004571 | mannosyl-oligosaccharide 1,2-alpha-mannosidase activity(GO:0004571) |
| 0.1 | 3.2 | GO:0001965 | G-protein alpha-subunit binding(GO:0001965) |
| 0.1 | 1.1 | GO:0004523 | RNA-DNA hybrid ribonuclease activity(GO:0004523) |
| 0.1 | 0.7 | GO:0004797 | deoxycytidine kinase activity(GO:0004137) thymidine kinase activity(GO:0004797) |
| 0.1 | 1.8 | GO:0001206 | transcriptional repressor activity, RNA polymerase II distal enhancer sequence-specific binding(GO:0001206) |
| 0.1 | 0.7 | GO:0034046 | poly(G) binding(GO:0034046) |
| 0.1 | 1.1 | GO:0001730 | 2'-5'-oligoadenylate synthetase activity(GO:0001730) |
| 0.1 | 2.3 | GO:0005528 | macrolide binding(GO:0005527) FK506 binding(GO:0005528) |
| 0.1 | 1.1 | GO:0034485 | phosphatidylinositol-3,4,5-trisphosphate 5-phosphatase activity(GO:0034485) |
| 0.1 | 1.5 | GO:0008195 | phosphatidate phosphatase activity(GO:0008195) |
| 0.1 | 0.7 | GO:0097157 | pre-mRNA intronic binding(GO:0097157) |
| 0.1 | 0.2 | GO:0080023 | 3R-hydroxyacyl-CoA dehydratase activity(GO:0080023) |
| 0.0 | 0.7 | GO:0050291 | sphingosine N-acyltransferase activity(GO:0050291) |
| 0.0 | 1.7 | GO:0070300 | phosphatidic acid binding(GO:0070300) |
| 0.0 | 1.0 | GO:0070878 | primary miRNA binding(GO:0070878) |
| 0.0 | 0.6 | GO:0004321 | fatty-acyl-CoA synthase activity(GO:0004321) |
| 0.0 | 1.5 | GO:0032041 | histone deacetylase activity (H3-K14 specific)(GO:0031078) NAD-dependent histone deacetylase activity (H3-K14 specific)(GO:0032041) |
| 0.0 | 1.6 | GO:0003755 | peptidyl-prolyl cis-trans isomerase activity(GO:0003755) |
| 0.0 | 11.4 | GO:0004252 | serine-type endopeptidase activity(GO:0004252) |
| 0.0 | 5.2 | GO:0003725 | double-stranded RNA binding(GO:0003725) |
| 0.0 | 0.8 | GO:0008253 | 5'-nucleotidase activity(GO:0008253) |
| 0.0 | 0.8 | GO:0030297 | transmembrane receptor protein tyrosine kinase activator activity(GO:0030297) |
| 0.0 | 5.1 | GO:0004540 | ribonuclease activity(GO:0004540) |
| 0.0 | 0.6 | GO:0000150 | recombinase activity(GO:0000150) |
| 0.0 | 2.3 | GO:0008138 | protein tyrosine/serine/threonine phosphatase activity(GO:0008138) |
| 0.0 | 0.2 | GO:0030298 | receptor signaling protein tyrosine kinase activator activity(GO:0030298) |
| 0.0 | 2.8 | GO:0004715 | non-membrane spanning protein tyrosine kinase activity(GO:0004715) |
| 0.0 | 0.2 | GO:0032190 | acrosin binding(GO:0032190) |
| 0.0 | 0.8 | GO:0070273 | phosphatidylinositol-4-phosphate binding(GO:0070273) |
| 0.0 | 1.3 | GO:0050699 | WW domain binding(GO:0050699) |
| 0.0 | 13.7 | GO:0005096 | GTPase activator activity(GO:0005096) |
| 0.0 | 0.4 | GO:0005225 | volume-sensitive anion channel activity(GO:0005225) |
| 0.0 | 9.2 | GO:0030246 | carbohydrate binding(GO:0030246) |
| 0.0 | 0.6 | GO:0008175 | tRNA methyltransferase activity(GO:0008175) |
| 0.0 | 0.2 | GO:0097642 | calcitonin family receptor activity(GO:0097642) |
| 0.0 | 0.4 | GO:0042301 | phosphate ion binding(GO:0042301) |
| 0.0 | 0.9 | GO:1990841 | promoter-specific chromatin binding(GO:1990841) |
| 0.0 | 4.1 | GO:0003735 | structural constituent of ribosome(GO:0003735) |
| 0.0 | 0.6 | GO:0003887 | DNA-directed DNA polymerase activity(GO:0003887) |
| 0.0 | 0.5 | GO:0005540 | hyaluronic acid binding(GO:0005540) |
| 0.0 | 0.2 | GO:0019957 | C-C chemokine binding(GO:0019957) |
| 0.0 | 2.0 | GO:0004867 | serine-type endopeptidase inhibitor activity(GO:0004867) |
| 0.0 | 1.3 | GO:0005544 | calcium-dependent phospholipid binding(GO:0005544) |
| 0.0 | 0.8 | GO:0004407 | histone deacetylase activity(GO:0004407) |
| 0.0 | 1.6 | GO:0001158 | enhancer sequence-specific DNA binding(GO:0001158) |
Gene overrepresentation in curated gene sets: canonical pathways category:
| Log-likelihood per target | Total log-likelihood | Term | Description |
|---|---|---|---|
| 0.1 | 3.5 | PID TCR JNK PATHWAY | JNK signaling in the CD4+ TCR pathway |
| 0.1 | 3.7 | PID ANTHRAX PATHWAY | Cellular roles of Anthrax toxin |
| 0.1 | 9.2 | PID IL4 2PATHWAY | IL4-mediated signaling events |
| 0.1 | 5.4 | SIG BCR SIGNALING PATHWAY | Members of the BCR signaling pathway |
| 0.1 | 1.5 | PID RANBP2 PATHWAY | Sumoylation by RanBP2 regulates transcriptional repression |
| 0.1 | 1.1 | PID EPHA2 FWD PATHWAY | EPHA2 forward signaling |
| 0.0 | 6.0 | PID VEGFR1 2 PATHWAY | Signaling events mediated by VEGFR1 and VEGFR2 |
| 0.0 | 2.0 | PID INTEGRIN A9B1 PATHWAY | Alpha9 beta1 integrin signaling events |
| 0.0 | 2.1 | PID LIS1 PATHWAY | Lissencephaly gene (LIS1) in neuronal migration and development |
| 0.0 | 3.4 | PID MTOR 4PATHWAY | mTOR signaling pathway |
| 0.0 | 0.9 | PID WNT CANONICAL PATHWAY | Canonical Wnt signaling pathway |
| 0.0 | 1.0 | PID SMAD2 3PATHWAY | Regulation of cytoplasmic and nuclear SMAD2/3 signaling |
| 0.0 | 1.4 | PID BARD1 PATHWAY | BARD1 signaling events |
| 0.0 | 1.0 | PID RHODOPSIN PATHWAY | Visual signal transduction: Rods |
| 0.0 | 2.4 | PID NOTCH PATHWAY | Notch signaling pathway |
| 0.0 | 5.8 | NABA ECM AFFILIATED | Genes encoding proteins affiliated structurally or functionally to extracellular matrix proteins |
| 0.0 | 2.2 | WNT SIGNALING | Genes related to Wnt-mediated signal transduction |
| 0.0 | 0.9 | PID WNT NONCANONICAL PATHWAY | Noncanonical Wnt signaling pathway |
| 0.0 | 0.8 | PID ERBB NETWORK PATHWAY | ErbB receptor signaling network |
Gene overrepresentation in curated gene sets: REACTOME pathways category:
| Log-likelihood per target | Total log-likelihood | Term | Description |
|---|---|---|---|
| 0.4 | 5.2 | REACTOME TRAF6 MEDIATED IRF7 ACTIVATION IN TLR7 8 OR 9 SIGNALING | Genes involved in TRAF6 mediated IRF7 activation in TLR7/8 or 9 signaling |
| 0.2 | 5.8 | REACTOME IL 7 SIGNALING | Genes involved in Interleukin-7 signaling |
| 0.1 | 2.2 | REACTOME RECEPTOR LIGAND BINDING INITIATES THE SECOND PROTEOLYTIC CLEAVAGE OF NOTCH RECEPTOR | Genes involved in Receptor-ligand binding initiates the second proteolytic cleavage of Notch receptor |
| 0.1 | 3.5 | REACTOME INSULIN SYNTHESIS AND PROCESSING | Genes involved in Insulin Synthesis and Processing |
| 0.1 | 2.1 | REACTOME SYNTHESIS SECRETION AND DEACYLATION OF GHRELIN | Genes involved in Synthesis, Secretion, and Deacylation of Ghrelin |
| 0.1 | 5.1 | REACTOME INHIBITION OF VOLTAGE GATED CA2 CHANNELS VIA GBETA GAMMA SUBUNITS | Genes involved in Inhibition of voltage gated Ca2+ channels via Gbeta/gamma subunits |
| 0.1 | 1.3 | REACTOME THE ACTIVATION OF ARYLSULFATASES | Genes involved in The activation of arylsulfatases |
| 0.1 | 3.5 | REACTOME GENERATION OF SECOND MESSENGER MOLECULES | Genes involved in Generation of second messenger molecules |
| 0.1 | 5.0 | REACTOME FORMATION OF THE TERNARY COMPLEX AND SUBSEQUENTLY THE 43S COMPLEX | Genes involved in Formation of the ternary complex, and subsequently, the 43S complex |
| 0.1 | 2.3 | REACTOME CONVERSION FROM APC C CDC20 TO APC C CDH1 IN LATE ANAPHASE | Genes involved in Conversion from APC/C:Cdc20 to APC/C:Cdh1 in late anaphase |
| 0.1 | 1.5 | REACTOME SYNTHESIS OF PE | Genes involved in Synthesis of PE |
| 0.1 | 1.4 | REACTOME FANCONI ANEMIA PATHWAY | Genes involved in Fanconi Anemia pathway |
| 0.1 | 3.7 | REACTOME IL1 SIGNALING | Genes involved in Interleukin-1 signaling |
| 0.0 | 2.5 | REACTOME DOWNREGULATION OF SMAD2 3 SMAD4 TRANSCRIPTIONAL ACTIVITY | Genes involved in Downregulation of SMAD2/3:SMAD4 transcriptional activity |
| 0.0 | 13.5 | REACTOME SIGNALING BY RHO GTPASES | Genes involved in Signaling by Rho GTPases |
| 0.0 | 1.6 | REACTOME POST CHAPERONIN TUBULIN FOLDING PATHWAY | Genes involved in Post-chaperonin tubulin folding pathway |
| 0.0 | 0.8 | REACTOME PYRIMIDINE CATABOLISM | Genes involved in Pyrimidine catabolism |
| 0.0 | 1.1 | REACTOME IL RECEPTOR SHC SIGNALING | Genes involved in Interleukin receptor SHC signaling |
| 0.0 | 0.7 | REACTOME MRNA DECAY BY 5 TO 3 EXORIBONUCLEASE | Genes involved in mRNA Decay by 5' to 3' Exoribonuclease |
| 0.0 | 0.5 | REACTOME NRIF SIGNALS CELL DEATH FROM THE NUCLEUS | Genes involved in NRIF signals cell death from the nucleus |
| 0.0 | 5.2 | REACTOME CELL SURFACE INTERACTIONS AT THE VASCULAR WALL | Genes involved in Cell surface interactions at the vascular wall |
| 0.0 | 1.3 | REACTOME AMYLOIDS | Genes involved in Amyloids |
| 0.0 | 0.6 | REACTOME NOTCH HLH TRANSCRIPTION PATHWAY | Genes involved in Notch-HLH transcription pathway |
| 0.0 | 0.9 | REACTOME PLATELET SENSITIZATION BY LDL | Genes involved in Platelet sensitization by LDL |
| 0.0 | 2.6 | REACTOME NCAM1 INTERACTIONS | Genes involved in NCAM1 interactions |
| 0.0 | 0.7 | REACTOME PYRIMIDINE METABOLISM | Genes involved in Pyrimidine metabolism |
| 0.0 | 0.7 | REACTOME PROCESSING OF INTRONLESS PRE MRNAS | Genes involved in Processing of Intronless Pre-mRNAs |
| 0.0 | 2.2 | REACTOME PEPTIDE CHAIN ELONGATION | Genes involved in Peptide chain elongation |
| 0.0 | 1.2 | REACTOME ASSOCIATION OF TRIC CCT WITH TARGET PROTEINS DURING BIOSYNTHESIS | Genes involved in Association of TriC/CCT with target proteins during biosynthesis |
| 0.0 | 0.8 | REACTOME SHC1 EVENTS IN ERBB4 SIGNALING | Genes involved in SHC1 events in ERBB4 signaling |
| 0.0 | 0.7 | REACTOME CHONDROITIN SULFATE BIOSYNTHESIS | Genes involved in Chondroitin sulfate biosynthesis |
| 0.0 | 0.7 | REACTOME SPHINGOLIPID DE NOVO BIOSYNTHESIS | Genes involved in Sphingolipid de novo biosynthesis |
| 0.0 | 0.3 | REACTOME CLASS C 3 METABOTROPIC GLUTAMATE PHEROMONE RECEPTORS | Genes involved in Class C/3 (Metabotropic glutamate/pheromone receptors) |
| 0.0 | 1.3 | REACTOME IMMUNOREGULATORY INTERACTIONS BETWEEN A LYMPHOID AND A NON LYMPHOID CELL | Genes involved in Immunoregulatory interactions between a Lymphoid and a non-Lymphoid cell |
| 0.0 | 1.4 | REACTOME INTERFERON ALPHA BETA SIGNALING | Genes involved in Interferon alpha/beta signaling |
| 0.0 | 0.8 | REACTOME TRANSPORT TO THE GOLGI AND SUBSEQUENT MODIFICATION | Genes involved in Transport to the Golgi and subsequent modification |
| 0.0 | 0.5 | REACTOME SYNTHESIS AND INTERCONVERSION OF NUCLEOTIDE DI AND TRIPHOSPHATES | Genes involved in Synthesis and interconversion of nucleotide di- and triphosphates |