Project
Illumina Body Map 2 (GSE30611)
Navigation
Downloads
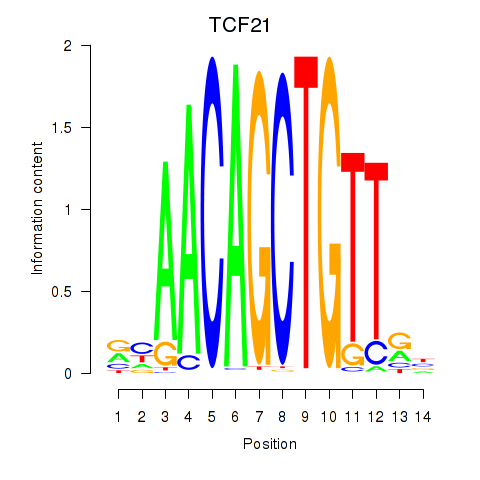
Results for TCF21
Z-value: 1.08
Motif logo
Transcription factors associated with TCF21
| Gene Symbol | Gene ID | Gene Info |
|---|---|---|
|
TCF21
|
ENSG00000118526.7 | transcription factor 21 |
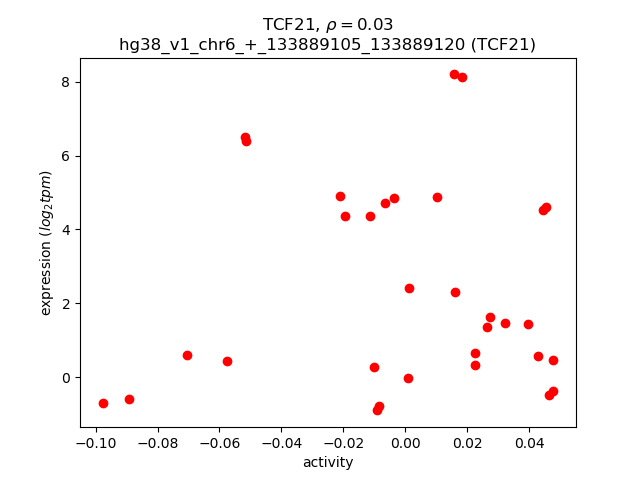
Activity-expression correlation:
| Gene | Promoter | Pearson corr. coef. | P-value | Plot |
|---|---|---|---|---|
| TCF21 | hg38_v1_chr6_+_133889105_133889120 | 0.03 | 8.6e-01 | Click! |
Activity profile of TCF21 motif
Sorted Z-values of TCF21 motif
| Promoter | Log-likelihood | Transcript | Gene | Gene Info |
|---|---|---|---|---|
| chr19_-_45322867 | 5.76 |
ENST00000221476.4
|
CKM
|
creatine kinase, M-type |
| chr11_+_1922779 | 4.29 |
ENST00000641119.1
ENST00000641225.1 ENST00000641787.1 ENST00000397301.5 ENST00000397304.6 ENST00000446240.1 |
TNNT3
|
troponin T3, fast skeletal type |
| chr8_+_85438850 | 3.29 |
ENST00000285381.3
|
CA3
|
carbonic anhydrase 3 |
| chr7_+_80646436 | 3.16 |
ENST00000419819.2
|
CD36
|
CD36 molecule |
| chr16_-_31428325 | 3.14 |
ENST00000287490.5
|
COX6A2
|
cytochrome c oxidase subunit 6A2 |
| chr7_+_80646347 | 3.09 |
ENST00000413265.5
|
CD36
|
CD36 molecule |
| chr1_+_171185293 | 3.08 |
ENST00000209929.10
|
FMO2
|
flavin containing dimethylaniline monoxygenase 2 |
| chr17_+_47209035 | 2.42 |
ENST00000572316.5
ENST00000354968.5 ENST00000576874.5 ENST00000536623.6 |
MYL4
|
myosin light chain 4 |
| chr15_+_57599411 | 2.17 |
ENST00000569089.1
|
MYZAP
|
myocardial zonula adherens protein |
| chr15_+_63048576 | 2.17 |
ENST00000559281.6
|
TPM1
|
tropomyosin 1 |
| chr2_-_218010202 | 2.12 |
ENST00000646520.1
|
TNS1
|
tensin 1 |
| chr19_+_11541125 | 2.10 |
ENST00000587087.5
|
CNN1
|
calponin 1 |
| chr12_-_10723307 | 1.96 |
ENST00000279550.11
ENST00000228251.9 |
YBX3
|
Y-box binding protein 3 |
| chr3_+_8733779 | 1.87 |
ENST00000343849.3
ENST00000397368.2 |
CAV3
|
caveolin 3 |
| chr10_-_7619660 | 1.83 |
ENST00000613909.4
|
ITIH5
|
inter-alpha-trypsin inhibitor heavy chain 5 |
| chr3_+_148865288 | 1.82 |
ENST00000296046.4
|
CPA3
|
carboxypeptidase A3 |
| chr16_+_55488580 | 1.77 |
ENST00000570283.1
|
MMP2
|
matrix metallopeptidase 2 |
| chr3_-_9878765 | 1.75 |
ENST00000430427.6
ENST00000383817.5 ENST00000679265.1 |
CIDEC
|
cell death inducing DFFA like effector c |
| chr17_+_42851167 | 1.72 |
ENST00000613571.1
ENST00000308423.7 |
AOC3
|
amine oxidase copper containing 3 |
| chr1_-_162023632 | 1.67 |
ENST00000367940.2
|
OLFML2B
|
olfactomedin like 2B |
| chr9_+_97853217 | 1.66 |
ENST00000375123.5
|
FOXE1
|
forkhead box E1 |
| chr12_+_12891554 | 1.65 |
ENST00000014914.6
|
GPRC5A
|
G protein-coupled receptor class C group 5 member A |
| chrX_+_151716023 | 1.55 |
ENST00000370350.7
|
FATE1
|
fetal and adult testis expressed 1 |
| chr1_+_167094049 | 1.54 |
ENST00000361200.7
|
STYXL2
|
serine/threonine/tyrosine interacting like 2 |
| chr4_+_168711416 | 1.53 |
ENST00000649826.1
|
PALLD
|
palladin, cytoskeletal associated protein |
| chr14_-_106374129 | 1.50 |
ENST00000390616.2
|
IGHV4-34
|
immunoglobulin heavy variable 4-34 |
| chr4_+_168712159 | 1.45 |
ENST00000510998.5
|
PALLD
|
palladin, cytoskeletal associated protein |
| chr12_-_52519117 | 1.45 |
ENST00000551188.5
|
KRT5
|
keratin 5 |
| chr9_-_101594918 | 1.44 |
ENST00000374806.2
|
PPP3R2
|
protein phosphatase 3 regulatory subunit B, beta |
| chr10_-_95441015 | 1.42 |
ENST00000371241.5
ENST00000354106.7 ENST00000371239.5 ENST00000361941.7 ENST00000277982.9 ENST00000371245.7 |
SORBS1
|
sorbin and SH3 domain containing 1 |
| chr16_+_30372291 | 1.39 |
ENST00000568749.5
|
MYLPF
|
myosin light chain, phosphorylatable, fast skeletal muscle |
| chr9_-_101594995 | 1.37 |
ENST00000636434.1
|
PPP3R2
|
protein phosphatase 3 regulatory subunit B, beta |
| chrX_-_79367307 | 1.32 |
ENST00000373298.7
|
ITM2A
|
integral membrane protein 2A |
| chr12_-_104050112 | 1.30 |
ENST00000547583.1
ENST00000546851.1 ENST00000360814.9 |
GLT8D2
|
glycosyltransferase 8 domain containing 2 |
| chr6_+_116511626 | 1.29 |
ENST00000368599.4
|
CALHM5
|
calcium homeostasis modulator family member 5 |
| chr10_-_29634964 | 1.28 |
ENST00000375398.6
ENST00000355867.8 |
SVIL
|
supervillin |
| chr15_+_63048535 | 1.26 |
ENST00000560959.5
|
TPM1
|
tropomyosin 1 |
| chr15_+_63048658 | 1.26 |
ENST00000560615.5
ENST00000651577.1 |
TPM1
|
tropomyosin 1 |
| chr8_+_141413316 | 1.25 |
ENST00000329397.6
|
PTP4A3
|
protein tyrosine phosphatase 4A3 |
| chr8_+_133017693 | 1.24 |
ENST00000518108.1
|
TG
|
thyroglobulin |
| chr1_-_160711803 | 1.24 |
ENST00000368045.3
ENST00000368046.8 ENST00000613788.1 |
CD48
|
CD48 molecule |
| chr3_+_32391871 | 1.22 |
ENST00000465248.1
|
CMTM7
|
CKLF like MARVEL transmembrane domain containing 7 |
| chr3_+_32391694 | 1.21 |
ENST00000349718.8
|
CMTM7
|
CKLF like MARVEL transmembrane domain containing 7 |
| chr2_-_127643212 | 1.19 |
ENST00000409286.5
|
LIMS2
|
LIM zinc finger domain containing 2 |
| chr21_+_10521569 | 1.18 |
ENST00000612957.4
ENST00000427445.6 ENST00000612746.1 ENST00000618007.5 |
TPTE
|
transmembrane phosphatase with tensin homology |
| chr15_+_63048436 | 1.17 |
ENST00000334895.10
ENST00000404484.9 ENST00000558910.3 ENST00000317516.12 |
TPM1
|
tropomyosin 1 |
| chr7_+_150716603 | 1.16 |
ENST00000307194.6
ENST00000611999.4 |
GIMAP1
GIMAP1-GIMAP5
|
GTPase, IMAP family member 1 GIMAP1-GIMAP5 readthrough |
| chr7_-_48029102 | 1.16 |
ENST00000297325.9
ENST00000412142.5 ENST00000395572.6 |
SUN3
|
Sad1 and UNC84 domain containing 3 |
| chr1_+_212565334 | 1.13 |
ENST00000366981.8
ENST00000366987.6 |
ATF3
|
activating transcription factor 3 |
| chr8_+_66043413 | 1.12 |
ENST00000522619.1
|
DNAJC5B
|
DnaJ heat shock protein family (Hsp40) member C5 beta |
| chr19_-_49325181 | 1.10 |
ENST00000454748.7
ENST00000335875.9 ENST00000598828.1 |
SLC6A16
|
solute carrier family 6 member 16 |
| chr1_+_99646025 | 1.09 |
ENST00000263174.9
ENST00000605497.5 ENST00000615664.1 |
PALMD
|
palmdelphin |
| chr11_+_1870871 | 1.09 |
ENST00000417766.5
|
LSP1
|
lymphocyte specific protein 1 |
| chr5_-_170389349 | 1.09 |
ENST00000274629.9
|
KCNMB1
|
potassium calcium-activated channel subfamily M regulatory beta subunit 1 |
| chr9_+_110090197 | 1.09 |
ENST00000480388.1
|
PALM2AKAP2
|
PALM2 and AKAP2 fusion |
| chr17_+_47209338 | 1.08 |
ENST00000393450.5
|
MYL4
|
myosin light chain 4 |
| chr3_+_32391841 | 1.08 |
ENST00000334983.10
|
CMTM7
|
CKLF like MARVEL transmembrane domain containing 7 |
| chr1_+_22636577 | 1.08 |
ENST00000374642.8
ENST00000438241.1 |
C1QA
|
complement C1q A chain |
| chr22_+_22922594 | 1.06 |
ENST00000390331.3
|
IGLC7
|
immunoglobulin lambda constant 7 |
| chrX_+_151716068 | 1.04 |
ENST00000417321.1
|
FATE1
|
fetal and adult testis expressed 1 |
| chr1_-_205422050 | 1.03 |
ENST00000367153.9
|
LEMD1
|
LEM domain containing 1 |
| chr1_+_172452885 | 1.03 |
ENST00000367725.4
|
C1orf105
|
chromosome 1 open reading frame 105 |
| chr9_+_68356603 | 1.03 |
ENST00000396396.6
|
PGM5
|
phosphoglucomutase 5 |
| chr6_-_31729260 | 1.02 |
ENST00000375789.7
|
DDAH2
|
dimethylarginine dimethylaminohydrolase 2 |
| chr8_-_41665261 | 1.02 |
ENST00000522231.5
ENST00000314214.12 ENST00000348036.8 ENST00000522543.5 |
ANK1
|
ankyrin 1 |
| chr2_+_37950432 | 1.01 |
ENST00000407257.5
ENST00000417700.6 ENST00000234195.7 ENST00000442857.5 |
RMDN2
|
regulator of microtubule dynamics 2 |
| chr3_-_52834901 | 1.00 |
ENST00000486659.5
|
MUSTN1
|
musculoskeletal, embryonic nuclear protein 1 |
| chr6_-_31728877 | 1.00 |
ENST00000437288.5
|
DDAH2
|
dimethylarginine dimethylaminohydrolase 2 |
| chr7_+_134565098 | 1.00 |
ENST00000652743.1
|
AKR1B15
|
aldo-keto reductase family 1 member B15 |
| chr3_-_52835011 | 0.99 |
ENST00000446157.3
|
MUSTN1
|
musculoskeletal, embryonic nuclear protein 1 |
| chr17_+_79034185 | 0.99 |
ENST00000581774.5
|
C1QTNF1
|
C1q and TNF related 1 |
| chr18_+_3247778 | 0.99 |
ENST00000217652.8
ENST00000578611.5 ENST00000583449.1 |
MYL12A
|
myosin light chain 12A |
| chr6_-_31729478 | 0.96 |
ENST00000436437.2
|
DDAH2
|
dimethylarginine dimethylaminohydrolase 2 |
| chr1_+_153628393 | 0.94 |
ENST00000368696.3
ENST00000292169.6 ENST00000436839.1 |
S100A1
|
S100 calcium binding protein A1 |
| chr6_-_30690968 | 0.93 |
ENST00000376420.9
ENST00000376421.7 |
NRM
|
nurim |
| chr18_+_6834473 | 0.90 |
ENST00000581099.5
ENST00000419673.6 ENST00000531294.5 |
ARHGAP28
|
Rho GTPase activating protein 28 |
| chr19_+_46298382 | 0.89 |
ENST00000244303.10
ENST00000533145.5 ENST00000472815.5 |
HIF3A
|
hypoxia inducible factor 3 subunit alpha |
| chr10_+_92689946 | 0.89 |
ENST00000282728.10
|
HHEX
|
hematopoietically expressed homeobox |
| chr2_+_37950476 | 0.87 |
ENST00000402091.3
|
RMDN2
|
regulator of microtubule dynamics 2 |
| chr17_-_7290392 | 0.87 |
ENST00000571464.1
|
YBX2
|
Y-box binding protein 2 |
| chr11_-_1486763 | 0.84 |
ENST00000329957.7
|
MOB2
|
MOB kinase activator 2 |
| chr13_-_77919459 | 0.83 |
ENST00000643890.1
|
EDNRB
|
endothelin receptor type B |
| chr12_-_50283472 | 0.83 |
ENST00000551691.5
ENST00000394943.7 ENST00000341247.8 |
LIMA1
|
LIM domain and actin binding 1 |
| chr2_+_219434825 | 0.83 |
ENST00000312358.12
|
SPEG
|
striated muscle enriched protein kinase |
| chr3_-_105869035 | 0.82 |
ENST00000447441.6
ENST00000403724.5 ENST00000405772.5 |
CBLB
|
Cbl proto-oncogene B |
| chr17_-_3513768 | 0.82 |
ENST00000570318.1
ENST00000541913.5 |
SPATA22
|
spermatogenesis associated 22 |
| chr6_+_28259285 | 0.82 |
ENST00000343684.4
|
NKAPL
|
NFKB activating protein like |
| chr2_-_88979016 | 0.82 |
ENST00000390247.2
|
IGKV3-7
|
immunoglobulin kappa variable 3-7 (non-functional) |
| chr22_+_37675629 | 0.81 |
ENST00000215909.10
|
LGALS1
|
galectin 1 |
| chr11_+_47248924 | 0.81 |
ENST00000481889.6
ENST00000436778.5 ENST00000531660.5 ENST00000407404.5 |
NR1H3
|
nuclear receptor subfamily 1 group H member 3 |
| chr5_+_136028979 | 0.81 |
ENST00000442011.7
|
TGFBI
|
transforming growth factor beta induced |
| chr10_+_121989187 | 0.81 |
ENST00000513429.5
ENST00000515273.5 ENST00000515603.5 |
TACC2
|
transforming acidic coiled-coil containing protein 2 |
| chr21_+_10521536 | 0.80 |
ENST00000622113.4
|
TPTE
|
transmembrane phosphatase with tensin homology |
| chr10_+_121989138 | 0.80 |
ENST00000369005.6
|
TACC2
|
transforming acidic coiled-coil containing protein 2 |
| chr3_-_177197210 | 0.79 |
ENST00000431421.5
ENST00000422066.5 ENST00000413084.5 ENST00000673974.1 ENST00000422442.6 |
TBL1XR1
|
TBL1X receptor 1 |
| chr2_+_46479565 | 0.79 |
ENST00000434431.2
|
TMEM247
|
transmembrane protein 247 |
| chr2_-_157439403 | 0.79 |
ENST00000418920.5
|
CYTIP
|
cytohesin 1 interacting protein |
| chr3_-_105868964 | 0.79 |
ENST00000394030.8
|
CBLB
|
Cbl proto-oncogene B |
| chr8_+_143213192 | 0.79 |
ENST00000622500.2
|
GPIHBP1
|
glycosylphosphatidylinositol anchored high density lipoprotein binding protein 1 |
| chr6_-_31729785 | 0.79 |
ENST00000416410.6
|
DDAH2
|
dimethylarginine dimethylaminohydrolase 2 |
| chr7_+_150737382 | 0.78 |
ENST00000358647.5
|
GIMAP5
|
GTPase, IMAP family member 5 |
| chr5_-_170389634 | 0.78 |
ENST00000521859.1
|
KCNMB1
|
potassium calcium-activated channel subfamily M regulatory beta subunit 1 |
| chr5_-_151093566 | 0.76 |
ENST00000521001.1
|
TNIP1
|
TNFAIP3 interacting protein 1 |
| chr6_+_54083423 | 0.75 |
ENST00000460844.6
ENST00000370876.6 |
MLIP
|
muscular LMNA interacting protein |
| chr5_-_180802790 | 0.74 |
ENST00000504671.1
ENST00000507384.1 ENST00000307826.5 |
MGAT1
|
alpha-1,3-mannosyl-glycoprotein 2-beta-N-acetylglucosaminyltransferase |
| chrX_-_107717054 | 0.74 |
ENST00000503515.1
ENST00000372397.6 |
TSC22D3
|
TSC22 domain family member 3 |
| chr4_+_122923067 | 0.73 |
ENST00000675612.1
ENST00000274008.5 |
SPATA5
|
spermatogenesis associated 5 |
| chr2_+_87338511 | 0.73 |
ENST00000421835.2
|
IGKV3OR2-268
|
immunoglobulin kappa variable 3/OR2-268 (non-functional) |
| chr19_-_12778412 | 0.72 |
ENST00000589400.5
ENST00000590839.5 ENST00000592079.5 |
HOOK2
|
hook microtubule tethering protein 2 |
| chr22_-_21952827 | 0.72 |
ENST00000397495.8
ENST00000263212.10 |
PPM1F
|
protein phosphatase, Mg2+/Mn2+ dependent 1F |
| chr16_+_85902689 | 0.72 |
ENST00000563180.1
ENST00000564617.5 ENST00000564803.5 |
IRF8
|
interferon regulatory factor 8 |
| chr2_+_218672291 | 0.72 |
ENST00000440309.5
ENST00000424080.1 |
STK36
|
serine/threonine kinase 36 |
| chr22_+_44031345 | 0.72 |
ENST00000444029.5
|
PARVB
|
parvin beta |
| chr7_-_122702912 | 0.72 |
ENST00000447240.1
ENST00000434824.2 |
RNF148
|
ring finger protein 148 |
| chr8_-_41665200 | 0.71 |
ENST00000335651.6
|
ANK1
|
ankyrin 1 |
| chr3_-_177197248 | 0.71 |
ENST00000427349.5
ENST00000352800.10 |
TBL1XR1
|
TBL1X receptor 1 |
| chr8_+_25459190 | 0.71 |
ENST00000380665.3
ENST00000330560.8 |
CDCA2
|
cell division cycle associated 2 |
| chr22_-_23580223 | 0.70 |
ENST00000249053.3
ENST00000330377.3 ENST00000438703.1 |
IGLL1
|
immunoglobulin lambda like polypeptide 1 |
| chr2_+_230416239 | 0.70 |
ENST00000409824.5
ENST00000409341.5 ENST00000409112.5 |
SP100
|
SP100 nuclear antigen |
| chr20_+_31739260 | 0.70 |
ENST00000340513.4
ENST00000300403.11 |
TPX2
|
TPX2 microtubule nucleation factor |
| chr11_+_47248885 | 0.69 |
ENST00000395397.7
ENST00000405576.5 |
NR1H3
|
nuclear receptor subfamily 1 group H member 3 |
| chr7_+_121076570 | 0.69 |
ENST00000443817.1
|
CPED1
|
cadherin like and PC-esterase domain containing 1 |
| chr19_-_39833615 | 0.69 |
ENST00000593685.5
ENST00000600611.5 |
DYRK1B
|
dual specificity tyrosine phosphorylation regulated kinase 1B |
| chr17_+_4583998 | 0.69 |
ENST00000338859.8
|
SMTNL2
|
smoothelin like 2 |
| chr1_+_145927105 | 0.68 |
ENST00000437797.5
ENST00000601726.3 ENST00000599626.5 ENST00000599147.5 ENST00000595494.5 ENST00000595518.5 ENST00000597144.5 ENST00000599469.5 ENST00000598354.5 ENST00000598103.5 ENST00000600340.5 ENST00000630257.2 ENST00000625258.1 |
LIX1L-AS1
ENSG00000280778.1
|
LIX1L antisense RNA 1 novel protein, lncRNA-POLR3GL readthrough |
| chr6_-_11382247 | 0.68 |
ENST00000397378.7
ENST00000513989.5 ENST00000508546.5 ENST00000504387.5 |
NEDD9
|
neural precursor cell expressed, developmentally down-regulated 9 |
| chr2_+_56183973 | 0.68 |
ENST00000407595.3
|
CCDC85A
|
coiled-coil domain containing 85A |
| chr9_+_27109135 | 0.68 |
ENST00000519097.5
ENST00000615002.4 |
TEK
|
TEK receptor tyrosine kinase |
| chr2_+_102104563 | 0.68 |
ENST00000409589.5
ENST00000409329.5 |
IL1R1
|
interleukin 1 receptor type 1 |
| chr14_-_106811131 | 0.67 |
ENST00000424969.2
|
IGHV3-74
|
immunoglobulin heavy variable 3-74 |
| chr4_-_46909235 | 0.67 |
ENST00000505102.1
ENST00000355591.8 |
COX7B2
|
cytochrome c oxidase subunit 7B2 |
| chr2_+_230416156 | 0.67 |
ENST00000427101.6
|
SP100
|
SP100 nuclear antigen |
| chr3_-_177197429 | 0.67 |
ENST00000457928.7
|
TBL1XR1
|
TBL1X receptor 1 |
| chr1_-_23531206 | 0.66 |
ENST00000361729.3
|
E2F2
|
E2F transcription factor 2 |
| chr6_+_18387326 | 0.66 |
ENST00000259939.4
|
RNF144B
|
ring finger protein 144B |
| chr15_+_43792839 | 0.65 |
ENST00000409614.1
|
SERF2
|
small EDRK-rich factor 2 |
| chr13_-_77919390 | 0.65 |
ENST00000475537.2
ENST00000646605.1 |
EDNRB
|
endothelin receptor type B |
| chr11_-_74949079 | 0.64 |
ENST00000528219.5
ENST00000684022.1 ENST00000531852.5 |
XRRA1
|
X-ray radiation resistance associated 1 |
| chr11_+_827545 | 0.64 |
ENST00000528542.6
|
CRACR2B
|
calcium release activated channel regulator 2B |
| chr11_-_74949114 | 0.63 |
ENST00000527087.5
|
XRRA1
|
X-ray radiation resistance associated 1 |
| chr1_+_186296267 | 0.63 |
ENST00000533951.5
ENST00000367482.8 ENST00000635041.1 ENST00000367483.8 ENST00000367485.4 ENST00000445192.7 |
PRG4
|
proteoglycan 4 |
| chr8_-_94949350 | 0.63 |
ENST00000448464.6
ENST00000342697.5 |
TP53INP1
|
tumor protein p53 inducible nuclear protein 1 |
| chr2_+_218672027 | 0.62 |
ENST00000392105.7
ENST00000455724.5 ENST00000295709.8 |
STK36
|
serine/threonine kinase 36 |
| chr11_-_74949020 | 0.62 |
ENST00000525407.5
|
XRRA1
|
X-ray radiation resistance associated 1 |
| chr12_+_16347637 | 0.62 |
ENST00000543076.5
ENST00000396210.8 |
MGST1
|
microsomal glutathione S-transferase 1 |
| chr2_+_90234809 | 0.62 |
ENST00000443397.5
|
IGKV3D-7
|
immunoglobulin kappa variable 3D-7 |
| chr11_+_33258304 | 0.61 |
ENST00000531504.5
ENST00000456517.2 |
HIPK3
|
homeodomain interacting protein kinase 3 |
| chr20_+_38581186 | 0.61 |
ENST00000373348.4
ENST00000537425.2 ENST00000416116.2 |
ADIG
|
adipogenin |
| chr7_-_76627240 | 0.61 |
ENST00000275569.8
ENST00000310842.9 |
POMZP3
|
POM121 and ZP3 fusion |
| chr9_-_127778659 | 0.61 |
ENST00000314830.13
|
SH2D3C
|
SH2 domain containing 3C |
| chr19_-_33225844 | 0.61 |
ENST00000253188.8
|
SLC7A10
|
solute carrier family 7 member 10 |
| chr2_-_233854566 | 0.61 |
ENST00000432087.5
ENST00000441687.5 ENST00000414924.5 |
HJURP
|
Holliday junction recognition protein |
| chr12_+_8697875 | 0.61 |
ENST00000357529.7
|
RIMKLB
|
ribosomal modification protein rimK like family member B |
| chr1_+_24556087 | 0.60 |
ENST00000374392.3
|
NCMAP
|
non-compact myelin associated protein |
| chr12_+_8697945 | 0.60 |
ENST00000535829.6
|
RIMKLB
|
ribosomal modification protein rimK like family member B |
| chr2_+_230416190 | 0.60 |
ENST00000340126.9
ENST00000432979.5 |
SP100
|
SP100 nuclear antigen |
| chr11_-_88175432 | 0.60 |
ENST00000531138.1
ENST00000526372.1 ENST00000243662.11 |
RAB38
|
RAB38, member RAS oncogene family |
| chr13_-_103066411 | 0.59 |
ENST00000245312.5
|
SLC10A2
|
solute carrier family 10 member 2 |
| chr15_+_89243945 | 0.59 |
ENST00000674831.1
ENST00000300027.12 ENST00000567891.5 ENST00000310775.12 ENST00000676003.1 ENST00000564920.5 ENST00000565255.5 ENST00000567996.5 ENST00000563250.5 |
FANCI
|
FA complementation group I |
| chr13_-_41061373 | 0.59 |
ENST00000405737.2
|
ELF1
|
E74 like ETS transcription factor 1 |
| chr11_+_827913 | 0.59 |
ENST00000525077.2
|
CRACR2B
|
calcium release activated channel regulator 2B |
| chr17_-_7394800 | 0.59 |
ENST00000574401.5
|
PLSCR3
|
phospholipid scramblase 3 |
| chrX_-_11427725 | 0.59 |
ENST00000380736.5
|
ARHGAP6
|
Rho GTPase activating protein 6 |
| chr4_-_46909206 | 0.58 |
ENST00000396533.5
|
COX7B2
|
cytochrome c oxidase subunit 7B2 |
| chr1_+_27935022 | 0.58 |
ENST00000411604.5
ENST00000373888.8 |
SMPDL3B
|
sphingomyelin phosphodiesterase acid like 3B |
| chr15_-_42457513 | 0.58 |
ENST00000565611.5
ENST00000263805.8 |
ZNF106
|
zinc finger protein 106 |
| chr11_-_16397521 | 0.58 |
ENST00000533411.5
|
SOX6
|
SRY-box transcription factor 6 |
| chr20_-_3682218 | 0.58 |
ENST00000379861.8
|
ADAM33
|
ADAM metallopeptidase domain 33 |
| chr13_-_77918788 | 0.57 |
ENST00000626030.1
|
EDNRB
|
endothelin receptor type B |
| chr1_-_201469151 | 0.57 |
ENST00000367311.5
ENST00000367309.1 |
PHLDA3
|
pleckstrin homology like domain family A member 3 |
| chr17_-_7394514 | 0.57 |
ENST00000571802.1
ENST00000619711.5 ENST00000576201.5 ENST00000573213.1 ENST00000324822.15 |
PLSCR3
|
phospholipid scramblase 3 |
| chrX_+_48574477 | 0.56 |
ENST00000376759.8
|
RBM3
|
RNA binding motif protein 3 |
| chr17_-_15262537 | 0.56 |
ENST00000395936.7
ENST00000675819.1 ENST00000674707.1 ENST00000675854.1 ENST00000426385.4 ENST00000395938.7 ENST00000612492.5 ENST00000675808.1 |
PMP22
|
peripheral myelin protein 22 |
| chr15_-_78811415 | 0.56 |
ENST00000388820.5
|
ADAMTS7
|
ADAM metallopeptidase with thrombospondin type 1 motif 7 |
| chr8_-_19682576 | 0.56 |
ENST00000332246.10
|
CSGALNACT1
|
chondroitin sulfate N-acetylgalactosaminyltransferase 1 |
| chr22_+_38656627 | 0.56 |
ENST00000411557.5
ENST00000396811.6 ENST00000216029.7 ENST00000416285.5 |
CBY1
|
chibby family member 1, beta catenin antagonist |
| chr17_-_41102209 | 0.56 |
ENST00000440582.1
|
KRTAP4-16
|
keratin associated protein 4-16 |
| chr11_+_59142811 | 0.55 |
ENST00000676459.1
ENST00000675163.1 ENST00000684135.1 ENST00000682018.1 ENST00000675806.2 ENST00000529985.3 ENST00000676340.1 ENST00000674617.1 |
FAM111A
|
FAM111 trypsin like peptidase A |
| chr8_-_9150648 | 0.55 |
ENST00000310455.4
|
PPP1R3B
|
protein phosphatase 1 regulatory subunit 3B |
| chr3_-_169146527 | 0.55 |
ENST00000475754.5
ENST00000484519.5 |
MECOM
|
MDS1 and EVI1 complex locus |
| chr15_-_42457556 | 0.55 |
ENST00000565948.1
|
ZNF106
|
zinc finger protein 106 |
| chr12_+_16347665 | 0.55 |
ENST00000535309.5
ENST00000540056.5 ENST00000396209.5 ENST00000540126.5 |
MGST1
|
microsomal glutathione S-transferase 1 |
| chr9_+_27109200 | 0.54 |
ENST00000380036.10
|
TEK
|
TEK receptor tyrosine kinase |
| chr6_+_44216914 | 0.54 |
ENST00000573382.3
ENST00000576476.1 |
MYMX
|
myomixer, myoblast fusion factor |
| chr16_-_3372666 | 0.54 |
ENST00000399974.5
|
MTRNR2L4
|
MT-RNR2 like 4 |
| chr19_-_17075418 | 0.53 |
ENST00000253669.10
|
HAUS8
|
HAUS augmin like complex subunit 8 |
| chr4_+_127730386 | 0.53 |
ENST00000281154.6
|
SLC25A31
|
solute carrier family 25 member 31 |
| chr18_+_23949847 | 0.53 |
ENST00000588004.1
|
LAMA3
|
laminin subunit alpha 3 |
| chr11_-_74949142 | 0.52 |
ENST00000321448.12
ENST00000340360.10 |
XRRA1
|
X-ray radiation resistance associated 1 |
| chr2_-_213151590 | 0.52 |
ENST00000374319.8
ENST00000457361.5 ENST00000451136.6 ENST00000434687.6 |
IKZF2
|
IKAROS family zinc finger 2 |
| chr20_-_1184981 | 0.52 |
ENST00000429036.2
|
TMEM74B
|
transmembrane protein 74B |
| chr15_+_94297939 | 0.52 |
ENST00000357742.9
|
MCTP2
|
multiple C2 and transmembrane domain containing 2 |
| chr20_-_3239181 | 0.51 |
ENST00000644692.1
ENST00000642402.1 ENST00000644011.1 ENST00000647296.1 |
SLC4A11
|
solute carrier family 4 member 11 |
| chr5_+_170861990 | 0.51 |
ENST00000523189.6
|
RANBP17
|
RAN binding protein 17 |
| chr1_-_1206541 | 0.50 |
ENST00000328596.10
ENST00000379265.5 ENST00000379268.7 |
TNFRSF18
|
TNF receptor superfamily member 18 |
| chr1_+_204073104 | 0.50 |
ENST00000367204.6
|
SOX13
|
SRY-box transcription factor 13 |
| chr7_-_133082032 | 0.49 |
ENST00000448878.6
ENST00000262570.10 |
CHCHD3
|
coiled-coil-helix-coiled-coil-helix domain containing 3 |
| chr15_+_75195613 | 0.47 |
ENST00000563905.5
|
C15orf39
|
chromosome 15 open reading frame 39 |
| chr10_+_35126791 | 0.47 |
ENST00000474362.5
ENST00000374721.7 |
CREM
|
cAMP responsive element modulator |
| chr11_-_59866478 | 0.47 |
ENST00000257264.4
|
TCN1
|
transcobalamin 1 |
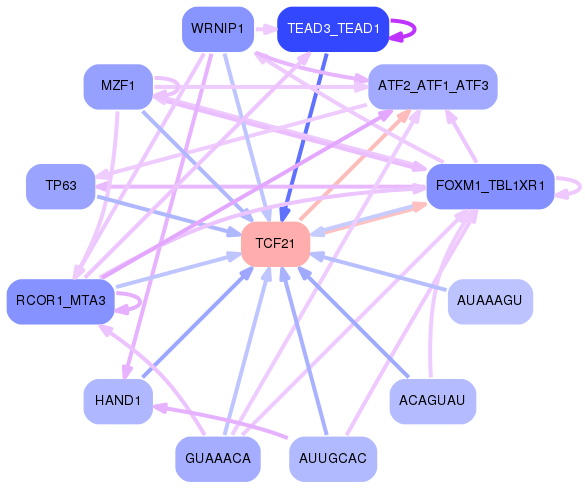
Network of associatons between targets according to the STRING database.

First level regulatory network of TCF21
Gene Ontology Analysis
Gene overrepresentation in biological process category:
| Log-likelihood per target | Total log-likelihood | Term | Description |
|---|---|---|---|
| 1.2 | 5.9 | GO:0003065 | positive regulation of heart rate by epinephrine(GO:0003065) |
| 0.9 | 3.5 | GO:0002337 | B-1a B cell differentiation(GO:0002337) |
| 0.5 | 2.6 | GO:0051562 | negative regulation of mitochondrial calcium ion concentration(GO:0051562) |
| 0.5 | 2.4 | GO:0035645 | enteric smooth muscle cell differentiation(GO:0035645) |
| 0.5 | 6.2 | GO:2000334 | response to linoleic acid(GO:0070543) blood microparticle formation(GO:0072564) regulation of blood microparticle formation(GO:2000332) positive regulation of blood microparticle formation(GO:2000334) |
| 0.4 | 1.2 | GO:0071449 | cellular response to lipid hydroperoxide(GO:0071449) |
| 0.4 | 1.9 | GO:1903413 | cellular response to bile acid(GO:1903413) |
| 0.4 | 2.1 | GO:0002317 | plasma cell differentiation(GO:0002317) |
| 0.3 | 5.8 | GO:0006600 | creatine metabolic process(GO:0006600) |
| 0.3 | 3.1 | GO:0070995 | NADPH oxidation(GO:0070995) |
| 0.3 | 0.9 | GO:1904425 | negative regulation of GTP binding(GO:1904425) |
| 0.3 | 1.5 | GO:0090341 | negative regulation of secretion of lysosomal enzymes(GO:0090341) |
| 0.3 | 0.9 | GO:0061011 | hepatic duct development(GO:0061011) |
| 0.3 | 0.9 | GO:0009386 | translational attenuation(GO:0009386) |
| 0.3 | 1.7 | GO:1902283 | negative regulation of primary amine oxidase activity(GO:1902283) |
| 0.3 | 1.1 | GO:1903984 | regulation of transcription from RNA polymerase II promoter in response to arsenic-containing substance(GO:0061394) positive regulation of TRAIL-activated apoptotic signaling pathway(GO:1903984) |
| 0.3 | 1.3 | GO:0007228 | positive regulation of hh target transcription factor activity(GO:0007228) |
| 0.2 | 0.7 | GO:0071283 | regulation of chromosome condensation(GO:0060623) cellular response to iron(III) ion(GO:0071283) |
| 0.2 | 0.7 | GO:0035445 | borate transmembrane transport(GO:0035445) borate transport(GO:0046713) |
| 0.2 | 2.0 | GO:1902044 | regulation of Fas signaling pathway(GO:1902044) |
| 0.2 | 1.9 | GO:0048014 | Tie signaling pathway(GO:0048014) |
| 0.2 | 1.9 | GO:0060373 | regulation of ventricular cardiac muscle cell membrane depolarization(GO:0060373) |
| 0.2 | 0.8 | GO:0000711 | meiotic DNA repair synthesis(GO:0000711) |
| 0.2 | 2.0 | GO:2000767 | positive regulation of cytoplasmic translation(GO:2000767) |
| 0.2 | 1.4 | GO:0060023 | soft palate development(GO:0060023) |
| 0.2 | 0.8 | GO:0085032 | modulation of signal transduction in other organism(GO:0044501) modulation by symbiont of host signal transduction pathway(GO:0052027) modulation of signal transduction in other organism involved in symbiotic interaction(GO:0052250) modulation by symbiont of host I-kappaB kinase/NF-kappaB cascade(GO:0085032) |
| 0.2 | 1.0 | GO:0035803 | egg coat formation(GO:0035803) |
| 0.2 | 0.7 | GO:1990086 | lens fiber cell apoptotic process(GO:1990086) |
| 0.2 | 3.8 | GO:0000052 | citrulline metabolic process(GO:0000052) arginine catabolic process(GO:0006527) |
| 0.2 | 1.8 | GO:0001957 | intramembranous ossification(GO:0001957) direct ossification(GO:0036072) |
| 0.2 | 0.6 | GO:1904761 | negative regulation of myofibroblast differentiation(GO:1904761) |
| 0.1 | 3.6 | GO:0007175 | negative regulation of epidermal growth factor-activated receptor activity(GO:0007175) |
| 0.1 | 2.4 | GO:0060613 | fat pad development(GO:0060613) |
| 0.1 | 1.0 | GO:2000860 | positive regulation of mineralocorticoid secretion(GO:2000857) positive regulation of aldosterone secretion(GO:2000860) |
| 0.1 | 0.6 | GO:0032290 | peripheral nervous system myelin formation(GO:0032290) |
| 0.1 | 0.7 | GO:2000661 | positive regulation of interleukin-1-mediated signaling pathway(GO:2000661) |
| 0.1 | 0.8 | GO:0010986 | positive regulation of lipoprotein particle clearance(GO:0010986) |
| 0.1 | 0.3 | GO:0042946 | glucoside transport(GO:0042946) glycoside transport(GO:1901656) |
| 0.1 | 2.1 | GO:1904706 | negative regulation of vascular smooth muscle cell proliferation(GO:1904706) |
| 0.1 | 0.7 | GO:0006049 | UDP-N-acetylglucosamine catabolic process(GO:0006049) |
| 0.1 | 0.6 | GO:1903232 | melanosome assembly(GO:1903232) |
| 0.1 | 0.3 | GO:0002380 | immunoglobulin secretion involved in immune response(GO:0002380) |
| 0.1 | 1.2 | GO:0015705 | iodide transport(GO:0015705) |
| 0.1 | 2.8 | GO:0003334 | keratinocyte development(GO:0003334) |
| 0.1 | 0.7 | GO:0033277 | abortive mitotic cell cycle(GO:0033277) |
| 0.1 | 0.6 | GO:0050653 | chondroitin sulfate proteoglycan biosynthetic process, polysaccharide chain biosynthetic process(GO:0050653) |
| 0.1 | 2.4 | GO:0006123 | mitochondrial electron transport, cytochrome c to oxygen(GO:0006123) |
| 0.1 | 8.0 | GO:0030049 | muscle filament sliding(GO:0030049) actin-myosin filament sliding(GO:0033275) |
| 0.1 | 1.2 | GO:0006268 | DNA unwinding involved in DNA replication(GO:0006268) |
| 0.1 | 0.7 | GO:0070236 | negative regulation of activation-induced cell death of T cells(GO:0070236) |
| 0.1 | 0.4 | GO:0070173 | regulation of enamel mineralization(GO:0070173) |
| 0.1 | 0.3 | GO:0006121 | mitochondrial electron transport, succinate to ubiquinone(GO:0006121) |
| 0.1 | 0.3 | GO:0016476 | regulation of embryonic cell shape(GO:0016476) |
| 0.1 | 1.6 | GO:0035090 | maintenance of apical/basal cell polarity(GO:0035090) maintenance of epithelial cell apical/basal polarity(GO:0045199) |
| 0.1 | 0.4 | GO:0032445 | fructose import(GO:0032445) carbohydrate import into cell(GO:0097319) carbohydrate import across plasma membrane(GO:0098704) fructose import across plasma membrane(GO:1990539) |
| 0.1 | 0.2 | GO:0006391 | transcription initiation from mitochondrial promoter(GO:0006391) |
| 0.1 | 1.2 | GO:0043117 | positive regulation of vascular permeability(GO:0043117) |
| 0.1 | 0.7 | GO:0071963 | establishment or maintenance of cell polarity regulating cell shape(GO:0071963) |
| 0.1 | 1.0 | GO:0006685 | sphingomyelin catabolic process(GO:0006685) |
| 0.1 | 0.3 | GO:1904398 | positive regulation of neuromuscular junction development(GO:1904398) |
| 0.1 | 0.3 | GO:0003069 | age-dependent response to oxidative stress(GO:0001306) age-dependent response to reactive oxygen species(GO:0001315) regulation of systemic arterial blood pressure by acetylcholine(GO:0003068) vasodilation by acetylcholine involved in regulation of systemic arterial blood pressure(GO:0003069) regulation of systemic arterial blood pressure by neurotransmitter(GO:0003070) age-dependent general metabolic decline(GO:0007571) |
| 0.1 | 0.2 | GO:1900229 | biofilm formation(GO:0042710) single-species biofilm formation(GO:0044010) single-species biofilm formation in or on host organism(GO:0044407) regulation of single-species biofilm formation(GO:1900190) negative regulation of single-species biofilm formation(GO:1900191) regulation of single-species biofilm formation in or on host organism(GO:1900228) negative regulation of single-species biofilm formation in or on host organism(GO:1900229) |
| 0.1 | 0.4 | GO:0071896 | protein localization to adherens junction(GO:0071896) |
| 0.1 | 1.8 | GO:0002003 | angiotensin maturation(GO:0002003) |
| 0.1 | 0.1 | GO:0070827 | chromatin maintenance(GO:0070827) |
| 0.1 | 0.3 | GO:0050902 | leukocyte adhesive activation(GO:0050902) |
| 0.1 | 0.2 | GO:0036496 | regulation of translational initiation by eIF2 alpha dephosphorylation(GO:0036496) |
| 0.1 | 0.5 | GO:0045586 | regulation of gamma-delta T cell differentiation(GO:0045586) |
| 0.1 | 1.8 | GO:0034389 | lipid particle organization(GO:0034389) |
| 0.1 | 2.0 | GO:0031581 | hemidesmosome assembly(GO:0031581) |
| 0.1 | 0.2 | GO:0035638 | patched ligand maturation(GO:0007225) signal maturation(GO:0035638) |
| 0.1 | 0.3 | GO:0051643 | endoplasmic reticulum localization(GO:0051643) |
| 0.1 | 0.2 | GO:0046391 | 5-phosphoribose 1-diphosphate biosynthetic process(GO:0006015) 5-phosphoribose 1-diphosphate metabolic process(GO:0046391) |
| 0.1 | 1.2 | GO:2001256 | regulation of store-operated calcium entry(GO:2001256) |
| 0.1 | 0.3 | GO:1904428 | negative regulation of tubulin deacetylation(GO:1904428) |
| 0.1 | 0.3 | GO:0060800 | regulation of cell differentiation involved in embryonic placenta development(GO:0060800) |
| 0.0 | 0.5 | GO:2000346 | negative regulation of hepatocyte proliferation(GO:2000346) |
| 0.0 | 0.9 | GO:1901387 | positive regulation of voltage-gated calcium channel activity(GO:1901387) |
| 0.0 | 1.0 | GO:0006703 | estrogen biosynthetic process(GO:0006703) |
| 0.0 | 0.3 | GO:0036378 | calcitriol biosynthetic process from calciol(GO:0036378) |
| 0.0 | 0.2 | GO:0032765 | positive regulation of mast cell cytokine production(GO:0032765) |
| 0.0 | 2.1 | GO:0034080 | CENP-A containing nucleosome assembly(GO:0034080) CENP-A containing chromatin organization(GO:0061641) |
| 0.0 | 0.7 | GO:0044387 | negative regulation of protein kinase activity by regulation of protein phosphorylation(GO:0044387) |
| 0.0 | 0.2 | GO:0090156 | cellular sphingolipid homeostasis(GO:0090156) |
| 0.0 | 0.6 | GO:0032328 | alanine transport(GO:0032328) |
| 0.0 | 0.3 | GO:0035426 | extracellular matrix-cell signaling(GO:0035426) |
| 0.0 | 0.3 | GO:0051697 | protein delipidation(GO:0051697) |
| 0.0 | 0.3 | GO:0033152 | immunoglobulin V(D)J recombination(GO:0033152) |
| 0.0 | 0.4 | GO:0035879 | plasma membrane lactate transport(GO:0035879) |
| 0.0 | 0.2 | GO:1903070 | negative regulation of ER-associated ubiquitin-dependent protein catabolic process(GO:1903070) |
| 0.0 | 2.4 | GO:0010165 | response to X-ray(GO:0010165) |
| 0.0 | 1.4 | GO:0045725 | positive regulation of glycogen biosynthetic process(GO:0045725) |
| 0.0 | 2.8 | GO:0006730 | one-carbon metabolic process(GO:0006730) |
| 0.0 | 0.1 | GO:0060279 | positive regulation of ovulation(GO:0060279) |
| 0.0 | 0.1 | GO:0034769 | basement membrane disassembly(GO:0034769) |
| 0.0 | 1.2 | GO:0017121 | phospholipid scrambling(GO:0017121) |
| 0.0 | 0.6 | GO:0038166 | angiotensin-activated signaling pathway(GO:0038166) |
| 0.0 | 1.2 | GO:0090286 | cytoskeletal anchoring at nuclear membrane(GO:0090286) |
| 0.0 | 0.2 | GO:0035407 | histone H3-T11 phosphorylation(GO:0035407) |
| 0.0 | 0.6 | GO:0005981 | regulation of glycogen catabolic process(GO:0005981) |
| 0.0 | 0.1 | GO:0015938 | coenzyme A catabolic process(GO:0015938) nucleoside bisphosphate catabolic process(GO:0033869) ribonucleoside bisphosphate catabolic process(GO:0034031) purine nucleoside bisphosphate catabolic process(GO:0034034) |
| 0.0 | 0.9 | GO:0035988 | chondrocyte proliferation(GO:0035988) |
| 0.0 | 0.3 | GO:0006167 | AMP biosynthetic process(GO:0006167) |
| 0.0 | 0.3 | GO:0048630 | skeletal muscle tissue growth(GO:0048630) |
| 0.0 | 0.5 | GO:0006824 | cobalt ion transport(GO:0006824) |
| 0.0 | 0.6 | GO:0043508 | negative regulation of JUN kinase activity(GO:0043508) |
| 0.0 | 0.6 | GO:2000741 | positive regulation of mesenchymal stem cell differentiation(GO:2000741) |
| 0.0 | 0.2 | GO:0000821 | regulation of arginine metabolic process(GO:0000821) |
| 0.0 | 0.6 | GO:0042407 | cristae formation(GO:0042407) |
| 0.0 | 0.4 | GO:0007144 | female meiosis I(GO:0007144) |
| 0.0 | 0.4 | GO:0048194 | Golgi vesicle budding(GO:0048194) |
| 0.0 | 0.9 | GO:0032060 | bleb assembly(GO:0032060) |
| 0.0 | 0.4 | GO:0042866 | pyruvate biosynthetic process(GO:0042866) |
| 0.0 | 0.2 | GO:1900226 | negative regulation of NLRP3 inflammasome complex assembly(GO:1900226) |
| 0.0 | 0.6 | GO:0036066 | protein O-linked fucosylation(GO:0036066) |
| 0.0 | 0.1 | GO:0001732 | formation of cytoplasmic translation initiation complex(GO:0001732) |
| 0.0 | 0.4 | GO:0071340 | skeletal muscle acetylcholine-gated channel clustering(GO:0071340) |
| 0.0 | 2.0 | GO:0006910 | phagocytosis, recognition(GO:0006910) |
| 0.0 | 0.1 | GO:0098904 | regulation of AV node cell action potential(GO:0098904) |
| 0.0 | 2.3 | GO:0000271 | polysaccharide biosynthetic process(GO:0000271) |
| 0.0 | 0.7 | GO:0042832 | defense response to protozoan(GO:0042832) |
| 0.0 | 0.7 | GO:2000001 | regulation of DNA damage checkpoint(GO:2000001) |
| 0.0 | 0.6 | GO:0007095 | mitotic G2 DNA damage checkpoint(GO:0007095) |
| 0.0 | 2.1 | GO:0010761 | fibroblast migration(GO:0010761) |
| 0.0 | 0.2 | GO:0043126 | regulation of 1-phosphatidylinositol 4-kinase activity(GO:0043126) positive regulation of 1-phosphatidylinositol 4-kinase activity(GO:0043128) |
| 0.0 | 0.6 | GO:0050872 | white fat cell differentiation(GO:0050872) |
| 0.0 | 1.0 | GO:0071425 | hematopoietic stem cell proliferation(GO:0071425) |
| 0.0 | 0.2 | GO:0006931 | substrate-dependent cell migration, cell attachment to substrate(GO:0006931) |
| 0.0 | 0.2 | GO:0002051 | osteoblast fate commitment(GO:0002051) |
| 0.0 | 0.4 | GO:0042340 | keratan sulfate catabolic process(GO:0042340) |
| 0.0 | 0.2 | GO:0032472 | Golgi calcium ion transport(GO:0032472) |
| 0.0 | 0.2 | GO:0090043 | regulation of tubulin deacetylation(GO:0090043) |
| 0.0 | 0.6 | GO:0050860 | negative regulation of T cell receptor signaling pathway(GO:0050860) |
| 0.0 | 0.2 | GO:0098967 | exocytic insertion of neurotransmitter receptor to plasma membrane(GO:0098881) exocytic insertion of neurotransmitter receptor to postsynaptic membrane(GO:0098967) |
| 0.0 | 0.2 | GO:2001288 | positive regulation of caveolin-mediated endocytosis(GO:2001288) |
| 0.0 | 0.2 | GO:0046886 | positive regulation of hormone biosynthetic process(GO:0046886) |
| 0.0 | 0.3 | GO:0035721 | intraciliary retrograde transport(GO:0035721) |
| 0.0 | 1.3 | GO:0048384 | retinoic acid receptor signaling pathway(GO:0048384) |
| 0.0 | 1.1 | GO:0032467 | positive regulation of cytokinesis(GO:0032467) |
| 0.0 | 0.4 | GO:0006895 | Golgi to endosome transport(GO:0006895) |
| 0.0 | 0.1 | GO:0007185 | transmembrane receptor protein tyrosine phosphatase signaling pathway(GO:0007185) |
| 0.0 | 0.4 | GO:0045898 | regulation of RNA polymerase II transcriptional preinitiation complex assembly(GO:0045898) |
| 0.0 | 0.1 | GO:1903904 | negative regulation of establishment of T cell polarity(GO:1903904) negative regulation of Rho guanyl-nucleotide exchange factor activity(GO:2001107) |
| 0.0 | 0.9 | GO:0010039 | response to iron ion(GO:0010039) |
| 0.0 | 0.0 | GO:0035356 | cellular triglyceride homeostasis(GO:0035356) |
| 0.0 | 0.3 | GO:0070828 | heterochromatin organization(GO:0070828) |
| 0.0 | 0.4 | GO:0072321 | chaperone-mediated protein transport(GO:0072321) |
| 0.0 | 0.4 | GO:0015671 | oxygen transport(GO:0015671) |
| 0.0 | 0.2 | GO:0032057 | negative regulation of translational initiation in response to stress(GO:0032057) |
| 0.0 | 0.2 | GO:0039536 | negative regulation of RIG-I signaling pathway(GO:0039536) |
| 0.0 | 0.1 | GO:1900113 | negative regulation of histone H3-K9 trimethylation(GO:1900113) |
| 0.0 | 0.3 | GO:2000766 | negative regulation of cytoplasmic translation(GO:2000766) |
| 0.0 | 0.5 | GO:0045589 | regulation of regulatory T cell differentiation(GO:0045589) |
| 0.0 | 0.7 | GO:0060612 | adipose tissue development(GO:0060612) |
| 0.0 | 0.8 | GO:0031529 | ruffle organization(GO:0031529) |
| 0.0 | 0.3 | GO:0032354 | response to follicle-stimulating hormone(GO:0032354) |
| 0.0 | 0.1 | GO:0015846 | polyamine transport(GO:0015846) |
| 0.0 | 0.1 | GO:0006335 | DNA replication-dependent nucleosome assembly(GO:0006335) DNA replication-dependent nucleosome organization(GO:0034723) |
| 0.0 | 1.0 | GO:1902600 | hydrogen ion transmembrane transport(GO:1902600) |
Gene overrepresentation in cellular component category:
| Log-likelihood per target | Total log-likelihood | Term | Description |
|---|---|---|---|
| 0.4 | 1.1 | GO:1990622 | CHOP-ATF3 complex(GO:1990622) |
| 0.3 | 5.9 | GO:0005862 | muscle thin filament tropomyosin(GO:0005862) |
| 0.3 | 1.0 | GO:0005914 | spot adherens junction(GO:0005914) |
| 0.3 | 1.4 | GO:0005899 | insulin receptor complex(GO:0005899) |
| 0.3 | 1.1 | GO:0005602 | complement component C1 complex(GO:0005602) |
| 0.2 | 4.3 | GO:0005861 | troponin complex(GO:0005861) |
| 0.2 | 0.7 | GO:0097125 | cyclin B1-CDK1 complex(GO:0097125) |
| 0.2 | 3.7 | GO:0045277 | respiratory chain complex IV(GO:0045277) |
| 0.2 | 3.2 | GO:0044233 | ER-mitochondrion membrane contact site(GO:0044233) |
| 0.1 | 6.3 | GO:0031092 | platelet alpha granule membrane(GO:0031092) |
| 0.1 | 2.0 | GO:0030870 | Mre11 complex(GO:0030870) |
| 0.1 | 0.7 | GO:0032299 | ribonuclease H2 complex(GO:0032299) |
| 0.1 | 0.4 | GO:1902912 | pyruvate kinase complex(GO:1902912) |
| 0.1 | 0.3 | GO:0097229 | sperm end piece(GO:0097229) |
| 0.1 | 0.5 | GO:0061617 | MICOS complex(GO:0061617) |
| 0.1 | 0.3 | GO:0045257 | mitochondrial respiratory chain complex II, succinate dehydrogenase complex (ubiquinone)(GO:0005749) succinate dehydrogenase complex (ubiquinone)(GO:0045257) respiratory chain complex II(GO:0045273) succinate dehydrogenase complex(GO:0045281) fumarate reductase complex(GO:0045283) |
| 0.1 | 1.3 | GO:0036449 | microtubule minus-end(GO:0036449) |
| 0.1 | 0.8 | GO:0042587 | glycogen granule(GO:0042587) |
| 0.1 | 0.7 | GO:0042105 | alpha-beta T cell receptor complex(GO:0042105) |
| 0.1 | 0.8 | GO:0070652 | HAUS complex(GO:0070652) |
| 0.1 | 0.5 | GO:0005610 | laminin-5 complex(GO:0005610) |
| 0.1 | 0.4 | GO:0070695 | FHF complex(GO:0070695) |
| 0.0 | 1.7 | GO:0014731 | spectrin-associated cytoskeleton(GO:0014731) |
| 0.0 | 2.9 | GO:0042571 | immunoglobulin complex, circulating(GO:0042571) |
| 0.0 | 2.4 | GO:0090665 | dystrophin-associated glycoprotein complex(GO:0016010) glycoprotein complex(GO:0090665) |
| 0.0 | 0.4 | GO:0042719 | mitochondrial intermembrane space protein transporter complex(GO:0042719) |
| 0.0 | 0.8 | GO:0042555 | MCM complex(GO:0042555) |
| 0.0 | 0.2 | GO:0036501 | UFD1-NPL4 complex(GO:0036501) |
| 0.0 | 0.4 | GO:0000138 | Golgi trans cisterna(GO:0000138) |
| 0.0 | 3.0 | GO:0002102 | podosome(GO:0002102) |
| 0.0 | 1.2 | GO:0034993 | microtubule organizing center attachment site(GO:0034992) LINC complex(GO:0034993) |
| 0.0 | 0.2 | GO:1990796 | photoreceptor cell terminal bouton(GO:1990796) |
| 0.0 | 0.1 | GO:0043511 | inhibin complex(GO:0043511) inhibin A complex(GO:0043512) |
| 0.0 | 5.6 | GO:0016459 | myosin complex(GO:0016459) |
| 0.0 | 0.2 | GO:0035339 | SPOTS complex(GO:0035339) |
| 0.0 | 1.6 | GO:0043218 | compact myelin(GO:0043218) |
| 0.0 | 0.8 | GO:0031362 | anchored component of external side of plasma membrane(GO:0031362) |
| 0.0 | 0.3 | GO:0005638 | lamin filament(GO:0005638) |
| 0.0 | 2.7 | GO:0097517 | stress fiber(GO:0001725) contractile actin filament bundle(GO:0097517) |
| 0.0 | 0.4 | GO:0098799 | outer mitochondrial membrane protein complex(GO:0098799) |
| 0.0 | 0.4 | GO:0005833 | hemoglobin complex(GO:0005833) |
| 0.0 | 0.3 | GO:0070938 | contractile ring(GO:0070938) |
| 0.0 | 0.4 | GO:0001673 | male germ cell nucleus(GO:0001673) |
| 0.0 | 3.6 | GO:0000118 | histone deacetylase complex(GO:0000118) |
| 0.0 | 0.1 | GO:0035061 | interchromatin granule(GO:0035061) |
| 0.0 | 2.0 | GO:0005844 | polysome(GO:0005844) |
| 0.0 | 0.4 | GO:0097025 | MPP7-DLG1-LIN7 complex(GO:0097025) |
| 0.0 | 0.2 | GO:0005851 | eukaryotic translation initiation factor 2B complex(GO:0005851) |
| 0.0 | 0.4 | GO:0099634 | postsynaptic specialization membrane(GO:0099634) |
| 0.0 | 0.1 | GO:0036021 | endolysosome lumen(GO:0036021) |
| 0.0 | 2.0 | GO:0005811 | lipid particle(GO:0005811) |
| 0.0 | 0.4 | GO:0043203 | axon hillock(GO:0043203) |
| 0.0 | 4.3 | GO:0030017 | sarcomere(GO:0030017) |
| 0.0 | 0.1 | GO:1990037 | Lewy body core(GO:1990037) |
| 0.0 | 0.1 | GO:0060171 | stereocilium membrane(GO:0060171) |
| 0.0 | 0.3 | GO:0000786 | nucleosome(GO:0000786) |
| 0.0 | 0.3 | GO:0000800 | lateral element(GO:0000800) |
| 0.0 | 0.4 | GO:0035371 | microtubule plus-end(GO:0035371) |
| 0.0 | 1.2 | GO:0035577 | azurophil granule membrane(GO:0035577) |
| 0.0 | 0.3 | GO:0031254 | uropod(GO:0001931) cell trailing edge(GO:0031254) |
| 0.0 | 1.2 | GO:0005637 | nuclear inner membrane(GO:0005637) |
| 0.0 | 2.7 | GO:0000922 | spindle pole(GO:0000922) |
| 0.0 | 0.2 | GO:0042589 | zymogen granule membrane(GO:0042589) |
| 0.0 | 0.3 | GO:0005605 | basal lamina(GO:0005605) |
| 0.0 | 0.2 | GO:0042101 | T cell receptor complex(GO:0042101) |
| 0.0 | 0.7 | GO:0030173 | integral component of Golgi membrane(GO:0030173) |
| 0.0 | 0.3 | GO:0005868 | cytoplasmic dynein complex(GO:0005868) |
Gene overrepresentation in molecular function category:
| Log-likelihood per target | Total log-likelihood | Term | Description |
|---|---|---|---|
| 0.7 | 5.8 | GO:0004111 | creatine kinase activity(GO:0004111) |
| 0.7 | 4.3 | GO:0030172 | troponin C binding(GO:0030172) |
| 0.6 | 3.5 | GO:0032038 | myosin II heavy chain binding(GO:0032038) |
| 0.5 | 6.2 | GO:0070892 | lipoteichoic acid receptor activity(GO:0070892) |
| 0.5 | 3.8 | GO:0016403 | dimethylargininase activity(GO:0016403) |
| 0.4 | 2.9 | GO:0004499 | N,N-dimethylaniline monooxygenase activity(GO:0004499) |
| 0.3 | 2.4 | GO:0004962 | endothelin receptor activity(GO:0004962) |
| 0.3 | 1.7 | GO:0052596 | tryptamine:oxygen oxidoreductase (deaminating) activity(GO:0052593) aminoacetone:oxygen oxidoreductase(deaminating) activity(GO:0052594) aliphatic-amine oxidase activity(GO:0052595) phenethylamine:oxygen oxidoreductase (deaminating) activity(GO:0052596) |
| 0.3 | 1.2 | GO:0072591 | citrate-L-glutamate ligase activity(GO:0072591) |
| 0.2 | 0.7 | GO:0046715 | borate transmembrane transporter activity(GO:0046715) |
| 0.2 | 0.8 | GO:0030395 | lactose binding(GO:0030395) |
| 0.2 | 0.6 | GO:0035650 | AP-1 adaptor complex binding(GO:0035650) AP-3 adaptor complex binding(GO:0035651) |
| 0.2 | 1.5 | GO:0032810 | sterol response element binding(GO:0032810) |
| 0.2 | 1.9 | GO:0071253 | connexin binding(GO:0071253) |
| 0.2 | 2.0 | GO:0070087 | chromo shadow domain binding(GO:0070087) |
| 0.1 | 0.7 | GO:0061676 | importin-alpha family protein binding(GO:0061676) |
| 0.1 | 1.2 | GO:0004727 | prenylated protein tyrosine phosphatase activity(GO:0004727) |
| 0.1 | 2.8 | GO:0004089 | carbonate dehydratase activity(GO:0004089) |
| 0.1 | 1.0 | GO:0004614 | phosphoglucomutase activity(GO:0004614) |
| 0.1 | 0.7 | GO:0061575 | cyclin-dependent protein serine/threonine kinase activator activity(GO:0061575) |
| 0.1 | 0.3 | GO:0042947 | glucoside transmembrane transporter activity(GO:0042947) |
| 0.1 | 0.6 | GO:0008955 | peptidoglycan glycosyltransferase activity(GO:0008955) |
| 0.1 | 0.7 | GO:0003827 | alpha-1,3-mannosylglycoprotein 2-beta-N-acetylglucosaminyltransferase activity(GO:0003827) |
| 0.1 | 3.7 | GO:0004129 | cytochrome-c oxidase activity(GO:0004129) heme-copper terminal oxidase activity(GO:0015002) oxidoreductase activity, acting on a heme group of donors, oxygen as acceptor(GO:0016676) |
| 0.1 | 1.0 | GO:0032190 | acrosin binding(GO:0032190) |
| 0.1 | 0.7 | GO:0004909 | interleukin-1, Type I, activating receptor activity(GO:0004909) |
| 0.1 | 0.6 | GO:0001595 | angiotensin receptor activity(GO:0001595) angiotensin type II receptor activity(GO:0004945) |
| 0.1 | 0.7 | GO:0035473 | lipase binding(GO:0035473) |
| 0.1 | 0.7 | GO:0043426 | MRF binding(GO:0043426) |
| 0.1 | 1.0 | GO:0004767 | sphingomyelin phosphodiesterase activity(GO:0004767) |
| 0.1 | 0.2 | GO:0042284 | sphingolipid delta-4 desaturase activity(GO:0042284) |
| 0.1 | 0.3 | GO:0008177 | succinate dehydrogenase (ubiquinone) activity(GO:0008177) |
| 0.1 | 3.0 | GO:0051371 | muscle alpha-actinin binding(GO:0051371) |
| 0.1 | 1.7 | GO:0008093 | cytoskeletal adaptor activity(GO:0008093) |
| 0.1 | 0.2 | GO:0008193 | tRNA guanylyltransferase activity(GO:0008193) |
| 0.1 | 0.4 | GO:0005353 | fructose transmembrane transporter activity(GO:0005353) |
| 0.1 | 0.2 | GO:0004874 | aryl hydrocarbon receptor activity(GO:0004874) |
| 0.1 | 7.4 | GO:0008307 | structural constituent of muscle(GO:0008307) |
| 0.1 | 1.2 | GO:0008140 | cAMP response element binding protein binding(GO:0008140) |
| 0.1 | 1.0 | GO:0004303 | estradiol 17-beta-dehydrogenase activity(GO:0004303) |
| 0.1 | 1.2 | GO:0043295 | glutathione binding(GO:0043295) |
| 0.1 | 0.7 | GO:0033192 | calmodulin-dependent protein phosphatase activity(GO:0033192) |
| 0.1 | 0.4 | GO:0004743 | pyruvate kinase activity(GO:0004743) |
| 0.1 | 0.7 | GO:0004523 | RNA-DNA hybrid ribonuclease activity(GO:0004523) |
| 0.1 | 2.1 | GO:0004181 | metallocarboxypeptidase activity(GO:0004181) |
| 0.0 | 0.2 | GO:0070643 | vitamin D3 25-hydroxylase activity(GO:0030343) vitamin D 25-hydroxylase activity(GO:0070643) |
| 0.0 | 0.3 | GO:0070644 | vitamin D response element binding(GO:0070644) |
| 0.0 | 1.2 | GO:0017128 | phospholipid scramblase activity(GO:0017128) |
| 0.0 | 2.9 | GO:0034987 | immunoglobulin receptor binding(GO:0034987) |
| 0.0 | 0.2 | GO:0002060 | purine nucleobase binding(GO:0002060) glycogen phosphorylase activity(GO:0008184) |
| 0.0 | 0.2 | GO:0035402 | histone kinase activity (H3-T11 specific)(GO:0035402) |
| 0.0 | 0.1 | GO:0004886 | 9-cis retinoic acid receptor activity(GO:0004886) |
| 0.0 | 0.5 | GO:0031419 | cobalamin binding(GO:0031419) |
| 0.0 | 0.6 | GO:0022889 | L-serine transmembrane transporter activity(GO:0015194) serine transmembrane transporter activity(GO:0022889) |
| 0.0 | 1.1 | GO:0043495 | protein anchor(GO:0043495) |
| 0.0 | 0.2 | GO:0072345 | NAADP-sensitive calcium-release channel activity(GO:0072345) |
| 0.0 | 0.3 | GO:0004784 | superoxide dismutase activity(GO:0004784) oxidoreductase activity, acting on superoxide radicals as acceptor(GO:0016721) |
| 0.0 | 0.6 | GO:0019911 | structural constituent of myelin sheath(GO:0019911) |
| 0.0 | 0.1 | GO:0061628 | H3K27me3 modified histone binding(GO:0061628) |
| 0.0 | 1.1 | GO:0005328 | neurotransmitter:sodium symporter activity(GO:0005328) |
| 0.0 | 0.9 | GO:0044548 | S100 protein binding(GO:0044548) |
| 0.0 | 0.6 | GO:0010314 | phosphatidylinositol-5-phosphate binding(GO:0010314) |
| 0.0 | 1.4 | GO:0005158 | insulin receptor binding(GO:0005158) |
| 0.0 | 0.9 | GO:0008190 | eukaryotic initiation factor 4E binding(GO:0008190) |
| 0.0 | 0.3 | GO:0016842 | amidine-lyase activity(GO:0016842) |
| 0.0 | 0.1 | GO:0009032 | thymidine phosphorylase activity(GO:0009032) pyrimidine-nucleoside phosphorylase activity(GO:0016154) |
| 0.0 | 0.4 | GO:0015129 | lactate transmembrane transporter activity(GO:0015129) |
| 0.0 | 1.9 | GO:0001784 | phosphotyrosine binding(GO:0001784) |
| 0.0 | 0.5 | GO:0005049 | nuclear export signal receptor activity(GO:0005049) |
| 0.0 | 1.0 | GO:0015269 | calcium-activated potassium channel activity(GO:0015269) |
| 0.0 | 2.0 | GO:0008138 | protein tyrosine/serine/threonine phosphatase activity(GO:0008138) |
| 0.0 | 0.1 | GO:0098808 | mRNA cap binding(GO:0098808) |
| 0.0 | 0.6 | GO:0001871 | pattern binding(GO:0001871) polysaccharide binding(GO:0030247) |
| 0.0 | 0.3 | GO:0043142 | single-stranded DNA-dependent ATPase activity(GO:0043142) |
| 0.0 | 0.3 | GO:0035374 | chondroitin sulfate binding(GO:0035374) |
| 0.0 | 0.1 | GO:0048763 | calcium-induced calcium release activity(GO:0048763) |
| 0.0 | 0.3 | GO:0045504 | dynein heavy chain binding(GO:0045504) |
| 0.0 | 0.7 | GO:0070410 | co-SMAD binding(GO:0070410) |
| 0.0 | 0.2 | GO:0035381 | extracellular ATP-gated cation channel activity(GO:0004931) ATP-gated ion channel activity(GO:0035381) |
| 0.0 | 0.4 | GO:0005344 | oxygen transporter activity(GO:0005344) |
| 0.0 | 0.4 | GO:0070273 | phosphatidylinositol-4-phosphate binding(GO:0070273) |
| 0.0 | 0.8 | GO:0051019 | mitogen-activated protein kinase binding(GO:0051019) |
| 0.0 | 0.5 | GO:0070182 | DNA polymerase binding(GO:0070182) |
| 0.0 | 0.6 | GO:0003785 | actin monomer binding(GO:0003785) |
| 0.0 | 2.8 | GO:0003697 | single-stranded DNA binding(GO:0003697) |
| 0.0 | 0.7 | GO:0003950 | NAD+ ADP-ribosyltransferase activity(GO:0003950) |
| 0.0 | 0.1 | GO:0008508 | bile acid:sodium symporter activity(GO:0008508) |
| 0.0 | 1.3 | GO:0001540 | beta-amyloid binding(GO:0001540) |
| 0.0 | 0.1 | GO:0034711 | inhibin binding(GO:0034711) |
| 0.0 | 0.5 | GO:0005035 | tumor necrosis factor-activated receptor activity(GO:0005031) death receptor activity(GO:0005035) |
| 0.0 | 0.2 | GO:0050544 | arachidonic acid binding(GO:0050544) |
| 0.0 | 2.2 | GO:0004222 | metalloendopeptidase activity(GO:0004222) |
| 0.0 | 3.6 | GO:0042393 | histone binding(GO:0042393) |
| 0.0 | 0.7 | GO:0031624 | ubiquitin conjugating enzyme binding(GO:0031624) |
| 0.0 | 0.2 | GO:1990459 | transferrin receptor binding(GO:1990459) |
| 0.0 | 2.1 | GO:0003823 | antigen binding(GO:0003823) |
| 0.0 | 0.3 | GO:0022848 | acetylcholine-gated cation channel activity(GO:0022848) |
| 0.0 | 0.3 | GO:0005521 | lamin binding(GO:0005521) |
| 0.0 | 0.2 | GO:0015174 | basic amino acid transmembrane transporter activity(GO:0015174) |
| 0.0 | 0.5 | GO:0008157 | protein phosphatase 1 binding(GO:0008157) |
| 0.0 | 0.3 | GO:0004143 | diacylglycerol kinase activity(GO:0004143) |
| 0.0 | 0.1 | GO:0032454 | histone demethylase activity (H3-K9 specific)(GO:0032454) |
Gene overrepresentation in curated gene sets: canonical pathways category:
| Log-likelihood per target | Total log-likelihood | Term | Description |
|---|---|---|---|
| 0.1 | 1.3 | PID HEDGEHOG GLI PATHWAY | Hedgehog signaling events mediated by Gli proteins |
| 0.0 | 7.0 | PID RB 1PATHWAY | Regulation of retinoblastoma protein |
| 0.0 | 2.4 | PID FOXM1 PATHWAY | FOXM1 transcription factor network |
| 0.0 | 1.1 | PID HIF1A PATHWAY | Hypoxic and oxygen homeostasis regulation of HIF-1-alpha |
| 0.0 | 3.4 | PID NFAT TFPATHWAY | Calcineurin-regulated NFAT-dependent transcription in lymphocytes |
| 0.0 | 1.9 | ST MYOCYTE AD PATHWAY | Myocyte Adrenergic Pathway is a specific case of the generalized Adrenergic Pathway. |
| 0.0 | 3.8 | PID ILK PATHWAY | Integrin-linked kinase signaling |
| 0.0 | 1.4 | PID P38 MK2 PATHWAY | p38 signaling mediated by MAPKAP kinases |
| 0.0 | 1.2 | PID PRL SIGNALING EVENTS PATHWAY | Signaling events mediated by PRL |
| 0.0 | 0.2 | SA G2 AND M PHASES | Cdc25 activates the cdc2/cyclin B complex to induce the G2/M transition. |
| 0.0 | 2.6 | PID ARF6 TRAFFICKING PATHWAY | Arf6 trafficking events |
| 0.0 | 0.3 | PID ERBB2 ERBB3 PATHWAY | ErbB2/ErbB3 signaling events |
| 0.0 | 0.5 | PID INTEGRIN4 PATHWAY | Alpha6 beta4 integrin-ligand interactions |
| 0.0 | 0.6 | PID FANCONI PATHWAY | Fanconi anemia pathway |
| 0.0 | 1.2 | PID AURORA A PATHWAY | Aurora A signaling |
| 0.0 | 1.6 | PID RXR VDR PATHWAY | RXR and RAR heterodimerization with other nuclear receptor |
| 0.0 | 1.7 | PID DELTA NP63 PATHWAY | Validated transcriptional targets of deltaNp63 isoforms |
| 0.0 | 0.2 | ST PHOSPHOINOSITIDE 3 KINASE PATHWAY | PI3K Pathway |
| 0.0 | 1.2 | PID ATR PATHWAY | ATR signaling pathway |
| 0.0 | 0.7 | PID GMCSF PATHWAY | GMCSF-mediated signaling events |
| 0.0 | 1.4 | SIG INSULIN RECEPTOR PATHWAY IN CARDIAC MYOCYTES | Genes related to the insulin receptor pathway |
| 0.0 | 1.1 | PID ATF2 PATHWAY | ATF-2 transcription factor network |
| 0.0 | 1.9 | PID ANGIOPOIETIN RECEPTOR PATHWAY | Angiopoietin receptor Tie2-mediated signaling |
| 0.0 | 0.7 | PID ERBB1 RECEPTOR PROXIMAL PATHWAY | EGF receptor (ErbB1) signaling pathway |
| 0.0 | 0.3 | SA B CELL RECEPTOR COMPLEXES | Antigen binding to B cell receptors activates protein tyrosine kinases, such as the Src family, which ultimate activate MAP kinases. |
| 0.0 | 1.6 | PID BETA CATENIN NUC PATHWAY | Regulation of nuclear beta catenin signaling and target gene transcription |
| 0.0 | 0.7 | ST P38 MAPK PATHWAY | p38 MAPK Pathway |
| 0.0 | 0.8 | PID INTEGRIN2 PATHWAY | Beta2 integrin cell surface interactions |
| 0.0 | 0.6 | PID ALK1 PATHWAY | ALK1 signaling events |
| 0.0 | 1.8 | PID AR PATHWAY | Coregulation of Androgen receptor activity |
| 0.0 | 0.6 | NABA PROTEOGLYCANS | Genes encoding proteoglycans |
Gene overrepresentation in curated gene sets: REACTOME pathways category:
| Log-likelihood per target | Total log-likelihood | Term | Description |
|---|---|---|---|
| 0.2 | 2.8 | REACTOME REVERSIBLE HYDRATION OF CARBON DIOXIDE | Genes involved in Reversible Hydration of Carbon Dioxide |
| 0.1 | 0.7 | REACTOME CDC6 ASSOCIATION WITH THE ORC ORIGIN COMPLEX | Genes involved in CDC6 association with the ORC:origin complex |
| 0.1 | 9.5 | REACTOME STRIATED MUSCLE CONTRACTION | Genes involved in Striated Muscle Contraction |
| 0.1 | 2.0 | REACTOME REGULATION OF INSULIN LIKE GROWTH FACTOR IGF ACTIVITY BY INSULIN LIKE GROWTH FACTOR BINDING PROTEINS IGFBPS | Genes involved in Regulation of Insulin-like Growth Factor (IGF) Activity by Insulin-like Growth Factor Binding Proteins (IGFBPs) |
| 0.1 | 2.1 | REACTOME DEPOSITION OF NEW CENPA CONTAINING NUCLEOSOMES AT THE CENTROMERE | Genes involved in Deposition of New CENPA-containing Nucleosomes at the Centromere |
| 0.1 | 8.7 | REACTOME TRANSCRIPTIONAL REGULATION OF WHITE ADIPOCYTE DIFFERENTIATION | Genes involved in Transcriptional Regulation of White Adipocyte Differentiation |
| 0.1 | 0.7 | REACTOME E2F ENABLED INHIBITION OF PRE REPLICATION COMPLEX FORMATION | Genes involved in E2F-enabled inhibition of pre-replication complex formation |
| 0.0 | 0.8 | REACTOME UNWINDING OF DNA | Genes involved in Unwinding of DNA |
| 0.0 | 1.9 | REACTOME TIE2 SIGNALING | Genes involved in Tie2 Signaling |
| 0.0 | 0.7 | REACTOME PECAM1 INTERACTIONS | Genes involved in PECAM1 interactions |
| 0.0 | 1.9 | REACTOME ANTIGEN ACTIVATES B CELL RECEPTOR LEADING TO GENERATION OF SECOND MESSENGERS | Genes involved in Antigen Activates B Cell Receptor Leading to Generation of Second Messengers |
| 0.0 | 1.4 | REACTOME SMOOTH MUSCLE CONTRACTION | Genes involved in Smooth Muscle Contraction |
| 0.0 | 0.6 | REACTOME RECYCLING OF BILE ACIDS AND SALTS | Genes involved in Recycling of bile acids and salts |
| 0.0 | 1.7 | REACTOME INTERACTION BETWEEN L1 AND ANKYRINS | Genes involved in Interaction between L1 and Ankyrins |
| 0.0 | 0.1 | REACTOME ENDOSOMAL VACUOLAR PATHWAY | Genes involved in Endosomal/Vacuolar pathway |
| 0.0 | 2.7 | REACTOME PHASE1 FUNCTIONALIZATION OF COMPOUNDS | Genes involved in Phase 1 - Functionalization of compounds |
| 0.0 | 1.1 | REACTOME ACTIVATION OF GENES BY ATF4 | Genes involved in Activation of Genes by ATF4 |
| 0.0 | 1.2 | REACTOME GLUTATHIONE CONJUGATION | Genes involved in Glutathione conjugation |
| 0.0 | 1.1 | REACTOME REGULATION OF HYPOXIA INDUCIBLE FACTOR HIF BY OXYGEN | Genes involved in Regulation of Hypoxia-inducible Factor (HIF) by Oxygen |
| 0.0 | 0.4 | REACTOME KERATAN SULFATE DEGRADATION | Genes involved in Keratan sulfate degradation |
| 0.0 | 1.2 | REACTOME BASIGIN INTERACTIONS | Genes involved in Basigin interactions |
| 0.0 | 1.2 | REACTOME CELL SURFACE INTERACTIONS AT THE VASCULAR WALL | Genes involved in Cell surface interactions at the vascular wall |
| 0.0 | 1.0 | REACTOME CGMP EFFECTS | Genes involved in cGMP effects |
| 0.0 | 2.5 | REACTOME INTERFERON GAMMA SIGNALING | Genes involved in Interferon gamma signaling |
| 0.0 | 0.7 | REACTOME CELL EXTRACELLULAR MATRIX INTERACTIONS | Genes involved in Cell-extracellular matrix interactions |
| 0.0 | 0.3 | REACTOME PURINE RIBONUCLEOSIDE MONOPHOSPHATE BIOSYNTHESIS | Genes involved in Purine ribonucleoside monophosphate biosynthesis |
| 0.0 | 0.8 | REACTOME AMYLOIDS | Genes involved in Amyloids |
| 0.0 | 0.2 | REACTOME THE NLRP3 INFLAMMASOME | Genes involved in The NLRP3 inflammasome |
| 0.0 | 0.4 | REACTOME FACILITATIVE NA INDEPENDENT GLUCOSE TRANSPORTERS | Genes involved in Facilitative Na+-independent glucose transporters |
| 0.0 | 0.3 | REACTOME PRESYNAPTIC NICOTINIC ACETYLCHOLINE RECEPTORS | Genes involved in Presynaptic nicotinic acetylcholine receptors |
| 0.0 | 0.2 | REACTOME G2 M DNA DAMAGE CHECKPOINT | Genes involved in G2/M DNA damage checkpoint |
| 0.0 | 0.6 | REACTOME CHONDROITIN SULFATE BIOSYNTHESIS | Genes involved in Chondroitin sulfate biosynthesis |
| 0.0 | 0.3 | REACTOME CITRIC ACID CYCLE TCA CYCLE | Genes involved in Citric acid cycle (TCA cycle) |
| 0.0 | 3.4 | REACTOME METABOLISM OF AMINO ACIDS AND DERIVATIVES | Genes involved in Metabolism of amino acids and derivatives |
| 0.0 | 0.3 | REACTOME HS GAG DEGRADATION | Genes involved in HS-GAG degradation |
| 0.0 | 0.3 | REACTOME HOMOLOGOUS RECOMBINATION REPAIR OF REPLICATION INDEPENDENT DOUBLE STRAND BREAKS | Genes involved in Homologous recombination repair of replication-independent double-strand breaks |