Project
Illumina Body Map 2 (GSE30611)
Navigation
Downloads
Results for TFAP2C
Z-value: 1.46
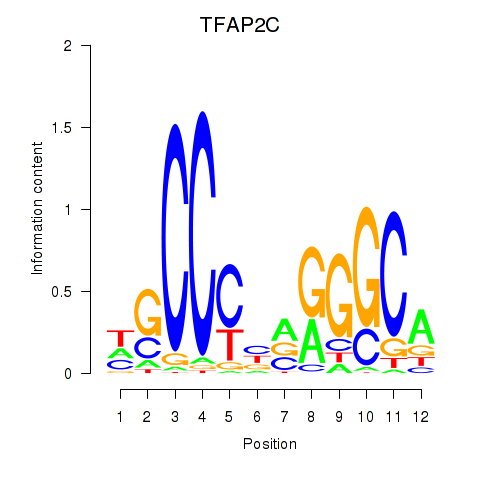
Motif logo
Transcription factors associated with TFAP2C
| Gene Symbol | Gene ID | Gene Info |
|---|---|---|
|
TFAP2C
|
ENSG00000087510.7 | transcription factor AP-2 gamma |
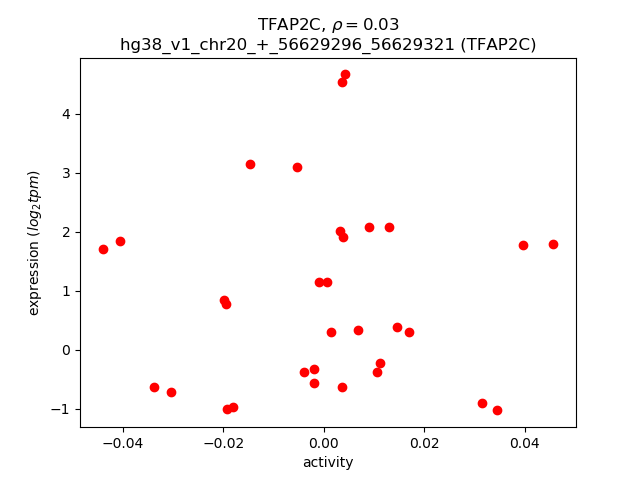
Activity-expression correlation:
| Gene | Promoter | Pearson corr. coef. | P-value | Plot |
|---|---|---|---|---|
| TFAP2C | hg38_v1_chr20_+_56629296_56629321 | 0.03 | 8.9e-01 | Click! |
Activity profile of TFAP2C motif
Sorted Z-values of TFAP2C motif
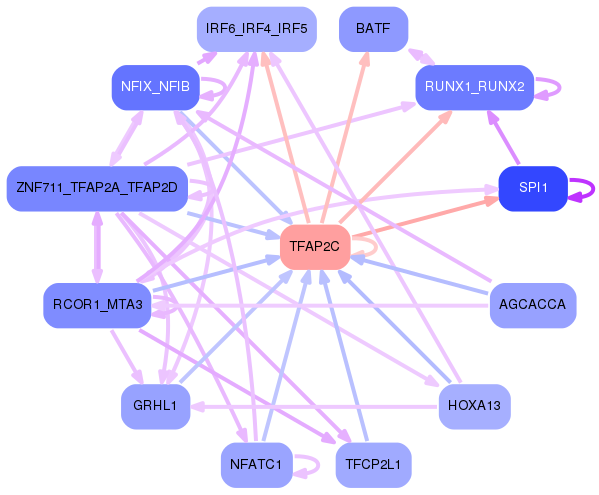
Network of associatons between targets according to the STRING database.

First level regulatory network of TFAP2C
Gene Ontology Analysis
Gene overrepresentation in biological process category:
| Log-likelihood per target | Total log-likelihood | Term | Description |
|---|---|---|---|
| 1.3 | 9.1 | GO:0044027 | hypermethylation of CpG island(GO:0044027) |
| 1.1 | 3.2 | GO:2000309 | positive regulation of tumor necrosis factor (ligand) superfamily member 11 production(GO:2000309) positive regulation of thymocyte migration(GO:2000412) |
| 1.0 | 2.9 | GO:1902309 | negative regulation of peptidyl-serine dephosphorylation(GO:1902309) |
| 0.8 | 3.2 | GO:0052251 | induction by symbiont of host defense response(GO:0044416) induction of host immune response by virus(GO:0046730) active induction of host immune response by virus(GO:0046732) modulation by symbiont of host defense response(GO:0052031) induction by organism of defense response of other organism involved in symbiotic interaction(GO:0052251) modulation by organism of defense response of other organism involved in symbiotic interaction(GO:0052255) positive regulation by symbiont of host defense response(GO:0052509) positive regulation by organism of defense response of other organism involved in symbiotic interaction(GO:0052510) modulation by organism of immune response of other organism involved in symbiotic interaction(GO:0052552) modulation by symbiont of host immune response(GO:0052553) modulation by virus of host immune response(GO:0075528) |
| 0.7 | 5.0 | GO:0051510 | regulation of unidimensional cell growth(GO:0051510) negative regulation of unidimensional cell growth(GO:0051511) establishment of cell polarity regulating cell shape(GO:0071964) regulation of establishment or maintenance of cell polarity regulating cell shape(GO:2000769) positive regulation of establishment or maintenance of cell polarity regulating cell shape(GO:2000771) regulation of establishment of cell polarity regulating cell shape(GO:2000782) positive regulation of establishment of cell polarity regulating cell shape(GO:2000784) positive regulation of barbed-end actin filament capping(GO:2000814) |
| 0.6 | 2.4 | GO:0002636 | positive regulation of germinal center formation(GO:0002636) |
| 0.6 | 1.8 | GO:1900135 | positive regulation of renin secretion into blood stream(GO:1900135) |
| 0.6 | 1.8 | GO:0070662 | mast cell proliferation(GO:0070662) |
| 0.6 | 1.1 | GO:0072535 | tumor necrosis factor (ligand) superfamily member 11 production(GO:0072535) regulation of tumor necrosis factor (ligand) superfamily member 11 production(GO:2000307) |
| 0.6 | 3.9 | GO:0046061 | dATP catabolic process(GO:0046061) |
| 0.5 | 1.6 | GO:0048250 | mitochondrial iron ion transport(GO:0048250) |
| 0.5 | 1.6 | GO:1904899 | regulation of hepatic stellate cell proliferation(GO:1904897) positive regulation of hepatic stellate cell proliferation(GO:1904899) hepatic stellate cell proliferation(GO:1990922) |
| 0.5 | 1.5 | GO:1904784 | NLRP1 inflammasome complex assembly(GO:1904784) |
| 0.5 | 1.4 | GO:0002380 | immunoglobulin secretion involved in immune response(GO:0002380) |
| 0.5 | 3.3 | GO:0033277 | abortive mitotic cell cycle(GO:0033277) |
| 0.5 | 2.3 | GO:0002545 | chronic inflammatory response to non-antigenic stimulus(GO:0002545) regulation of chronic inflammatory response to non-antigenic stimulus(GO:0002880) |
| 0.4 | 0.4 | GO:0051040 | regulation of calcium-independent cell-cell adhesion(GO:0051040) |
| 0.4 | 1.3 | GO:0002372 | myeloid dendritic cell cytokine production(GO:0002372) |
| 0.4 | 1.7 | GO:1904808 | regulation of protein oxidation(GO:1904806) positive regulation of protein oxidation(GO:1904808) |
| 0.4 | 1.6 | GO:0090285 | negative regulation of protein glycosylation in Golgi(GO:0090285) |
| 0.4 | 3.4 | GO:0035879 | plasma membrane lactate transport(GO:0035879) |
| 0.4 | 0.4 | GO:0042231 | interleukin-13 biosynthetic process(GO:0042231) |
| 0.4 | 1.1 | GO:0002277 | myeloid dendritic cell activation involved in immune response(GO:0002277) |
| 0.4 | 3.2 | GO:0014057 | positive regulation of acetylcholine secretion, neurotransmission(GO:0014057) |
| 0.3 | 0.7 | GO:0002302 | CD8-positive, alpha-beta T cell differentiation involved in immune response(GO:0002302) |
| 0.3 | 1.0 | GO:0051066 | dihydrobiopterin metabolic process(GO:0051066) |
| 0.3 | 1.0 | GO:0017186 | peptidyl-pyroglutamic acid biosynthetic process, using glutaminyl-peptide cyclotransferase(GO:0017186) |
| 0.3 | 1.0 | GO:1990709 | presynaptic active zone organization(GO:1990709) |
| 0.3 | 1.7 | GO:0038156 | interleukin-5-mediated signaling pathway(GO:0038043) interleukin-3-mediated signaling pathway(GO:0038156) |
| 0.3 | 2.0 | GO:0061030 | epithelial cell differentiation involved in mammary gland alveolus development(GO:0061030) |
| 0.3 | 1.0 | GO:0098884 | postsynaptic neurotransmitter receptor internalization(GO:0098884) |
| 0.3 | 0.9 | GO:0003218 | cardiac left ventricle formation(GO:0003218) |
| 0.3 | 0.9 | GO:0006667 | sphinganine metabolic process(GO:0006667) |
| 0.3 | 2.2 | GO:1903026 | negative regulation of RNA polymerase II regulatory region sequence-specific DNA binding(GO:1903026) |
| 0.3 | 8.3 | GO:0002523 | leukocyte migration involved in inflammatory response(GO:0002523) |
| 0.3 | 2.4 | GO:0071877 | regulation of adrenergic receptor signaling pathway(GO:0071877) |
| 0.3 | 1.2 | GO:1902308 | regulation of translational initiation by eIF2 alpha dephosphorylation(GO:0036496) regulation of endoplasmic reticulum stress-induced eIF2 alpha phosphorylation(GO:0060734) regulation of peptidyl-serine dephosphorylation(GO:1902308) positive regulation of peptidyl-serine dephosphorylation(GO:1902310) |
| 0.3 | 0.9 | GO:0046108 | uridine metabolic process(GO:0046108) |
| 0.3 | 0.9 | GO:0003099 | positive regulation of the force of heart contraction by chemical signal(GO:0003099) |
| 0.3 | 1.2 | GO:2000563 | positive regulation of CD4-positive, alpha-beta T cell proliferation(GO:2000563) |
| 0.3 | 0.6 | GO:1902512 | positive regulation of apoptotic DNA fragmentation(GO:1902512) |
| 0.3 | 2.0 | GO:1904694 | negative regulation of vascular smooth muscle contraction(GO:1904694) |
| 0.3 | 0.9 | GO:0035880 | embryonic nail plate morphogenesis(GO:0035880) |
| 0.3 | 0.8 | GO:1904845 | response to L-glutamine(GO:1904844) cellular response to L-glutamine(GO:1904845) |
| 0.3 | 2.5 | GO:0033632 | regulation of cell-cell adhesion mediated by integrin(GO:0033632) |
| 0.3 | 0.3 | GO:0071500 | cellular response to nitrosative stress(GO:0071500) |
| 0.3 | 0.8 | GO:1901491 | negative regulation of lymphangiogenesis(GO:1901491) |
| 0.3 | 0.8 | GO:0002415 | immunoglobulin transcytosis in epithelial cells mediated by polymeric immunoglobulin receptor(GO:0002415) |
| 0.3 | 1.1 | GO:0021849 | neuroblast division in subventricular zone(GO:0021849) |
| 0.3 | 0.8 | GO:0002503 | peptide antigen assembly with MHC class II protein complex(GO:0002503) |
| 0.3 | 0.8 | GO:0014810 | positive regulation of skeletal muscle contraction by regulation of release of sequestered calcium ion(GO:0014810) |
| 0.3 | 0.8 | GO:0046521 | sphingoid catabolic process(GO:0046521) |
| 0.3 | 9.1 | GO:0090023 | positive regulation of neutrophil chemotaxis(GO:0090023) |
| 0.3 | 0.8 | GO:0033341 | regulation of collagen binding(GO:0033341) |
| 0.3 | 1.3 | GO:0002357 | defense response to tumor cell(GO:0002357) |
| 0.3 | 1.6 | GO:0038112 | interleukin-8-mediated signaling pathway(GO:0038112) |
| 0.3 | 2.6 | GO:0001866 | NK T cell proliferation(GO:0001866) |
| 0.3 | 1.3 | GO:0032792 | negative regulation of CREB transcription factor activity(GO:0032792) |
| 0.3 | 0.8 | GO:1904266 | positive regulation of Schwann cell migration(GO:1900149) regulation of Schwann cell chemotaxis(GO:1904266) positive regulation of Schwann cell chemotaxis(GO:1904268) Schwann cell chemotaxis(GO:1990751) |
| 0.3 | 0.8 | GO:0046586 | regulation of calcium-dependent cell-cell adhesion(GO:0046586) |
| 0.3 | 1.8 | GO:1902962 | regulation of metalloendopeptidase activity involved in amyloid precursor protein catabolic process(GO:1902962) negative regulation of metalloendopeptidase activity involved in amyloid precursor protein catabolic process(GO:1902963) |
| 0.3 | 1.0 | GO:1904924 | negative regulation of mitophagy in response to mitochondrial depolarization(GO:1904924) |
| 0.3 | 0.8 | GO:0061011 | hepatic duct development(GO:0061011) |
| 0.3 | 0.8 | GO:0071529 | cementum mineralization(GO:0071529) |
| 0.2 | 3.5 | GO:1900623 | regulation of monocyte aggregation(GO:1900623) positive regulation of monocyte aggregation(GO:1900625) |
| 0.2 | 0.7 | GO:0002774 | Fc receptor mediated inhibitory signaling pathway(GO:0002774) |
| 0.2 | 1.2 | GO:0002361 | CD4-positive, CD25-positive, alpha-beta regulatory T cell differentiation(GO:0002361) |
| 0.2 | 1.7 | GO:0048298 | positive regulation of isotype switching to IgA isotypes(GO:0048298) |
| 0.2 | 1.2 | GO:0036414 | protein citrullination(GO:0018101) histone citrullination(GO:0036414) |
| 0.2 | 3.3 | GO:0031580 | membrane raft polarization(GO:0001766) membrane raft distribution(GO:0031580) |
| 0.2 | 0.9 | GO:2001302 | lipoxin biosynthetic process(GO:2001301) lipoxin A4 metabolic process(GO:2001302) lipoxin A4 biosynthetic process(GO:2001303) |
| 0.2 | 0.9 | GO:0060708 | spongiotrophoblast differentiation(GO:0060708) |
| 0.2 | 0.2 | GO:0000294 | nuclear-transcribed mRNA catabolic process, endonucleolytic cleavage-dependent decay(GO:0000294) |
| 0.2 | 0.5 | GO:0032915 | positive regulation of transforming growth factor beta2 production(GO:0032915) |
| 0.2 | 0.9 | GO:0032747 | positive regulation of interleukin-23 production(GO:0032747) |
| 0.2 | 2.0 | GO:0008626 | granzyme-mediated apoptotic signaling pathway(GO:0008626) |
| 0.2 | 0.9 | GO:0036060 | filtration diaphragm assembly(GO:0036058) slit diaphragm assembly(GO:0036060) |
| 0.2 | 0.7 | GO:0035508 | positive regulation of myosin-light-chain-phosphatase activity(GO:0035508) |
| 0.2 | 0.9 | GO:0060741 | prostate gland stromal morphogenesis(GO:0060741) |
| 0.2 | 0.4 | GO:0097029 | mature conventional dendritic cell differentiation(GO:0097029) |
| 0.2 | 1.3 | GO:0019747 | regulation of isoprenoid metabolic process(GO:0019747) |
| 0.2 | 0.4 | GO:0032707 | negative regulation of interleukin-23 production(GO:0032707) |
| 0.2 | 0.7 | GO:0055095 | lipoprotein particle mediated signaling(GO:0055095) low-density lipoprotein particle mediated signaling(GO:0055096) |
| 0.2 | 0.4 | GO:0038178 | complement component C5a signaling pathway(GO:0038178) |
| 0.2 | 1.1 | GO:0034756 | regulation of iron ion transport(GO:0034756) regulation of iron ion transmembrane transport(GO:0034759) |
| 0.2 | 0.6 | GO:0036510 | trimming of terminal mannose on C branch(GO:0036510) |
| 0.2 | 1.5 | GO:1902966 | membrane to membrane docking(GO:0022614) regulation of protein localization to early endosome(GO:1902965) positive regulation of protein localization to early endosome(GO:1902966) |
| 0.2 | 0.6 | GO:1902766 | skeletal muscle satellite cell migration(GO:1902766) |
| 0.2 | 1.3 | GO:0061762 | CAMKK-AMPK signaling cascade(GO:0061762) |
| 0.2 | 0.6 | GO:0002432 | granuloma formation(GO:0002432) |
| 0.2 | 0.8 | GO:0007113 | endomitotic cell cycle(GO:0007113) |
| 0.2 | 0.4 | GO:0014004 | microglia differentiation(GO:0014004) microglia development(GO:0014005) |
| 0.2 | 0.6 | GO:0045226 | extracellular polysaccharide biosynthetic process(GO:0045226) extracellular polysaccharide metabolic process(GO:0046379) |
| 0.2 | 3.3 | GO:0070779 | D-aspartate transport(GO:0070777) D-aspartate import(GO:0070779) |
| 0.2 | 0.6 | GO:1901301 | regulation of cargo loading into COPII-coated vesicle(GO:1901301) |
| 0.2 | 0.6 | GO:0002416 | IgG immunoglobulin transcytosis in epithelial cells mediated by FcRn immunoglobulin receptor(GO:0002416) |
| 0.2 | 0.8 | GO:0018125 | peptidyl-cysteine methylation(GO:0018125) |
| 0.2 | 2.6 | GO:0071492 | cellular response to UV-A(GO:0071492) |
| 0.2 | 0.8 | GO:0002725 | negative regulation of T cell cytokine production(GO:0002725) |
| 0.2 | 1.0 | GO:2001184 | positive regulation of interleukin-12 secretion(GO:2001184) |
| 0.2 | 0.8 | GO:0006670 | sphingosine metabolic process(GO:0006670) |
| 0.2 | 0.8 | GO:1903238 | positive regulation of leukocyte tethering or rolling(GO:1903238) |
| 0.2 | 1.5 | GO:0071802 | negative regulation of podosome assembly(GO:0071802) |
| 0.2 | 0.6 | GO:0035526 | retrograde transport, plasma membrane to Golgi(GO:0035526) |
| 0.2 | 4.0 | GO:0003376 | sphingosine-1-phosphate signaling pathway(GO:0003376) |
| 0.2 | 0.6 | GO:0002121 | inter-male aggressive behavior(GO:0002121) |
| 0.2 | 3.0 | GO:0090168 | Golgi reassembly(GO:0090168) |
| 0.2 | 0.6 | GO:1900154 | regulation of bone trabecula formation(GO:1900154) negative regulation of bone trabecula formation(GO:1900155) |
| 0.2 | 0.8 | GO:1990108 | protein linear deubiquitination(GO:1990108) |
| 0.2 | 0.9 | GO:0045079 | negative regulation of chemokine biosynthetic process(GO:0045079) |
| 0.2 | 2.9 | GO:0030854 | positive regulation of granulocyte differentiation(GO:0030854) |
| 0.2 | 1.1 | GO:0090272 | negative regulation of fibroblast growth factor production(GO:0090272) |
| 0.2 | 0.2 | GO:0051877 | pigment granule aggregation in cell center(GO:0051877) |
| 0.2 | 0.3 | GO:0010387 | COP9 signalosome assembly(GO:0010387) |
| 0.2 | 0.3 | GO:0045013 | carbon catabolite repression of transcription(GO:0045013) negative regulation of transcription by glucose(GO:0045014) |
| 0.2 | 0.7 | GO:0070317 | negative regulation of G0 to G1 transition(GO:0070317) |
| 0.2 | 1.0 | GO:1902045 | negative regulation of Fas signaling pathway(GO:1902045) |
| 0.2 | 2.4 | GO:0002291 | T cell activation via T cell receptor contact with antigen bound to MHC molecule on antigen presenting cell(GO:0002291) |
| 0.2 | 0.5 | GO:0070625 | zymogen granule exocytosis(GO:0070625) |
| 0.2 | 6.5 | GO:0071800 | podosome assembly(GO:0071800) |
| 0.2 | 1.2 | GO:0010986 | positive regulation of lipoprotein particle clearance(GO:0010986) |
| 0.2 | 4.5 | GO:0070233 | negative regulation of T cell apoptotic process(GO:0070233) |
| 0.2 | 0.5 | GO:0016267 | O-glycan processing, core 1(GO:0016267) |
| 0.2 | 2.0 | GO:0070560 | protein secretion by platelet(GO:0070560) |
| 0.2 | 0.5 | GO:0030974 | thiamine pyrophosphate transport(GO:0030974) |
| 0.2 | 1.0 | GO:0038007 | netrin-activated signaling pathway(GO:0038007) |
| 0.2 | 2.3 | GO:1900017 | positive regulation of cytokine production involved in inflammatory response(GO:1900017) |
| 0.2 | 0.8 | GO:0071596 | ubiquitin-dependent protein catabolic process via the N-end rule pathway(GO:0071596) |
| 0.2 | 0.5 | GO:0006683 | galactosylceramide catabolic process(GO:0006683) |
| 0.2 | 0.5 | GO:1903597 | negative regulation of gap junction assembly(GO:1903597) |
| 0.2 | 0.5 | GO:0002316 | follicular B cell differentiation(GO:0002316) |
| 0.2 | 0.6 | GO:1905045 | Schwann cell proliferation involved in axon regeneration(GO:0014011) Schwann cell migration(GO:0036135) regulation of Schwann cell migration(GO:1900147) negative regulation of Schwann cell migration(GO:1900148) regulation of Schwann cell proliferation involved in axon regeneration(GO:1905044) negative regulation of Schwann cell proliferation involved in axon regeneration(GO:1905045) |
| 0.2 | 0.8 | GO:0042369 | vitamin D catabolic process(GO:0042369) |
| 0.2 | 0.5 | GO:0090170 | regulation of Golgi inheritance(GO:0090170) |
| 0.2 | 0.8 | GO:0035854 | regulation of primitive erythrocyte differentiation(GO:0010725) eosinophil fate commitment(GO:0035854) |
| 0.2 | 0.3 | GO:0042940 | D-amino acid transport(GO:0042940) |
| 0.2 | 1.7 | GO:2000580 | regulation of ATP-dependent microtubule motor activity, plus-end-directed(GO:2000580) positive regulation of ATP-dependent microtubule motor activity, plus-end-directed(GO:2000582) |
| 0.2 | 0.9 | GO:2001245 | regulation of phosphatidylcholine biosynthetic process(GO:2001245) |
| 0.2 | 0.2 | GO:1903004 | regulation of protein K63-linked deubiquitination(GO:1903004) positive regulation of protein K63-linked deubiquitination(GO:1903006) |
| 0.2 | 0.6 | GO:2000752 | regulation of phospholipid scramblase activity(GO:1900161) positive regulation of phospholipid scramblase activity(GO:1900163) regulation of glucosylceramide catabolic process(GO:2000752) positive regulation of glucosylceramide catabolic process(GO:2000753) regulation of sphingomyelin catabolic process(GO:2000754) positive regulation of sphingomyelin catabolic process(GO:2000755) |
| 0.2 | 2.1 | GO:0051683 | establishment of Golgi localization(GO:0051683) |
| 0.2 | 1.1 | GO:0010757 | negative regulation of plasminogen activation(GO:0010757) |
| 0.2 | 1.2 | GO:0032494 | response to peptidoglycan(GO:0032494) |
| 0.1 | 0.9 | GO:0051461 | positive regulation of corticotropin secretion(GO:0051461) |
| 0.1 | 0.7 | GO:0045084 | positive regulation of interleukin-12 biosynthetic process(GO:0045084) |
| 0.1 | 0.9 | GO:0030037 | actin filament reorganization involved in cell cycle(GO:0030037) |
| 0.1 | 0.6 | GO:0070650 | endoplasmic reticulum polarization(GO:0061163) actin filament bundle retrograde transport(GO:0061573) actin filament bundle distribution(GO:0070650) |
| 0.1 | 0.3 | GO:0033025 | mast cell homeostasis(GO:0033023) mast cell apoptotic process(GO:0033024) regulation of mast cell apoptotic process(GO:0033025) |
| 0.1 | 0.9 | GO:0007386 | compartment pattern specification(GO:0007386) |
| 0.1 | 0.4 | GO:0019417 | sulfur oxidation(GO:0019417) |
| 0.1 | 2.0 | GO:1901223 | negative regulation of NIK/NF-kappaB signaling(GO:1901223) |
| 0.1 | 0.6 | GO:0016334 | morphogenesis of follicular epithelium(GO:0016333) establishment or maintenance of polarity of follicular epithelium(GO:0016334) establishment of planar polarity of follicular epithelium(GO:0042247) |
| 0.1 | 0.4 | GO:0043973 | histone H3-K4 acetylation(GO:0043973) |
| 0.1 | 0.4 | GO:0046081 | dUTP metabolic process(GO:0046080) dUTP catabolic process(GO:0046081) |
| 0.1 | 0.7 | GO:0010593 | negative regulation of lamellipodium assembly(GO:0010593) |
| 0.1 | 2.3 | GO:0048304 | positive regulation of isotype switching to IgG isotypes(GO:0048304) |
| 0.1 | 0.6 | GO:0045074 | interleukin-10 biosynthetic process(GO:0042091) regulation of interleukin-10 biosynthetic process(GO:0045074) |
| 0.1 | 2.4 | GO:0007144 | female meiosis I(GO:0007144) |
| 0.1 | 0.4 | GO:0045659 | regulation of neutrophil differentiation(GO:0045658) negative regulation of neutrophil differentiation(GO:0045659) |
| 0.1 | 0.8 | GO:0002317 | plasma cell differentiation(GO:0002317) |
| 0.1 | 0.4 | GO:1901291 | negative regulation of double-strand break repair via single-strand annealing(GO:1901291) |
| 0.1 | 0.4 | GO:0098974 | postsynaptic actin cytoskeleton organization(GO:0098974) |
| 0.1 | 0.8 | GO:0098838 | reduced folate transmembrane transport(GO:0098838) |
| 0.1 | 0.4 | GO:1901069 | guanosine-containing compound catabolic process(GO:1901069) |
| 0.1 | 0.5 | GO:1904616 | regulation of actin filament binding(GO:1904529) regulation of actin binding(GO:1904616) |
| 0.1 | 0.7 | GO:1900165 | negative regulation of interleukin-6 secretion(GO:1900165) |
| 0.1 | 5.2 | GO:0042347 | negative regulation of NF-kappaB import into nucleus(GO:0042347) |
| 0.1 | 0.4 | GO:0030185 | nitric oxide transport(GO:0030185) carbon dioxide transmembrane transport(GO:0035378) |
| 0.1 | 1.1 | GO:0061738 | late endosomal microautophagy(GO:0061738) |
| 0.1 | 0.5 | GO:0098989 | NMDA selective glutamate receptor signaling pathway(GO:0098989) |
| 0.1 | 3.3 | GO:0034356 | NAD biosynthesis via nicotinamide riboside salvage pathway(GO:0034356) |
| 0.1 | 0.4 | GO:2000797 | amniotic stem cell differentiation(GO:0097086) negative regulation of dense core granule biogenesis(GO:2000706) negative regulation of mesenchymal stem cell differentiation(GO:2000740) regulation of amniotic stem cell differentiation(GO:2000797) negative regulation of amniotic stem cell differentiation(GO:2000798) |
| 0.1 | 0.8 | GO:2001106 | regulation of Rho guanyl-nucleotide exchange factor activity(GO:2001106) |
| 0.1 | 1.3 | GO:0097338 | response to clozapine(GO:0097338) |
| 0.1 | 0.3 | GO:1903526 | negative regulation of membrane tubulation(GO:1903526) |
| 0.1 | 0.4 | GO:0086092 | regulation of the force of heart contraction by cardiac conduction(GO:0086092) |
| 0.1 | 0.5 | GO:0070345 | negative regulation of fat cell proliferation(GO:0070345) |
| 0.1 | 0.6 | GO:0060020 | Bergmann glial cell differentiation(GO:0060020) |
| 0.1 | 1.4 | GO:1901660 | calcium ion export(GO:1901660) calcium ion export from cell(GO:1990034) |
| 0.1 | 1.4 | GO:0051611 | negative regulation of neurotransmitter uptake(GO:0051581) regulation of serotonin uptake(GO:0051611) negative regulation of serotonin uptake(GO:0051612) |
| 0.1 | 0.8 | GO:0072385 | minus-end-directed organelle transport along microtubule(GO:0072385) |
| 0.1 | 3.4 | GO:0043011 | myeloid dendritic cell differentiation(GO:0043011) |
| 0.1 | 0.4 | GO:0035724 | CD24 biosynthetic process(GO:0035724) activation of meiosis involved in egg activation(GO:0060466) negative regulation of monocyte extravasation(GO:2000438) regulation of CD24 biosynthetic process(GO:2000559) positive regulation of CD24 biosynthetic process(GO:2000560) |
| 0.1 | 2.4 | GO:0050862 | positive regulation of T cell receptor signaling pathway(GO:0050862) |
| 0.1 | 1.2 | GO:2001206 | positive regulation of osteoclast development(GO:2001206) |
| 0.1 | 0.5 | GO:0052419 | multi-organism catabolic process(GO:0044035) development of symbiont involved in interaction with host(GO:0044115) modulation of development of symbiont involved in interaction with host(GO:0044145) negative regulation of development of symbiont involved in interaction with host(GO:0044147) metabolism of substance in other organism involved in symbiotic interaction(GO:0052214) catabolism of substance in other organism involved in symbiotic interaction(GO:0052227) metabolism of macromolecule in other organism involved in symbiotic interaction(GO:0052229) catabolism by host of symbiont macromolecule(GO:0052360) catabolism by organism of macromolecule in other organism involved in symbiotic interaction(GO:0052361) catabolism by host of symbiont protein(GO:0052362) catabolism by organism of protein in other organism involved in symbiotic interaction(GO:0052363) catabolism by host of substance in symbiont(GO:0052364) metabolism by host of symbiont macromolecule(GO:0052416) metabolism by host of symbiont protein(GO:0052417) metabolism by organism of protein in other organism involved in symbiotic interaction(GO:0052418) metabolism by host of substance in symbiont(GO:0052419) |
| 0.1 | 0.6 | GO:0071894 | histone H2B conserved C-terminal lysine ubiquitination(GO:0071894) |
| 0.1 | 0.6 | GO:0097501 | stress response to metal ion(GO:0097501) |
| 0.1 | 1.1 | GO:0043031 | negative regulation of macrophage activation(GO:0043031) |
| 0.1 | 2.9 | GO:0036149 | phosphatidylinositol acyl-chain remodeling(GO:0036149) |
| 0.1 | 0.6 | GO:0018057 | peptidyl-lysine oxidation(GO:0018057) |
| 0.1 | 1.1 | GO:0051902 | negative regulation of mitochondrial depolarization(GO:0051902) |
| 0.1 | 0.4 | GO:2000646 | positive regulation of receptor catabolic process(GO:2000646) |
| 0.1 | 2.0 | GO:0016540 | protein autoprocessing(GO:0016540) |
| 0.1 | 1.1 | GO:0002480 | antigen processing and presentation of exogenous peptide antigen via MHC class I, TAP-independent(GO:0002480) |
| 0.1 | 2.2 | GO:0090292 | nuclear matrix anchoring at nuclear membrane(GO:0090292) |
| 0.1 | 2.3 | GO:1904714 | regulation of chaperone-mediated autophagy(GO:1904714) |
| 0.1 | 0.5 | GO:1903755 | regulation of SUMO transferase activity(GO:1903182) positive regulation of SUMO transferase activity(GO:1903755) |
| 0.1 | 0.2 | GO:0003192 | mitral valve formation(GO:0003192) |
| 0.1 | 1.0 | GO:0033132 | negative regulation of glucokinase activity(GO:0033132) negative regulation of hexokinase activity(GO:1903300) |
| 0.1 | 0.8 | GO:0046477 | glycosylceramide catabolic process(GO:0046477) |
| 0.1 | 0.9 | GO:0007296 | vitellogenesis(GO:0007296) |
| 0.1 | 0.8 | GO:0090038 | negative regulation of protein kinase C signaling(GO:0090038) |
| 0.1 | 0.9 | GO:0072402 | response to cell cycle checkpoint signaling(GO:0072396) response to DNA integrity checkpoint signaling(GO:0072402) response to DNA damage checkpoint signaling(GO:0072423) |
| 0.1 | 0.3 | GO:0019858 | cytosine metabolic process(GO:0019858) |
| 0.1 | 1.3 | GO:0043152 | induction of bacterial agglutination(GO:0043152) |
| 0.1 | 0.3 | GO:0034552 | respiratory chain complex II assembly(GO:0034552) mitochondrial respiratory chain complex II assembly(GO:0034553) mitochondrial respiratory chain complex II biogenesis(GO:0097032) |
| 0.1 | 1.0 | GO:0032929 | negative regulation of superoxide anion generation(GO:0032929) |
| 0.1 | 24.3 | GO:0038096 | immune response-regulating cell surface receptor signaling pathway involved in phagocytosis(GO:0002433) Fc-gamma receptor signaling pathway involved in phagocytosis(GO:0038096) |
| 0.1 | 0.8 | GO:0060352 | cell adhesion molecule production(GO:0060352) |
| 0.1 | 1.9 | GO:0006878 | cellular copper ion homeostasis(GO:0006878) |
| 0.1 | 0.7 | GO:0002318 | myeloid progenitor cell differentiation(GO:0002318) |
| 0.1 | 1.0 | GO:0055129 | L-proline biosynthetic process(GO:0055129) |
| 0.1 | 1.1 | GO:0015691 | cadmium ion transport(GO:0015691) cadmium ion transmembrane transport(GO:0070574) |
| 0.1 | 2.5 | GO:0043562 | cellular response to nitrogen starvation(GO:0006995) cellular response to nitrogen levels(GO:0043562) |
| 0.1 | 2.7 | GO:1903540 | neurotransmitter receptor transport to postsynaptic membrane(GO:0098969) establishment of protein localization to postsynaptic membrane(GO:1903540) |
| 0.1 | 0.4 | GO:1902269 | positive regulation of polyamine transmembrane transport(GO:1902269) |
| 0.1 | 0.5 | GO:0034146 | toll-like receptor 5 signaling pathway(GO:0034146) |
| 0.1 | 0.3 | GO:0042137 | sequestering of neurotransmitter(GO:0042137) |
| 0.1 | 1.4 | GO:0034144 | negative regulation of toll-like receptor 4 signaling pathway(GO:0034144) |
| 0.1 | 0.4 | GO:1902530 | regulation of protein linear polyubiquitination(GO:1902528) positive regulation of protein linear polyubiquitination(GO:1902530) |
| 0.1 | 0.4 | GO:0090027 | negative regulation of monocyte chemotaxis(GO:0090027) |
| 0.1 | 0.4 | GO:0045065 | cytotoxic T cell differentiation(GO:0045065) |
| 0.1 | 0.3 | GO:0010512 | negative regulation of phosphatidylinositol biosynthetic process(GO:0010512) |
| 0.1 | 0.5 | GO:0090156 | negative regulation of sphingolipid biosynthetic process(GO:0090155) cellular sphingolipid homeostasis(GO:0090156) negative regulation of ceramide biosynthetic process(GO:1900060) |
| 0.1 | 0.3 | GO:0099553 | trans-synaptic signaling by lipid, modulating synaptic transmission(GO:0099552) trans-synaptic signaling by endocannabinoid, modulating synaptic transmission(GO:0099553) |
| 0.1 | 0.6 | GO:0051121 | hepoxilin metabolic process(GO:0051121) hepoxilin biosynthetic process(GO:0051122) |
| 0.1 | 0.4 | GO:0046833 | positive regulation of RNA export from nucleus(GO:0046833) |
| 0.1 | 0.7 | GO:0034351 | regulation of glial cell apoptotic process(GO:0034350) negative regulation of glial cell apoptotic process(GO:0034351) |
| 0.1 | 0.4 | GO:0060928 | atrioventricular node development(GO:0003162) cardiac septum cell differentiation(GO:0003292) atrioventricular node cell differentiation(GO:0060922) atrioventricular node cell development(GO:0060928) |
| 0.1 | 0.3 | GO:0072138 | mesenchymal cell proliferation involved in ureteric bud development(GO:0072138) |
| 0.1 | 0.9 | GO:0034316 | negative regulation of Arp2/3 complex-mediated actin nucleation(GO:0034316) |
| 0.1 | 3.1 | GO:0050774 | negative regulation of dendrite morphogenesis(GO:0050774) |
| 0.1 | 0.6 | GO:1903232 | melanosome assembly(GO:1903232) |
| 0.1 | 1.2 | GO:0002430 | complement receptor mediated signaling pathway(GO:0002430) |
| 0.1 | 0.3 | GO:0002769 | natural killer cell inhibitory signaling pathway(GO:0002769) |
| 0.1 | 10.6 | GO:0032945 | negative regulation of mononuclear cell proliferation(GO:0032945) negative regulation of lymphocyte proliferation(GO:0050672) |
| 0.1 | 0.4 | GO:1902724 | positive regulation of skeletal muscle cell proliferation(GO:0014858) positive regulation of skeletal muscle satellite cell proliferation(GO:1902724) positive regulation of growth factor dependent skeletal muscle satellite cell proliferation(GO:1902728) |
| 0.1 | 1.7 | GO:0002315 | marginal zone B cell differentiation(GO:0002315) |
| 0.1 | 1.2 | GO:0007256 | activation of JNKK activity(GO:0007256) |
| 0.1 | 0.3 | GO:1904719 | excitatory chemical synaptic transmission(GO:0098976) regulation of AMPA glutamate receptor clustering(GO:1904717) positive regulation of AMPA glutamate receptor clustering(GO:1904719) |
| 0.1 | 0.6 | GO:0010609 | mRNA localization resulting in posttranscriptional regulation of gene expression(GO:0010609) |
| 0.1 | 0.3 | GO:1903121 | regulation of TRAIL-activated apoptotic signaling pathway(GO:1903121) positive regulation of TRAIL-activated apoptotic signaling pathway(GO:1903984) |
| 0.1 | 0.3 | GO:0097698 | telomere maintenance via base-excision repair(GO:0097698) |
| 0.1 | 0.5 | GO:0018352 | protein-pyridoxal-5-phosphate linkage(GO:0018352) |
| 0.1 | 0.4 | GO:0006121 | mitochondrial electron transport, succinate to ubiquinone(GO:0006121) |
| 0.1 | 1.0 | GO:0051694 | pointed-end actin filament capping(GO:0051694) |
| 0.1 | 0.6 | GO:0060332 | positive regulation of response to interferon-gamma(GO:0060332) positive regulation of interferon-gamma-mediated signaling pathway(GO:0060335) |
| 0.1 | 0.4 | GO:0090647 | modulation of age-related behavioral decline(GO:0090647) |
| 0.1 | 0.3 | GO:1904562 | phosphatidylinositol 5-phosphate metabolic process(GO:1904562) |
| 0.1 | 0.5 | GO:0060837 | blood vessel endothelial cell differentiation(GO:0060837) |
| 0.1 | 0.2 | GO:0072197 | ureter morphogenesis(GO:0072197) |
| 0.1 | 0.4 | GO:0035624 | receptor transactivation(GO:0035624) |
| 0.1 | 0.4 | GO:0032595 | B cell receptor transport within lipid bilayer(GO:0032595) B cell receptor transport into membrane raft(GO:0032597) protein transport out of membrane raft(GO:0032599) chemokine receptor transport out of membrane raft(GO:0032600) negative regulation of transforming growth factor beta3 production(GO:0032913) chemokine receptor transport within lipid bilayer(GO:0033606) |
| 0.1 | 0.2 | GO:0090271 | positive regulation of fibroblast growth factor production(GO:0090271) |
| 0.1 | 0.7 | GO:0051280 | negative regulation of release of sequestered calcium ion into cytosol(GO:0051280) |
| 0.1 | 0.7 | GO:0031133 | regulation of axon diameter(GO:0031133) |
| 0.1 | 1.1 | GO:0030321 | transepithelial chloride transport(GO:0030321) |
| 0.1 | 0.9 | GO:0032264 | IMP salvage(GO:0032264) |
| 0.1 | 0.3 | GO:1901857 | positive regulation of cellular respiration(GO:1901857) |
| 0.1 | 0.5 | GO:0015888 | thiamine transport(GO:0015888) |
| 0.1 | 0.9 | GO:0042985 | negative regulation of amyloid precursor protein biosynthetic process(GO:0042985) |
| 0.1 | 1.1 | GO:0097113 | AMPA glutamate receptor clustering(GO:0097113) glutamate receptor clustering(GO:0097688) |
| 0.1 | 7.2 | GO:0006910 | phagocytosis, recognition(GO:0006910) |
| 0.1 | 1.6 | GO:0019371 | cyclooxygenase pathway(GO:0019371) |
| 0.1 | 0.8 | GO:0018243 | protein O-linked glycosylation via threonine(GO:0018243) |
| 0.1 | 0.4 | GO:0036071 | N-glycan fucosylation(GO:0036071) |
| 0.1 | 2.1 | GO:2000251 | positive regulation of actin cytoskeleton reorganization(GO:2000251) |
| 0.1 | 0.8 | GO:0007172 | signal complex assembly(GO:0007172) |
| 0.1 | 1.2 | GO:0033227 | dsRNA transport(GO:0033227) |
| 0.1 | 0.3 | GO:0036304 | umbilical cord morphogenesis(GO:0036304) umbilical cord development(GO:0061027) |
| 0.1 | 1.7 | GO:0038166 | angiotensin-activated signaling pathway(GO:0038166) |
| 0.1 | 1.1 | GO:0045779 | negative regulation of bone resorption(GO:0045779) |
| 0.1 | 1.0 | GO:0061087 | positive regulation of histone H3-K27 methylation(GO:0061087) |
| 0.1 | 0.4 | GO:2000182 | regulation of progesterone biosynthetic process(GO:2000182) |
| 0.1 | 0.3 | GO:0003430 | growth plate cartilage chondrocyte growth(GO:0003430) |
| 0.1 | 2.0 | GO:0032486 | Rap protein signal transduction(GO:0032486) |
| 0.1 | 0.4 | GO:2000312 | regulation of kainate selective glutamate receptor activity(GO:2000312) |
| 0.1 | 0.9 | GO:0031087 | deadenylation-independent decapping of nuclear-transcribed mRNA(GO:0031087) |
| 0.1 | 0.7 | GO:0097011 | cellular response to granulocyte macrophage colony-stimulating factor stimulus(GO:0097011) response to granulocyte macrophage colony-stimulating factor(GO:0097012) |
| 0.1 | 1.0 | GO:1901409 | positive regulation of phosphorylation of RNA polymerase II C-terminal domain(GO:1901409) |
| 0.1 | 0.1 | GO:1902959 | regulation of aspartic-type endopeptidase activity involved in amyloid precursor protein catabolic process(GO:1902959) regulation of aspartic-type peptidase activity(GO:1905245) |
| 0.1 | 0.3 | GO:1990523 | bone regeneration(GO:1990523) |
| 0.1 | 0.3 | GO:0071624 | positive regulation of granulocyte chemotaxis(GO:0071624) |
| 0.1 | 0.3 | GO:0071344 | diphosphate metabolic process(GO:0071344) |
| 0.1 | 0.4 | GO:1903613 | regulation of protein tyrosine phosphatase activity(GO:1903613) positive regulation of protein tyrosine phosphatase activity(GO:1903615) |
| 0.1 | 1.9 | GO:0001829 | trophectodermal cell differentiation(GO:0001829) |
| 0.1 | 0.8 | GO:0006003 | fructose 2,6-bisphosphate metabolic process(GO:0006003) |
| 0.1 | 0.2 | GO:0044725 | chromatin reprogramming in the zygote(GO:0044725) |
| 0.1 | 0.6 | GO:2000491 | positive regulation of hepatic stellate cell activation(GO:2000491) |
| 0.1 | 3.3 | GO:0007035 | vacuolar acidification(GO:0007035) |
| 0.1 | 0.7 | GO:2000124 | regulation of endocannabinoid signaling pathway(GO:2000124) |
| 0.1 | 0.7 | GO:0060295 | regulation of cilium movement involved in cell motility(GO:0060295) regulation of cilium beat frequency involved in ciliary motility(GO:0060296) regulation of cilium-dependent cell motility(GO:1902019) |
| 0.1 | 0.4 | GO:0002329 | pre-B cell differentiation(GO:0002329) |
| 0.1 | 0.2 | GO:0052314 | phytoalexin metabolic process(GO:0052314) |
| 0.1 | 0.2 | GO:0014028 | notochord formation(GO:0014028) |
| 0.1 | 0.7 | GO:0021759 | globus pallidus development(GO:0021759) |
| 0.1 | 0.3 | GO:0035498 | carnosine metabolic process(GO:0035498) |
| 0.1 | 0.4 | GO:0034154 | toll-like receptor 7 signaling pathway(GO:0034154) |
| 0.1 | 1.6 | GO:0001574 | ganglioside biosynthetic process(GO:0001574) |
| 0.1 | 1.0 | GO:0002407 | dendritic cell chemotaxis(GO:0002407) |
| 0.1 | 0.6 | GO:0032097 | positive regulation of response to food(GO:0032097) positive regulation of appetite(GO:0032100) |
| 0.1 | 0.5 | GO:0002826 | negative regulation of T-helper 1 type immune response(GO:0002826) |
| 0.1 | 1.3 | GO:1903818 | positive regulation of voltage-gated potassium channel activity(GO:1903818) |
| 0.1 | 0.4 | GO:0032425 | positive regulation of mismatch repair(GO:0032425) |
| 0.1 | 0.2 | GO:0097680 | double-strand break repair via classical nonhomologous end joining(GO:0097680) |
| 0.1 | 0.4 | GO:0014886 | transition between slow and fast fiber(GO:0014886) |
| 0.1 | 0.9 | GO:0097623 | potassium ion export across plasma membrane(GO:0097623) |
| 0.1 | 0.4 | GO:0071896 | protein localization to adherens junction(GO:0071896) |
| 0.1 | 0.2 | GO:0055118 | negative regulation of cardiac muscle contraction(GO:0055118) |
| 0.1 | 2.0 | GO:0045730 | respiratory burst(GO:0045730) |
| 0.1 | 1.6 | GO:0061470 | T follicular helper cell differentiation(GO:0061470) |
| 0.1 | 1.1 | GO:0015014 | heparan sulfate proteoglycan biosynthetic process, polysaccharide chain biosynthetic process(GO:0015014) |
| 0.1 | 0.8 | GO:0033631 | cell-cell adhesion mediated by integrin(GO:0033631) |
| 0.1 | 0.6 | GO:0070383 | DNA cytosine deamination(GO:0070383) |
| 0.1 | 1.1 | GO:0043249 | erythrocyte maturation(GO:0043249) |
| 0.1 | 1.0 | GO:0080182 | histone H3-K4 trimethylation(GO:0080182) |
| 0.1 | 2.0 | GO:0015671 | oxygen transport(GO:0015671) |
| 0.1 | 0.3 | GO:0009786 | regulation of asymmetric cell division(GO:0009786) |
| 0.1 | 1.0 | GO:0001973 | adenosine receptor signaling pathway(GO:0001973) |
| 0.1 | 0.7 | GO:1902254 | negative regulation of intrinsic apoptotic signaling pathway by p53 class mediator(GO:1902254) |
| 0.1 | 0.1 | GO:0006620 | posttranslational protein targeting to membrane(GO:0006620) |
| 0.1 | 0.3 | GO:1902683 | regulation of receptor localization to synapse(GO:1902683) |
| 0.1 | 1.5 | GO:0007202 | activation of phospholipase C activity(GO:0007202) |
| 0.1 | 0.4 | GO:0060672 | epithelial cell differentiation involved in embryonic placenta development(GO:0060671) epithelial cell morphogenesis involved in placental branching(GO:0060672) |
| 0.1 | 0.4 | GO:0033383 | geranyl diphosphate metabolic process(GO:0033383) geranyl diphosphate biosynthetic process(GO:0033384) farnesyl diphosphate biosynthetic process(GO:0045337) |
| 0.1 | 1.6 | GO:0006068 | ethanol catabolic process(GO:0006068) |
| 0.1 | 0.3 | GO:0021538 | epithalamus development(GO:0021538) habenula development(GO:0021986) |
| 0.1 | 0.1 | GO:0043335 | protein unfolding(GO:0043335) |
| 0.1 | 0.2 | GO:0036451 | cap mRNA methylation(GO:0036451) |
| 0.1 | 0.6 | GO:0090336 | positive regulation of brown fat cell differentiation(GO:0090336) |
| 0.1 | 0.3 | GO:0046963 | 3'-phosphoadenosine 5'-phosphosulfate transport(GO:0046963) 3'-phospho-5'-adenylyl sulfate transmembrane transport(GO:1902559) |
| 0.1 | 5.0 | GO:0031295 | T cell costimulation(GO:0031295) |
| 0.1 | 0.4 | GO:0006701 | progesterone biosynthetic process(GO:0006701) |
| 0.1 | 0.2 | GO:0051684 | maintenance of Golgi location(GO:0051684) |
| 0.1 | 0.3 | GO:0010585 | glutamine secretion(GO:0010585) L-glutamine import(GO:0036229) L-glutamine import into cell(GO:1903803) |
| 0.1 | 0.1 | GO:0042998 | positive regulation of Golgi to plasma membrane protein transport(GO:0042998) |
| 0.1 | 0.4 | GO:2000286 | receptor internalization involved in canonical Wnt signaling pathway(GO:2000286) |
| 0.1 | 0.1 | GO:0072194 | kidney smooth muscle tissue development(GO:0072194) |
| 0.1 | 0.4 | GO:0098937 | dendritic transport(GO:0098935) anterograde dendritic transport(GO:0098937) |
| 0.1 | 0.2 | GO:0090222 | centrosome-templated microtubule nucleation(GO:0090222) |
| 0.1 | 0.2 | GO:0008355 | olfactory learning(GO:0008355) |
| 0.1 | 0.9 | GO:0035878 | nail development(GO:0035878) |
| 0.1 | 1.0 | GO:0097286 | iron ion import(GO:0097286) |
| 0.1 | 0.9 | GO:0002043 | blood vessel endothelial cell proliferation involved in sprouting angiogenesis(GO:0002043) |
| 0.1 | 0.3 | GO:2001046 | positive regulation of integrin-mediated signaling pathway(GO:2001046) |
| 0.1 | 0.4 | GO:1900242 | regulation of synaptic vesicle endocytosis(GO:1900242) |
| 0.1 | 0.5 | GO:0032914 | positive regulation of transforming growth factor beta1 production(GO:0032914) |
| 0.1 | 1.5 | GO:0000185 | activation of MAPKKK activity(GO:0000185) |
| 0.1 | 1.5 | GO:0040015 | negative regulation of multicellular organism growth(GO:0040015) |
| 0.1 | 0.8 | GO:0030091 | protein repair(GO:0030091) |
| 0.1 | 0.5 | GO:0038110 | interleukin-2-mediated signaling pathway(GO:0038110) |
| 0.1 | 0.5 | GO:0006741 | NADP biosynthetic process(GO:0006741) |
| 0.1 | 0.4 | GO:0010579 | regulation of adenylate cyclase activity involved in G-protein coupled receptor signaling pathway(GO:0010578) positive regulation of adenylate cyclase activity involved in G-protein coupled receptor signaling pathway(GO:0010579) |
| 0.1 | 2.4 | GO:0097503 | sialylation(GO:0097503) |
| 0.1 | 0.6 | GO:1903715 | regulation of aerobic respiration(GO:1903715) |
| 0.1 | 0.6 | GO:0090158 | endoplasmic reticulum membrane organization(GO:0090158) |
| 0.1 | 0.6 | GO:0038183 | bile acid signaling pathway(GO:0038183) |
| 0.1 | 0.1 | GO:0038145 | macrophage colony-stimulating factor signaling pathway(GO:0038145) |
| 0.1 | 0.9 | GO:0034498 | early endosome to Golgi transport(GO:0034498) |
| 0.1 | 0.4 | GO:0000117 | regulation of transcription involved in G2/M transition of mitotic cell cycle(GO:0000117) |
| 0.1 | 0.1 | GO:0070564 | positive regulation of vitamin D receptor signaling pathway(GO:0070564) |
| 0.1 | 0.9 | GO:0009629 | response to gravity(GO:0009629) |
| 0.1 | 0.4 | GO:0033615 | mitochondrial proton-transporting ATP synthase complex assembly(GO:0033615) |
| 0.1 | 0.1 | GO:0071816 | tail-anchored membrane protein insertion into ER membrane(GO:0071816) |
| 0.1 | 0.2 | GO:0006438 | valyl-tRNA aminoacylation(GO:0006438) |
| 0.1 | 0.4 | GO:0060800 | regulation of cell differentiation involved in embryonic placenta development(GO:0060800) |
| 0.1 | 0.2 | GO:0042450 | arginine biosynthetic process via ornithine(GO:0042450) |
| 0.1 | 0.2 | GO:0043504 | mitochondrial DNA repair(GO:0043504) |
| 0.1 | 0.2 | GO:0035992 | tendon cell differentiation(GO:0035990) tendon formation(GO:0035992) |
| 0.1 | 1.0 | GO:0050860 | negative regulation of T cell receptor signaling pathway(GO:0050860) |
| 0.1 | 1.1 | GO:0099500 | synaptic vesicle fusion to presynaptic active zone membrane(GO:0031629) vesicle fusion to plasma membrane(GO:0099500) |
| 0.1 | 1.1 | GO:0010666 | positive regulation of striated muscle cell apoptotic process(GO:0010663) positive regulation of cardiac muscle cell apoptotic process(GO:0010666) |
| 0.1 | 0.4 | GO:1904674 | positive regulation of somatic stem cell population maintenance(GO:1904674) |
| 0.1 | 0.5 | GO:0048842 | positive regulation of axon extension involved in axon guidance(GO:0048842) |
| 0.1 | 0.9 | GO:0045945 | positive regulation of transcription from RNA polymerase III promoter(GO:0045945) |
| 0.1 | 0.8 | GO:0097490 | sympathetic neuron projection extension(GO:0097490) sympathetic neuron projection guidance(GO:0097491) |
| 0.1 | 0.3 | GO:0046391 | 5-phosphoribose 1-diphosphate biosynthetic process(GO:0006015) 5-phosphoribose 1-diphosphate metabolic process(GO:0046391) |
| 0.1 | 0.4 | GO:0033629 | negative regulation of cell adhesion mediated by integrin(GO:0033629) |
| 0.1 | 0.7 | GO:0048386 | positive regulation of retinoic acid receptor signaling pathway(GO:0048386) |
| 0.1 | 0.2 | GO:0046041 | ITP metabolic process(GO:0046041) |
| 0.1 | 0.1 | GO:0072709 | cellular response to sorbitol(GO:0072709) |
| 0.1 | 0.2 | GO:0036230 | granulocyte activation(GO:0036230) |
| 0.1 | 0.8 | GO:0050930 | induction of positive chemotaxis(GO:0050930) |
| 0.1 | 0.5 | GO:0045950 | negative regulation of mitotic recombination(GO:0045950) |
| 0.1 | 0.2 | GO:0009051 | pentose-phosphate shunt, oxidative branch(GO:0009051) aldonic acid metabolic process(GO:0019520) D-gluconate metabolic process(GO:0019521) |
| 0.1 | 0.8 | GO:0016191 | synaptic vesicle uncoating(GO:0016191) vesicle uncoating(GO:0072319) |
| 0.1 | 0.2 | GO:0015788 | UDP-N-acetylglucosamine transport(GO:0015788) UDP-N-acetylglucosamine transmembrane transport(GO:1990569) |
| 0.1 | 0.2 | GO:1901407 | regulation of phosphorylation of RNA polymerase II C-terminal domain(GO:1901407) |
| 0.1 | 0.3 | GO:2000813 | negative regulation of barbed-end actin filament capping(GO:2000813) |
| 0.1 | 0.4 | GO:0015798 | myo-inositol transport(GO:0015798) |
| 0.1 | 0.2 | GO:0051710 | regulation of cytolysis in other organism(GO:0051710) |
| 0.1 | 2.2 | GO:0002755 | MyD88-dependent toll-like receptor signaling pathway(GO:0002755) |
| 0.1 | 1.2 | GO:1903830 | magnesium ion transmembrane transport(GO:1903830) |
| 0.1 | 0.9 | GO:0045793 | positive regulation of cell size(GO:0045793) |
| 0.1 | 0.7 | GO:0001955 | blood vessel maturation(GO:0001955) |
| 0.1 | 0.2 | GO:0031627 | telomeric loop formation(GO:0031627) |
| 0.1 | 0.3 | GO:0060754 | positive regulation of mast cell chemotaxis(GO:0060754) |
| 0.1 | 0.2 | GO:1904849 | positive regulation of cell chemotaxis to fibroblast growth factor(GO:1904849) positive regulation of endothelial cell chemotaxis to fibroblast growth factor(GO:2000546) |
| 0.1 | 39.2 | GO:0043312 | neutrophil activation involved in immune response(GO:0002283) neutrophil degranulation(GO:0043312) |
| 0.1 | 0.1 | GO:1902953 | positive regulation of ER to Golgi vesicle-mediated transport(GO:1902953) |
| 0.1 | 0.3 | GO:0006824 | cobalt ion transport(GO:0006824) |
| 0.1 | 0.4 | GO:0060017 | parathyroid gland development(GO:0060017) |
| 0.1 | 0.4 | GO:0042346 | positive regulation of NF-kappaB import into nucleus(GO:0042346) |
| 0.1 | 0.2 | GO:0070561 | vitamin D receptor signaling pathway(GO:0070561) |
| 0.1 | 0.3 | GO:0043988 | histone H3-S28 phosphorylation(GO:0043988) |
| 0.1 | 0.4 | GO:0006049 | UDP-N-acetylglucosamine catabolic process(GO:0006049) |
| 0.1 | 0.6 | GO:2000271 | positive regulation of fibroblast apoptotic process(GO:2000271) |
| 0.1 | 8.0 | GO:0006614 | SRP-dependent cotranslational protein targeting to membrane(GO:0006614) |
| 0.1 | 0.2 | GO:1905049 | negative regulation of metallopeptidase activity(GO:1905049) |
| 0.1 | 0.4 | GO:0071316 | cellular response to nicotine(GO:0071316) |
| 0.1 | 0.6 | GO:0030213 | hyaluronan biosynthetic process(GO:0030213) |
| 0.1 | 0.2 | GO:1903452 | regulation of G1 to G0 transition(GO:1903450) positive regulation of G1 to G0 transition(GO:1903452) |
| 0.1 | 0.8 | GO:0071361 | cellular response to ethanol(GO:0071361) |
| 0.1 | 1.2 | GO:0006895 | Golgi to endosome transport(GO:0006895) |
| 0.1 | 0.3 | GO:0031666 | positive regulation of lipopolysaccharide-mediated signaling pathway(GO:0031666) |
| 0.1 | 0.4 | GO:0071376 | response to corticotropin-releasing hormone(GO:0043435) cellular response to corticotropin-releasing hormone stimulus(GO:0071376) |
| 0.1 | 1.4 | GO:0006123 | mitochondrial electron transport, cytochrome c to oxygen(GO:0006123) |
| 0.1 | 0.4 | GO:0030210 | heparin metabolic process(GO:0030202) heparin biosynthetic process(GO:0030210) |
| 0.1 | 0.2 | GO:0080120 | CAAX-box protein processing(GO:0071586) CAAX-box protein maturation(GO:0080120) |
| 0.1 | 0.7 | GO:1903690 | negative regulation of wound healing, spreading of epidermal cells(GO:1903690) |
| 0.1 | 0.4 | GO:2001199 | negative regulation of dendritic cell differentiation(GO:2001199) |
| 0.1 | 0.7 | GO:0032020 | ISG15-protein conjugation(GO:0032020) |
| 0.0 | 1.2 | GO:0097296 | activation of cysteine-type endopeptidase activity involved in apoptotic signaling pathway(GO:0097296) |
| 0.0 | 1.2 | GO:0010642 | negative regulation of platelet-derived growth factor receptor signaling pathway(GO:0010642) |
| 0.0 | 1.5 | GO:2000772 | regulation of cellular senescence(GO:2000772) |
| 0.0 | 0.7 | GO:0001887 | selenium compound metabolic process(GO:0001887) |
| 0.0 | 0.2 | GO:1904428 | negative regulation of tubulin deacetylation(GO:1904428) |
| 0.0 | 2.8 | GO:0050650 | chondroitin sulfate proteoglycan biosynthetic process(GO:0050650) |
| 0.0 | 0.6 | GO:0002862 | negative regulation of inflammatory response to antigenic stimulus(GO:0002862) |
| 0.0 | 0.1 | GO:0099590 | neurotransmitter receptor internalization(GO:0099590) |
| 0.0 | 0.3 | GO:0048680 | positive regulation of axon regeneration(GO:0048680) |
| 0.0 | 0.1 | GO:0038193 | thromboxane A2 signaling pathway(GO:0038193) |
| 0.0 | 0.4 | GO:0061737 | leukotriene signaling pathway(GO:0061737) |
| 0.0 | 0.3 | GO:2001151 | regulation of renal water transport(GO:2001151) positive regulation of renal water transport(GO:2001153) |
| 0.0 | 0.8 | GO:2000249 | regulation of actin cytoskeleton reorganization(GO:2000249) |
| 0.0 | 0.2 | GO:0035234 | ectopic germ cell programmed cell death(GO:0035234) |
| 0.0 | 0.4 | GO:1900119 | positive regulation of execution phase of apoptosis(GO:1900119) |
| 0.0 | 0.3 | GO:0015015 | heparan sulfate proteoglycan biosynthetic process, enzymatic modification(GO:0015015) |
| 0.0 | 0.4 | GO:0038165 | oncostatin-M-mediated signaling pathway(GO:0038165) |
| 0.0 | 0.6 | GO:0051601 | exocyst localization(GO:0051601) |
| 0.0 | 0.7 | GO:0045063 | T-helper 1 cell differentiation(GO:0045063) |
| 0.0 | 0.4 | GO:0036010 | protein localization to endosome(GO:0036010) |
| 0.0 | 0.3 | GO:0050882 | voluntary musculoskeletal movement(GO:0050882) |
| 0.0 | 0.2 | GO:0070229 | negative regulation of lymphocyte apoptotic process(GO:0070229) |
| 0.0 | 0.3 | GO:0099566 | regulation of postsynaptic cytosolic calcium ion concentration(GO:0099566) |
| 0.0 | 0.4 | GO:0032472 | Golgi calcium ion transport(GO:0032472) |
| 0.0 | 1.9 | GO:0032012 | regulation of ARF protein signal transduction(GO:0032012) |
| 0.0 | 0.5 | GO:0060075 | regulation of resting membrane potential(GO:0060075) |
| 0.0 | 0.4 | GO:0035609 | C-terminal protein deglutamylation(GO:0035609) |
| 0.0 | 1.5 | GO:0031290 | retinal ganglion cell axon guidance(GO:0031290) |
| 0.0 | 0.4 | GO:0045351 | type I interferon biosynthetic process(GO:0045351) |
| 0.0 | 3.0 | GO:0001954 | positive regulation of cell-matrix adhesion(GO:0001954) |
| 0.0 | 1.4 | GO:0051893 | regulation of focal adhesion assembly(GO:0051893) regulation of cell-substrate junction assembly(GO:0090109) |
| 0.0 | 0.2 | GO:0006540 | glutamate decarboxylation to succinate(GO:0006540) |
| 0.0 | 1.7 | GO:0035456 | response to interferon-beta(GO:0035456) |
| 0.0 | 0.5 | GO:0035970 | peptidyl-threonine dephosphorylation(GO:0035970) |
| 0.0 | 1.1 | GO:0032060 | bleb assembly(GO:0032060) |
| 0.0 | 0.2 | GO:0022027 | interkinetic nuclear migration(GO:0022027) |
| 0.0 | 0.4 | GO:0002051 | osteoblast fate commitment(GO:0002051) |
| 0.0 | 0.4 | GO:0016081 | synaptic vesicle docking(GO:0016081) |
| 0.0 | 0.2 | GO:0019605 | butyrate metabolic process(GO:0019605) |
| 0.0 | 2.4 | GO:0006968 | cellular defense response(GO:0006968) |
| 0.0 | 1.1 | GO:0006044 | N-acetylglucosamine metabolic process(GO:0006044) |
| 0.0 | 0.1 | GO:1990579 | protein trans-autophosphorylation(GO:0036290) peptidyl-serine trans-autophosphorylation(GO:1990579) |
| 0.0 | 0.2 | GO:2000825 | positive regulation of androgen receptor activity(GO:2000825) |
| 0.0 | 0.3 | GO:1903054 | negative regulation of extracellular matrix organization(GO:1903054) |
| 0.0 | 0.2 | GO:0034499 | late endosome to Golgi transport(GO:0034499) |
| 0.0 | 0.8 | GO:0007175 | negative regulation of epidermal growth factor-activated receptor activity(GO:0007175) |
| 0.0 | 0.1 | GO:2001033 | negative regulation of double-strand break repair via nonhomologous end joining(GO:2001033) |
| 0.0 | 0.1 | GO:0045054 | constitutive secretory pathway(GO:0045054) |
| 0.0 | 0.1 | GO:0017198 | N-terminal peptidyl-serine acetylation(GO:0017198) N-terminal peptidyl-glutamic acid acetylation(GO:0018002) peptidyl-serine acetylation(GO:0030920) |
| 0.0 | 0.1 | GO:0051939 | gamma-aminobutyric acid import(GO:0051939) |
| 0.0 | 0.2 | GO:1990180 | mitochondrial tRNA 3'-end processing(GO:1990180) |
| 0.0 | 0.4 | GO:0090043 | regulation of tubulin deacetylation(GO:0090043) |
| 0.0 | 2.2 | GO:1903861 | positive regulation of dendrite extension(GO:1903861) |
| 0.0 | 0.2 | GO:1903575 | cornified envelope assembly(GO:1903575) |
| 0.0 | 1.1 | GO:0051764 | actin crosslink formation(GO:0051764) |
| 0.0 | 0.3 | GO:0048245 | eosinophil chemotaxis(GO:0048245) |
| 0.0 | 0.6 | GO:0051969 | regulation of transmission of nerve impulse(GO:0051969) |
| 0.0 | 0.2 | GO:0046208 | spermine catabolic process(GO:0046208) |
| 0.0 | 0.3 | GO:0010288 | response to lead ion(GO:0010288) |
| 0.0 | 0.5 | GO:0060158 | phospholipase C-activating dopamine receptor signaling pathway(GO:0060158) |
| 0.0 | 0.3 | GO:0046449 | creatinine metabolic process(GO:0046449) |
| 0.0 | 0.3 | GO:0000066 | mitochondrial ornithine transport(GO:0000066) |
| 0.0 | 0.5 | GO:0071481 | cellular response to X-ray(GO:0071481) |
| 0.0 | 0.0 | GO:0018242 | protein O-linked glycosylation via serine(GO:0018242) |
| 0.0 | 0.3 | GO:0000160 | phosphorelay signal transduction system(GO:0000160) |
| 0.0 | 0.6 | GO:0071397 | cellular response to cholesterol(GO:0071397) |
| 0.0 | 0.5 | GO:0036151 | phosphatidylcholine acyl-chain remodeling(GO:0036151) |
| 0.0 | 0.4 | GO:2001224 | positive regulation of neuron migration(GO:2001224) |
| 0.0 | 1.6 | GO:2000785 | regulation of autophagosome assembly(GO:2000785) |
| 0.0 | 0.1 | GO:0019046 | release from viral latency(GO:0019046) |
| 0.0 | 0.3 | GO:0006686 | sphingomyelin biosynthetic process(GO:0006686) |
| 0.0 | 0.4 | GO:0009414 | response to water deprivation(GO:0009414) |
| 0.0 | 0.7 | GO:0010991 | regulation of SMAD protein complex assembly(GO:0010990) negative regulation of SMAD protein complex assembly(GO:0010991) |
| 0.0 | 0.1 | GO:1900533 | medium-chain fatty-acyl-CoA catabolic process(GO:0036114) long-chain fatty-acyl-CoA catabolic process(GO:0036116) palmitic acid metabolic process(GO:1900533) palmitic acid biosynthetic process(GO:1900535) |
| 0.0 | 0.3 | GO:0030263 | apoptotic chromosome condensation(GO:0030263) |
| 0.0 | 1.0 | GO:0050690 | regulation of defense response to virus by virus(GO:0050690) |
| 0.0 | 2.0 | GO:0008333 | endosome to lysosome transport(GO:0008333) |
| 0.0 | 0.4 | GO:1900113 | negative regulation of histone H3-K9 trimethylation(GO:1900113) |
| 0.0 | 0.1 | GO:1900158 | regulation of bone mineralization involved in bone maturation(GO:1900157) negative regulation of bone mineralization involved in bone maturation(GO:1900158) |
| 0.0 | 0.6 | GO:0051014 | actin filament severing(GO:0051014) |
| 0.0 | 0.1 | GO:0006742 | NADP catabolic process(GO:0006742) pyridine nucleotide catabolic process(GO:0019364) |
| 0.0 | 0.1 | GO:1904017 | cellular response to Thyroglobulin triiodothyronine(GO:1904017) |
| 0.0 | 2.4 | GO:0031532 | actin cytoskeleton reorganization(GO:0031532) |
| 0.0 | 2.6 | GO:0042771 | intrinsic apoptotic signaling pathway in response to DNA damage by p53 class mediator(GO:0042771) |
| 0.0 | 2.0 | GO:0038083 | peptidyl-tyrosine autophosphorylation(GO:0038083) |
| 0.0 | 0.1 | GO:0042732 | D-xylose metabolic process(GO:0042732) |
| 0.0 | 2.3 | GO:0016266 | O-glycan processing(GO:0016266) |
| 0.0 | 0.1 | GO:0072272 | proximal/distal pattern formation involved in metanephric nephron development(GO:0072272) |
| 0.0 | 0.4 | GO:0098828 | positive regulation of inhibitory postsynaptic potential(GO:0097151) modulation of inhibitory postsynaptic potential(GO:0098828) |
| 0.0 | 0.2 | GO:2000048 | negative regulation of cell-cell adhesion mediated by cadherin(GO:2000048) |
| 0.0 | 0.3 | GO:0030207 | chondroitin sulfate catabolic process(GO:0030207) |
| 0.0 | 0.1 | GO:0035521 | monoubiquitinated histone deubiquitination(GO:0035521) monoubiquitinated histone H2A deubiquitination(GO:0035522) |
| 0.0 | 0.4 | GO:0045066 | regulatory T cell differentiation(GO:0045066) regulation of regulatory T cell differentiation(GO:0045589) |
| 0.0 | 0.3 | GO:0060770 | negative regulation of epithelial cell proliferation involved in prostate gland development(GO:0060770) |
| 0.0 | 0.5 | GO:0098535 | de novo centriole assembly(GO:0098535) |
| 0.0 | 0.5 | GO:0043983 | histone H4-K12 acetylation(GO:0043983) |
| 0.0 | 0.5 | GO:0071447 | cellular response to hydroperoxide(GO:0071447) |
| 0.0 | 0.9 | GO:0031115 | negative regulation of microtubule polymerization(GO:0031115) |
| 0.0 | 0.4 | GO:1904251 | regulation of bile acid metabolic process(GO:1904251) |
| 0.0 | 1.1 | GO:0016578 | histone deubiquitination(GO:0016578) |
| 0.0 | 0.1 | GO:1901533 | negative regulation of hematopoietic progenitor cell differentiation(GO:1901533) |
| 0.0 | 0.2 | GO:0071763 | nuclear membrane organization(GO:0071763) |
| 0.0 | 0.2 | GO:2000660 | negative regulation of interleukin-1-mediated signaling pathway(GO:2000660) |
| 0.0 | 0.2 | GO:0090625 | mRNA cleavage involved in gene silencing by siRNA(GO:0090625) |
| 0.0 | 0.5 | GO:0070262 | peptidyl-serine dephosphorylation(GO:0070262) |
| 0.0 | 0.6 | GO:2000300 | regulation of synaptic vesicle exocytosis(GO:2000300) |
| 0.0 | 0.7 | GO:0043576 | regulation of respiratory gaseous exchange(GO:0043576) |
| 0.0 | 0.2 | GO:1900121 | negative regulation of receptor binding(GO:1900121) |
| 0.0 | 0.2 | GO:0006930 | substrate-dependent cell migration, cell extension(GO:0006930) |
| 0.0 | 0.4 | GO:0060700 | regulation of ribonuclease activity(GO:0060700) |
| 0.0 | 0.7 | GO:0097186 | amelogenesis(GO:0097186) |
| 0.0 | 0.1 | GO:0090149 | mitochondrial membrane fission(GO:0090149) |
| 0.0 | 0.4 | GO:0035331 | negative regulation of hippo signaling(GO:0035331) |
| 0.0 | 0.3 | GO:0060125 | negative regulation of growth hormone secretion(GO:0060125) |
| 0.0 | 0.4 | GO:0043101 | purine-containing compound salvage(GO:0043101) |
| 0.0 | 0.3 | GO:0072656 | maintenance of protein location in mitochondrion(GO:0072656) |
| 0.0 | 0.7 | GO:0006491 | N-glycan processing(GO:0006491) |
| 0.0 | 0.0 | GO:0014744 | positive regulation of cardiac muscle adaptation(GO:0010615) positive regulation of muscle adaptation(GO:0014744) positive regulation of cardiac muscle hypertrophy in response to stress(GO:1903244) |
| 0.0 | 0.1 | GO:0001315 | age-dependent response to oxidative stress(GO:0001306) age-dependent response to reactive oxygen species(GO:0001315) regulation of systemic arterial blood pressure by acetylcholine(GO:0003068) vasodilation by acetylcholine involved in regulation of systemic arterial blood pressure(GO:0003069) regulation of systemic arterial blood pressure by neurotransmitter(GO:0003070) age-dependent general metabolic decline(GO:0007571) |
| 0.0 | 0.3 | GO:0061635 | regulation of protein complex stability(GO:0061635) |
| 0.0 | 0.2 | GO:0019348 | dolichol metabolic process(GO:0019348) |
| 0.0 | 3.1 | GO:0032479 | regulation of type I interferon production(GO:0032479) |
| 0.0 | 0.3 | GO:1904796 | regulation of core promoter binding(GO:1904796) positive regulation of core promoter binding(GO:1904798) |
| 0.0 | 0.7 | GO:0060292 | long term synaptic depression(GO:0060292) |
| 0.0 | 0.3 | GO:0002084 | protein depalmitoylation(GO:0002084) |
| 0.0 | 0.1 | GO:0006478 | peptidyl-tyrosine sulfation(GO:0006478) |
| 0.0 | 0.2 | GO:0080009 | mRNA methylation(GO:0080009) |
| 0.0 | 0.3 | GO:0050765 | negative regulation of phagocytosis(GO:0050765) |
| 0.0 | 0.1 | GO:0032439 | endosome localization(GO:0032439) |
| 0.0 | 0.1 | GO:1903599 | positive regulation of mitophagy(GO:1903599) |
| 0.0 | 0.2 | GO:0030432 | peristalsis(GO:0030432) |
| 0.0 | 0.4 | GO:0051085 | chaperone mediated protein folding requiring cofactor(GO:0051085) |
| 0.0 | 0.5 | GO:0060334 | regulation of response to interferon-gamma(GO:0060330) regulation of interferon-gamma-mediated signaling pathway(GO:0060334) |
| 0.0 | 0.6 | GO:0035587 | purinergic receptor signaling pathway(GO:0035587) |
| 0.0 | 0.1 | GO:0035733 | hepatic stellate cell activation(GO:0035733) fibroblast activation(GO:0072537) |
| 0.0 | 0.9 | GO:0048147 | negative regulation of fibroblast proliferation(GO:0048147) |
| 0.0 | 0.5 | GO:2001256 | regulation of store-operated calcium entry(GO:2001256) |
| 0.0 | 0.1 | GO:0036404 | positive regulation of Schwann cell differentiation(GO:0014040) conversion of ds siRNA to ss siRNA involved in RNA interference(GO:0033168) conversion of ds siRNA to ss siRNA(GO:0036404) |
| 0.0 | 1.5 | GO:0007214 | gamma-aminobutyric acid signaling pathway(GO:0007214) |
| 0.0 | 0.7 | GO:0045824 | negative regulation of innate immune response(GO:0045824) |
| 0.0 | 0.8 | GO:0072378 | blood coagulation, fibrin clot formation(GO:0072378) |
| 0.0 | 0.2 | GO:0038203 | TORC2 signaling(GO:0038203) |
| 0.0 | 0.2 | GO:0035494 | SNARE complex disassembly(GO:0035494) |
| 0.0 | 0.1 | GO:0042668 | auditory receptor cell fate determination(GO:0042668) |
| 0.0 | 0.4 | GO:0036150 | phosphatidylserine acyl-chain remodeling(GO:0036150) |
| 0.0 | 0.3 | GO:0007621 | negative regulation of female receptivity(GO:0007621) |
| 0.0 | 0.1 | GO:0006537 | glutamate biosynthetic process(GO:0006537) |
| 0.0 | 0.3 | GO:0006348 | chromatin silencing at telomere(GO:0006348) |
| 0.0 | 1.0 | GO:0046856 | phosphatidylinositol dephosphorylation(GO:0046856) |
| 0.0 | 0.1 | GO:0010793 | regulation of mRNA export from nucleus(GO:0010793) |
| 0.0 | 0.1 | GO:0018160 | peptidyl-pyrromethane cofactor linkage(GO:0018160) |
| 0.0 | 0.2 | GO:0070072 | proton-transporting V-type ATPase complex assembly(GO:0070070) vacuolar proton-transporting V-type ATPase complex assembly(GO:0070072) |
| 0.0 | 0.1 | GO:0043589 | skin morphogenesis(GO:0043589) |
| 0.0 | 0.1 | GO:0060729 | intestinal epithelial structure maintenance(GO:0060729) |
| 0.0 | 0.1 | GO:0034454 | microtubule anchoring at centrosome(GO:0034454) |
| 0.0 | 0.1 | GO:0060312 | regulation of blood vessel remodeling(GO:0060312) |
| 0.0 | 0.3 | GO:0090161 | Golgi ribbon formation(GO:0090161) |
| 0.0 | 0.3 | GO:0071985 | multivesicular body sorting pathway(GO:0071985) |
| 0.0 | 0.7 | GO:0007191 | adenylate cyclase-activating dopamine receptor signaling pathway(GO:0007191) |
| 0.0 | 0.1 | GO:2000661 | positive regulation of interleukin-1-mediated signaling pathway(GO:2000661) |
| 0.0 | 0.0 | GO:1900223 | positive regulation of beta-amyloid clearance(GO:1900223) |
| 0.0 | 0.1 | GO:0097398 | response to interleukin-17(GO:0097396) cellular response to interleukin-17(GO:0097398) |
| 0.0 | 0.1 | GO:0061188 | regulation of chromatin silencing at rDNA(GO:0061187) negative regulation of chromatin silencing at rDNA(GO:0061188) |
| 0.0 | 0.2 | GO:0030644 | cellular chloride ion homeostasis(GO:0030644) |
| 0.0 | 0.3 | GO:0002820 | negative regulation of adaptive immune response(GO:0002820) |
| 0.0 | 0.2 | GO:0002483 | antigen processing and presentation of endogenous peptide antigen(GO:0002483) antigen processing and presentation of endogenous peptide antigen via MHC class I(GO:0019885) |
| 0.0 | 0.1 | GO:0000415 | negative regulation of histone H3-K36 methylation(GO:0000415) |
| 0.0 | 0.1 | GO:0060180 | female mating behavior(GO:0060180) |
| 0.0 | 0.2 | GO:0006657 | CDP-choline pathway(GO:0006657) |
| 0.0 | 0.2 | GO:0060346 | bone trabecula formation(GO:0060346) |
| 0.0 | 0.3 | GO:0090232 | positive regulation of spindle checkpoint(GO:0090232) |
| 0.0 | 0.1 | GO:1990166 | protein localization to site of double-strand break(GO:1990166) |
| 0.0 | 0.5 | GO:0070423 | nucleotide-binding oligomerization domain containing signaling pathway(GO:0070423) |
| 0.0 | 0.3 | GO:2000480 | negative regulation of cAMP-dependent protein kinase activity(GO:2000480) |
| 0.0 | 0.4 | GO:0035640 | exploration behavior(GO:0035640) |
| 0.0 | 0.3 | GO:0006122 | mitochondrial electron transport, ubiquinol to cytochrome c(GO:0006122) |
| 0.0 | 0.1 | GO:0033353 | S-adenosylmethionine cycle(GO:0033353) |
| 0.0 | 0.8 | GO:0007205 | protein kinase C-activating G-protein coupled receptor signaling pathway(GO:0007205) |
| 0.0 | 0.1 | GO:0036148 | phosphatidylglycerol acyl-chain remodeling(GO:0036148) |
| 0.0 | 0.9 | GO:0070911 | global genome nucleotide-excision repair(GO:0070911) |
| 0.0 | 0.1 | GO:0070269 | pyroptosis(GO:0070269) |
| 0.0 | 0.0 | GO:0009213 | pyrimidine nucleoside triphosphate catabolic process(GO:0009149) pyrimidine deoxyribonucleoside triphosphate catabolic process(GO:0009213) |
| 0.0 | 0.2 | GO:0030174 | regulation of DNA-dependent DNA replication initiation(GO:0030174) |
| 0.0 | 0.3 | GO:0007258 | JUN phosphorylation(GO:0007258) |
| 0.0 | 0.3 | GO:0090084 | negative regulation of inclusion body assembly(GO:0090084) |
| 0.0 | 0.1 | GO:0090116 | C-5 methylation of cytosine(GO:0090116) |
| 0.0 | 0.1 | GO:0002115 | store-operated calcium entry(GO:0002115) |
| 0.0 | 0.1 | GO:0045007 | depurination(GO:0045007) |
| 0.0 | 0.1 | GO:1901203 | positive regulation of extracellular matrix assembly(GO:1901203) regulation of basement membrane assembly involved in embryonic body morphogenesis(GO:1904259) positive regulation of basement membrane assembly involved in embryonic body morphogenesis(GO:1904261) basement membrane assembly involved in embryonic body morphogenesis(GO:2001197) |
| 0.0 | 0.1 | GO:1903786 | mycotoxin catabolic process(GO:0043387) aflatoxin catabolic process(GO:0046223) organic heteropentacyclic compound catabolic process(GO:1901377) regulation of glutathione biosynthetic process(GO:1903786) positive regulation of glutathione biosynthetic process(GO:1903788) |
| 0.0 | 0.2 | GO:0006265 | DNA topological change(GO:0006265) |
| 0.0 | 0.2 | GO:0015871 | choline transport(GO:0015871) |
| 0.0 | 0.5 | GO:0000301 | retrograde transport, vesicle recycling within Golgi(GO:0000301) |
| 0.0 | 0.1 | GO:0043697 | dedifferentiation(GO:0043696) cell dedifferentiation(GO:0043697) |
| 0.0 | 0.1 | GO:0014738 | regulation of muscle hyperplasia(GO:0014738) negative regulation of muscle hyperplasia(GO:0014740) |
| 0.0 | 0.1 | GO:0018343 | protein farnesylation(GO:0018343) |
| 0.0 | 0.1 | GO:0044571 | [2Fe-2S] cluster assembly(GO:0044571) |
| 0.0 | 0.1 | GO:0010739 | positive regulation of protein kinase A signaling(GO:0010739) |
| 0.0 | 0.4 | GO:0048873 | homeostasis of number of cells within a tissue(GO:0048873) |
| 0.0 | 0.1 | GO:1903012 | positive regulation of bone development(GO:1903012) |
| 0.0 | 0.7 | GO:0070932 | histone H3 deacetylation(GO:0070932) |
| 0.0 | 0.6 | GO:0061157 | mRNA destabilization(GO:0061157) |
| 0.0 | 0.3 | GO:0070987 | error-free translesion synthesis(GO:0070987) |
| 0.0 | 0.0 | GO:0036090 | cleavage furrow ingression(GO:0036090) |
| 0.0 | 0.3 | GO:0050873 | brown fat cell differentiation(GO:0050873) |
| 0.0 | 0.1 | GO:0003025 | regulation of systemic arterial blood pressure by baroreceptor feedback(GO:0003025) |
| 0.0 | 0.1 | GO:0061469 | regulation of type B pancreatic cell proliferation(GO:0061469) |
| 0.0 | 0.1 | GO:0003433 | chondrocyte development involved in endochondral bone morphogenesis(GO:0003433) |
| 0.0 | 0.1 | GO:0090025 | regulation of monocyte chemotaxis(GO:0090025) |
| 0.0 | 0.1 | GO:1902287 | trigeminal nerve morphogenesis(GO:0021636) trigeminal nerve structural organization(GO:0021637) semaphorin-plexin signaling pathway involved in neuron projection guidance(GO:1902285) semaphorin-plexin signaling pathway involved in axon guidance(GO:1902287) |
| 0.0 | 0.2 | GO:0071205 | protein localization to juxtaparanode region of axon(GO:0071205) |
| 0.0 | 0.0 | GO:0072139 | glomerular parietal epithelial cell differentiation(GO:0072139) |
| 0.0 | 0.1 | GO:1904751 | positive regulation of protein localization to nucleolus(GO:1904751) |
| 0.0 | 0.1 | GO:0045657 | positive regulation of monocyte differentiation(GO:0045657) |
| 0.0 | 0.2 | GO:0045162 | clustering of voltage-gated sodium channels(GO:0045162) |
| 0.0 | 0.4 | GO:0043651 | linoleic acid metabolic process(GO:0043651) |
| 0.0 | 0.2 | GO:0016242 | negative regulation of macroautophagy(GO:0016242) |
| 0.0 | 0.1 | GO:0045161 | neuronal ion channel clustering(GO:0045161) |
| 0.0 | 0.1 | GO:0045955 | negative regulation of calcium ion-dependent exocytosis(GO:0045955) |
| 0.0 | 0.1 | GO:1990592 | protein polyufmylation(GO:1990564) protein K69-linked ufmylation(GO:1990592) |
| 0.0 | 0.0 | GO:0050760 | negative regulation of thymidylate synthase biosynthetic process(GO:0050760) |
| 0.0 | 0.0 | GO:0071569 | protein ufmylation(GO:0071569) |
| 0.0 | 0.1 | GO:0014050 | negative regulation of glutamate secretion(GO:0014050) |
| 0.0 | 0.1 | GO:0070127 | tRNA aminoacylation for mitochondrial protein translation(GO:0070127) |
| 0.0 | 0.2 | GO:0060044 | negative regulation of cardiac muscle cell proliferation(GO:0060044) |
| 0.0 | 0.2 | GO:0048172 | regulation of short-term neuronal synaptic plasticity(GO:0048172) |
| 0.0 | 0.1 | GO:0032483 | regulation of Rab protein signal transduction(GO:0032483) |
| 0.0 | 0.2 | GO:0032331 | negative regulation of chondrocyte differentiation(GO:0032331) |
| 0.0 | 0.8 | GO:0061512 | protein localization to cilium(GO:0061512) |
| 0.0 | 0.0 | GO:0021834 | embryonic olfactory bulb interneuron precursor migration(GO:0021831) chemorepulsion involved in embryonic olfactory bulb interneuron precursor migration(GO:0021834) apoptotic process involved in luteolysis(GO:0061364) |
| 0.0 | 0.0 | GO:0036324 | vascular endothelial growth factor receptor-2 signaling pathway(GO:0036324) |
| 0.0 | 0.1 | GO:0019043 | establishment of viral latency(GO:0019043) establishment of integrated proviral latency(GO:0075713) |
| 0.0 | 0.6 | GO:0034260 | negative regulation of GTPase activity(GO:0034260) |
| 0.0 | 0.2 | GO:0048312 | intracellular distribution of mitochondria(GO:0048312) |
| 0.0 | 0.1 | GO:0099558 | maintenance of synapse structure(GO:0099558) |
| 0.0 | 0.2 | GO:0031119 | tRNA pseudouridine synthesis(GO:0031119) |
| 0.0 | 0.5 | GO:0060325 | face morphogenesis(GO:0060325) |
| 0.0 | 0.1 | GO:1901529 | positive regulation of anion channel activity(GO:1901529) positive regulation of anion transmembrane transport(GO:1903961) |
| 0.0 | 0.2 | GO:0006451 | selenocysteine incorporation(GO:0001514) translational readthrough(GO:0006451) |
| 0.0 | 0.5 | GO:0000188 | inactivation of MAPK activity(GO:0000188) |
| 0.0 | 0.1 | GO:0016560 | protein import into peroxisome matrix, docking(GO:0016560) |
| 0.0 | 1.0 | GO:0033209 | tumor necrosis factor-mediated signaling pathway(GO:0033209) |
| 0.0 | 0.1 | GO:0015840 | urea transport(GO:0015840) |
| 0.0 | 0.7 | GO:0035690 | cellular response to drug(GO:0035690) |
| 0.0 | 0.1 | GO:1902035 | positive regulation of hematopoietic stem cell proliferation(GO:1902035) |
| 0.0 | 0.1 | GO:0045023 | G0 to G1 transition(GO:0045023) |
| 0.0 | 0.1 | GO:0034067 | protein localization to Golgi apparatus(GO:0034067) |
| 0.0 | 0.1 | GO:0055093 | response to hyperoxia(GO:0055093) |
| 0.0 | 1.0 | GO:0030218 | erythrocyte differentiation(GO:0030218) |
| 0.0 | 0.2 | GO:0021535 | cell migration in hindbrain(GO:0021535) |
| 0.0 | 0.3 | GO:0031670 | cellular response to nutrient(GO:0031670) |
| 0.0 | 0.1 | GO:0042276 | error-prone translesion synthesis(GO:0042276) |
| 0.0 | 0.1 | GO:0042748 | circadian sleep/wake cycle, non-REM sleep(GO:0042748) |
| 0.0 | 0.6 | GO:0042590 | antigen processing and presentation of exogenous peptide antigen via MHC class I(GO:0042590) |
| 0.0 | 0.2 | GO:0006004 | fucose metabolic process(GO:0006004) |
| 0.0 | 0.3 | GO:0070884 | regulation of calcineurin-NFAT signaling cascade(GO:0070884) |
| 0.0 | 0.1 | GO:0005513 | detection of calcium ion(GO:0005513) |
| 0.0 | 0.3 | GO:0010002 | cardioblast differentiation(GO:0010002) |
| 0.0 | 0.2 | GO:0006776 | vitamin A metabolic process(GO:0006776) |
| 0.0 | 0.2 | GO:0033572 | transferrin transport(GO:0033572) |
| 0.0 | 0.1 | GO:2001241 | positive regulation of extrinsic apoptotic signaling pathway in absence of ligand(GO:2001241) |
| 0.0 | 0.1 | GO:0006450 | regulation of translational fidelity(GO:0006450) |
| 0.0 | 0.1 | GO:0044351 | macropinocytosis(GO:0044351) |
| 0.0 | 0.1 | GO:0050901 | leukocyte tethering or rolling(GO:0050901) leukocyte adhesion to vascular endothelial cell(GO:0061756) |
| 0.0 | 0.1 | GO:0070863 | positive regulation of protein exit from endoplasmic reticulum(GO:0070863) |
| 0.0 | 0.1 | GO:1901315 | negative regulation of histone ubiquitination(GO:0033183) regulation of histone H2A K63-linked ubiquitination(GO:1901314) negative regulation of histone H2A K63-linked ubiquitination(GO:1901315) |
| 0.0 | 0.1 | GO:0010032 | meiotic chromosome condensation(GO:0010032) |
Gene overrepresentation in cellular component category:
| Log-likelihood per target | Total log-likelihood | Term | Description |
|---|---|---|---|
| 1.1 | 3.2 | GO:0071065 | alpha9-beta1 integrin-vascular cell adhesion molecule-1 complex(GO:0071065) |
| 0.9 | 8.7 | GO:0034687 | integrin alphaL-beta2 complex(GO:0034687) |
| 0.6 | 7.1 | GO:0098560 | cytoplasmic side of late endosome membrane(GO:0098560) |
| 0.6 | 2.4 | GO:0071757 | hexameric IgM immunoglobulin complex(GO:0071757) |
| 0.6 | 1.8 | GO:0036284 | tubulobulbar complex(GO:0036284) |
| 0.6 | 1.7 | GO:0030526 | granulocyte macrophage colony-stimulating factor receptor complex(GO:0030526) |
| 0.4 | 1.7 | GO:0070701 | mucus layer(GO:0070701) |
| 0.4 | 0.8 | GO:0061673 | mitotic spindle astral microtubule(GO:0061673) |
| 0.4 | 1.1 | GO:0097013 | phagocytic vesicle lumen(GO:0097013) |
| 0.3 | 0.3 | GO:0030981 | cortical microtubule cytoskeleton(GO:0030981) |
| 0.3 | 3.9 | GO:0042105 | alpha-beta T cell receptor complex(GO:0042105) |
| 0.3 | 1.0 | GO:0098844 | postsynaptic endocytic zone membrane(GO:0098844) |
| 0.3 | 0.3 | GO:0033010 | paranodal junction(GO:0033010) |
| 0.3 | 2.4 | GO:0070436 | Grb2-EGFR complex(GO:0070436) |
| 0.3 | 0.9 | GO:0030312 | external encapsulating structure(GO:0030312) |
| 0.3 | 1.4 | GO:0019815 | B cell receptor complex(GO:0019815) |
| 0.3 | 1.6 | GO:0034666 | integrin alpha2-beta1 complex(GO:0034666) |
| 0.3 | 5.4 | GO:0042613 | MHC class II protein complex(GO:0042613) |
| 0.3 | 2.3 | GO:0044194 | cytolytic granule(GO:0044194) |
| 0.2 | 1.5 | GO:0072558 | NLRP1 inflammasome complex(GO:0072558) |
| 0.2 | 2.2 | GO:0032010 | phagolysosome(GO:0032010) |
| 0.2 | 0.9 | GO:0031838 | haptoglobin-hemoglobin complex(GO:0031838) |
| 0.2 | 1.2 | GO:0031905 | early endosome lumen(GO:0031905) |
| 0.2 | 2.4 | GO:0035692 | macrophage migration inhibitory factor receptor complex(GO:0035692) |
| 0.2 | 1.1 | GO:0070381 | endosome to plasma membrane transport vesicle(GO:0070381) |
| 0.2 | 0.6 | GO:0071062 | alphav-beta3 integrin-vitronectin complex(GO:0071062) |
| 0.2 | 1.7 | GO:0005797 | Golgi medial cisterna(GO:0005797) |
| 0.2 | 0.9 | GO:1902912 | pyruvate kinase complex(GO:1902912) |
| 0.2 | 0.8 | GO:0098592 | cytoplasmic side of apical plasma membrane(GO:0098592) |
| 0.2 | 0.7 | GO:0043293 | apoptosome(GO:0043293) |
| 0.2 | 0.5 | GO:0036117 | hyaluranon cable(GO:0036117) |
| 0.2 | 0.5 | GO:0035370 | UBC13-UEV1A complex(GO:0035370) |
| 0.2 | 0.8 | GO:0020003 | symbiont-containing vacuole(GO:0020003) |
| 0.2 | 0.5 | GO:1990666 | PCSK9-LDLR complex(GO:1990666) |
| 0.2 | 0.7 | GO:0008043 | intracellular ferritin complex(GO:0008043) ferritin complex(GO:0070288) |
| 0.2 | 0.8 | GO:0065010 | extracellular membrane-bounded organelle(GO:0065010) |
| 0.2 | 0.6 | GO:0030895 | apolipoprotein B mRNA editing enzyme complex(GO:0030895) |
| 0.2 | 2.0 | GO:0097197 | tetraspanin-enriched microdomain(GO:0097197) |
| 0.1 | 1.7 | GO:0031313 | extrinsic component of endosome membrane(GO:0031313) |
| 0.1 | 0.7 | GO:0000126 | transcription factor TFIIIB complex(GO:0000126) |
| 0.1 | 6.0 | GO:0031258 | lamellipodium membrane(GO:0031258) |
| 0.1 | 1.6 | GO:0060199 | clathrin-sculpted glutamate transport vesicle(GO:0060199) clathrin-sculpted glutamate transport vesicle membrane(GO:0060203) |
| 0.1 | 0.7 | GO:1990425 | ryanodine receptor complex(GO:1990425) |
| 0.1 | 0.4 | GO:0070032 | synaptobrevin 2-SNAP-25-syntaxin-1a-complexin I complex(GO:0070032) |
| 0.1 | 0.5 | GO:1990667 | PCSK9-AnxA2 complex(GO:1990667) |
| 0.1 | 0.5 | GO:0008537 | proteasome activator complex(GO:0008537) |
| 0.1 | 2.7 | GO:0034993 | microtubule organizing center attachment site(GO:0034992) LINC complex(GO:0034993) |
| 0.1 | 1.6 | GO:0002193 | MAML1-RBP-Jkappa- ICN1 complex(GO:0002193) |
| 0.1 | 0.6 | GO:0032937 | SREBP-SCAP-Insig complex(GO:0032937) |
| 0.1 | 6.6 | GO:0019814 | immunoglobulin complex(GO:0019814) |
| 0.1 | 2.5 | GO:0042101 | T cell receptor complex(GO:0042101) |
| 0.1 | 0.5 | GO:1990356 | sumoylated E2 ligase complex(GO:1990356) |
| 0.1 | 0.6 | GO:0042643 | actomyosin, actin portion(GO:0042643) |
| 0.1 | 4.0 | GO:0001891 | phagocytic cup(GO:0001891) |
| 0.1 | 2.7 | GO:0001931 | uropod(GO:0001931) cell trailing edge(GO:0031254) |
| 0.1 | 0.3 | GO:0009346 | citrate lyase complex(GO:0009346) |
| 0.1 | 1.3 | GO:0061200 | clathrin-sculpted gamma-aminobutyric acid transport vesicle(GO:0061200) clathrin-sculpted gamma-aminobutyric acid transport vesicle membrane(GO:0061202) |
| 0.1 | 2.1 | GO:0031618 | nuclear pericentric heterochromatin(GO:0031618) |
| 0.1 | 3.5 | GO:0031095 | platelet dense tubular network membrane(GO:0031095) |
| 0.1 | 2.1 | GO:0005885 | Arp2/3 protein complex(GO:0005885) |
| 0.1 | 1.1 | GO:0042612 | MHC class I protein complex(GO:0042612) |
| 0.1 | 5.0 | GO:0044298 | neuronal cell body membrane(GO:0032809) cell body membrane(GO:0044298) |
| 0.1 | 6.7 | GO:0030673 | axolemma(GO:0030673) |
| 0.1 | 1.0 | GO:0072669 | tRNA-splicing ligase complex(GO:0072669) |
| 0.1 | 0.3 | GO:1990622 | CHOP-ATF3 complex(GO:1990622) |
| 0.1 | 7.8 | GO:0035577 | azurophil granule membrane(GO:0035577) |
| 0.1 | 0.3 | GO:0005760 | gamma DNA polymerase complex(GO:0005760) |
| 0.1 | 0.7 | GO:0071256 | Sec61 translocon complex(GO:0005784) translocon complex(GO:0071256) |
| 0.1 | 0.3 | GO:0000805 | X chromosome(GO:0000805) |
| 0.1 | 1.3 | GO:0005744 | mitochondrial inner membrane presequence translocase complex(GO:0005744) |
| 0.1 | 11.3 | GO:0101003 | ficolin-1-rich granule membrane(GO:0101003) |
| 0.1 | 0.3 | GO:1902636 | kinociliary basal body(GO:1902636) |
| 0.1 | 0.7 | GO:0043196 | varicosity(GO:0043196) |
| 0.1 | 0.5 | GO:0034274 | Atg12-Atg5-Atg16 complex(GO:0034274) |
| 0.1 | 7.9 | GO:0070821 | tertiary granule membrane(GO:0070821) |
| 0.1 | 0.5 | GO:1990604 | IRE1-TRAF2-ASK1 complex(GO:1990604) |
| 0.1 | 1.2 | GO:0033180 | proton-transporting V-type ATPase, V1 domain(GO:0033180) |
| 0.1 | 13.4 | GO:0035578 | azurophil granule lumen(GO:0035578) |
| 0.1 | 0.5 | GO:0035339 | SPOTS complex(GO:0035339) |
| 0.1 | 0.6 | GO:0098837 | postsynaptic recycling endosome(GO:0098837) |
| 0.1 | 1.6 | GO:0098839 | postsynaptic density membrane(GO:0098839) |
| 0.1 | 0.7 | GO:0035976 | AP1 complex(GO:0035976) |
| 0.1 | 0.3 | GO:0000138 | Golgi trans cisterna(GO:0000138) |
| 0.1 | 1.1 | GO:0042589 | zymogen granule membrane(GO:0042589) |
| 0.1 | 19.4 | GO:0031234 | extrinsic component of cytoplasmic side of plasma membrane(GO:0031234) |
| 0.1 | 0.4 | GO:0072534 | perineuronal net(GO:0072534) |
| 0.1 | 0.4 | GO:0045273 | mitochondrial respiratory chain complex II, succinate dehydrogenase complex (ubiquinone)(GO:0005749) succinate dehydrogenase complex (ubiquinone)(GO:0045257) respiratory chain complex II(GO:0045273) succinate dehydrogenase complex(GO:0045281) fumarate reductase complex(GO:0045283) |
| 0.1 | 0.8 | GO:0005833 | hemoglobin complex(GO:0005833) |
| 0.1 | 4.3 | GO:0001772 | immunological synapse(GO:0001772) |
| 0.1 | 0.5 | GO:1902560 | GMP reductase complex(GO:1902560) |
| 0.1 | 0.5 | GO:0046696 | lipopolysaccharide receptor complex(GO:0046696) |
| 0.1 | 4.2 | GO:0031201 | SNARE complex(GO:0031201) |
| 0.1 | 6.2 | GO:0030670 | phagocytic vesicle membrane(GO:0030670) |
| 0.1 | 0.3 | GO:0002189 | ribose phosphate diphosphokinase complex(GO:0002189) |
| 0.1 | 0.1 | GO:0020018 | ciliary pocket(GO:0020016) ciliary pocket membrane(GO:0020018) |
| 0.1 | 0.8 | GO:0000243 | commitment complex(GO:0000243) |
| 0.1 | 1.3 | GO:0005751 | mitochondrial respiratory chain complex IV(GO:0005751) |
| 0.1 | 0.6 | GO:0070022 | transforming growth factor beta receptor homodimeric complex(GO:0070022) |
| 0.1 | 1.5 | GO:0031229 | integral component of nuclear inner membrane(GO:0005639) intrinsic component of nuclear inner membrane(GO:0031229) |
| 0.1 | 1.8 | GO:0005868 | cytoplasmic dynein complex(GO:0005868) |
| 0.1 | 0.3 | GO:0071001 | U4/U6 snRNP(GO:0071001) |
| 0.1 | 0.5 | GO:0005971 | ribonucleoside-diphosphate reductase complex(GO:0005971) |
| 0.1 | 1.4 | GO:0098563 | integral component of synaptic vesicle membrane(GO:0030285) intrinsic component of synaptic vesicle membrane(GO:0098563) |
| 0.1 | 0.7 | GO:0072357 | PTW/PP1 phosphatase complex(GO:0072357) |
| 0.1 | 1.1 | GO:0008290 | F-actin capping protein complex(GO:0008290) |
| 0.1 | 1.4 | GO:0005952 | cAMP-dependent protein kinase complex(GO:0005952) |
| 0.1 | 2.3 | GO:0032839 | dendrite cytoplasm(GO:0032839) |
| 0.1 | 0.4 | GO:0000788 | nuclear nucleosome(GO:0000788) |
| 0.1 | 0.4 | GO:0017059 | serine C-palmitoyltransferase complex(GO:0017059) endoplasmic reticulum palmitoyltransferase complex(GO:0031211) |
| 0.1 | 1.0 | GO:0044232 | organelle membrane contact site(GO:0044232) |
| 0.1 | 0.4 | GO:0005766 | primary lysosome(GO:0005766) azurophil granule(GO:0042582) |
| 0.1 | 7.1 | GO:0022625 | cytosolic large ribosomal subunit(GO:0022625) |
| 0.1 | 0.5 | GO:0030121 | AP-1 adaptor complex(GO:0030121) |
| 0.1 | 2.3 | GO:0031092 | platelet alpha granule membrane(GO:0031092) |
| 0.1 | 0.2 | GO:0044753 | amphisome(GO:0044753) |
| 0.1 | 1.1 | GO:0005721 | pericentric heterochromatin(GO:0005721) |
| 0.1 | 0.2 | GO:0033185 | dolichol-phosphate-mannose synthase complex(GO:0033185) |
| 0.1 | 0.5 | GO:0097129 | cyclin D2-CDK4 complex(GO:0097129) |
| 0.1 | 0.3 | GO:0008275 | gamma-tubulin small complex(GO:0008275) |
| 0.1 | 0.3 | GO:0031094 | platelet dense tubular network(GO:0031094) |
| 0.1 | 1.6 | GO:0042629 | mast cell granule(GO:0042629) |
| 0.1 | 0.2 | GO:0012507 | ER to Golgi transport vesicle membrane(GO:0012507) |
| 0.1 | 3.9 | GO:0035579 | specific granule membrane(GO:0035579) |
| 0.1 | 0.5 | GO:0097470 | ribbon synapse(GO:0097470) |
| 0.1 | 0.4 | GO:0005945 | 6-phosphofructokinase complex(GO:0005945) |
| 0.1 | 1.5 | GO:0031528 | microvillus membrane(GO:0031528) |
| 0.1 | 0.3 | GO:0035363 | histone locus body(GO:0035363) |
| 0.1 | 1.3 | GO:0031362 | anchored component of external side of plasma membrane(GO:0031362) |
| 0.1 | 0.5 | GO:0071797 | LUBAC complex(GO:0071797) |
| 0.1 | 3.2 | GO:0002102 | podosome(GO:0002102) |
| 0.1 | 0.8 | GO:0005641 | nuclear envelope lumen(GO:0005641) |
| 0.1 | 0.5 | GO:0005610 | laminin-5 complex(GO:0005610) |
| 0.1 | 1.0 | GO:1990907 | beta-catenin-TCF complex(GO:1990907) |
| 0.1 | 0.4 | GO:0005862 | muscle thin filament tropomyosin(GO:0005862) |
| 0.1 | 0.3 | GO:0005854 | nascent polypeptide-associated complex(GO:0005854) |
| 0.1 | 1.2 | GO:0000164 | protein phosphatase type 1 complex(GO:0000164) |
| 0.1 | 0.5 | GO:0098536 | deuterosome(GO:0098536) |
| 0.0 | 0.8 | GO:0031588 | nucleotide-activated protein kinase complex(GO:0031588) |
| 0.0 | 0.9 | GO:0000124 | SAGA complex(GO:0000124) |
| 0.0 | 0.9 | GO:0045180 | basal cortex(GO:0045180) |
| 0.0 | 0.2 | GO:0042587 | glycogen granule(GO:0042587) |
| 0.0 | 0.6 | GO:0016461 | unconventional myosin complex(GO:0016461) |
| 0.0 | 0.1 | GO:0034676 | integrin alpha6-beta4 complex(GO:0034676) |
| 0.0 | 0.4 | GO:0097025 | MPP7-DLG1-LIN7 complex(GO:0097025) |
| 0.0 | 0.1 | GO:0097414 | glial cytoplasmic inclusion(GO:0097409) classical Lewy body(GO:0097414) Lewy neurite(GO:0097462) Lewy body corona(GO:1990038) |
| 0.0 | 0.3 | GO:0071986 | Ragulator complex(GO:0071986) |
| 0.0 | 0.8 | GO:0032059 | bleb(GO:0032059) |
| 0.0 | 0.2 | GO:0044218 | other organism cell membrane(GO:0044218) other organism membrane(GO:0044279) |
| 0.0 | 0.5 | GO:0070971 | endoplasmic reticulum exit site(GO:0070971) |
| 0.0 | 0.2 | GO:0034715 | pICln-Sm protein complex(GO:0034715) |
| 0.0 | 0.6 | GO:0035631 | CD40 receptor complex(GO:0035631) |
| 0.0 | 0.3 | GO:0072559 | NLRP3 inflammasome complex(GO:0072559) |
| 0.0 | 0.3 | GO:0005658 | alpha DNA polymerase:primase complex(GO:0005658) |
| 0.0 | 0.1 | GO:0000799 | nuclear condensin complex(GO:0000799) |
| 0.0 | 0.5 | GO:0016593 | Cdc73/Paf1 complex(GO:0016593) |
| 0.0 | 0.4 | GO:0097136 | Bcl-2 family protein complex(GO:0097136) |
| 0.0 | 0.2 | GO:0048787 | presynaptic active zone membrane(GO:0048787) |
| 0.0 | 0.3 | GO:0033553 | rDNA heterochromatin(GO:0033553) |
| 0.0 | 0.4 | GO:0005787 | signal peptidase complex(GO:0005787) |
| 0.0 | 0.1 | GO:1990696 | stereocilia ankle link(GO:0002141) USH2 complex(GO:1990696) |
| 0.0 | 0.2 | GO:0071817 | MMXD complex(GO:0071817) |
| 0.0 | 0.3 | GO:0016600 | flotillin complex(GO:0016600) |
| 0.0 | 0.1 | GO:0090651 | apical cytoplasm(GO:0090651) |
| 0.0 | 1.1 | GO:0031143 | pseudopodium(GO:0031143) |
| 0.0 | 0.4 | GO:0031371 | ubiquitin conjugating enzyme complex(GO:0031371) |
| 0.0 | 0.4 | GO:0098554 | cytoplasmic side of endoplasmic reticulum membrane(GO:0098554) |
| 0.0 | 0.8 | GO:0035102 | PRC1 complex(GO:0035102) |
| 0.0 | 2.8 | GO:0035580 | specific granule lumen(GO:0035580) |
| 0.0 | 1.0 | GO:0031264 | death-inducing signaling complex(GO:0031264) |
| 0.0 | 0.6 | GO:0034098 | VCP-NPL4-UFD1 AAA ATPase complex(GO:0034098) |
| 0.0 | 0.9 | GO:0032045 | guanyl-nucleotide exchange factor complex(GO:0032045) |
| 0.0 | 2.8 | GO:0031228 | intrinsic component of Golgi membrane(GO:0031228) |
| 0.0 | 0.4 | GO:0035748 | myelin sheath abaxonal region(GO:0035748) |
| 0.0 | 0.7 | GO:0071439 | clathrin complex(GO:0071439) |
| 0.0 | 0.4 | GO:0005879 | axonemal microtubule(GO:0005879) |
| 0.0 | 0.2 | GO:0036396 | MIS complex(GO:0036396) mRNA editing complex(GO:0045293) |
| 0.0 | 0.3 | GO:0030914 | STAGA complex(GO:0030914) |
| 0.0 | 0.1 | GO:0005869 | dynactin complex(GO:0005869) |
| 0.0 | 0.2 | GO:0036449 | microtubule minus-end(GO:0036449) |
| 0.0 | 1.3 | GO:0044322 | endoplasmic reticulum quality control compartment(GO:0044322) |
| 0.0 | 1.3 | GO:0044295 | axonal growth cone(GO:0044295) |
| 0.0 | 0.5 | GO:0060077 | inhibitory synapse(GO:0060077) |
| 0.0 | 0.5 | GO:0071437 | invadopodium(GO:0071437) |
| 0.0 | 3.5 | GO:0031091 | platelet alpha granule(GO:0031091) |
| 0.0 | 0.2 | GO:0070876 | SOSS complex(GO:0070876) |
| 0.0 | 0.2 | GO:0043291 | RAVE complex(GO:0043291) |
| 0.0 | 0.4 | GO:0031465 | Cul4B-RING E3 ubiquitin ligase complex(GO:0031465) |
| 0.0 | 0.0 | GO:0033655 | host cell cytoplasm(GO:0030430) host cell cytoplasm part(GO:0033655) |
| 0.0 | 0.3 | GO:0016471 | vacuolar proton-transporting V-type ATPase complex(GO:0016471) |
| 0.0 | 0.8 | GO:1904724 | tertiary granule lumen(GO:1904724) |
| 0.0 | 0.2 | GO:0097149 | centralspindlin complex(GO:0097149) |
| 0.0 | 0.4 | GO:0000153 | cytoplasmic ubiquitin ligase complex(GO:0000153) |
| 0.0 | 0.1 | GO:1990357 | terminal web(GO:1990357) |
| 0.0 | 0.6 | GO:0005642 | annulate lamellae(GO:0005642) |
| 0.0 | 0.6 | GO:0043218 | compact myelin(GO:0043218) |
| 0.0 | 0.3 | GO:0016602 | CCAAT-binding factor complex(GO:0016602) |
| 0.0 | 0.1 | GO:0044453 | nuclear membrane part(GO:0044453) |
| 0.0 | 0.1 | GO:0044754 | autolysosome(GO:0044754) |
| 0.0 | 0.1 | GO:0072517 | viral factory(GO:0039713) cytoplasmic viral factory(GO:0039714) host cell viral assembly compartment(GO:0072517) |
| 0.0 | 1.5 | GO:0019897 | extrinsic component of plasma membrane(GO:0019897) |
| 0.0 | 0.2 | GO:0001940 | male pronucleus(GO:0001940) |
| 0.0 | 3.9 | GO:0048770 | melanosome(GO:0042470) pigment granule(GO:0048770) |
| 0.0 | 0.1 | GO:0017109 | glutamate-cysteine ligase complex(GO:0017109) |
| 0.0 | 3.9 | GO:0044306 | neuron projection terminus(GO:0044306) |
| 0.0 | 0.0 | GO:0098559 | cytoplasmic side of early endosome membrane(GO:0098559) |
| 0.0 | 0.1 | GO:0033167 | ARC complex(GO:0033167) |
| 0.0 | 0.1 | GO:0031510 | SUMO activating enzyme complex(GO:0031510) |
| 0.0 | 0.2 | GO:0048476 | Holliday junction resolvase complex(GO:0048476) |
| 0.0 | 0.1 | GO:0055087 | Ski complex(GO:0055087) |
| 0.0 | 0.1 | GO:0032584 | growth cone membrane(GO:0032584) |
| 0.0 | 0.2 | GO:0005958 | DNA-dependent protein kinase-DNA ligase 4 complex(GO:0005958) DNA ligase IV complex(GO:0032807) |
| 0.0 | 0.2 | GO:0005818 | astral microtubule(GO:0000235) aster(GO:0005818) |
| 0.0 | 0.3 | GO:0071144 | SMAD2-SMAD3 protein complex(GO:0071144) |
| 0.0 | 0.2 | GO:0044530 | supraspliceosomal complex(GO:0044530) |
| 0.0 | 0.7 | GO:0005798 | Golgi-associated vesicle(GO:0005798) |
| 0.0 | 0.2 | GO:0009331 | glycerol-3-phosphate dehydrogenase complex(GO:0009331) |
| 0.0 | 2.4 | GO:0034707 | chloride channel complex(GO:0034707) |
| 0.0 | 0.3 | GO:0060171 | stereocilium membrane(GO:0060171) |
| 0.0 | 0.6 | GO:0000145 | exocyst(GO:0000145) |
| 0.0 | 0.4 | GO:0070938 | contractile ring(GO:0070938) |
| 0.0 | 23.6 | GO:0000139 | Golgi membrane(GO:0000139) |
| 0.0 | 0.3 | GO:0030897 | HOPS complex(GO:0030897) |
| 0.0 | 0.1 | GO:0043020 | NADPH oxidase complex(GO:0043020) |
| 0.0 | 0.2 | GO:1990578 | perinuclear endoplasmic reticulum membrane(GO:1990578) |
| 0.0 | 0.3 | GO:0070652 | HAUS complex(GO:0070652) |
| 0.0 | 0.3 | GO:0033256 | I-kappaB/NF-kappaB complex(GO:0033256) |
| 0.0 | 0.4 | GO:0090533 | cation-transporting ATPase complex(GO:0090533) |
| 0.0 | 0.2 | GO:0097550 | transcriptional preinitiation complex(GO:0097550) |
| 0.0 | 0.1 | GO:0000308 | cytoplasmic cyclin-dependent protein kinase holoenzyme complex(GO:0000308) |
| 0.0 | 0.3 | GO:0005883 | neurofilament(GO:0005883) |
| 0.0 | 0.1 | GO:0016939 | kinesin II complex(GO:0016939) |
| 0.0 | 0.4 | GO:0031932 | TORC2 complex(GO:0031932) |
| 0.0 | 0.1 | GO:0005683 | U7 snRNP(GO:0005683) |
| 0.0 | 0.1 | GO:0031417 | NatC complex(GO:0031417) |
| 0.0 | 9.3 | GO:0000790 | nuclear chromatin(GO:0000790) |
| 0.0 | 0.0 | GO:0032301 | MutSalpha complex(GO:0032301) |
| 0.0 | 0.4 | GO:0035371 | microtubule plus-end(GO:0035371) |
| 0.0 | 0.4 | GO:0046658 | anchored component of plasma membrane(GO:0046658) |
| 0.0 | 2.9 | GO:0034774 | secretory granule lumen(GO:0034774) |
| 0.0 | 0.1 | GO:0044423 | virion(GO:0019012) virion part(GO:0044423) |
| 0.0 | 0.3 | GO:0005686 | U2 snRNP(GO:0005686) |
| 0.0 | 0.9 | GO:0000159 | protein phosphatase type 2A complex(GO:0000159) |
| 0.0 | 0.2 | GO:0071541 | eukaryotic translation initiation factor 3 complex, eIF3m(GO:0071541) |
| 0.0 | 3.0 | GO:0005882 | intermediate filament(GO:0005882) |
| 0.0 | 0.3 | GO:0032433 | filopodium tip(GO:0032433) |
| 0.0 | 0.6 | GO:0030286 | dynein complex(GO:0030286) |
| 0.0 | 0.0 | GO:1990812 | growth cone filopodium(GO:1990812) |
| 0.0 | 0.1 | GO:0001652 | granular component(GO:0001652) |
| 0.0 | 0.1 | GO:0030289 | protein phosphatase 4 complex(GO:0030289) |
| 0.0 | 0.4 | GO:0005801 | cis-Golgi network(GO:0005801) |
| 0.0 | 0.6 | GO:0097228 | sperm principal piece(GO:0097228) |
| 0.0 | 0.0 | GO:0032302 | MutSbeta complex(GO:0032302) |
| 0.0 | 0.1 | GO:0036020 | endolysosome membrane(GO:0036020) |
| 0.0 | 0.4 | GO:0005849 | mRNA cleavage factor complex(GO:0005849) |
| 0.0 | 0.4 | GO:0099738 | cell cortex region(GO:0099738) |
| 0.0 | 0.2 | GO:0030870 | Mre11 complex(GO:0030870) |
| 0.0 | 1.2 | GO:0042734 | presynaptic membrane(GO:0042734) |
| 0.0 | 0.2 | GO:0030131 | clathrin adaptor complex(GO:0030131) |
| 0.0 | 0.3 | GO:0036038 | MKS complex(GO:0036038) |
| 0.0 | 0.1 | GO:0005663 | DNA replication factor C complex(GO:0005663) |
| 0.0 | 0.1 | GO:0072379 | BAT3 complex(GO:0071818) ER membrane insertion complex(GO:0072379) |
| 0.0 | 1.5 | GO:0008076 | voltage-gated potassium channel complex(GO:0008076) |
| 0.0 | 4.3 | GO:0016324 | apical plasma membrane(GO:0016324) |
| 0.0 | 0.2 | GO:0097512 | cardiac myofibril(GO:0097512) |
| 0.0 | 0.1 | GO:0072546 | ER membrane protein complex(GO:0072546) |
| 0.0 | 0.2 | GO:0031083 | BLOC-1 complex(GO:0031083) |
Gene overrepresentation in molecular function category:
| Log-likelihood per target | Total log-likelihood | Term | Description |
|---|---|---|---|
| 1.0 | 3.9 | GO:0008832 | dGTPase activity(GO:0008832) triphosphoric monoester hydrolase activity(GO:0016793) guanyl deoxyribonucleotide binding(GO:0032560) dGTP binding(GO:0032567) |
| 0.8 | 3.2 | GO:0033897 | ribonuclease T2 activity(GO:0033897) |
| 0.8 | 8.7 | GO:0030369 | ICAM-3 receptor activity(GO:0030369) |
| 0.7 | 2.0 | GO:0009032 | thymidine phosphorylase activity(GO:0009032) pyrimidine-nucleoside phosphorylase activity(GO:0016154) |
| 0.7 | 9.2 | GO:0051525 | NFAT protein binding(GO:0051525) |
| 0.6 | 3.5 | GO:0047696 | beta-adrenergic receptor kinase activity(GO:0047696) |
| 0.5 | 2.5 | GO:0047280 | nicotinamide phosphoribosyltransferase activity(GO:0047280) |
| 0.4 | 2.1 | GO:0033829 | O-fucosylpeptide 3-beta-N-acetylglucosaminyltransferase activity(GO:0033829) |
| 0.4 | 1.6 | GO:0016165 | linoleate 13S-lipoxygenase activity(GO:0016165) |
| 0.4 | 2.3 | GO:0015018 | galactosylgalactosylxylosylprotein 3-beta-glucuronosyltransferase activity(GO:0015018) |
| 0.4 | 1.5 | GO:0016495 | C-X3-C chemokine receptor activity(GO:0016495) |
| 0.4 | 2.6 | GO:0004920 | interleukin-10 receptor activity(GO:0004920) |
| 0.4 | 1.1 | GO:0036134 | thromboxane-A synthase activity(GO:0004796) 12-hydroxyheptadecatrienoic acid synthase activity(GO:0036134) |
| 0.3 | 1.0 | GO:0016603 | glutaminyl-peptide cyclotransferase activity(GO:0016603) |
| 0.3 | 4.1 | GO:0043533 | inositol 1,3,4,5 tetrakisphosphate binding(GO:0043533) |
| 0.3 | 1.7 | GO:0004914 | interleukin-3 receptor activity(GO:0004912) interleukin-5 receptor activity(GO:0004914) |
| 0.3 | 1.0 | GO:0031798 | type 1 metabotropic glutamate receptor binding(GO:0031798) |
| 0.3 | 1.3 | GO:0004513 | neolactotetraosylceramide alpha-2,3-sialyltransferase activity(GO:0004513) lactosylceramide alpha-2,3-sialyltransferase activity(GO:0047291) |
| 0.3 | 1.9 | GO:0034714 | type III transforming growth factor beta receptor binding(GO:0034714) |
| 0.3 | 2.8 | GO:0015057 | thrombin receptor activity(GO:0015057) |
| 0.3 | 1.2 | GO:0005471 | ATP:ADP antiporter activity(GO:0005471) adenine transmembrane transporter activity(GO:0015207) |
| 0.3 | 1.2 | GO:0004905 | type I interferon receptor activity(GO:0004905) |
| 0.3 | 0.9 | GO:0004850 | uridine phosphorylase activity(GO:0004850) |
| 0.3 | 0.9 | GO:0004618 | phosphoglycerate kinase activity(GO:0004618) |
| 0.3 | 3.9 | GO:0001609 | G-protein coupled adenosine receptor activity(GO:0001609) |
| 0.3 | 0.8 | GO:0035651 | AP-3 adaptor complex binding(GO:0035651) |
| 0.3 | 4.5 | GO:0045236 | CXCR chemokine receptor binding(GO:0045236) |
| 0.3 | 1.4 | GO:0003829 | beta-1,3-galactosyl-O-glycosyl-glycoprotein beta-1,6-N-acetylglucosaminyltransferase activity(GO:0003829) |
| 0.3 | 1.9 | GO:0008273 | calcium, potassium:sodium antiporter activity(GO:0008273) |
| 0.3 | 1.6 | GO:0004918 | interleukin-8 receptor activity(GO:0004918) |
| 0.3 | 0.8 | GO:0047315 | kynurenine-glyoxylate transaminase activity(GO:0047315) |
| 0.3 | 0.8 | GO:0030617 | transforming growth factor beta receptor, inhibitory cytoplasmic mediator activity(GO:0030617) |
| 0.2 | 1.2 | GO:0016262 | protein N-acetylglucosaminyltransferase activity(GO:0016262) |
| 0.2 | 1.2 | GO:0046933 | proton-transporting ATP synthase activity, rotational mechanism(GO:0046933) |
| 0.2 | 1.2 | GO:0004668 | protein-arginine deiminase activity(GO:0004668) |
| 0.2 | 1.2 | GO:0070180 | large ribosomal subunit rRNA binding(GO:0070180) |
| 0.2 | 0.9 | GO:0002060 | purine nucleobase binding(GO:0002060) |
| 0.2 | 3.3 | GO:0015501 | glutamate:sodium symporter activity(GO:0015501) |
| 0.2 | 0.7 | GO:0017129 | triglyceride binding(GO:0017129) |
| 0.2 | 4.1 | GO:0038036 | sphingosine-1-phosphate receptor activity(GO:0038036) |
| 0.2 | 1.1 | GO:0004999 | vasoactive intestinal polypeptide receptor activity(GO:0004999) |
| 0.2 | 0.8 | GO:0047192 | 1-alkylglycerophosphocholine O-acetyltransferase activity(GO:0047192) |
| 0.2 | 0.6 | GO:0004939 | beta-adrenergic receptor activity(GO:0004939) |
| 0.2 | 1.2 | GO:0004706 | JUN kinase kinase kinase activity(GO:0004706) |
| 0.2 | 0.8 | GO:0004074 | biliverdin reductase activity(GO:0004074) |
| 0.2 | 0.6 | GO:0016005 | phospholipase A2 activator activity(GO:0016005) |
| 0.2 | 0.8 | GO:0051765 | inositol tetrakisphosphate kinase activity(GO:0051765) |
| 0.2 | 0.6 | GO:0005026 | transforming growth factor beta receptor activity, type II(GO:0005026) |
| 0.2 | 0.9 | GO:0070579 | methylcytosine dioxygenase activity(GO:0070579) |
| 0.2 | 12.9 | GO:0034987 | immunoglobulin receptor binding(GO:0034987) |
| 0.2 | 1.4 | GO:0019763 | immunoglobulin receptor activity(GO:0019763) |
| 0.2 | 0.9 | GO:0004666 | prostaglandin-endoperoxide synthase activity(GO:0004666) |
| 0.2 | 1.6 | GO:0035662 | Toll-like receptor 4 binding(GO:0035662) |
| 0.2 | 0.5 | GO:0030156 | benzodiazepine receptor binding(GO:0030156) |
| 0.2 | 0.7 | GO:0098625 | methylselenol reductase activity(GO:0098625) methylseleninic acid reductase activity(GO:0098626) |
| 0.2 | 0.7 | GO:0008513 | secondary active organic cation transmembrane transporter activity(GO:0008513) |
| 0.2 | 0.5 | GO:0016263 | glycoprotein-N-acetylgalactosamine 3-beta-galactosyltransferase activity(GO:0016263) |
| 0.2 | 0.5 | GO:0042284 | sphingolipid delta-4 desaturase activity(GO:0042284) |
| 0.2 | 1.2 | GO:0086089 | voltage-gated potassium channel activity involved in atrial cardiac muscle cell action potential repolarization(GO:0086089) |
| 0.2 | 0.5 | GO:0090422 | thiamine pyrophosphate transporter activity(GO:0090422) |
| 0.2 | 2.2 | GO:0016176 | superoxide-generating NADPH oxidase activator activity(GO:0016176) |
| 0.2 | 0.5 | GO:0002113 | interleukin-33 binding(GO:0002113) |
| 0.2 | 0.5 | GO:0004336 | galactosylceramidase activity(GO:0004336) |
| 0.2 | 1.1 | GO:0050119 | N-acetylglucosamine deacetylase activity(GO:0050119) |
| 0.2 | 3.1 | GO:0019911 | structural constituent of myelin sheath(GO:0019911) |
| 0.2 | 12.1 | GO:0001784 | phosphotyrosine binding(GO:0001784) |
| 0.2 | 1.9 | GO:0047144 | 2-acylglycerol-3-phosphate O-acyltransferase activity(GO:0047144) |
| 0.2 | 1.2 | GO:0001875 | lipopolysaccharide receptor activity(GO:0001875) |
| 0.1 | 1.5 | GO:0043184 | vascular endothelial growth factor receptor 2 binding(GO:0043184) |
| 0.1 | 0.9 | GO:0004522 | ribonuclease A activity(GO:0004522) |
| 0.1 | 0.4 | GO:0004878 | complement component C5a receptor activity(GO:0004878) |
| 0.1 | 0.4 | GO:0004170 | dUTP diphosphatase activity(GO:0004170) |
| 0.1 | 1.0 | GO:0051021 | GDP-dissociation inhibitor binding(GO:0051021) Rho GDP-dissociation inhibitor binding(GO:0051022) |
| 0.1 | 0.7 | GO:0019776 | Atg8 ligase activity(GO:0019776) |
| 0.1 | 2.9 | GO:0009931 | calcium-dependent protein serine/threonine kinase activity(GO:0009931) |
| 0.1 | 2.3 | GO:0032395 | MHC class II receptor activity(GO:0032395) |
| 0.1 | 1.1 | GO:0051032 | nucleic acid transmembrane transporter activity(GO:0051032) RNA transmembrane transporter activity(GO:0051033) |
| 0.1 | 2.3 | GO:0032050 | clathrin heavy chain binding(GO:0032050) |
| 0.1 | 0.4 | GO:0034039 | 8-oxo-7,8-dihydroguanine DNA N-glycosylase activity(GO:0034039) |
| 0.1 | 1.0 | GO:0050659 | N-acetylgalactosamine 4-sulfate 6-O-sulfotransferase activity(GO:0050659) |
| 0.1 | 0.4 | GO:0098918 | structural constituent of synapse(GO:0098918) structural constituent of postsynaptic actin cytoskeleton(GO:0098973) |
| 0.1 | 0.8 | GO:0008518 | reduced folate carrier activity(GO:0008518) |
| 0.1 | 0.7 | GO:0001026 | TFIIIB-type transcription factor activity(GO:0001026) |
| 0.1 | 0.7 | GO:0001727 | lipid kinase activity(GO:0001727) |
| 0.1 | 0.4 | GO:0035379 | carbon dioxide transmembrane transporter activity(GO:0035379) |
| 0.1 | 4.6 | GO:0035259 | glucocorticoid receptor binding(GO:0035259) |
| 0.1 | 0.5 | GO:0047685 | amine sulfotransferase activity(GO:0047685) |
| 0.1 | 0.5 | GO:0005477 | pyruvate secondary active transmembrane transporter activity(GO:0005477) |
| 0.1 | 1.0 | GO:0004735 | pyrroline-5-carboxylate reductase activity(GO:0004735) |
| 0.1 | 1.0 | GO:0008853 | exodeoxyribonuclease III activity(GO:0008853) |
| 0.1 | 0.9 | GO:0008467 | [heparan sulfate]-glucosamine 3-sulfotransferase 1 activity(GO:0008467) |
| 0.1 | 1.4 | GO:0015129 | lactate transmembrane transporter activity(GO:0015129) |
| 0.1 | 0.7 | GO:0023029 | MHC class Ib protein binding(GO:0023029) |
| 0.1 | 0.9 | GO:0004743 | pyruvate kinase activity(GO:0004743) |
| 0.1 | 1.1 | GO:0004699 | calcium-independent protein kinase C activity(GO:0004699) |
| 0.1 | 1.2 | GO:0003835 | beta-galactoside alpha-2,6-sialyltransferase activity(GO:0003835) |
| 0.1 | 8.3 | GO:0050699 | WW domain binding(GO:0050699) |
| 0.1 | 0.4 | GO:0061505 | DNA topoisomerase type II (ATP-hydrolyzing) activity(GO:0003918) DNA topoisomerase II activity(GO:0061505) |
| 0.1 | 1.2 | GO:0001665 | alpha-N-acetylgalactosaminide alpha-2,6-sialyltransferase activity(GO:0001665) |
| 0.1 | 0.4 | GO:0031737 | CX3C chemokine receptor binding(GO:0031737) |
| 0.1 | 0.5 | GO:0052810 | 1-phosphatidylinositol-5-kinase activity(GO:0052810) |
| 0.1 | 0.8 | GO:1990050 | phosphatidic acid transporter activity(GO:1990050) |
| 0.1 | 0.5 | GO:0016728 | ribonucleoside-diphosphate reductase activity, thioredoxin disulfide as acceptor(GO:0004748) oxidoreductase activity, acting on CH or CH2 groups, disulfide as acceptor(GO:0016728) ribonucleoside-diphosphate reductase activity(GO:0061731) |
| 0.1 | 3.8 | GO:0001965 | G-protein alpha-subunit binding(GO:0001965) |
| 0.1 | 3.8 | GO:0050811 | GABA receptor binding(GO:0050811) |
| 0.1 | 0.5 | GO:0061656 | SUMO conjugating enzyme activity(GO:0061656) |
| 0.1 | 0.6 | GO:0047844 | deoxycytidine deaminase activity(GO:0047844) |
| 0.1 | 3.8 | GO:0031489 | myosin V binding(GO:0031489) |
| 0.1 | 3.7 | GO:0042605 | peptide antigen binding(GO:0042605) |
| 0.1 | 0.5 | GO:0045569 | TRAIL binding(GO:0045569) |
| 0.1 | 0.3 | GO:0003878 | ATP citrate synthase activity(GO:0003878) |
| 0.1 | 1.1 | GO:0031812 | G-protein coupled nucleotide receptor binding(GO:0031811) P2Y1 nucleotide receptor binding(GO:0031812) |
| 0.1 | 0.5 | GO:0070576 | vitamin D 24-hydroxylase activity(GO:0070576) |
| 0.1 | 0.7 | GO:0050610 | glutathione dehydrogenase (ascorbate) activity(GO:0045174) methylarsonate reductase activity(GO:0050610) |
| 0.1 | 1.0 | GO:0098639 | collagen binding involved in cell-matrix adhesion(GO:0098639) |
| 0.1 | 0.8 | GO:0003873 | 6-phosphofructo-2-kinase activity(GO:0003873) |
| 0.1 | 1.3 | GO:0031386 | protein tag(GO:0031386) |
| 0.1 | 0.5 | GO:0050501 | hyaluronan synthase activity(GO:0050501) |
| 0.1 | 2.4 | GO:0005522 | profilin binding(GO:0005522) |
| 0.1 | 0.3 | GO:0099530 | G-protein coupled receptor activity involved in regulation of postsynaptic membrane potential(GO:0099530) |
| 0.1 | 0.4 | GO:0001632 | leukotriene B4 receptor activity(GO:0001632) |
| 0.1 | 2.5 | GO:0015271 | outward rectifier potassium channel activity(GO:0015271) |
| 0.1 | 0.5 | GO:0043813 | phosphatidylinositol-3,5-bisphosphate 5-phosphatase activity(GO:0043813) |
| 0.1 | 0.3 | GO:0060422 | peptidyl-dipeptidase inhibitor activity(GO:0060422) |
| 0.1 | 1.1 | GO:0016494 | C-X-C chemokine receptor activity(GO:0016494) |
| 0.1 | 0.7 | GO:0046624 | sphingolipid transporter activity(GO:0046624) |
| 0.1 | 0.8 | GO:0043812 | phosphatidylinositol-4-phosphate phosphatase activity(GO:0043812) |
| 0.1 | 0.3 | GO:0033981 | D-dopachrome decarboxylase activity(GO:0033981) |
| 0.1 | 0.4 | GO:0022865 | transmembrane electron transfer carrier(GO:0022865) |
| 0.1 | 0.4 | GO:1904492 | Ac-Asp-Glu binding(GO:1904492) tetrahydrofolyl-poly(glutamate) polymer binding(GO:1904493) |
| 0.1 | 1.2 | GO:0019864 | IgG binding(GO:0019864) |
| 0.1 | 0.4 | GO:0008177 | succinate dehydrogenase (ubiquinone) activity(GO:0008177) |
| 0.1 | 0.9 | GO:0030023 | extracellular matrix constituent conferring elasticity(GO:0030023) |
| 0.1 | 0.3 | GO:0050613 | delta14-sterol reductase activity(GO:0050613) |
| 0.1 | 0.4 | GO:0070095 | fructose-6-phosphate binding(GO:0070095) |
| 0.1 | 1.2 | GO:0046920 | alpha-(1->3)-fucosyltransferase activity(GO:0046920) |
| 0.1 | 1.2 | GO:0004875 | complement receptor activity(GO:0004875) |
| 0.1 | 0.9 | GO:0047623 | AMP deaminase activity(GO:0003876) adenosine-phosphate deaminase activity(GO:0047623) |
| 0.1 | 1.4 | GO:0001135 | transcription factor activity, RNA polymerase II transcription factor recruiting(GO:0001135) |
| 0.1 | 0.6 | GO:0070915 | lysophosphatidic acid receptor activity(GO:0070915) |
| 0.1 | 0.4 | GO:0031749 | D2 dopamine receptor binding(GO:0031749) D4 dopamine receptor binding(GO:0031751) |
| 0.1 | 0.5 | GO:0047894 | flavonol 3-sulfotransferase activity(GO:0047894) |
| 0.1 | 0.7 | GO:0008454 | alpha-1,3-mannosylglycoprotein 4-beta-N-acetylglucosaminyltransferase activity(GO:0008454) |
| 0.1 | 0.4 | GO:0046921 | glycoprotein 6-alpha-L-fucosyltransferase activity(GO:0008424) alpha-(1->6)-fucosyltransferase activity(GO:0046921) |
| 0.1 | 0.7 | GO:0043208 | glycosphingolipid binding(GO:0043208) |
| 0.1 | 0.5 | GO:0052828 | phosphatidylinositol-3,4-bisphosphate 4-phosphatase activity(GO:0016316) inositol-1,3,4-trisphosphate 4-phosphatase activity(GO:0017161) phosphatidylinositol-4,5-bisphosphate 4-phosphatase activity(GO:0034597) inositol-3,4-bisphosphate 4-phosphatase activity(GO:0052828) |
| 0.1 | 2.0 | GO:0005344 | oxygen transporter activity(GO:0005344) |
| 0.1 | 0.8 | GO:1990446 | U1 snRNP binding(GO:1990446) |
| 0.1 | 0.7 | GO:0035473 | lipase binding(GO:0035473) |
| 0.1 | 1.1 | GO:0030911 | TPR domain binding(GO:0030911) |
| 0.1 | 0.3 | GO:0004945 | angiotensin receptor activity(GO:0001595) angiotensin type II receptor activity(GO:0004945) |
| 0.1 | 1.3 | GO:0005131 | growth hormone receptor binding(GO:0005131) |
| 0.1 | 0.9 | GO:0030348 | syntaxin-3 binding(GO:0030348) |
| 0.1 | 0.7 | GO:0004771 | sterol esterase activity(GO:0004771) |
| 0.1 | 3.1 | GO:0005388 | calcium-transporting ATPase activity(GO:0005388) |
| 0.1 | 5.2 | GO:0071889 | 14-3-3 protein binding(GO:0071889) |
| 0.1 | 3.3 | GO:0016505 | peptidase activator activity involved in apoptotic process(GO:0016505) |
| 0.1 | 0.7 | GO:0004609 | phosphatidylserine decarboxylase activity(GO:0004609) |
| 0.1 | 0.7 | GO:0001517 | N-acetylglucosamine 6-O-sulfotransferase activity(GO:0001517) |
| 0.1 | 1.6 | GO:0008199 | ferric iron binding(GO:0008199) |
| 0.1 | 0.3 | GO:0030395 | lactose binding(GO:0030395) |
| 0.1 | 0.7 | GO:0070728 | leucine binding(GO:0070728) |
| 0.1 | 0.4 | GO:0047757 | chondroitin-glucuronate 5-epimerase activity(GO:0047757) |
| 0.1 | 0.2 | GO:0004314 | [acyl-carrier-protein] S-malonyltransferase activity(GO:0004314) S-malonyltransferase activity(GO:0016419) malonyltransferase activity(GO:0016420) |
| 0.1 | 0.2 | GO:0004056 | argininosuccinate lyase activity(GO:0004056) |
| 0.1 | 0.6 | GO:1990254 | keratin filament binding(GO:1990254) |
| 0.1 | 0.3 | GO:0008427 | calcium-dependent protein kinase inhibitor activity(GO:0008427) |
| 0.1 | 0.5 | GO:0008240 | tripeptidyl-peptidase activity(GO:0008240) peptidyl-dipeptidase activity(GO:0008241) bradykinin receptor binding(GO:0031711) |
| 0.1 | 0.9 | GO:0016286 | small conductance calcium-activated potassium channel activity(GO:0016286) |
| 0.1 | 1.1 | GO:0042608 | T cell receptor binding(GO:0042608) |
| 0.1 | 1.0 | GO:0070181 | small ribosomal subunit rRNA binding(GO:0070181) |
| 0.1 | 1.8 | GO:0042288 | MHC class I protein binding(GO:0042288) |
| 0.1 | 0.7 | GO:0016618 | hydroxypyruvate reductase activity(GO:0016618) glyoxylate reductase (NADP) activity(GO:0030267) |
| 0.1 | 2.5 | GO:0043325 | phosphatidylinositol-3,4-bisphosphate binding(GO:0043325) |
| 0.1 | 0.5 | GO:0003920 | GMP reductase activity(GO:0003920) oxidoreductase activity, acting on NAD(P)H, nitrogenous group as acceptor(GO:0016657) |
| 0.1 | 2.0 | GO:0044548 | S100 protein binding(GO:0044548) |
| 0.1 | 0.5 | GO:0042392 | sphingosine-1-phosphate phosphatase activity(GO:0042392) |
| 0.1 | 2.6 | GO:0005092 | GDP-dissociation inhibitor activity(GO:0005092) |
| 0.1 | 1.1 | GO:0008526 | phosphatidylinositol transporter activity(GO:0008526) |
| 0.1 | 1.1 | GO:0045504 | dynein heavy chain binding(GO:0045504) |
| 0.1 | 0.4 | GO:0071535 | RING-like zinc finger domain binding(GO:0071535) |
| 0.1 | 1.5 | GO:0070513 | death domain binding(GO:0070513) |
| 0.1 | 0.3 | GO:0008311 | double-stranded DNA 3'-5' exodeoxyribonuclease activity(GO:0008311) |
| 0.1 | 0.4 | GO:0004337 | dimethylallyltranstransferase activity(GO:0004161) geranyltranstransferase activity(GO:0004337) |
| 0.1 | 0.6 | GO:0004351 | glutamate decarboxylase activity(GO:0004351) |
| 0.1 | 0.7 | GO:0019238 | cyclohydrolase activity(GO:0019238) |
| 0.1 | 0.6 | GO:0004571 | mannosyl-oligosaccharide 1,2-alpha-mannosidase activity(GO:0004571) |
| 0.1 | 0.2 | GO:0004483 | mRNA (nucleoside-2'-O-)-methyltransferase activity(GO:0004483) |
| 0.1 | 1.6 | GO:0023026 | MHC class II protein complex binding(GO:0023026) |
| 0.1 | 0.3 | GO:0002046 | opsin binding(GO:0002046) |
| 0.1 | 0.4 | GO:0072345 | NAADP-sensitive calcium-release channel activity(GO:0072345) |
| 0.1 | 0.3 | GO:0046964 | 3'-phosphoadenosine 5'-phosphosulfate transmembrane transporter activity(GO:0046964) |
| 0.1 | 1.0 | GO:1990247 | N6-methyladenosine-containing RNA binding(GO:1990247) |
| 0.1 | 1.6 | GO:0004691 | cAMP-dependent protein kinase activity(GO:0004691) |
| 0.1 | 2.4 | GO:0005031 | tumor necrosis factor-activated receptor activity(GO:0005031) death receptor activity(GO:0005035) |
| 0.1 | 3.1 | GO:0008157 | protein phosphatase 1 binding(GO:0008157) |
| 0.1 | 0.6 | GO:0005087 | Ran guanyl-nucleotide exchange factor activity(GO:0005087) |
| 0.1 | 0.2 | GO:0004998 | transferrin receptor activity(GO:0004998) |
| 0.1 | 1.8 | GO:0019992 | diacylglycerol binding(GO:0019992) |
| 0.1 | 0.5 | GO:0015220 | choline transmembrane transporter activity(GO:0015220) |
| 0.1 | 0.7 | GO:0004720 | protein-lysine 6-oxidase activity(GO:0004720) |
| 0.1 | 0.7 | GO:0031013 | troponin I binding(GO:0031013) |
| 0.1 | 1.5 | GO:0008603 | cAMP-dependent protein kinase regulator activity(GO:0008603) |
| 0.1 | 1.1 | GO:0004028 | 3-chloroallyl aldehyde dehydrogenase activity(GO:0004028) |
| 0.1 | 1.0 | GO:0030169 | low-density lipoprotein particle binding(GO:0030169) |
| 0.1 | 0.4 | GO:0004563 | beta-N-acetylhexosaminidase activity(GO:0004563) |
| 0.1 | 2.8 | GO:0005521 | lamin binding(GO:0005521) |
| 0.1 | 3.3 | GO:0003785 | actin monomer binding(GO:0003785) |
| 0.1 | 2.9 | GO:0005540 | hyaluronic acid binding(GO:0005540) |
| 0.1 | 2.0 | GO:0004653 | polypeptide N-acetylgalactosaminyltransferase activity(GO:0004653) |
| 0.1 | 0.4 | GO:0030346 | protein phosphatase 2B binding(GO:0030346) |
| 0.1 | 0.1 | GO:0098634 | protein binding involved in cell-matrix adhesion(GO:0098634) integrin binding involved in cell-matrix adhesion(GO:0098640) |
| 0.1 | 2.5 | GO:0008301 | DNA binding, bending(GO:0008301) |
| 0.1 | 0.4 | GO:0098821 | BMP receptor activity(GO:0098821) |
| 0.1 | 0.3 | GO:0045322 | unmethylated CpG binding(GO:0045322) |
| 0.1 | 0.6 | GO:0038181 | bile acid receptor activity(GO:0038181) |
| 0.1 | 0.3 | GO:0047256 | beta-galactosyl-N-acetylglucosaminylgalactosylglucosyl-ceramide beta-1,3-acetylglucosaminyltransferase activity(GO:0008457) lactosylceramide 1,3-N-acetyl-beta-D-glucosaminyltransferase activity(GO:0047256) |
| 0.1 | 3.1 | GO:0005164 | tumor necrosis factor receptor binding(GO:0005164) |
| 0.1 | 1.3 | GO:0015926 | glucosidase activity(GO:0015926) |
| 0.1 | 0.2 | GO:0004832 | valine-tRNA ligase activity(GO:0004832) |
| 0.1 | 1.7 | GO:0044769 | ATPase activity, coupled to transmembrane movement of ions, rotational mechanism(GO:0044769) proton-transporting ATPase activity, rotational mechanism(GO:0046961) |
| 0.1 | 0.3 | GO:0047391 | alkylglycerophosphoethanolamine phosphodiesterase activity(GO:0047391) |
| 0.1 | 0.4 | GO:0005375 | copper ion transmembrane transporter activity(GO:0005375) |
| 0.1 | 0.6 | GO:0030368 | interleukin-17 receptor activity(GO:0030368) |
| 0.1 | 0.4 | GO:0005105 | type 1 fibroblast growth factor receptor binding(GO:0005105) |
| 0.1 | 0.4 | GO:0016314 | phosphatidylinositol-3,4,5-trisphosphate 3-phosphatase activity(GO:0016314) |
| 0.1 | 0.9 | GO:0031821 | G-protein coupled serotonin receptor binding(GO:0031821) |
| 0.1 | 0.5 | GO:0004111 | creatine kinase activity(GO:0004111) |
| 0.1 | 0.2 | GO:0004582 | dolichyl-phosphate beta-D-mannosyltransferase activity(GO:0004582) |
| 0.1 | 0.4 | GO:0016802 | adenosylhomocysteinase activity(GO:0004013) trialkylsulfonium hydrolase activity(GO:0016802) |
| 0.1 | 0.2 | GO:0046592 | polyamine oxidase activity(GO:0046592) spermine:oxygen oxidoreductase (spermidine-forming) activity(GO:0052901) |
| 0.1 | 0.6 | GO:0050700 | CARD domain binding(GO:0050700) |
| 0.1 | 2.8 | GO:0030676 | Rac guanyl-nucleotide exchange factor activity(GO:0030676) |
| 0.1 | 0.2 | GO:0005462 | UDP-N-acetylglucosamine transmembrane transporter activity(GO:0005462) |
| 0.1 | 0.7 | GO:0034713 | type I transforming growth factor beta receptor binding(GO:0034713) |
| 0.1 | 1.1 | GO:0017154 | semaphorin receptor activity(GO:0017154) |
| 0.1 | 0.4 | GO:0016936 | galactoside binding(GO:0016936) |
| 0.1 | 3.2 | GO:0005484 | SNAP receptor activity(GO:0005484) |
| 0.1 | 0.5 | GO:0015319 | sodium:inorganic phosphate symporter activity(GO:0015319) |
| 0.1 | 0.8 | GO:0022833 | mechanically-gated ion channel activity(GO:0008381) mechanically gated channel activity(GO:0022833) |
| 0.1 | 0.3 | GO:0047493 | sphingomyelin synthase activity(GO:0033188) ceramide cholinephosphotransferase activity(GO:0047493) |
| 0.1 | 0.4 | GO:0016454 | serine C-palmitoyltransferase activity(GO:0004758) C-palmitoyltransferase activity(GO:0016454) |
| 0.1 | 4.2 | GO:0004715 | non-membrane spanning protein tyrosine kinase activity(GO:0004715) |
| 0.1 | 0.4 | GO:0042978 | ornithine decarboxylase activator activity(GO:0042978) |
| 0.1 | 0.5 | GO:0061133 | endopeptidase activator activity(GO:0061133) |
| 0.1 | 0.5 | GO:0047134 | protein-disulfide reductase activity(GO:0047134) |
| 0.1 | 0.3 | GO:0004719 | protein-L-isoaspartate (D-aspartate) O-methyltransferase activity(GO:0004719) |
| 0.1 | 1.2 | GO:0001161 | intronic transcription regulatory region sequence-specific DNA binding(GO:0001161) intronic transcription regulatory region DNA binding(GO:0044213) |
| 0.1 | 0.4 | GO:0036122 | BMP binding(GO:0036122) |
| 0.1 | 0.4 | GO:0003827 | alpha-1,3-mannosylglycoprotein 2-beta-N-acetylglucosaminyltransferase activity(GO:0003827) |
| 0.1 | 0.7 | GO:0004705 | JUN kinase activity(GO:0004705) SAP kinase activity(GO:0016909) |
| 0.1 | 0.2 | GO:0048257 | 3'-flap endonuclease activity(GO:0048257) |
| 0.1 | 2.1 | GO:0005001 | transmembrane receptor protein tyrosine phosphatase activity(GO:0005001) transmembrane receptor protein phosphatase activity(GO:0019198) |
| 0.1 | 0.2 | GO:0035373 | chondroitin sulfate proteoglycan binding(GO:0035373) |
| 0.1 | 0.8 | GO:0005381 | iron ion transmembrane transporter activity(GO:0005381) |
| 0.1 | 0.5 | GO:0004559 | alpha-mannosidase activity(GO:0004559) |
| 0.1 | 6.9 | GO:0003823 | antigen binding(GO:0003823) |
| 0.1 | 0.6 | GO:0004931 | extracellular ATP-gated cation channel activity(GO:0004931) ATP-gated ion channel activity(GO:0035381) |
| 0.1 | 0.8 | GO:0099604 | calcium-release channel activity(GO:0015278) ligand-gated calcium channel activity(GO:0099604) |
| 0.1 | 1.2 | GO:0004143 | diacylglycerol kinase activity(GO:0004143) |
| 0.1 | 1.2 | GO:0015095 | magnesium ion transmembrane transporter activity(GO:0015095) |
| 0.1 | 0.5 | GO:0003951 | NAD+ kinase activity(GO:0003951) |
| 0.1 | 0.1 | GO:0071209 | U7 snRNA binding(GO:0071209) |
| 0.1 | 1.8 | GO:0031683 | G-protein beta/gamma-subunit complex binding(GO:0031683) |
| 0.1 | 1.0 | GO:0061578 | Lys63-specific deubiquitinase activity(GO:0061578) |
| 0.0 | 2.4 | GO:0005086 | ARF guanyl-nucleotide exchange factor activity(GO:0005086) |
| 0.0 | 0.2 | GO:0004140 | dephospho-CoA kinase activity(GO:0004140) |
| 0.0 | 0.2 | GO:0098808 | mRNA cap binding(GO:0098808) |
| 0.0 | 0.3 | GO:0004749 | ribose phosphate diphosphokinase activity(GO:0004749) |
| 0.0 | 1.5 | GO:0031078 | histone deacetylase activity (H3-K14 specific)(GO:0031078) NAD-dependent histone deacetylase activity (H3-K14 specific)(GO:0032041) |
| 0.0 | 0.3 | GO:0005534 | galactose binding(GO:0005534) |
| 0.0 | 0.3 | GO:0003998 | acylphosphatase activity(GO:0003998) |
| 0.0 | 0.8 | GO:0070053 | thrombospondin receptor activity(GO:0070053) |
| 0.0 | 1.1 | GO:0000150 | recombinase activity(GO:0000150) |
| 0.0 | 0.3 | GO:0031708 | endothelin B receptor binding(GO:0031708) |
| 0.0 | 0.1 | GO:0004960 | thromboxane receptor activity(GO:0004960) thromboxane A2 receptor activity(GO:0004961) |
| 0.0 | 0.5 | GO:0050786 | RAGE receptor binding(GO:0050786) |
| 0.0 | 0.8 | GO:0039706 | co-receptor binding(GO:0039706) |
| 0.0 | 0.6 | GO:0071933 | Arp2/3 complex binding(GO:0071933) |
| 0.0 | 0.2 | GO:0047631 | ADP-ribose diphosphatase activity(GO:0047631) |
| 0.0 | 0.1 | GO:0001226 | RNA polymerase II transcription corepressor binding(GO:0001226) |
| 0.0 | 1.9 | GO:0038191 | neuropilin binding(GO:0038191) |
| 0.0 | 0.1 | GO:0090541 | MIT domain binding(GO:0090541) |
| 0.0 | 0.1 | GO:0036328 | VEGF-C-activated receptor activity(GO:0036328) |
| 0.0 | 0.2 | GO:0004439 | phosphatidylinositol-4,5-bisphosphate 5-phosphatase activity(GO:0004439) |
| 0.0 | 0.4 | GO:0010465 | nerve growth factor receptor activity(GO:0010465) |
| 0.0 | 0.5 | GO:0004969 | histamine receptor activity(GO:0004969) |
| 0.0 | 0.2 | GO:0004616 | phosphogluconate dehydrogenase (decarboxylating) activity(GO:0004616) |
| 0.0 | 0.6 | GO:0004697 | protein kinase C activity(GO:0004697) |
| 0.0 | 0.3 | GO:0005220 | inositol 1,4,5-trisphosphate-sensitive calcium-release channel activity(GO:0005220) |
| 0.0 | 0.1 | GO:0031403 | lithium ion binding(GO:0031403) |
| 0.0 | 1.2 | GO:0001530 | lipopolysaccharide binding(GO:0001530) |
| 0.0 | 0.1 | GO:0019948 | SUMO activating enzyme activity(GO:0019948) |
| 0.0 | 1.6 | GO:0005229 | intracellular calcium activated chloride channel activity(GO:0005229) |
| 0.0 | 0.3 | GO:0008823 | cupric reductase activity(GO:0008823) ferric-chelate reductase (NADPH) activity(GO:0052851) |
| 0.0 | 0.3 | GO:0099583 | neurotransmitter receptor activity involved in regulation of postsynaptic cytosolic calcium ion concentration(GO:0099583) |
| 0.0 | 0.7 | GO:0030955 | potassium ion binding(GO:0030955) |
| 0.0 | 0.4 | GO:0055104 | ligase inhibitor activity(GO:0055104) ubiquitin ligase inhibitor activity(GO:1990948) |
| 0.0 | 5.0 | GO:0043621 | protein self-association(GO:0043621) |
| 0.0 | 0.3 | GO:0004427 | inorganic diphosphatase activity(GO:0004427) |
| 0.0 | 1.3 | GO:0005545 | 1-phosphatidylinositol binding(GO:0005545) |
| 0.0 | 0.5 | GO:0038132 | neuregulin binding(GO:0038132) |
| 0.0 | 0.2 | GO:0004679 | AMP-activated protein kinase activity(GO:0004679) |
| 0.0 | 1.4 | GO:0001637 | G-protein coupled chemoattractant receptor activity(GO:0001637) chemokine receptor activity(GO:0004950) |
| 0.0 | 0.2 | GO:0035529 | NADH pyrophosphatase activity(GO:0035529) |
| 0.0 | 0.2 | GO:0005483 | soluble NSF attachment protein activity(GO:0005483) |
| 0.0 | 0.3 | GO:0004741 | [pyruvate dehydrogenase (lipoamide)] phosphatase activity(GO:0004741) |
| 0.0 | 0.1 | GO:0008269 | JAK pathway signal transduction adaptor activity(GO:0008269) |
| 0.0 | 0.4 | GO:0016004 | phospholipase activator activity(GO:0016004) |
| 0.0 | 1.2 | GO:0017049 | GTP-Rho binding(GO:0017049) |
| 0.0 | 0.5 | GO:0003810 | protein-glutamine gamma-glutamyltransferase activity(GO:0003810) |
| 0.0 | 1.7 | GO:0017075 | syntaxin-1 binding(GO:0017075) |
| 0.0 | 0.8 | GO:0034452 | dynactin binding(GO:0034452) |
| 0.0 | 0.2 | GO:0072590 | N-acetyl-L-aspartate-L-glutamate ligase activity(GO:0072590) |
| 0.0 | 1.6 | GO:0016922 | ligand-dependent nuclear receptor binding(GO:0016922) |
| 0.0 | 1.2 | GO:0031434 | mitogen-activated protein kinase kinase binding(GO:0031434) |
| 0.0 | 0.1 | GO:0090555 | phosphatidylethanolamine-translocating ATPase activity(GO:0090555) |
| 0.0 | 1.2 | GO:0070006 | metalloaminopeptidase activity(GO:0070006) |
| 0.0 | 0.1 | GO:1990190 | peptide-glutamate-N-acetyltransferase activity(GO:1990190) |
| 0.0 | 1.1 | GO:0045505 | dynein intermediate chain binding(GO:0045505) |
| 0.0 | 0.2 | GO:0008955 | peptidoglycan glycosyltransferase activity(GO:0008955) |
| 0.0 | 0.2 | GO:0016971 | flavin-linked sulfhydryl oxidase activity(GO:0016971) |
| 0.0 | 0.7 | GO:0047372 | acylglycerol lipase activity(GO:0047372) |
| 0.0 | 0.2 | GO:0003943 | N-acetylgalactosamine-4-sulfatase activity(GO:0003943) |
| 0.0 | 0.2 | GO:0050508 | glucuronosyl-N-acetylglucosaminyl-proteoglycan 4-alpha-N-acetylglucosaminyltransferase activity(GO:0050508) |
| 0.0 | 0.3 | GO:0033743 | peptide-methionine (R)-S-oxide reductase activity(GO:0033743) |
| 0.0 | 3.0 | GO:0005070 | SH3/SH2 adaptor activity(GO:0005070) |
| 0.0 | 0.3 | GO:0035612 | AP-2 adaptor complex binding(GO:0035612) |
| 0.0 | 1.1 | GO:0008510 | sodium:bicarbonate symporter activity(GO:0008510) |
| 0.0 | 7.4 | GO:0002020 | protease binding(GO:0002020) |
| 0.0 | 0.4 | GO:1903136 | cuprous ion binding(GO:1903136) |
| 0.0 | 0.1 | GO:0047025 | 3-oxoacyl-[acyl-carrier-protein] reductase (NADH) activity(GO:0047025) |
| 0.0 | 0.1 | GO:0032093 | SAM domain binding(GO:0032093) |
| 0.0 | 0.6 | GO:0005123 | death receptor binding(GO:0005123) |
| 0.0 | 3.3 | GO:0005544 | calcium-dependent phospholipid binding(GO:0005544) |
| 0.0 | 0.2 | GO:0004597 | peptide-aspartate beta-dioxygenase activity(GO:0004597) |
| 0.0 | 0.6 | GO:0042609 | CD4 receptor binding(GO:0042609) |
| 0.0 | 0.2 | GO:0045485 | omega-6 fatty acid desaturase activity(GO:0045485) |
| 0.0 | 0.1 | GO:0051499 | D-aminoacyl-tRNA deacylase activity(GO:0051499) D-tyrosyl-tRNA(Tyr) deacylase activity(GO:0051500) |
| 0.0 | 0.2 | GO:0035500 | MH2 domain binding(GO:0035500) |
| 0.0 | 0.2 | GO:0004594 | pantothenate kinase activity(GO:0004594) |
| 0.0 | 0.1 | GO:0098770 | FBXO family protein binding(GO:0098770) |
| 0.0 | 0.3 | GO:0017040 | ceramidase activity(GO:0017040) |
| 0.0 | 0.1 | GO:0004346 | glucose-6-phosphatase activity(GO:0004346) sugar-terminal-phosphatase activity(GO:0050309) |
| 0.0 | 3.7 | GO:0002039 | p53 binding(GO:0002039) |
| 0.0 | 0.1 | GO:0042282 | hydroxymethylglutaryl-CoA reductase (NADPH) activity(GO:0004420) hydroxymethylglutaryl-CoA reductase activity(GO:0042282) |
| 0.0 | 0.2 | GO:0000155 | phosphorelay sensor kinase activity(GO:0000155) |
| 0.0 | 1.0 | GO:0070182 | DNA polymerase binding(GO:0070182) |
| 0.0 | 0.1 | GO:0042806 | fucose binding(GO:0042806) |
| 0.0 | 5.0 | GO:1901981 | phosphatidylinositol phosphate binding(GO:1901981) |
| 0.0 | 0.3 | GO:0016679 | ubiquinol-cytochrome-c reductase activity(GO:0008121) oxidoreductase activity, acting on diphenols and related substances as donors(GO:0016679) oxidoreductase activity, acting on diphenols and related substances as donors, cytochrome as acceptor(GO:0016681) |
| 0.0 | 0.5 | GO:0004708 | MAP kinase kinase activity(GO:0004708) |
| 0.0 | 0.2 | GO:0048101 | calcium- and calmodulin-regulated 3',5'-cyclic-GMP phosphodiesterase activity(GO:0048101) |
| 0.0 | 1.0 | GO:0001011 | transcription factor activity, sequence-specific DNA binding, RNA polymerase recruiting(GO:0001011) transcription factor activity, TFIIB-class binding(GO:0001087) |
| 0.0 | 2.2 | GO:0017112 | Rab guanyl-nucleotide exchange factor activity(GO:0017112) |
| 0.0 | 0.5 | GO:0016634 | oxidoreductase activity, acting on the CH-CH group of donors, oxygen as acceptor(GO:0016634) |
| 0.0 | 0.1 | GO:0004967 | glucagon receptor activity(GO:0004967) |
| 0.0 | 1.4 | GO:0004364 | glutathione transferase activity(GO:0004364) |
| 0.0 | 0.3 | GO:0005004 | GPI-linked ephrin receptor activity(GO:0005004) |
| 0.0 | 0.1 | GO:0031996 | thioesterase binding(GO:0031996) |
| 0.0 | 0.1 | GO:0016213 | linoleoyl-CoA desaturase activity(GO:0016213) |
| 0.0 | 0.2 | GO:0035368 | selenocysteine insertion sequence binding(GO:0035368) |
| 0.0 | 2.0 | GO:0019003 | GDP binding(GO:0019003) |
| 0.0 | 0.1 | GO:0008476 | protein-tyrosine sulfotransferase activity(GO:0008476) |
| 0.0 | 0.1 | GO:0050146 | nucleoside phosphotransferase activity(GO:0050146) |
| 0.0 | 0.1 | GO:0004357 | glutamate-cysteine ligase activity(GO:0004357) |
| 0.0 | 0.5 | GO:0017070 | U6 snRNA binding(GO:0017070) |
| 0.0 | 1.4 | GO:0005158 | insulin receptor binding(GO:0005158) |
| 0.0 | 0.6 | GO:0008349 | MAP kinase kinase kinase kinase activity(GO:0008349) |
| 0.0 | 0.2 | GO:0030215 | semaphorin receptor binding(GO:0030215) |
| 0.0 | 0.3 | GO:0004340 | glucokinase activity(GO:0004340) hexokinase activity(GO:0004396) fructokinase activity(GO:0008865) mannokinase activity(GO:0019158) |
| 0.0 | 0.1 | GO:0051425 | PTB domain binding(GO:0051425) |
| 0.0 | 1.1 | GO:0015347 | sodium-independent organic anion transmembrane transporter activity(GO:0015347) |
| 0.0 | 0.3 | GO:0016312 | inositol bisphosphate phosphatase activity(GO:0016312) |
| 0.0 | 5.4 | GO:0017124 | SH3 domain binding(GO:0017124) |
| 0.0 | 0.4 | GO:0022851 | GABA-gated chloride ion channel activity(GO:0022851) |
| 0.0 | 8.2 | GO:0003924 | GTPase activity(GO:0003924) |
| 0.0 | 0.2 | GO:0008035 | high-density lipoprotein particle binding(GO:0008035) |
| 0.0 | 0.1 | GO:0070573 | metallodipeptidase activity(GO:0070573) |
| 0.0 | 0.1 | GO:0004418 | hydroxymethylbilane synthase activity(GO:0004418) |
| 0.0 | 0.4 | GO:0042169 | SH2 domain binding(GO:0042169) |
| 0.0 | 0.1 | GO:0042030 | ATPase inhibitor activity(GO:0042030) |
| 0.0 | 0.1 | GO:0052798 | beta-galactoside alpha-2,3-sialyltransferase activity(GO:0052798) |
| 0.0 | 0.8 | GO:0015002 | cytochrome-c oxidase activity(GO:0004129) heme-copper terminal oxidase activity(GO:0015002) oxidoreductase activity, acting on a heme group of donors, oxygen as acceptor(GO:0016676) |
| 0.0 | 0.2 | GO:0000403 | Y-form DNA binding(GO:0000403) |
| 0.0 | 1.1 | GO:0030276 | clathrin binding(GO:0030276) |
| 0.0 | 0.4 | GO:0017017 | MAP kinase tyrosine/serine/threonine phosphatase activity(GO:0017017) |
| 0.0 | 0.4 | GO:0001730 | 2'-5'-oligoadenylate synthetase activity(GO:0001730) |
| 0.0 | 0.4 | GO:0016888 | endodeoxyribonuclease activity, producing 5'-phosphomonoesters(GO:0016888) |
| 0.0 | 1.0 | GO:0008327 | methyl-CpG binding(GO:0008327) |
| 0.0 | 0.8 | GO:0004435 | phosphatidylinositol phospholipase C activity(GO:0004435) |
| 0.0 | 0.6 | GO:0046875 | ephrin receptor binding(GO:0046875) |
| 0.0 | 0.7 | GO:0004190 | aspartic-type endopeptidase activity(GO:0004190) |
| 0.0 | 0.6 | GO:0004012 | phospholipid-translocating ATPase activity(GO:0004012) |
| 0.0 | 0.2 | GO:0033857 | diphosphoinositol-pentakisphosphate kinase activity(GO:0033857) |
| 0.0 | 0.4 | GO:0005225 | volume-sensitive anion channel activity(GO:0005225) |
| 0.0 | 0.2 | GO:0031681 | G-protein beta-subunit binding(GO:0031681) |
| 0.0 | 0.1 | GO:0008746 | NAD(P)+ transhydrogenase activity(GO:0008746) oxidoreductase activity, acting on NAD(P)H, NAD(P) as acceptor(GO:0016652) |
| 0.0 | 0.1 | GO:0043426 | MRF binding(GO:0043426) |
| 0.0 | 0.8 | GO:0000993 | RNA polymerase II core binding(GO:0000993) |
| 0.0 | 0.1 | GO:0045159 | myosin II binding(GO:0045159) |
| 0.0 | 0.4 | GO:0004089 | carbonate dehydratase activity(GO:0004089) |
| 0.0 | 8.6 | GO:0005096 | GTPase activator activity(GO:0005096) |
| 0.0 | 0.0 | GO:0035033 | histone deacetylase regulator activity(GO:0035033) |
| 0.0 | 0.3 | GO:0022889 | L-serine transmembrane transporter activity(GO:0015194) serine transmembrane transporter activity(GO:0022889) |
| 0.0 | 2.6 | GO:0033613 | activating transcription factor binding(GO:0033613) |
| 0.0 | 0.1 | GO:0004966 | galanin receptor activity(GO:0004966) |
| 0.0 | 0.3 | GO:0000774 | adenyl-nucleotide exchange factor activity(GO:0000774) |
| 0.0 | 0.2 | GO:0043024 | ribosomal small subunit binding(GO:0043024) |
| 0.0 | 0.3 | GO:0098599 | palmitoyl-(protein) hydrolase activity(GO:0008474) palmitoyl hydrolase activity(GO:0098599) |
| 0.0 | 0.1 | GO:0004994 | somatostatin receptor activity(GO:0004994) |
| 0.0 | 0.2 | GO:0017034 | Rap guanyl-nucleotide exchange factor activity(GO:0017034) |
| 0.0 | 0.5 | GO:0016864 | protein disulfide isomerase activity(GO:0003756) intramolecular oxidoreductase activity, transposing S-S bonds(GO:0016864) |
| 0.0 | 1.0 | GO:0070412 | R-SMAD binding(GO:0070412) |
| 0.0 | 0.5 | GO:0004000 | adenosine deaminase activity(GO:0004000) |
| 0.0 | 0.2 | GO:0030280 | structural constituent of epidermis(GO:0030280) |
| 0.0 | 0.1 | GO:0003963 | RNA-3'-phosphate cyclase activity(GO:0003963) |
| 0.0 | 0.2 | GO:0003746 | translation elongation factor activity(GO:0003746) |
| 0.0 | 0.4 | GO:0043539 | protein serine/threonine kinase activator activity(GO:0043539) |
| 0.0 | 0.2 | GO:0022850 | serotonin-gated cation channel activity(GO:0022850) |
| 0.0 | 0.2 | GO:0003831 | beta-N-acetylglucosaminylglycopeptide beta-1,4-galactosyltransferase activity(GO:0003831) |
| 0.0 | 0.6 | GO:0043027 | cysteine-type endopeptidase inhibitor activity involved in apoptotic process(GO:0043027) |
| 0.0 | 0.1 | GO:0016413 | O-acetyltransferase activity(GO:0016413) |
| 0.0 | 0.1 | GO:0004392 | heme oxygenase (decyclizing) activity(GO:0004392) |
| 0.0 | 0.5 | GO:0031492 | nucleosomal DNA binding(GO:0031492) |
| 0.0 | 0.2 | GO:0015277 | kainate selective glutamate receptor activity(GO:0015277) |
| 0.0 | 0.2 | GO:0050682 | AF-2 domain binding(GO:0050682) |
| 0.0 | 0.1 | GO:0001888 | glucuronyl-galactosyl-proteoglycan 4-alpha-N-acetylglucosaminyltransferase activity(GO:0001888) |
| 0.0 | 0.2 | GO:0042296 | ISG15 transferase activity(GO:0042296) |
| 0.0 | 0.1 | GO:0004784 | superoxide dismutase activity(GO:0004784) oxidoreductase activity, acting on superoxide radicals as acceptor(GO:0016721) |
| 0.0 | 0.1 | GO:0008429 | phosphatidylethanolamine binding(GO:0008429) |
| 0.0 | 2.0 | GO:0005089 | Rho guanyl-nucleotide exchange factor activity(GO:0005089) |
| 0.0 | 0.3 | GO:0005176 | ErbB-2 class receptor binding(GO:0005176) |
| 0.0 | 0.2 | GO:0004957 | prostaglandin E receptor activity(GO:0004957) |
| 0.0 | 0.1 | GO:0005011 | macrophage colony-stimulating factor receptor activity(GO:0005011) |
| 0.0 | 0.1 | GO:0045131 | pre-mRNA branch point binding(GO:0045131) |
| 0.0 | 0.3 | GO:0022842 | leak channel activity(GO:0022840) narrow pore channel activity(GO:0022842) |
| 0.0 | 0.6 | GO:0030544 | Hsp70 protein binding(GO:0030544) |
| 0.0 | 0.2 | GO:0097200 | cysteine-type endopeptidase activity involved in execution phase of apoptosis(GO:0097200) |
| 0.0 | 0.0 | GO:0097371 | MDM2/MDM4 family protein binding(GO:0097371) |
| 0.0 | 0.2 | GO:0005095 | GTPase inhibitor activity(GO:0005095) |
| 0.0 | 0.1 | GO:0015279 | store-operated calcium channel activity(GO:0015279) |
| 0.0 | 0.1 | GO:0097108 | hedgehog family protein binding(GO:0097108) |
| 0.0 | 0.1 | GO:0005052 | peroxisome matrix targeting signal-1 binding(GO:0005052) |
| 0.0 | 0.2 | GO:0035312 | 5'-3' exodeoxyribonuclease activity(GO:0035312) |
| 0.0 | 0.1 | GO:0016934 | extracellular-glycine-gated ion channel activity(GO:0016933) extracellular-glycine-gated chloride channel activity(GO:0016934) |
| 0.0 | 0.5 | GO:0016538 | cyclin-dependent protein serine/threonine kinase regulator activity(GO:0016538) |
| 0.0 | 0.3 | GO:0098641 | cadherin binding involved in cell-cell adhesion(GO:0098641) |
| 0.0 | 0.2 | GO:0003836 | beta-galactoside (CMP) alpha-2,3-sialyltransferase activity(GO:0003836) |
| 0.0 | 0.1 | GO:0061665 | SUMO ligase activity(GO:0061665) |
| 0.0 | 0.2 | GO:0038064 | protein tyrosine kinase collagen receptor activity(GO:0038062) collagen receptor activity(GO:0038064) |
| 0.0 | 0.2 | GO:0016290 | palmitoyl-CoA hydrolase activity(GO:0016290) |
| 0.0 | 0.2 | GO:0008195 | phosphatidate phosphatase activity(GO:0008195) |
| 0.0 | 0.1 | GO:0032052 | bile acid binding(GO:0032052) |
| 0.0 | 0.1 | GO:0005280 | hydrogen:amino acid symporter activity(GO:0005280) |
| 0.0 | 0.1 | GO:0015204 | urea transmembrane transporter activity(GO:0015204) |
| 0.0 | 0.1 | GO:0005548 | phospholipid transporter activity(GO:0005548) |
| 0.0 | 0.4 | GO:0004033 | aldo-keto reductase (NADP) activity(GO:0004033) |
| 0.0 | 0.2 | GO:0050291 | sphingosine N-acyltransferase activity(GO:0050291) |
| 0.0 | 0.5 | GO:0000149 | SNARE binding(GO:0000149) |
| 0.0 | 0.7 | GO:0004693 | cyclin-dependent protein serine/threonine kinase activity(GO:0004693) |
Gene overrepresentation in curated gene sets: canonical pathways category:
| Log-likelihood per target | Total log-likelihood | Term | Description |
|---|---|---|---|
| 0.4 | 0.4 | ST GRANULE CELL SURVIVAL PATHWAY | Granule Cell Survival Pathway is a specific case of more general PAC1 Receptor Pathway. |
| 0.2 | 10.4 | PID IL8 CXCR2 PATHWAY | IL8- and CXCR2-mediated signaling events |
| 0.2 | 2.9 | SA G2 AND M PHASES | Cdc25 activates the cdc2/cyclin B complex to induce the G2/M transition. |
| 0.2 | 5.8 | PID S1P S1P4 PATHWAY | S1P4 pathway |
| 0.2 | 24.3 | PID IL4 2PATHWAY | IL4-mediated signaling events |
| 0.2 | 5.2 | SA G1 AND S PHASES | Cdk2, 4, and 6 bind cyclin D in G1, while cdk2/cyclin E promotes the G1/S transition. |
| 0.2 | 10.0 | PID CXCR3 PATHWAY | CXCR3-mediated signaling events |
| 0.2 | 1.0 | PID EPHA2 FWD PATHWAY | EPHA2 forward signaling |
| 0.2 | 2.6 | SA B CELL RECEPTOR COMPLEXES | Antigen binding to B cell receptors activates protein tyrosine kinases, such as the Src family, which ultimate activate MAP kinases. |
| 0.1 | 9.4 | ST PHOSPHOINOSITIDE 3 KINASE PATHWAY | PI3K Pathway |
| 0.1 | 6.4 | SA MMP CYTOKINE CONNECTION | Cytokines can induce activation of matrix metalloproteinases, which degrade extracellular matrix. |
| 0.1 | 0.7 | PID TCR RAS PATHWAY | Ras signaling in the CD4+ TCR pathway |
| 0.1 | 5.7 | SA CASPASE CASCADE | Apoptosis is mediated by caspases, cysteine proteases arranged in a proteolytic cascade. |
| 0.1 | 1.6 | PID HIF1A PATHWAY | Hypoxic and oxygen homeostasis regulation of HIF-1-alpha |
| 0.1 | 0.4 | PID TCR JNK PATHWAY | JNK signaling in the CD4+ TCR pathway |
| 0.1 | 8.2 | PID PI3KCI PATHWAY | Class I PI3K signaling events |
| 0.1 | 1.3 | PID IL5 PATHWAY | IL5-mediated signaling events |
| 0.1 | 3.2 | PID TCR PATHWAY | TCR signaling in naïve CD4+ T cells |
| 0.1 | 1.8 | PID LYMPH ANGIOGENESIS PATHWAY | VEGFR3 signaling in lymphatic endothelium |
| 0.1 | 7.7 | PID CD8 TCR PATHWAY | TCR signaling in naïve CD8+ T cells |
| 0.1 | 1.2 | PID S1P S1P3 PATHWAY | S1P3 pathway |
| 0.1 | 16.6 | PID PDGFRB PATHWAY | PDGFR-beta signaling pathway |
| 0.1 | 3.4 | PID INTEGRIN A9B1 PATHWAY | Alpha9 beta1 integrin signaling events |
| 0.1 | 0.1 | PID VEGFR1 PATHWAY | VEGFR1 specific signals |
| 0.1 | 2.9 | PID BCR 5PATHWAY | BCR signaling pathway |
| 0.1 | 4.4 | PID HIF2PATHWAY | HIF-2-alpha transcription factor network |
| 0.1 | 2.8 | PID TOLL ENDOGENOUS PATHWAY | Endogenous TLR signaling |
| 0.1 | 2.8 | PID PI3K PLC TRK PATHWAY | Trk receptor signaling mediated by PI3K and PLC-gamma |
| 0.1 | 1.6 | PID IL2 STAT5 PATHWAY | IL2 signaling events mediated by STAT5 |
| 0.1 | 2.8 | PID KIT PATHWAY | Signaling events mediated by Stem cell factor receptor (c-Kit) |
| 0.1 | 1.4 | PID ANTHRAX PATHWAY | Cellular roles of Anthrax toxin |
| 0.1 | 1.0 | PID P38 MKK3 6PATHWAY | p38 MAPK signaling pathway |
| 0.1 | 1.2 | SA PROGRAMMED CELL DEATH | Programmed cell death, or apoptosis, eliminates damaged or unneeded cells. |
| 0.1 | 3.3 | PID CD8 TCR DOWNSTREAM PATHWAY | Downstream signaling in naïve CD8+ T cells |
| 0.1 | 1.7 | PID FCER1 PATHWAY | Fc-epsilon receptor I signaling in mast cells |
| 0.1 | 0.1 | PID INTEGRIN5 PATHWAY | Beta5 beta6 beta7 and beta8 integrin cell surface interactions |
| 0.1 | 2.1 | ST JNK MAPK PATHWAY | JNK MAPK Pathway |
| 0.1 | 2.8 | ST GA12 PATHWAY | G alpha 12 Pathway |
| 0.1 | 1.3 | SIG BCR SIGNALING PATHWAY | Members of the BCR signaling pathway |
| 0.1 | 0.3 | PID IL2 PI3K PATHWAY | IL2 signaling events mediated by PI3K |
| 0.1 | 3.0 | PID CXCR4 PATHWAY | CXCR4-mediated signaling events |
| 0.1 | 1.3 | PID NETRIN PATHWAY | Netrin-mediated signaling events |
| 0.0 | 0.4 | PID TRAIL PATHWAY | TRAIL signaling pathway |
| 0.0 | 0.7 | PID EPHB FWD PATHWAY | EPHB forward signaling |
| 0.0 | 1.9 | PID ALK1 PATHWAY | ALK1 signaling events |
| 0.0 | 2.9 | PID RAC1 REG PATHWAY | Regulation of RAC1 activity |
| 0.0 | 0.9 | PID GMCSF PATHWAY | GMCSF-mediated signaling events |
| 0.0 | 0.4 | PID VEGF VEGFR PATHWAY | VEGF and VEGFR signaling network |
| 0.0 | 2.2 | PID TNF PATHWAY | TNF receptor signaling pathway |
| 0.0 | 1.1 | PID IL23 PATHWAY | IL23-mediated signaling events |
| 0.0 | 4.1 | PID HDAC CLASSII PATHWAY | Signaling events mediated by HDAC Class II |
| 0.0 | 3.9 | PID CDC42 REG PATHWAY | Regulation of CDC42 activity |
| 0.0 | 1.4 | PID CONE PATHWAY | Visual signal transduction: Cones |
| 0.0 | 1.1 | PID IL6 7 PATHWAY | IL6-mediated signaling events |
| 0.0 | 0.8 | PID IL12 2PATHWAY | IL12-mediated signaling events |
| 0.0 | 0.6 | PID INTEGRIN CS PATHWAY | Integrin family cell surface interactions |
| 0.0 | 2.6 | PID AURORA B PATHWAY | Aurora B signaling |
| 0.0 | 2.1 | PID NFAT TFPATHWAY | Calcineurin-regulated NFAT-dependent transcription in lymphocytes |
| 0.0 | 3.0 | PID ILK PATHWAY | Integrin-linked kinase signaling |
| 0.0 | 0.6 | PID EPHA FWDPATHWAY | EPHA forward signaling |
| 0.0 | 0.2 | PID HIV NEF PATHWAY | HIV-1 Nef: Negative effector of Fas and TNF-alpha |
| 0.0 | 0.6 | PID EPHRINB REV PATHWAY | Ephrin B reverse signaling |
| 0.0 | 2.5 | PID NOTCH PATHWAY | Notch signaling pathway |
| 0.0 | 2.2 | PID DELTA NP63 PATHWAY | Validated transcriptional targets of deltaNp63 isoforms |
| 0.0 | 0.5 | ST TUMOR NECROSIS FACTOR PATHWAY | Tumor Necrosis Factor Pathway. |
| 0.0 | 2.1 | PID P53 REGULATION PATHWAY | p53 pathway |
| 0.0 | 0.4 | PID IL2 1PATHWAY | IL2-mediated signaling events |
| 0.0 | 1.0 | PID NFAT 3PATHWAY | Role of Calcineurin-dependent NFAT signaling in lymphocytes |
| 0.0 | 0.7 | PID SYNDECAN 2 PATHWAY | Syndecan-2-mediated signaling events |
| 0.0 | 0.7 | PID ER NONGENOMIC PATHWAY | Plasma membrane estrogen receptor signaling |
| 0.0 | 0.5 | PID WNT CANONICAL PATHWAY | Canonical Wnt signaling pathway |
| 0.0 | 0.5 | PID ERBB1 DOWNSTREAM PATHWAY | ErbB1 downstream signaling |
| 0.0 | 0.6 | PID RETINOIC ACID PATHWAY | Retinoic acid receptors-mediated signaling |
| 0.0 | 0.5 | PID INTEGRIN A4B1 PATHWAY | Alpha4 beta1 integrin signaling events |
| 0.0 | 0.1 | PID AVB3 OPN PATHWAY | Osteopontin-mediated events |
| 0.0 | 1.3 | PID TGFBR PATHWAY | TGF-beta receptor signaling |
| 0.0 | 0.3 | PID MAPK TRK PATHWAY | Trk receptor signaling mediated by the MAPK pathway |
| 0.0 | 0.7 | PID RAS PATHWAY | Regulation of Ras family activation |
| 0.0 | 0.4 | PID THROMBIN PAR1 PATHWAY | PAR1-mediated thrombin signaling events |
| 0.0 | 0.8 | PID INTEGRIN2 PATHWAY | Beta2 integrin cell surface interactions |
| 0.0 | 0.4 | PID CERAMIDE PATHWAY | Ceramide signaling pathway |
| 0.0 | 0.3 | PID MYC PATHWAY | C-MYC pathway |
| 0.0 | 0.3 | PID PS1 PATHWAY | Presenilin action in Notch and Wnt signaling |
| 0.0 | 0.5 | PID VEGFR1 2 PATHWAY | Signaling events mediated by VEGFR1 and VEGFR2 |
| 0.0 | 3.7 | NABA ECM AFFILIATED | Genes encoding proteins affiliated structurally or functionally to extracellular matrix proteins |
| 0.0 | 0.3 | PID RHODOPSIN PATHWAY | Visual signal transduction: Rods |
| 0.0 | 0.7 | PID PLK1 PATHWAY | PLK1 signaling events |
| 0.0 | 0.2 | PID ERBB4 PATHWAY | ErbB4 signaling events |
| 0.0 | 0.1 | ST DIFFERENTIATION PATHWAY IN PC12 CELLS | Differentiation Pathway in PC12 Cells; this is a specific case of PAC1 Receptor Pathway. |
| 0.0 | 0.1 | PID SYNDECAN 4 PATHWAY | Syndecan-4-mediated signaling events |
| 0.0 | 0.5 | PID AR TF PATHWAY | Regulation of Androgen receptor activity |
| 0.0 | 0.1 | PID AMB2 NEUTROPHILS PATHWAY | amb2 Integrin signaling |
| 0.0 | 0.1 | ST GA13 PATHWAY | G alpha 13 Pathway |
Gene overrepresentation in curated gene sets: REACTOME pathways category:
| Log-likelihood per target | Total log-likelihood | Term | Description |
|---|---|---|---|
| 0.3 | 10.3 | REACTOME SIGNAL REGULATORY PROTEIN SIRP FAMILY INTERACTIONS | Genes involved in Signal regulatory protein (SIRP) family interactions |
| 0.2 | 2.5 | REACTOME CD28 DEPENDENT VAV1 PATHWAY | Genes involved in CD28 dependent Vav1 pathway |
| 0.2 | 7.5 | REACTOME SEMA3A PAK DEPENDENT AXON REPULSION | Genes involved in Sema3A PAK dependent Axon repulsion |
| 0.2 | 5.6 | REACTOME TGF BETA RECEPTOR SIGNALING IN EMT EPITHELIAL TO MESENCHYMAL TRANSITION | Genes involved in TGF-beta receptor signaling in EMT (epithelial to mesenchymal transition) |
| 0.1 | 1.6 | REACTOME ENDOSOMAL VACUOLAR PATHWAY | Genes involved in Endosomal/Vacuolar pathway |
| 0.1 | 2.3 | REACTOME PLATELET ADHESION TO EXPOSED COLLAGEN | Genes involved in Platelet Adhesion to exposed collagen |
| 0.1 | 0.8 | REACTOME BINDING AND ENTRY OF HIV VIRION | Genes involved in Binding and entry of HIV virion |
| 0.1 | 4.5 | REACTOME NUCLEOTIDE LIKE PURINERGIC RECEPTORS | Genes involved in Nucleotide-like (purinergic) receptors |
| 0.1 | 2.3 | REACTOME THE NLRP3 INFLAMMASOME | Genes involved in The NLRP3 inflammasome |
| 0.1 | 2.5 | REACTOME ROLE OF DCC IN REGULATING APOPTOSIS | Genes involved in Role of DCC in regulating apoptosis |
| 0.1 | 2.9 | REACTOME ACYL CHAIN REMODELLING OF PI | Genes involved in Acyl chain remodelling of PI |
| 0.1 | 6.0 | REACTOME SIGNAL AMPLIFICATION | Genes involved in Signal amplification |
| 0.1 | 2.6 | REACTOME REGULATION OF IFNG SIGNALING | Genes involved in Regulation of IFNG signaling |
| 0.1 | 2.2 | REACTOME PYRIMIDINE CATABOLISM | Genes involved in Pyrimidine catabolism |
| 0.1 | 2.8 | REACTOME PD1 SIGNALING | Genes involved in PD-1 signaling |
| 0.1 | 3.3 | REACTOME PROTEOLYTIC CLEAVAGE OF SNARE COMPLEX PROTEINS | Genes involved in Proteolytic cleavage of SNARE complex proteins |
| 0.1 | 0.9 | REACTOME ACYL CHAIN REMODELLING OF PG | Genes involved in Acyl chain remodelling of PG |
| 0.1 | 5.9 | REACTOME RAP1 SIGNALLING | Genes involved in Rap1 signalling |
| 0.1 | 11.0 | REACTOME IMMUNOREGULATORY INTERACTIONS BETWEEN A LYMPHOID AND A NON LYMPHOID CELL | Genes involved in Immunoregulatory interactions between a Lymphoid and a non-Lymphoid cell |
| 0.1 | 3.7 | REACTOME PRE NOTCH PROCESSING IN GOLGI | Genes involved in Pre-NOTCH Processing in Golgi |
| 0.1 | 0.3 | REACTOME CELL CELL COMMUNICATION | Genes involved in Cell-Cell communication |
| 0.1 | 1.7 | REACTOME CTNNB1 PHOSPHORYLATION CASCADE | Genes involved in Beta-catenin phosphorylation cascade |
| 0.1 | 2.6 | REACTOME HYALURONAN UPTAKE AND DEGRADATION | Genes involved in Hyaluronan uptake and degradation |
| 0.1 | 4.8 | REACTOME INTRINSIC PATHWAY FOR APOPTOSIS | Genes involved in Intrinsic Pathway for Apoptosis |
| 0.1 | 1.3 | REACTOME REGULATION OF KIT SIGNALING | Genes involved in Regulation of KIT signaling |
| 0.1 | 2.8 | REACTOME OTHER SEMAPHORIN INTERACTIONS | Genes involved in Other semaphorin interactions |
| 0.1 | 1.5 | REACTOME DAG AND IP3 SIGNALING | Genes involved in DAG and IP3 signaling |
| 0.1 | 7.2 | REACTOME CHEMOKINE RECEPTORS BIND CHEMOKINES | Genes involved in Chemokine receptors bind chemokines |
| 0.1 | 0.5 | REACTOME HYALURONAN METABOLISM | Genes involved in Hyaluronan metabolism |
| 0.1 | 2.5 | REACTOME PURINE SALVAGE | Genes involved in Purine salvage |
| 0.1 | 2.7 | REACTOME REGULATION OF WATER BALANCE BY RENAL AQUAPORINS | Genes involved in Regulation of Water Balance by Renal Aquaporins |
| 0.1 | 1.5 | REACTOME INFLAMMASOMES | Genes involved in Inflammasomes |
| 0.1 | 0.4 | REACTOME RETROGRADE NEUROTROPHIN SIGNALLING | Genes involved in Retrograde neurotrophin signalling |
| 0.1 | 3.7 | REACTOME TERMINATION OF O GLYCAN BIOSYNTHESIS | Genes involved in Termination of O-glycan biosynthesis |
| 0.1 | 2.3 | REACTOME PLATELET SENSITIZATION BY LDL | Genes involved in Platelet sensitization by LDL |
| 0.1 | 0.8 | REACTOME TETRAHYDROBIOPTERIN BH4 SYNTHESIS RECYCLING SALVAGE AND REGULATION | Genes involved in Tetrahydrobiopterin (BH4) synthesis, recycling, salvage and regulation |
| 0.1 | 4.5 | REACTOME GPVI MEDIATED ACTIVATION CASCADE | Genes involved in GPVI-mediated activation cascade |
| 0.1 | 0.4 | REACTOME TRANSFERRIN ENDOCYTOSIS AND RECYCLING | Genes involved in Transferrin endocytosis and recycling |
| 0.1 | 2.1 | REACTOME LYSOSOME VESICLE BIOGENESIS | Genes involved in Lysosome Vesicle Biogenesis |
| 0.1 | 1.6 | REACTOME REGULATION OF IFNA SIGNALING | Genes involved in Regulation of IFNA signaling |
| 0.1 | 0.4 | REACTOME REGULATION OF SIGNALING BY CBL | Genes involved in Regulation of signaling by CBL |
| 0.1 | 1.4 | REACTOME SPRY REGULATION OF FGF SIGNALING | Genes involved in Spry regulation of FGF signaling |
| 0.1 | 0.7 | REACTOME APOBEC3G MEDIATED RESISTANCE TO HIV1 INFECTION | Genes involved in APOBEC3G mediated resistance to HIV-1 infection |
| 0.1 | 3.9 | REACTOME O LINKED GLYCOSYLATION OF MUCINS | Genes involved in O-linked glycosylation of mucins |
| 0.1 | 2.1 | REACTOME HS GAG BIOSYNTHESIS | Genes involved in HS-GAG biosynthesis |
| 0.1 | 0.7 | REACTOME SOS MEDIATED SIGNALLING | Genes involved in SOS-mediated signalling |
| 0.1 | 2.3 | REACTOME THE ROLE OF NEF IN HIV1 REPLICATION AND DISEASE PATHOGENESIS | Genes involved in The role of Nef in HIV-1 replication and disease pathogenesis |
| 0.1 | 3.9 | REACTOME LATENT INFECTION OF HOMO SAPIENS WITH MYCOBACTERIUM TUBERCULOSIS | Genes involved in Latent infection of Homo sapiens with Mycobacterium tuberculosis |
| 0.1 | 4.5 | REACTOME RECYCLING PATHWAY OF L1 | Genes involved in Recycling pathway of L1 |
| 0.1 | 3.5 | REACTOME SPHINGOLIPID DE NOVO BIOSYNTHESIS | Genes involved in Sphingolipid de novo biosynthesis |
| 0.1 | 0.3 | REACTOME CYCLIN E ASSOCIATED EVENTS DURING G1 S TRANSITION | Genes involved in Cyclin E associated events during G1/S transition |
| 0.1 | 2.2 | REACTOME IL RECEPTOR SHC SIGNALING | Genes involved in Interleukin receptor SHC signaling |
| 0.1 | 3.0 | REACTOME DOWNREGULATION OF TGF BETA RECEPTOR SIGNALING | Genes involved in Downregulation of TGF-beta receptor signaling |
| 0.1 | 1.2 | REACTOME ACTIVATION OF THE AP1 FAMILY OF TRANSCRIPTION FACTORS | Genes involved in Activation of the AP-1 family of transcription factors |
| 0.1 | 1.0 | REACTOME PLATELET CALCIUM HOMEOSTASIS | Genes involved in Platelet calcium homeostasis |
| 0.1 | 0.1 | REACTOME ARMS MEDIATED ACTIVATION | Genes involved in ARMS-mediated activation |
| 0.1 | 2.1 | REACTOME ANTIGEN ACTIVATES B CELL RECEPTOR LEADING TO GENERATION OF SECOND MESSENGERS | Genes involved in Antigen Activates B Cell Receptor Leading to Generation of Second Messengers |
| 0.1 | 2.7 | REACTOME EFFECTS OF PIP2 HYDROLYSIS | Genes involved in Effects of PIP2 hydrolysis |
| 0.1 | 0.8 | REACTOME REGULATION OF INSULIN SECRETION BY GLUCAGON LIKE PEPTIDE1 | Genes involved in Regulation of Insulin Secretion by Glucagon-like Peptide-1 |
| 0.1 | 2.7 | REACTOME A TETRASACCHARIDE LINKER SEQUENCE IS REQUIRED FOR GAG SYNTHESIS | Genes involved in A tetrasaccharide linker sequence is required for GAG synthesis |
| 0.1 | 1.1 | REACTOME N GLYCAN TRIMMING IN THE ER AND CALNEXIN CALRETICULIN CYCLE | Genes involved in N-glycan trimming in the ER and Calnexin/Calreticulin cycle |
| 0.1 | 0.1 | REACTOME TRANSPORT OF MATURE MRNA DERIVED FROM AN INTRONLESS TRANSCRIPT | Genes involved in Transport of Mature mRNA Derived from an Intronless Transcript |
| 0.1 | 0.3 | REACTOME IL 2 SIGNALING | Genes involved in Interleukin-2 signaling |
| 0.1 | 1.3 | REACTOME NOREPINEPHRINE NEUROTRANSMITTER RELEASE CYCLE | Genes involved in Norepinephrine Neurotransmitter Release Cycle |
| 0.1 | 0.8 | REACTOME APOPTOSIS INDUCED DNA FRAGMENTATION | Genes involved in Apoptosis induced DNA fragmentation |
| 0.1 | 8.0 | REACTOME PEPTIDE CHAIN ELONGATION | Genes involved in Peptide chain elongation |
| 0.0 | 4.0 | REACTOME INTERFERON ALPHA BETA SIGNALING | Genes involved in Interferon alpha/beta signaling |
| 0.0 | 1.1 | REACTOME TRANSPORT OF ORGANIC ANIONS | Genes involved in Transport of organic anions |
| 0.0 | 2.2 | REACTOME GABA A RECEPTOR ACTIVATION | Genes involved in GABA A receptor activation |
| 0.0 | 2.3 | REACTOME NEGATIVE REGULATORS OF RIG I MDA5 SIGNALING | Genes involved in Negative regulators of RIG-I/MDA5 signaling |
| 0.0 | 0.1 | REACTOME ACETYLCHOLINE NEUROTRANSMITTER RELEASE CYCLE | Genes involved in Acetylcholine Neurotransmitter Release Cycle |
| 0.0 | 1.0 | REACTOME N GLYCAN ANTENNAE ELONGATION IN THE MEDIAL TRANS GOLGI | Genes involved in N-glycan antennae elongation in the medial/trans-Golgi |
| 0.0 | 2.0 | REACTOME G ALPHA Z SIGNALLING EVENTS | Genes involved in G alpha (z) signalling events |
| 0.0 | 0.8 | REACTOME TRAF6 MEDIATED INDUCTION OF TAK1 COMPLEX | Genes involved in TRAF6 mediated induction of TAK1 complex |
| 0.0 | 1.6 | REACTOME OXYGEN DEPENDENT PROLINE HYDROXYLATION OF HYPOXIA INDUCIBLE FACTOR ALPHA | Genes involved in Oxygen-dependent Proline Hydroxylation of Hypoxia-inducible Factor Alpha |
| 0.0 | 0.7 | REACTOME GABA SYNTHESIS RELEASE REUPTAKE AND DEGRADATION | Genes involved in GABA synthesis, release, reuptake and degradation |
| 0.0 | 0.7 | REACTOME GENERATION OF SECOND MESSENGER MOLECULES | Genes involved in Generation of second messenger molecules |
| 0.0 | 0.9 | REACTOME KERATAN SULFATE BIOSYNTHESIS | Genes involved in Keratan sulfate biosynthesis |
| 0.0 | 2.9 | REACTOME VOLTAGE GATED POTASSIUM CHANNELS | Genes involved in Voltage gated Potassium channels |
| 0.0 | 1.2 | REACTOME SYNTHESIS OF PIPS AT THE GOLGI MEMBRANE | Genes involved in Synthesis of PIPs at the Golgi membrane |
| 0.0 | 1.1 | REACTOME CYTOSOLIC SULFONATION OF SMALL MOLECULES | Genes involved in Cytosolic sulfonation of small molecules |
| 0.0 | 0.6 | REACTOME ACTIVATION OF CHAPERONE GENES BY ATF6 ALPHA | Genes involved in Activation of Chaperone Genes by ATF6-alpha |
| 0.0 | 2.1 | REACTOME G1 PHASE | Genes involved in G1 Phase |
| 0.0 | 0.2 | REACTOME SIGNAL ATTENUATION | Genes involved in Signal attenuation |
| 0.0 | 0.8 | REACTOME NOTCH HLH TRANSCRIPTION PATHWAY | Genes involved in Notch-HLH transcription pathway |
| 0.0 | 0.3 | REACTOME THROMBIN SIGNALLING THROUGH PROTEINASE ACTIVATED RECEPTORS PARS | Genes involved in Thrombin signalling through proteinase activated receptors (PARs) |
| 0.0 | 0.7 | REACTOME BASE FREE SUGAR PHOSPHATE REMOVAL VIA THE SINGLE NUCLEOTIDE REPLACEMENT PATHWAY | Genes involved in Base-free sugar-phosphate removal via the single-nucleotide replacement pathway |
| 0.0 | 1.0 | REACTOME SMAD2 SMAD3 SMAD4 HETEROTRIMER REGULATES TRANSCRIPTION | Genes involved in SMAD2/SMAD3:SMAD4 heterotrimer regulates transcription |
| 0.0 | 1.3 | REACTOME SYNTHESIS OF PC | Genes involved in Synthesis of PC |
| 0.0 | 0.7 | REACTOME IRON UPTAKE AND TRANSPORT | Genes involved in Iron uptake and transport |
| 0.0 | 1.0 | REACTOME EXTRINSIC PATHWAY FOR APOPTOSIS | Genes involved in Extrinsic Pathway for Apoptosis |
| 0.0 | 0.7 | REACTOME BILE SALT AND ORGANIC ANION SLC TRANSPORTERS | Genes involved in Bile salt and organic anion SLC transporters |
| 0.0 | 1.0 | REACTOME REGULATION OF AMPK ACTIVITY VIA LKB1 | Genes involved in Regulation of AMPK activity via LKB1 |
| 0.0 | 0.4 | REACTOME DARPP 32 EVENTS | Genes involved in DARPP-32 events |
| 0.0 | 0.8 | REACTOME METABOLISM OF PORPHYRINS | Genes involved in Metabolism of porphyrins |
| 0.0 | 0.6 | REACTOME EICOSANOID LIGAND BINDING RECEPTORS | Genes involved in Eicosanoid ligand-binding receptors |
| 0.0 | 0.2 | REACTOME NEGATIVE REGULATION OF THE PI3K AKT NETWORK | Genes involved in Negative regulation of the PI3K/AKT network |
| 0.0 | 1.3 | REACTOME PI METABOLISM | Genes involved in PI Metabolism |
| 0.0 | 1.5 | REACTOME MHC CLASS II ANTIGEN PRESENTATION | Genes involved in MHC class II antigen presentation |
| 0.0 | 2.4 | REACTOME NOTCH1 INTRACELLULAR DOMAIN REGULATES TRANSCRIPTION | Genes involved in NOTCH1 Intracellular Domain Regulates Transcription |
| 0.0 | 7.6 | REACTOME SIGNALING BY RHO GTPASES | Genes involved in Signaling by Rho GTPases |
| 0.0 | 0.6 | REACTOME COSTIMULATION BY THE CD28 FAMILY | Genes involved in Costimulation by the CD28 family |
| 0.0 | 0.7 | REACTOME REGULATION OF COMPLEMENT CASCADE | Genes involved in Regulation of Complement cascade |
| 0.0 | 0.1 | REACTOME CLEAVAGE OF GROWING TRANSCRIPT IN THE TERMINATION REGION | Genes involved in Cleavage of Growing Transcript in the Termination Region |
| 0.0 | 3.6 | REACTOME RESPONSE TO ELEVATED PLATELET CYTOSOLIC CA2 | Genes involved in Response to elevated platelet cytosolic Ca2+ |
| 0.0 | 1.2 | REACTOME ION TRANSPORT BY P TYPE ATPASES | Genes involved in Ion transport by P-type ATPases |
| 0.0 | 3.3 | REACTOME CLASS A1 RHODOPSIN LIKE RECEPTORS | Genes involved in Class A/1 (Rhodopsin-like receptors) |
| 0.0 | 0.7 | REACTOME SIGNALING BY SCF KIT | Genes involved in Signaling by SCF-KIT |
| 0.0 | 0.3 | REACTOME COPI MEDIATED TRANSPORT | Genes involved in COPI Mediated Transport |
| 0.0 | 0.4 | REACTOME GLUCAGON TYPE LIGAND RECEPTORS | Genes involved in Glucagon-type ligand receptors |
| 0.0 | 0.2 | REACTOME LIGAND GATED ION CHANNEL TRANSPORT | Genes involved in Ligand-gated ion channel transport |
| 0.0 | 0.8 | REACTOME AMYLOIDS | Genes involved in Amyloids |
| 0.0 | 0.4 | REACTOME THE ACTIVATION OF ARYLSULFATASES | Genes involved in The activation of arylsulfatases |
| 0.0 | 0.4 | REACTOME GLUCOSE TRANSPORT | Genes involved in Glucose transport |
| 0.0 | 0.4 | REACTOME SYNTHESIS SECRETION AND DEACYLATION OF GHRELIN | Genes involved in Synthesis, Secretion, and Deacylation of Ghrelin |
| 0.0 | 1.2 | REACTOME GOLGI ASSOCIATED VESICLE BIOGENESIS | Genes involved in Golgi Associated Vesicle Biogenesis |
| 0.0 | 2.8 | REACTOME G ALPHA Q SIGNALLING EVENTS | Genes involved in G alpha (q) signalling events |
| 0.0 | 0.2 | REACTOME ABACAVIR TRANSPORT AND METABOLISM | Genes involved in Abacavir transport and metabolism |
| 0.0 | 2.0 | REACTOME TRANSCRIPTIONAL REGULATION OF WHITE ADIPOCYTE DIFFERENTIATION | Genes involved in Transcriptional Regulation of White Adipocyte Differentiation |
| 0.0 | 0.3 | REACTOME G1 S SPECIFIC TRANSCRIPTION | Genes involved in G1/S-Specific Transcription |
| 0.0 | 0.2 | REACTOME INTEGRATION OF PROVIRUS | Genes involved in Integration of provirus |
| 0.0 | 0.1 | REACTOME FGFR1 LIGAND BINDING AND ACTIVATION | Genes involved in FGFR1 ligand binding and activation |
| 0.0 | 0.8 | REACTOME TIGHT JUNCTION INTERACTIONS | Genes involved in Tight junction interactions |
| 0.0 | 1.7 | REACTOME TOLL RECEPTOR CASCADES | Genes involved in Toll Receptor Cascades |
| 0.0 | 0.5 | REACTOME SIGNALING BY BMP | Genes involved in Signaling by BMP |
| 0.0 | 0.4 | REACTOME FORMATION OF THE TERNARY COMPLEX AND SUBSEQUENTLY THE 43S COMPLEX | Genes involved in Formation of the ternary complex, and subsequently, the 43S complex |
| 0.0 | 0.2 | REACTOME ACTIVATION OF GENES BY ATF4 | Genes involved in Activation of Genes by ATF4 |
| 0.0 | 0.6 | REACTOME PREFOLDIN MEDIATED TRANSFER OF SUBSTRATE TO CCT TRIC | Genes involved in Prefoldin mediated transfer of substrate to CCT/TriC |
| 0.0 | 0.9 | REACTOME CYTOCHROME P450 ARRANGED BY SUBSTRATE TYPE | Genes involved in Cytochrome P450 - arranged by substrate type |
| 0.0 | 2.1 | REACTOME MRNA SPLICING | Genes involved in mRNA Splicing |
| 0.0 | 0.4 | REACTOME PHASE1 FUNCTIONALIZATION OF COMPOUNDS | Genes involved in Phase 1 - Functionalization of compounds |
| 0.0 | 0.3 | REACTOME ORGANIC CATION ANION ZWITTERION TRANSPORT | Genes involved in Organic cation/anion/zwitterion transport |
| 0.0 | 0.3 | REACTOME RNA POL III TRANSCRIPTION INITIATION FROM TYPE 2 PROMOTER | Genes involved in RNA Polymerase III Transcription Initiation From Type 2 Promoter |