Project
Illumina Body Map 2 (GSE30611)
Navigation
Downloads
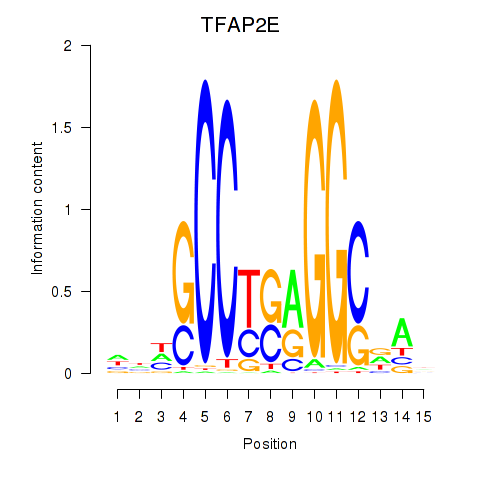
Results for TFAP2E
Z-value: 0.51
Motif logo
Transcription factors associated with TFAP2E
| Gene Symbol | Gene ID | Gene Info |
|---|---|---|
|
TFAP2E
|
ENSG00000116819.9 | transcription factor AP-2 epsilon |
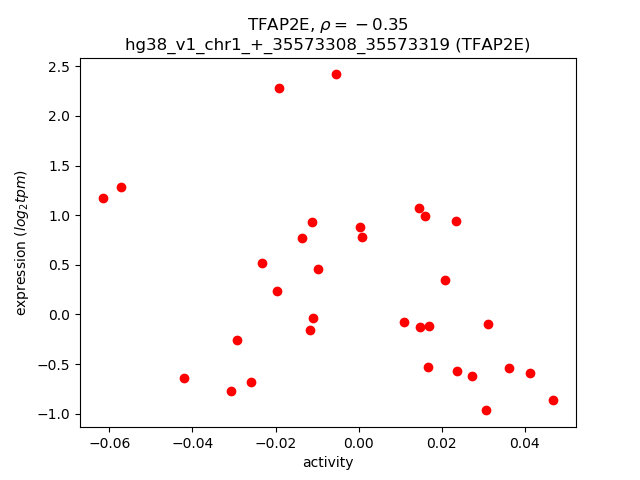
Activity-expression correlation:
| Gene | Promoter | Pearson corr. coef. | P-value | Plot |
|---|---|---|---|---|
| TFAP2E | hg38_v1_chr1_+_35573308_35573319 | -0.35 | 4.7e-02 | Click! |
Activity profile of TFAP2E motif
Sorted Z-values of TFAP2E motif
| Promoter | Log-likelihood | Transcript | Gene | Gene Info |
|---|---|---|---|---|
| chr11_+_116829898 | 1.60 |
ENST00000227667.8
ENST00000375345.3 |
APOC3
|
apolipoprotein C3 |
| chr3_+_52779916 | 1.11 |
ENST00000537050.5
|
ITIH1
|
inter-alpha-trypsin inhibitor heavy chain 1 |
| chrX_+_49171889 | 0.77 |
ENST00000376327.6
|
PLP2
|
proteolipid protein 2 |
| chrX_+_49171918 | 0.76 |
ENST00000376322.7
|
PLP2
|
proteolipid protein 2 |
| chr11_+_47215032 | 0.70 |
ENST00000622090.4
ENST00000378600.7 ENST00000378603.7 |
DDB2
|
damage specific DNA binding protein 2 |
| chr11_-_66289007 | 0.63 |
ENST00000431556.6
ENST00000528575.1 |
YIF1A
|
Yip1 interacting factor homolog A, membrane trafficking protein |
| chr19_+_4969105 | 0.61 |
ENST00000611640.4
ENST00000159111.9 ENST00000588337.5 ENST00000381759.8 |
KDM4B
|
lysine demethylase 4B |
| chr4_+_153466324 | 0.60 |
ENST00000409663.7
ENST00000409959.8 |
TMEM131L
|
transmembrane 131 like |
| chr11_-_66289125 | 0.58 |
ENST00000471387.6
ENST00000376901.9 ENST00000359461.10 |
YIF1A
|
Yip1 interacting factor homolog A, membrane trafficking protein |
| chr15_+_84817346 | 0.56 |
ENST00000258888.6
|
ALPK3
|
alpha kinase 3 |
| chr1_+_17308194 | 0.55 |
ENST00000375453.5
ENST00000375448.4 |
PADI4
|
peptidyl arginine deiminase 4 |
| chr8_+_22392821 | 0.52 |
ENST00000520832.1
|
SLC39A14
|
solute carrier family 39 member 14 |
| chr19_+_45001430 | 0.51 |
ENST00000625761.2
ENST00000505236.1 ENST00000221452.13 |
RELB
|
RELB proto-oncogene, NF-kB subunit |
| chr6_+_42564060 | 0.51 |
ENST00000372903.6
|
UBR2
|
ubiquitin protein ligase E3 component n-recognin 2 |
| chr10_-_96720485 | 0.48 |
ENST00000339364.10
|
PIK3AP1
|
phosphoinositide-3-kinase adaptor protein 1 |
| chr11_+_3855629 | 0.46 |
ENST00000526596.2
ENST00000300737.8 ENST00000616714.4 |
STIM1
|
stromal interaction molecule 1 |
| chr19_-_45886120 | 0.44 |
ENST00000302165.5
|
IRF2BP1
|
interferon regulatory factor 2 binding protein 1 |
| chr2_-_74529670 | 0.43 |
ENST00000377526.4
|
AUP1
|
AUP1 lipid droplet regulating VLDL assembly factor |
| chr17_-_35088818 | 0.42 |
ENST00000414419.6
|
RFFL
|
ring finger and FYVE like domain containing E3 ubiquitin protein ligase |
| chr3_+_152269103 | 0.42 |
ENST00000459747.1
|
MBNL1
|
muscleblind like splicing regulator 1 |
| chr11_-_72041792 | 0.42 |
ENST00000537930.5
|
NUMA1
|
nuclear mitotic apparatus protein 1 |
| chr2_+_231708511 | 0.42 |
ENST00000341369.11
ENST00000409115.8 ENST00000409683.5 |
PTMA
|
prothymosin alpha |
| chr6_+_42563981 | 0.41 |
ENST00000372899.6
ENST00000372901.2 |
UBR2
|
ubiquitin protein ligase E3 component n-recognin 2 |
| chr3_+_152268920 | 0.41 |
ENST00000495875.6
ENST00000324210.10 ENST00000493459.5 |
MBNL1
|
muscleblind like splicing regulator 1 |
| chr4_-_152679984 | 0.40 |
ENST00000304385.8
ENST00000504064.1 |
TMEM154
|
transmembrane protein 154 |
| chr19_+_54449612 | 0.40 |
ENST00000443957.5
|
LENG8
|
leukocyte receptor cluster member 8 |
| chr19_-_43465596 | 0.40 |
ENST00000244333.4
|
LYPD3
|
LY6/PLAUR domain containing 3 |
| chr13_-_75482151 | 0.40 |
ENST00000377636.8
|
TBC1D4
|
TBC1 domain family member 4 |
| chr19_+_50432885 | 0.40 |
ENST00000357701.6
|
MYBPC2
|
myosin binding protein C2 |
| chr6_+_7107597 | 0.39 |
ENST00000379933.7
ENST00000491191.5 ENST00000471433.5 |
RREB1
|
ras responsive element binding protein 1 |
| chr10_-_124092445 | 0.39 |
ENST00000346248.7
|
CHST15
|
carbohydrate sulfotransferase 15 |
| chr10_-_77638369 | 0.38 |
ENST00000372443.6
|
KCNMA1
|
potassium calcium-activated channel subfamily M alpha 1 |
| chr6_+_7107941 | 0.37 |
ENST00000379938.7
ENST00000467782.5 ENST00000334984.10 ENST00000349384.10 |
RREB1
|
ras responsive element binding protein 1 |
| chr9_+_133636355 | 0.37 |
ENST00000393056.8
|
DBH
|
dopamine beta-hydroxylase |
| chr19_+_38304105 | 0.37 |
ENST00000588605.5
ENST00000301246.10 |
C19orf33
|
chromosome 19 open reading frame 33 |
| chr6_-_18264475 | 0.36 |
ENST00000515742.2
ENST00000651624.1 ENST00000507591.2 ENST00000652689.1 ENST00000244776.11 ENST00000503715.5 |
DEK
|
DEK proto-oncogene |
| chr11_-_72041945 | 0.36 |
ENST00000543009.5
|
NUMA1
|
nuclear mitotic apparatus protein 1 |
| chr11_-_72041522 | 0.35 |
ENST00000544238.5
|
NUMA1
|
nuclear mitotic apparatus protein 1 |
| chr7_-_140924900 | 0.35 |
ENST00000646891.1
ENST00000644969.2 |
BRAF
|
B-Raf proto-oncogene, serine/threonine kinase |
| chr1_-_113812448 | 0.34 |
ENST00000612242.4
ENST00000261441.9 |
RSBN1
|
round spermatid basic protein 1 |
| chr10_-_124092390 | 0.34 |
ENST00000628426.1
|
CHST15
|
carbohydrate sulfotransferase 15 |
| chr17_-_35089212 | 0.33 |
ENST00000584655.5
ENST00000447669.6 ENST00000315249.11 |
RFFL
|
ring finger and FYVE like domain containing E3 ubiquitin protein ligase |
| chr10_-_131981948 | 0.33 |
ENST00000633835.1
|
BNIP3
|
BCL2 interacting protein 3 |
| chrX_+_153724847 | 0.32 |
ENST00000218104.6
|
ABCD1
|
ATP binding cassette subfamily D member 1 |
| chr5_-_180071708 | 0.32 |
ENST00000522208.6
ENST00000521389.6 |
RNF130
|
ring finger protein 130 |
| chr5_-_151924824 | 0.32 |
ENST00000455880.2
|
GLRA1
|
glycine receptor alpha 1 |
| chr19_-_10503186 | 0.32 |
ENST00000592055.2
ENST00000171111.10 |
KEAP1
|
kelch like ECH associated protein 1 |
| chr9_+_133636378 | 0.31 |
ENST00000263611.3
|
DBH
|
dopamine beta-hydroxylase |
| chr13_-_75482114 | 0.31 |
ENST00000377625.6
ENST00000431480.6 |
TBC1D4
|
TBC1 domain family member 4 |
| chr1_+_228208024 | 0.31 |
ENST00000570156.7
ENST00000680850.1 |
OBSCN
|
obscurin, cytoskeletal calmodulin and titin-interacting RhoGEF |
| chr5_-_151924846 | 0.29 |
ENST00000274576.9
|
GLRA1
|
glycine receptor alpha 1 |
| chr1_-_113812254 | 0.29 |
ENST00000616024.4
ENST00000615321.1 |
RSBN1
|
round spermatid basic protein 1 |
| chr1_-_40862354 | 0.28 |
ENST00000372638.4
|
CITED4
|
Cbp/p300 interacting transactivator with Glu/Asp rich carboxy-terminal domain 4 |
| chr11_-_65857543 | 0.28 |
ENST00000534784.1
|
CFL1
|
cofilin 1 |
| chr10_-_77637902 | 0.28 |
ENST00000286627.10
ENST00000639486.1 ENST00000640523.1 |
KCNMA1
|
potassium calcium-activated channel subfamily M alpha 1 |
| chr16_-_28495519 | 0.27 |
ENST00000569430.7
|
CLN3
|
CLN3 lysosomal/endosomal transmembrane protein, battenin |
| chr17_-_41612757 | 0.27 |
ENST00000301653.9
ENST00000593067.1 |
KRT16
|
keratin 16 |
| chr6_+_31586835 | 0.26 |
ENST00000211921.11
|
LST1
|
leukocyte specific transcript 1 |
| chr2_+_73202570 | 0.25 |
ENST00000398468.4
|
NOTO
|
notochord homeobox |
| chr1_+_228208054 | 0.25 |
ENST00000284548.16
ENST00000422127.5 |
OBSCN
|
obscurin, cytoskeletal calmodulin and titin-interacting RhoGEF |
| chrX_+_116436599 | 0.24 |
ENST00000598581.3
|
SLC6A14
|
solute carrier family 6 member 14 |
| chr11_-_71252492 | 0.24 |
ENST00000601538.6
|
SHANK2
|
SH3 and multiple ankyrin repeat domains 2 |
| chr8_-_143430727 | 0.24 |
ENST00000333480.3
|
MAFA
|
MAF bZIP transcription factor A |
| chr2_-_177264686 | 0.24 |
ENST00000397062.8
ENST00000430047.1 |
NFE2L2
|
nuclear factor, erythroid 2 like 2 |
| chr1_+_8945858 | 0.23 |
ENST00000549778.5
ENST00000377443.7 ENST00000480186.7 ENST00000377436.6 ENST00000377442.3 |
CA6
|
carbonic anhydrase 6 |
| chr6_+_31586680 | 0.22 |
ENST00000339530.8
|
LST1
|
leukocyte specific transcript 1 |
| chr6_+_31586859 | 0.22 |
ENST00000433492.5
|
LST1
|
leukocyte specific transcript 1 |
| chr9_+_135714425 | 0.22 |
ENST00000473941.5
ENST00000486577.6 |
KCNT1
|
potassium sodium-activated channel subfamily T member 1 |
| chr7_+_151085858 | 0.21 |
ENST00000463381.5
|
AGAP3
|
ArfGAP with GTPase domain, ankyrin repeat and PH domain 3 |
| chr4_-_81471898 | 0.21 |
ENST00000335927.11
ENST00000264400.7 ENST00000504863.1 |
RASGEF1B
|
RasGEF domain family member 1B |
| chr22_-_38700655 | 0.21 |
ENST00000216039.9
|
JOSD1
|
Josephin domain containing 1 |
| chr20_+_2840694 | 0.21 |
ENST00000380469.7
ENST00000380445.8 ENST00000453689.5 ENST00000417508.1 |
VPS16
|
VPS16 core subunit of CORVET and HOPS complexes |
| chr11_-_47848539 | 0.21 |
ENST00000526870.1
|
NUP160
|
nucleoporin 160 |
| chr5_-_180072086 | 0.20 |
ENST00000261947.4
|
RNF130
|
ring finger protein 130 |
| chr11_-_82901507 | 0.20 |
ENST00000533126.1
|
PRCP
|
prolylcarboxypeptidase |
| chr3_-_48088824 | 0.20 |
ENST00000439356.2
ENST00000395734.7 ENST00000426837.6 |
MAP4
|
microtubule associated protein 4 |
| chr6_-_87702221 | 0.19 |
ENST00000257787.6
|
AKIRIN2
|
akirin 2 |
| chr2_-_23927048 | 0.19 |
ENST00000439915.1
|
ATAD2B
|
ATPase family AAA domain containing 2B |
| chr1_-_93847150 | 0.19 |
ENST00000370244.5
|
BCAR3
|
BCAR3 adaptor protein, NSP family member |
| chr7_+_73433761 | 0.19 |
ENST00000344575.5
|
FZD9
|
frizzled class receptor 9 |
| chr3_-_136752361 | 0.19 |
ENST00000480733.1
ENST00000629124.2 ENST00000383202.7 ENST00000236698.9 ENST00000434713.6 |
STAG1
|
stromal antigen 1 |
| chr1_+_3069160 | 0.19 |
ENST00000511072.5
|
PRDM16
|
PR/SET domain 16 |
| chr1_-_11691608 | 0.18 |
ENST00000376667.7
|
MAD2L2
|
mitotic arrest deficient 2 like 2 |
| chr9_+_126326809 | 0.18 |
ENST00000361171.8
ENST00000489637.3 |
MVB12B
|
multivesicular body subunit 12B |
| chrX_+_129738942 | 0.18 |
ENST00000371106.4
|
XPNPEP2
|
X-prolyl aminopeptidase 2 |
| chr2_-_37324696 | 0.17 |
ENST00000443187.1
|
PRKD3
|
protein kinase D3 |
| chr11_-_35420017 | 0.17 |
ENST00000643000.1
ENST00000646099.1 ENST00000647372.1 ENST00000642578.1 |
SLC1A2
|
solute carrier family 1 member 2 |
| chr3_+_122795039 | 0.17 |
ENST00000261038.6
|
SLC49A4
|
solute carrier family 49 member 4 |
| chr1_-_43453792 | 0.17 |
ENST00000372434.5
ENST00000486909.1 |
HYI
|
hydroxypyruvate isomerase (putative) |
| chr1_-_43453902 | 0.17 |
ENST00000372430.9
ENST00000372432.5 ENST00000583037.5 |
HYI
|
hydroxypyruvate isomerase (putative) |
| chr1_+_966466 | 0.17 |
ENST00000379410.8
ENST00000379407.7 ENST00000379409.6 |
PLEKHN1
|
pleckstrin homology domain containing N1 |
| chr8_+_17922974 | 0.17 |
ENST00000517730.5
ENST00000518537.5 ENST00000523055.5 ENST00000519253.5 |
PCM1
|
pericentriolar material 1 |
| chrX_-_49079702 | 0.17 |
ENST00000636049.1
ENST00000474053.6 ENST00000635003.1 |
WDR45
|
WD repeat domain 45 |
| chr1_-_11691646 | 0.17 |
ENST00000235310.7
|
MAD2L2
|
mitotic arrest deficient 2 like 2 |
| chr22_+_31212207 | 0.16 |
ENST00000406516.5
ENST00000331728.9 |
LIMK2
|
LIM domain kinase 2 |
| chr1_-_224434750 | 0.16 |
ENST00000414423.9
ENST00000678917.1 ENST00000678555.1 ENST00000678307.1 |
WDR26
|
WD repeat domain 26 |
| chr17_+_63622406 | 0.16 |
ENST00000579585.5
ENST00000361733.8 ENST00000584573.5 ENST00000361357.7 |
MAP3K3
|
mitogen-activated protein kinase kinase kinase 3 |
| chr7_-_140924699 | 0.16 |
ENST00000288602.11
ENST00000469930.2 ENST00000496384.7 |
BRAF
|
B-Raf proto-oncogene, serine/threonine kinase |
| chr11_+_64206663 | 0.16 |
ENST00000544997.5
ENST00000345728.10 ENST00000279227.9 |
FERMT3
|
fermitin family member 3 |
| chr1_-_43453716 | 0.16 |
ENST00000372433.5
|
HYI
|
hydroxypyruvate isomerase (putative) |
| chr22_-_45977154 | 0.16 |
ENST00000339464.9
|
WNT7B
|
Wnt family member 7B |
| chr2_-_240892007 | 0.16 |
ENST00000402775.6
ENST00000307486.12 |
MAB21L4
|
mab-21 like 4 |
| chr22_+_31248402 | 0.15 |
ENST00000333611.8
ENST00000340552.4 |
LIMK2
|
LIM domain kinase 2 |
| chr8_+_17922837 | 0.15 |
ENST00000325083.12
|
PCM1
|
pericentriolar material 1 |
| chr22_-_38700920 | 0.15 |
ENST00000456626.1
ENST00000412832.1 ENST00000683374.1 |
JOSD1
|
Josephin domain containing 1 |
| chr16_-_381935 | 0.15 |
ENST00000431232.7
ENST00000250930.7 |
PGAP6
|
post-glycosylphosphatidylinositol attachment to proteins 6 |
| chr3_+_105367212 | 0.15 |
ENST00000472644.6
|
ALCAM
|
activated leukocyte cell adhesion molecule |
| chr5_+_134648772 | 0.15 |
ENST00000398844.7
ENST00000322887.8 |
SEC24A
|
SEC24 homolog A, COPII coat complex component |
| chrX_+_41085436 | 0.15 |
ENST00000324545.9
ENST00000378308.7 |
USP9X
|
ubiquitin specific peptidase 9 X-linked |
| chr7_+_130070518 | 0.15 |
ENST00000335420.10
ENST00000463413.1 |
KLHDC10
|
kelch domain containing 10 |
| chr11_-_35419899 | 0.14 |
ENST00000646847.1
ENST00000449068.2 ENST00000643401.1 ENST00000645966.1 ENST00000647104.1 |
SLC1A2
|
solute carrier family 1 member 2 |
| chr18_-_47930559 | 0.14 |
ENST00000587269.5
|
SMAD2
|
SMAD family member 2 |
| chr7_+_148590760 | 0.14 |
ENST00000307003.3
|
C7orf33
|
chromosome 7 open reading frame 33 |
| chr4_-_81471855 | 0.13 |
ENST00000436139.6
ENST00000613784.1 |
RASGEF1B
|
RasGEF domain family member 1B |
| chr2_+_190648852 | 0.13 |
ENST00000416973.1
ENST00000426601.1 |
NAB1
|
NGFI-A binding protein 1 |
| chr19_-_38773432 | 0.13 |
ENST00000599035.1
ENST00000378626.5 |
LGALS7
|
galectin 7 |
| chr9_-_109320949 | 0.12 |
ENST00000374557.4
|
EPB41L4B
|
erythrocyte membrane protein band 4.1 like 4B |
| chr12_-_14567714 | 0.12 |
ENST00000240617.10
|
PLBD1
|
phospholipase B domain containing 1 |
| chr17_-_76726753 | 0.12 |
ENST00000617192.4
|
JMJD6
|
jumonji domain containing 6, arginine demethylase and lysine hydroxylase |
| chr8_-_102655707 | 0.12 |
ENST00000285407.11
|
KLF10
|
Kruppel like factor 10 |
| chr3_-_49411917 | 0.11 |
ENST00000454011.7
ENST00000445425.6 ENST00000422781.6 ENST00000418115.6 ENST00000678921.2 ENST00000676712.2 |
RHOA
|
ras homolog family member A |
| chr11_-_35419462 | 0.11 |
ENST00000643522.1
|
SLC1A2
|
solute carrier family 1 member 2 |
| chr19_+_8390316 | 0.11 |
ENST00000328024.11
ENST00000601897.1 ENST00000594216.1 |
RAB11B
|
RAB11B, member RAS oncogene family |
| chr8_+_25184758 | 0.11 |
ENST00000481100.5
|
DOCK5
|
dedicator of cytokinesis 5 |
| chr11_-_62612280 | 0.11 |
ENST00000466671.5
ENST00000466886.5 |
EML3
|
EMAP like 3 |
| chr11_-_47848313 | 0.10 |
ENST00000530326.5
ENST00000528071.5 |
NUP160
|
nucleoporin 160 |
| chr17_-_44111253 | 0.10 |
ENST00000591714.5
|
HDAC5
|
histone deacetylase 5 |
| chr17_+_39667964 | 0.10 |
ENST00000394246.1
|
PNMT
|
phenylethanolamine N-methyltransferase |
| chr11_-_77411883 | 0.10 |
ENST00000528203.5
ENST00000528592.5 ENST00000528633.1 ENST00000529248.5 |
PAK1
|
p21 (RAC1) activated kinase 1 |
| chr14_-_63543288 | 0.10 |
ENST00000555899.1
|
PPP2R5E
|
protein phosphatase 2 regulatory subunit B'epsilon |
| chr3_-_48088800 | 0.10 |
ENST00000423088.5
|
MAP4
|
microtubule associated protein 4 |
| chr14_-_63543328 | 0.09 |
ENST00000337537.8
|
PPP2R5E
|
protein phosphatase 2 regulatory subunit B'epsilon |
| chr11_-_47848467 | 0.09 |
ENST00000378460.6
|
NUP160
|
nucleoporin 160 |
| chr11_-_27506751 | 0.09 |
ENST00000278193.7
ENST00000524596.1 |
LIN7C
|
lin-7 homolog C, crumbs cell polarity complex component |
| chr9_-_21077938 | 0.09 |
ENST00000380232.4
|
IFNB1
|
interferon beta 1 |
| chr22_+_31248323 | 0.09 |
ENST00000425203.1
|
LIMK2
|
LIM domain kinase 2 |
| chr7_+_29194757 | 0.09 |
ENST00000222792.11
|
CHN2
|
chimerin 2 |
| chrX_-_107000062 | 0.09 |
ENST00000255495.7
|
MORC4
|
MORC family CW-type zinc finger 4 |
| chr8_+_124450806 | 0.08 |
ENST00000328599.4
|
TRMT12
|
tRNA methyltransferase 12 homolog |
| chr11_-_65857007 | 0.08 |
ENST00000527344.5
|
CFL1
|
cofilin 1 |
| chr9_-_34662654 | 0.08 |
ENST00000259631.5
|
CCL27
|
C-C motif chemokine ligand 27 |
| chr9_+_4984985 | 0.08 |
ENST00000476574.5
|
JAK2
|
Janus kinase 2 |
| chr7_+_32495447 | 0.08 |
ENST00000318709.9
ENST00000409301.5 ENST00000640103.1 |
AVL9
|
AVL9 cell migration associated |
| chr1_-_11805977 | 0.07 |
ENST00000376486.3
|
MTHFR
|
methylenetetrahydrofolate reductase |
| chr12_-_56630293 | 0.07 |
ENST00000546695.5
ENST00000549884.6 |
BAZ2A
|
bromodomain adjacent to zinc finger domain 2A |
| chr17_+_39668447 | 0.07 |
ENST00000269582.3
ENST00000581428.1 |
PNMT
|
phenylethanolamine N-methyltransferase |
| chr19_-_42255119 | 0.06 |
ENST00000222329.9
ENST00000594664.1 |
ERF
ENSG00000268643.2
|
ETS2 repressor factor novel protein |
| chr11_-_35419542 | 0.06 |
ENST00000643305.1
ENST00000644351.1 ENST00000278379.9 ENST00000644779.1 |
SLC1A2
|
solute carrier family 1 member 2 |
| chr3_+_111072020 | 0.06 |
ENST00000486596.5
ENST00000493615.5 |
NECTIN3
|
nectin cell adhesion molecule 3 |
| chr19_+_3572927 | 0.06 |
ENST00000333651.11
ENST00000417382.5 |
HMG20B
|
high mobility group 20B |
| chr5_+_142108753 | 0.06 |
ENST00000253814.6
|
NDFIP1
|
Nedd4 family interacting protein 1 |
| chr1_+_34759737 | 0.06 |
ENST00000339480.3
|
GJB4
|
gap junction protein beta 4 |
| chr15_+_23565705 | 0.06 |
ENST00000568252.1
ENST00000649065.1 |
MKRN3
|
makorin ring finger protein 3 |
| chr2_+_74834113 | 0.06 |
ENST00000290573.7
|
HK2
|
hexokinase 2 |
| chr9_-_15307181 | 0.05 |
ENST00000506891.1
ENST00000512701.6 ENST00000380850.8 ENST00000297615.9 |
TTC39B
|
tetratricopeptide repeat domain 39B |
| chr9_-_122213903 | 0.05 |
ENST00000464484.3
|
LHX6
|
LIM homeobox 6 |
| chr11_-_61295289 | 0.05 |
ENST00000335613.10
|
VWCE
|
von Willebrand factor C and EGF domains |
| chr2_-_23927107 | 0.05 |
ENST00000238789.10
|
ATAD2B
|
ATPase family AAA domain containing 2B |
| chr13_-_30465224 | 0.05 |
ENST00000399494.5
|
HMGB1
|
high mobility group box 1 |
| chr20_-_2840623 | 0.04 |
ENST00000360652.7
ENST00000448755.5 |
PCED1A
|
PC-esterase domain containing 1A |
| chr7_-_23014099 | 0.04 |
ENST00000432176.7
ENST00000440481.6 |
FAM126A
|
family with sequence similarity 126 member A |
| chr20_+_6767678 | 0.04 |
ENST00000378827.5
|
BMP2
|
bone morphogenetic protein 2 |
| chr10_+_91220603 | 0.04 |
ENST00000336126.6
|
PCGF5
|
polycomb group ring finger 5 |
| chr19_+_49157741 | 0.04 |
ENST00000598691.5
|
TRPM4
|
transient receptor potential cation channel subfamily M member 4 |
| chr11_-_35419098 | 0.04 |
ENST00000606205.6
ENST00000645303.1 |
SLC1A2
|
solute carrier family 1 member 2 |
| chr4_+_6909775 | 0.04 |
ENST00000409757.9
|
TBC1D14
|
TBC1 domain family member 14 |
| chr9_+_35605234 | 0.03 |
ENST00000336395.6
|
TESK1
|
testis associated actin remodelling kinase 1 |
| chr19_+_3572777 | 0.03 |
ENST00000416526.5
|
HMG20B
|
high mobility group 20B |
| chr9_+_35605277 | 0.03 |
ENST00000620767.4
|
TESK1
|
testis associated actin remodelling kinase 1 |
| chrX_+_132023294 | 0.03 |
ENST00000481105.5
ENST00000354719.10 ENST00000394334.7 ENST00000394335.6 |
STK26
|
serine/threonine kinase 26 |
| chr1_+_33256479 | 0.03 |
ENST00000539719.6
ENST00000483388.5 |
ZNF362
|
zinc finger protein 362 |
| chr3_+_42654470 | 0.03 |
ENST00000680014.1
|
ZBTB47
|
zinc finger and BTB domain containing 47 |
| chr12_+_29149092 | 0.03 |
ENST00000551451.5
|
FAR2
|
fatty acyl-CoA reductase 2 |
| chr15_-_65422894 | 0.03 |
ENST00000352385.3
|
IGDCC4
|
immunoglobulin superfamily DCC subclass member 4 |
| chr7_+_816609 | 0.03 |
ENST00000457378.6
ENST00000389574.7 ENST00000452783.6 ENST00000435699.5 ENST00000440380.5 ENST00000439679.5 ENST00000424128.5 |
SUN1
|
Sad1 and UNC84 domain containing 1 |
| chr11_-_65856944 | 0.03 |
ENST00000524553.5
|
CFL1
|
cofilin 1 |
| chr2_+_218859794 | 0.02 |
ENST00000233948.4
|
WNT6
|
Wnt family member 6 |
| chr19_+_54449180 | 0.02 |
ENST00000439657.5
ENST00000326764.10 ENST00000376514.6 ENST00000436479.1 |
LENG8
|
leukocyte receptor cluster member 8 |
| chr1_-_11805924 | 0.02 |
ENST00000418034.1
|
MTHFR
|
methylenetetrahydrofolate reductase |
| chr1_+_150149819 | 0.02 |
ENST00000369124.5
|
PLEKHO1
|
pleckstrin homology domain containing O1 |
| chr3_+_50155305 | 0.02 |
ENST00000002829.8
ENST00000426511.5 |
SEMA3F
|
semaphorin 3F |
| chr19_-_54173151 | 0.02 |
ENST00000619895.5
|
TMC4
|
transmembrane channel like 4 |
| chr13_-_30465923 | 0.01 |
ENST00000341423.10
ENST00000326004.4 |
HMGB1
|
high mobility group box 1 |
| chr4_+_6909444 | 0.01 |
ENST00000448507.5
|
TBC1D14
|
TBC1 domain family member 14 |
| chr9_+_125261788 | 0.01 |
ENST00000461379.5
ENST00000297933.11 ENST00000394084.5 ENST00000394105.6 ENST00000470056.5 ENST00000394083.6 ENST00000495955.5 ENST00000467750.5 |
GAPVD1
|
GTPase activating protein and VPS9 domains 1 |
| chr14_+_103385450 | 0.01 |
ENST00000416682.6
|
MARK3
|
microtubule affinity regulating kinase 3 |
| chr11_-_35419213 | 0.01 |
ENST00000642171.1
ENST00000644050.1 ENST00000643134.1 |
SLC1A2
|
solute carrier family 1 member 2 |
| chr14_+_103385506 | 0.01 |
ENST00000303622.13
|
MARK3
|
microtubule affinity regulating kinase 3 |
| chr20_-_25390776 | 0.01 |
ENST00000376542.8
ENST00000339157.10 |
ABHD12
|
abhydrolase domain containing 12, lysophospholipase |
| chr7_-_23014074 | 0.01 |
ENST00000409763.1
ENST00000679826.1 ENST00000409923.5 ENST00000681766.1 |
FAM126A
|
family with sequence similarity 126 member A |
| chr9_+_130265745 | 0.01 |
ENST00000683500.1
|
HMCN2
|
hemicentin 2 |
| chr10_+_22325610 | 0.00 |
ENST00000416820.5
|
BMI1
|
BMI1 proto-oncogene, polycomb ring finger |
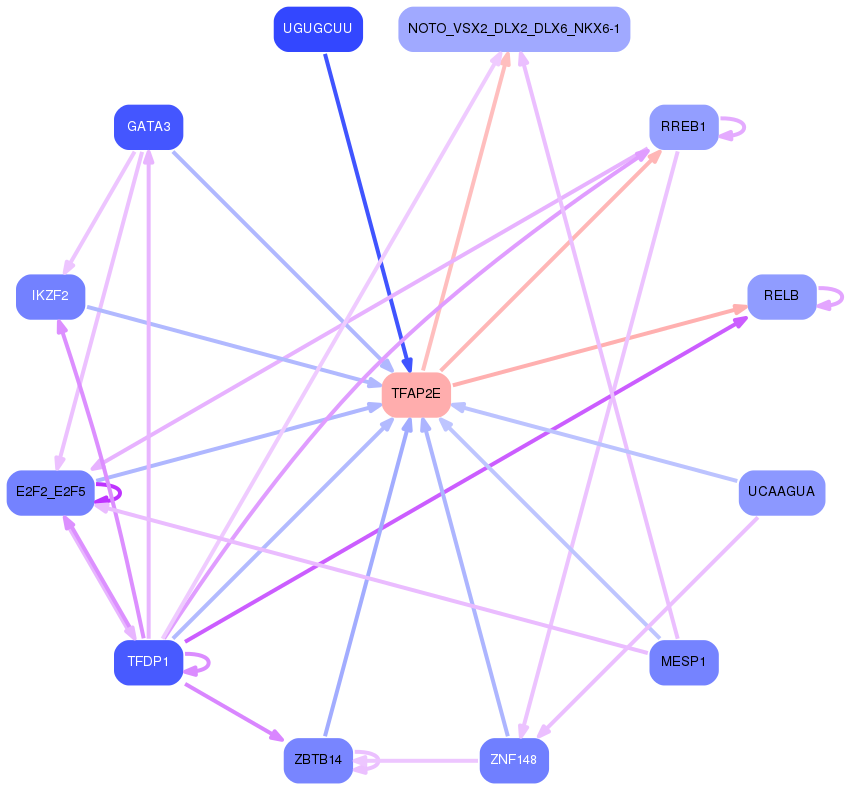
Network of associatons between targets according to the STRING database.

First level regulatory network of TFAP2E
Gene Ontology Analysis
Gene overrepresentation in biological process category:
| Log-likelihood per target | Total log-likelihood | Term | Description |
|---|---|---|---|
| 0.4 | 1.6 | GO:2000910 | negative regulation of cholesterol import(GO:0060621) negative regulation of sterol import(GO:2000910) |
| 0.3 | 0.8 | GO:1903691 | positive regulation of wound healing, spreading of epidermal cells(GO:1903691) |
| 0.2 | 0.7 | GO:0046333 | octopamine biosynthetic process(GO:0006589) homoiothermy(GO:0042309) octopamine metabolic process(GO:0046333) |
| 0.2 | 0.9 | GO:0071596 | ubiquitin-dependent protein catabolic process via the N-end rule pathway(GO:0071596) |
| 0.1 | 0.8 | GO:2001271 | negative regulation of cysteine-type endopeptidase activity involved in execution phase of apoptosis(GO:2001271) |
| 0.1 | 1.1 | GO:0071988 | regulation of spindle elongation(GO:0032887) regulation of mitotic spindle elongation(GO:0032888) anastral spindle assembly(GO:0055048) protein localization to spindle pole body(GO:0071988) regulation of protein localization to spindle pole body(GO:1902363) positive regulation of protein localization to spindle pole body(GO:1902365) positive regulation of mitotic spindle elongation(GO:1902846) |
| 0.1 | 0.5 | GO:0018101 | protein citrullination(GO:0018101) histone citrullination(GO:0036414) |
| 0.1 | 0.3 | GO:0035752 | lysosomal lumen pH elevation(GO:0035752) |
| 0.1 | 0.6 | GO:0051970 | negative regulation of transmission of nerve impulse(GO:0051970) |
| 0.1 | 0.3 | GO:0015910 | peroxisomal long-chain fatty acid import(GO:0015910) |
| 0.1 | 0.2 | GO:0042144 | vacuole fusion, non-autophagic(GO:0042144) |
| 0.1 | 0.5 | GO:2000301 | myeloid progenitor cell differentiation(GO:0002318) negative regulation of synaptic vesicle exocytosis(GO:2000301) |
| 0.1 | 0.2 | GO:1904397 | negative regulation of neuromuscular junction development(GO:1904397) |
| 0.1 | 0.5 | GO:0034154 | toll-like receptor 7 signaling pathway(GO:0034154) |
| 0.1 | 0.2 | GO:0042418 | epinephrine biosynthetic process(GO:0042418) |
| 0.1 | 0.4 | GO:2000771 | regulation of unidimensional cell growth(GO:0051510) negative regulation of unidimensional cell growth(GO:0051511) establishment of cell polarity regulating cell shape(GO:0071964) regulation of establishment or maintenance of cell polarity regulating cell shape(GO:2000769) positive regulation of establishment or maintenance of cell polarity regulating cell shape(GO:2000771) regulation of establishment of cell polarity regulating cell shape(GO:2000782) positive regulation of establishment of cell polarity regulating cell shape(GO:2000784) positive regulation of barbed-end actin filament capping(GO:2000814) |
| 0.1 | 0.6 | GO:0033088 | negative regulation of immature T cell proliferation in thymus(GO:0033088) |
| 0.1 | 0.7 | GO:0031339 | negative regulation of vesicle fusion(GO:0031339) |
| 0.0 | 0.7 | GO:0034465 | response to carbon monoxide(GO:0034465) |
| 0.0 | 0.5 | GO:1901341 | activation of store-operated calcium channel activity(GO:0032237) positive regulation of store-operated calcium channel activity(GO:1901341) |
| 0.0 | 0.3 | GO:2000048 | negative regulation of cell-cell adhesion mediated by cadherin(GO:2000048) |
| 0.0 | 0.6 | GO:0036309 | protein localization to M-band(GO:0036309) |
| 0.0 | 0.3 | GO:0051012 | microtubule sliding(GO:0051012) |
| 0.0 | 0.0 | GO:0003130 | BMP signaling pathway involved in heart induction(GO:0003130) endodermal-mesodermal cell signaling(GO:0003133) endodermal-mesodermal cell signaling involved in heart induction(GO:0003134) |
| 0.0 | 0.7 | GO:0006290 | pyrimidine dimer repair(GO:0006290) |
| 0.0 | 0.1 | GO:0070079 | peptidyl-lysine hydroxylation to 5-hydroxy-L-lysine(GO:0018395) histone arginine demethylation(GO:0070077) histone H3-R2 demethylation(GO:0070078) histone H4-R3 demethylation(GO:0070079) |
| 0.0 | 0.4 | GO:0035795 | negative regulation of mitochondrial membrane permeability(GO:0035795) |
| 0.0 | 0.6 | GO:0010499 | proteasomal ubiquitin-independent protein catabolic process(GO:0010499) |
| 0.0 | 0.3 | GO:0022027 | interkinetic nuclear migration(GO:0022027) |
| 0.0 | 0.5 | GO:0070777 | D-aspartate transport(GO:0070777) D-aspartate import(GO:0070779) |
| 0.0 | 0.2 | GO:0072061 | inner medullary collecting duct development(GO:0072061) |
| 0.0 | 0.2 | GO:0019075 | virus maturation(GO:0019075) |
| 0.0 | 0.5 | GO:1903874 | ferrous iron transport(GO:0015684) ferrous iron transmembrane transport(GO:1903874) |
| 0.0 | 0.6 | GO:0070544 | histone H3-K36 demethylation(GO:0070544) |
| 0.0 | 0.1 | GO:1900224 | positive regulation of nodal signaling pathway involved in determination of lateral mesoderm left/right asymmetry(GO:1900224) |
| 0.0 | 0.1 | GO:1902766 | skeletal muscle satellite cell migration(GO:1902766) |
| 0.0 | 0.2 | GO:0031936 | negative regulation of chromatin silencing(GO:0031936) |
| 0.0 | 0.5 | GO:0032688 | negative regulation of interferon-beta production(GO:0032688) |
| 0.0 | 0.4 | GO:0051546 | keratinocyte migration(GO:0051546) |
| 0.0 | 0.4 | GO:2001032 | regulation of double-strand break repair via nonhomologous end joining(GO:2001032) |
| 0.0 | 0.4 | GO:0071688 | striated muscle myosin thick filament assembly(GO:0071688) |
| 0.0 | 0.1 | GO:0032072 | plasmacytoid dendritic cell activation(GO:0002270) regulation of restriction endodeoxyribonuclease activity(GO:0032072) positive regulation of toll-like receptor 9 signaling pathway(GO:0034165) |
| 0.0 | 1.1 | GO:0030212 | hyaluronan metabolic process(GO:0030212) |
| 0.0 | 0.2 | GO:0033632 | regulation of cell-cell adhesion mediated by integrin(GO:0033632) |
| 0.0 | 0.2 | GO:0089700 | protein kinase D signaling(GO:0089700) |
| 0.0 | 0.7 | GO:0030206 | chondroitin sulfate biosynthetic process(GO:0030206) |
| 0.0 | 0.1 | GO:1904694 | negative regulation of vascular smooth muscle contraction(GO:1904694) |
| 0.0 | 0.1 | GO:2000189 | positive regulation of cholesterol homeostasis(GO:2000189) |
| 0.0 | 0.1 | GO:0060244 | negative regulation of cell proliferation involved in contact inhibition(GO:0060244) |
| 0.0 | 0.1 | GO:0045054 | constitutive secretory pathway(GO:0045054) |
Gene overrepresentation in cellular component category:
| Log-likelihood per target | Total log-likelihood | Term | Description |
|---|---|---|---|
| 0.3 | 0.8 | GO:0002947 | tumor necrosis factor receptor superfamily complex(GO:0002947) |
| 0.2 | 1.6 | GO:0034363 | intermediate-density lipoprotein particle(GO:0034363) |
| 0.1 | 1.1 | GO:0055028 | cortical microtubule(GO:0055028) |
| 0.1 | 0.4 | GO:0000839 | Hrd1p ubiquitin ligase ERAD-L complex(GO:0000839) |
| 0.1 | 0.3 | GO:0016035 | zeta DNA polymerase complex(GO:0016035) |
| 0.0 | 0.7 | GO:0031465 | Cul4B-RING E3 ubiquitin ligase complex(GO:0031465) |
| 0.0 | 0.7 | GO:0042584 | chromaffin granule membrane(GO:0042584) |
| 0.0 | 0.5 | GO:0033256 | I-kappaB/NF-kappaB complex(GO:0033256) |
| 0.0 | 0.5 | GO:0032541 | cortical endoplasmic reticulum(GO:0032541) |
| 0.0 | 0.6 | GO:0060077 | inhibitory synapse(GO:0060077) |
| 0.0 | 0.4 | GO:0031080 | nuclear pore outer ring(GO:0031080) |
| 0.0 | 0.1 | GO:0032444 | activin responsive factor complex(GO:0032444) |
| 0.0 | 1.2 | GO:0030173 | integral component of Golgi membrane(GO:0030173) |
| 0.0 | 0.2 | GO:0005883 | neurofilament(GO:0005883) |
| 0.0 | 0.4 | GO:0032982 | myosin filament(GO:0032982) |
| 0.0 | 0.2 | GO:0030897 | HOPS complex(GO:0030897) |
| 0.0 | 0.3 | GO:0000242 | pericentriolar material(GO:0000242) |
| 0.0 | 0.2 | GO:0000813 | ESCRT I complex(GO:0000813) |
| 0.0 | 0.3 | GO:0031307 | integral component of mitochondrial outer membrane(GO:0031307) |
| 0.0 | 0.4 | GO:0031231 | integral component of peroxisomal membrane(GO:0005779) intrinsic component of peroxisomal membrane(GO:0031231) |
Gene overrepresentation in molecular function category:
| Log-likelihood per target | Total log-likelihood | Term | Description |
|---|---|---|---|
| 0.3 | 1.6 | GO:0070653 | high-density lipoprotein particle receptor binding(GO:0070653) |
| 0.2 | 0.7 | GO:0004500 | dopamine beta-monooxygenase activity(GO:0004500) |
| 0.2 | 0.5 | GO:0008903 | hydroxypyruvate isomerase activity(GO:0008903) |
| 0.2 | 0.8 | GO:0001069 | regulatory region RNA binding(GO:0001069) |
| 0.1 | 0.6 | GO:0016933 | extracellular-glycine-gated ion channel activity(GO:0016933) extracellular-glycine-gated chloride channel activity(GO:0016934) |
| 0.1 | 0.5 | GO:0004668 | protein-arginine deiminase activity(GO:0004668) |
| 0.1 | 0.7 | GO:0050659 | N-acetylgalactosamine 4-sulfate 6-O-sulfotransferase activity(GO:0050659) |
| 0.1 | 0.9 | GO:0070728 | leucine binding(GO:0070728) |
| 0.1 | 0.7 | GO:0060072 | large conductance calcium-activated potassium channel activity(GO:0060072) |
| 0.1 | 1.1 | GO:0051011 | microtubule minus-end binding(GO:0051011) |
| 0.0 | 0.3 | GO:0005324 | long-chain fatty acid transporter activity(GO:0005324) |
| 0.0 | 0.5 | GO:0015093 | ferrous iron transmembrane transporter activity(GO:0015093) |
| 0.0 | 0.1 | GO:0033746 | histone demethylase activity (H3-R2 specific)(GO:0033746) histone demethylase activity (H4-R3 specific)(GO:0033749) |
| 0.0 | 0.5 | GO:0015501 | glutamate:sodium symporter activity(GO:0015501) |
| 0.0 | 0.4 | GO:0097027 | ubiquitin-protein transferase activator activity(GO:0097027) |
| 0.0 | 1.6 | GO:0019956 | chemokine binding(GO:0019956) |
| 0.0 | 0.6 | GO:0051864 | histone demethylase activity (H3-K9 specific)(GO:0032454) histone demethylase activity (H3-K36 specific)(GO:0051864) |
| 0.0 | 0.2 | GO:0030160 | GKAP/Homer scaffold activity(GO:0030160) |
| 0.0 | 0.5 | GO:0036312 | phosphatidylinositol 3-kinase regulatory subunit binding(GO:0036312) |
| 0.0 | 0.6 | GO:0031432 | titin binding(GO:0031432) |
| 0.0 | 0.1 | GO:0097016 | L27 domain binding(GO:0097016) |
| 0.0 | 0.1 | GO:0051021 | GDP-dissociation inhibitor binding(GO:0051021) Rho GDP-dissociation inhibitor binding(GO:0051022) |
| 0.0 | 0.1 | GO:0031728 | CCR3 chemokine receptor binding(GO:0031728) |
| 0.0 | 0.5 | GO:0031434 | mitogen-activated protein kinase kinase binding(GO:0031434) |
| 0.0 | 0.3 | GO:0008432 | JUN kinase binding(GO:0008432) |
| 0.0 | 0.4 | GO:0097493 | structural molecule activity conferring elasticity(GO:0097493) |
| 0.0 | 0.5 | GO:0051010 | microtubule plus-end binding(GO:0051010) |
| 0.0 | 0.2 | GO:0004089 | carbonate dehydratase activity(GO:0004089) |
| 0.0 | 0.1 | GO:0001025 | RNA polymerase III transcription factor binding(GO:0001025) |
Gene overrepresentation in curated gene sets: canonical pathways category:
| Log-likelihood per target | Total log-likelihood | Term | Description |
|---|---|---|---|
| 0.0 | 0.5 | PID TCR RAS PATHWAY | Ras signaling in the CD4+ TCR pathway |
| 0.0 | 0.4 | SA G1 AND S PHASES | Cdk2, 4, and 6 bind cyclin D in G1, while cdk2/cyclin E promotes the G1/S transition. |
| 0.0 | 0.7 | PID INSULIN GLUCOSE PATHWAY | Insulin-mediated glucose transport |
Gene overrepresentation in curated gene sets: REACTOME pathways category:
| Log-likelihood per target | Total log-likelihood | Term | Description |
|---|---|---|---|
| 0.1 | 1.6 | REACTOME CHYLOMICRON MEDIATED LIPID TRANSPORT | Genes involved in Chylomicron-mediated lipid transport |
| 0.0 | 1.1 | REACTOME RECRUITMENT OF NUMA TO MITOTIC CENTROSOMES | Genes involved in Recruitment of NuMA to mitotic centrosomes |
| 0.0 | 0.5 | REACTOME ELEVATION OF CYTOSOLIC CA2 LEVELS | Genes involved in Elevation of cytosolic Ca2+ levels |
| 0.0 | 0.9 | REACTOME AMINE DERIVED HORMONES | Genes involved in Amine-derived hormones |
| 0.0 | 0.5 | REACTOME SIGNALLING TO P38 VIA RIT AND RIN | Genes involved in Signalling to p38 via RIT and RIN |
| 0.0 | 0.7 | REACTOME FORMATION OF INCISION COMPLEX IN GG NER | Genes involved in Formation of incision complex in GG-NER |
| 0.0 | 0.7 | REACTOME CHONDROITIN SULFATE BIOSYNTHESIS | Genes involved in Chondroitin sulfate biosynthesis |
| 0.0 | 0.2 | REACTOME REVERSIBLE HYDRATION OF CARBON DIOXIDE | Genes involved in Reversible Hydration of Carbon Dioxide |
| 0.0 | 0.3 | REACTOME ABCA TRANSPORTERS IN LIPID HOMEOSTASIS | Genes involved in ABCA transporters in lipid homeostasis |
| 0.0 | 1.2 | REACTOME ACTIVATION OF CHAPERONE GENES BY XBP1S | Genes involved in Activation of Chaperone Genes by XBP1(S) |
| 0.0 | 0.5 | REACTOME SEMA3A PAK DEPENDENT AXON REPULSION | Genes involved in Sema3A PAK dependent Axon repulsion |
| 0.0 | 0.5 | REACTOME SEMA4D INDUCED CELL MIGRATION AND GROWTH CONE COLLAPSE | Genes involved in Sema4D induced cell migration and growth-cone collapse |
| 0.0 | 0.6 | REACTOME LIGAND GATED ION CHANNEL TRANSPORT | Genes involved in Ligand-gated ion channel transport |