Project
Illumina Body Map 2 (GSE30611)
Navigation
Downloads
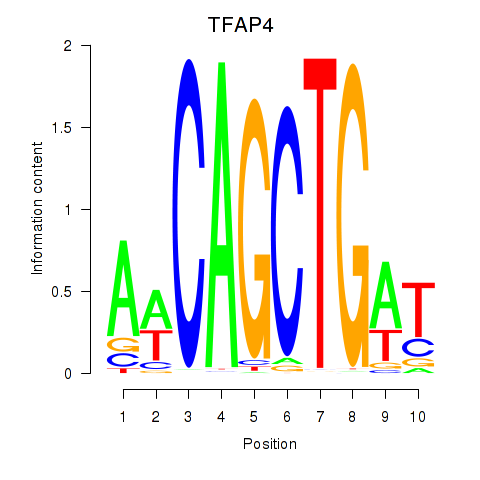
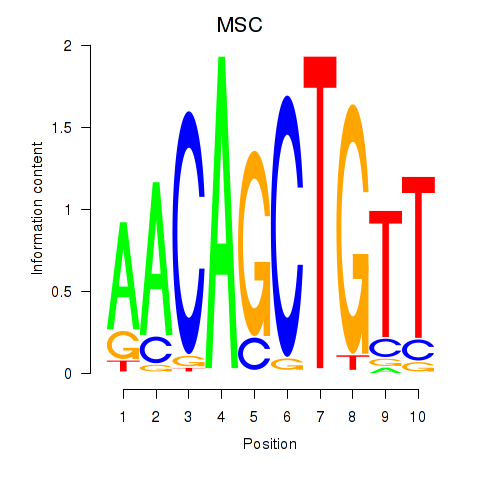
Results for TFAP4_MSC
Z-value: 1.79
Motif logo
Transcription factors associated with TFAP4_MSC
| Gene Symbol | Gene ID | Gene Info |
|---|---|---|
|
TFAP4
|
ENSG00000090447.12 | transcription factor AP-4 |
|
MSC
|
ENSG00000178860.9 | musculin |
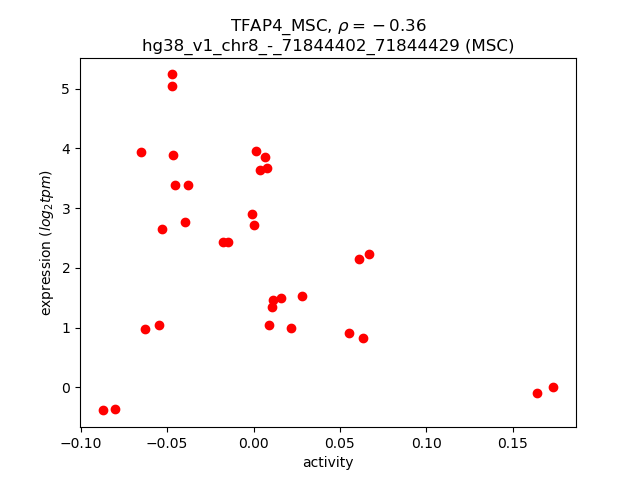
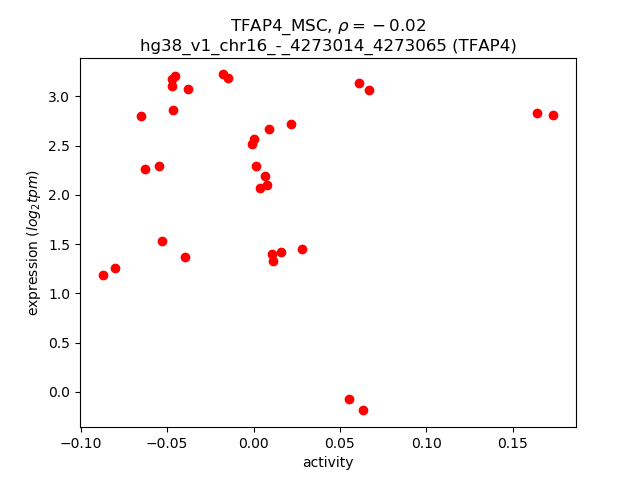
Activity-expression correlation:
| Gene | Promoter | Pearson corr. coef. | P-value | Plot |
|---|---|---|---|---|
| MSC | hg38_v1_chr8_-_71844402_71844429 | -0.36 | 4.6e-02 | Click! |
| TFAP4 | hg38_v1_chr16_-_4273014_4273065 | -0.02 | 9.1e-01 | Click! |
Activity profile of TFAP4_MSC motif
Sorted Z-values of TFAP4_MSC motif
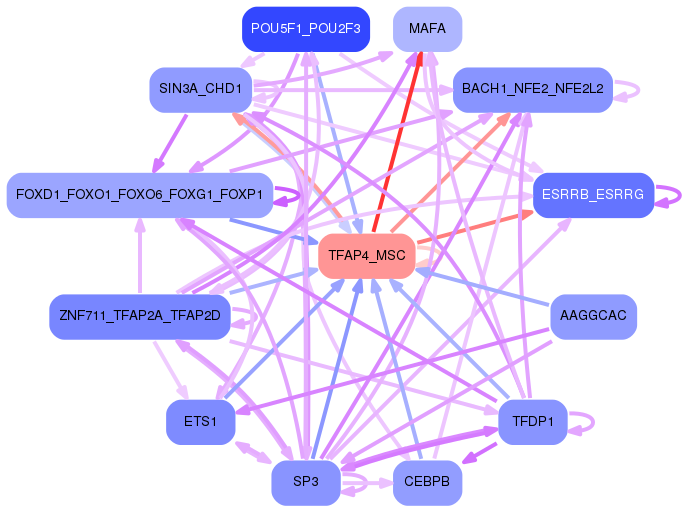
Network of associatons between targets according to the STRING database.

First level regulatory network of TFAP4_MSC
Gene Ontology Analysis
Gene overrepresentation in biological process category:
| Log-likelihood per target | Total log-likelihood | Term | Description |
|---|---|---|---|
| 2.3 | 20.9 | GO:0048630 | skeletal muscle tissue growth(GO:0048630) |
| 2.0 | 13.9 | GO:0032971 | regulation of muscle filament sliding(GO:0032971) |
| 1.6 | 15.8 | GO:0035995 | detection of muscle stretch(GO:0035995) |
| 1.4 | 4.3 | GO:0007525 | somatic muscle development(GO:0007525) |
| 1.1 | 10.3 | GO:1902261 | positive regulation of delayed rectifier potassium channel activity(GO:1902261) |
| 1.0 | 6.1 | GO:0021966 | corticospinal neuron axon guidance(GO:0021966) |
| 1.0 | 5.0 | GO:0014878 | response to electrical stimulus involved in regulation of muscle adaptation(GO:0014878) |
| 0.8 | 6.8 | GO:0031444 | slow-twitch skeletal muscle fiber contraction(GO:0031444) |
| 0.8 | 7.5 | GO:0014718 | positive regulation of satellite cell activation involved in skeletal muscle regeneration(GO:0014718) |
| 0.7 | 2.2 | GO:0099403 | negative regulation of maintenance of sister chromatid cohesion(GO:0034092) negative regulation of maintenance of mitotic sister chromatid cohesion(GO:0034183) maintenance of mitotic sister chromatid cohesion, telomeric(GO:0099403) mitotic sister chromatid cohesion, telomeric(GO:0099404) regulation of maintenance of mitotic sister chromatid cohesion, telomeric(GO:1904907) negative regulation of maintenance of mitotic sister chromatid cohesion, telomeric(GO:1904908) |
| 0.6 | 10.8 | GO:0042090 | interleukin-12 biosynthetic process(GO:0042090) regulation of interleukin-12 biosynthetic process(GO:0045075) |
| 0.6 | 3.2 | GO:1903028 | positive regulation of opsonization(GO:1903028) |
| 0.6 | 4.2 | GO:0018032 | protein amidation(GO:0018032) |
| 0.6 | 2.4 | GO:2000639 | regulation of SREBP signaling pathway(GO:2000638) negative regulation of SREBP signaling pathway(GO:2000639) |
| 0.5 | 2.6 | GO:0072709 | cellular response to sorbitol(GO:0072709) |
| 0.5 | 3.0 | GO:0000117 | regulation of transcription involved in G2/M transition of mitotic cell cycle(GO:0000117) |
| 0.5 | 6.9 | GO:0071313 | cellular response to caffeine(GO:0071313) |
| 0.5 | 1.4 | GO:0033869 | coenzyme A catabolic process(GO:0015938) nucleoside bisphosphate catabolic process(GO:0033869) ribonucleoside bisphosphate catabolic process(GO:0034031) purine nucleoside bisphosphate catabolic process(GO:0034034) |
| 0.5 | 1.9 | GO:1901675 | negative regulation of histone H3-K27 acetylation(GO:1901675) |
| 0.5 | 1.4 | GO:0016340 | calcium-dependent cell-matrix adhesion(GO:0016340) |
| 0.4 | 2.6 | GO:0098528 | skeletal muscle fiber differentiation(GO:0098528) |
| 0.4 | 4.3 | GO:0072513 | positive regulation of secondary heart field cardioblast proliferation(GO:0072513) |
| 0.4 | 4.7 | GO:0009972 | cytidine catabolic process(GO:0006216) cytidine deamination(GO:0009972) cytidine metabolic process(GO:0046087) |
| 0.3 | 1.0 | GO:0046416 | D-amino acid metabolic process(GO:0046416) |
| 0.3 | 19.5 | GO:0003009 | skeletal muscle contraction(GO:0003009) |
| 0.3 | 1.8 | GO:0032445 | fructose import(GO:0032445) carbohydrate import into cell(GO:0097319) carbohydrate import across plasma membrane(GO:0098704) fructose import across plasma membrane(GO:1990539) |
| 0.3 | 0.9 | GO:0071469 | detection of mechanical stimulus involved in sensory perception of touch(GO:0050976) cellular response to alkaline pH(GO:0071469) |
| 0.3 | 1.9 | GO:0001920 | negative regulation of receptor recycling(GO:0001920) |
| 0.3 | 2.9 | GO:0086024 | adrenergic receptor signaling pathway involved in positive regulation of heart rate(GO:0086024) |
| 0.2 | 4.7 | GO:1901387 | positive regulation of voltage-gated calcium channel activity(GO:1901387) |
| 0.2 | 5.6 | GO:0007021 | tubulin complex assembly(GO:0007021) |
| 0.2 | 0.9 | GO:0070460 | thyroid-stimulating hormone secretion(GO:0070460) regulation of thyroid-stimulating hormone secretion(GO:2000612) |
| 0.2 | 1.2 | GO:0002036 | regulation of L-glutamate transport(GO:0002036) |
| 0.2 | 1.2 | GO:0061086 | negative regulation of histone H3-K27 methylation(GO:0061086) |
| 0.2 | 1.4 | GO:1904207 | regulation of chemokine (C-C motif) ligand 2 secretion(GO:1904207) positive regulation of chemokine (C-C motif) ligand 2 secretion(GO:1904209) |
| 0.2 | 0.7 | GO:0036466 | synaptic vesicle recycling via endosome(GO:0036466) |
| 0.2 | 0.7 | GO:0035732 | nitric oxide storage(GO:0035732) |
| 0.2 | 1.3 | GO:0006740 | NADPH regeneration(GO:0006740) |
| 0.2 | 7.8 | GO:0070296 | sarcoplasmic reticulum calcium ion transport(GO:0070296) |
| 0.2 | 2.9 | GO:0046600 | negative regulation of centriole replication(GO:0046600) |
| 0.2 | 1.8 | GO:1901315 | negative regulation of histone ubiquitination(GO:0033183) regulation of histone H2A K63-linked ubiquitination(GO:1901314) negative regulation of histone H2A K63-linked ubiquitination(GO:1901315) |
| 0.2 | 1.8 | GO:0070236 | negative regulation of activation-induced cell death of T cells(GO:0070236) |
| 0.2 | 1.4 | GO:0006651 | diacylglycerol biosynthetic process(GO:0006651) |
| 0.2 | 1.0 | GO:0035022 | positive regulation of Rac protein signal transduction(GO:0035022) |
| 0.2 | 1.3 | GO:0086023 | adrenergic receptor signaling pathway involved in heart process(GO:0086023) |
| 0.2 | 0.7 | GO:1902954 | regulation of early endosome to recycling endosome transport(GO:1902954) |
| 0.2 | 0.5 | GO:0100057 | regulation of phenotypic switching by transcription from RNA polymerase II promoter(GO:0100057) regulation of hydrogen sulfide biosynthetic process(GO:1904826) positive regulation of hydrogen sulfide biosynthetic process(GO:1904828) |
| 0.2 | 3.1 | GO:0035994 | response to muscle stretch(GO:0035994) |
| 0.2 | 1.2 | GO:0090095 | regulation of metanephric cap mesenchymal cell proliferation(GO:0090095) positive regulation of metanephric cap mesenchymal cell proliferation(GO:0090096) |
| 0.2 | 0.8 | GO:0061026 | cardiac muscle tissue regeneration(GO:0061026) |
| 0.2 | 0.3 | GO:0021530 | spinal cord oligodendrocyte cell differentiation(GO:0021529) spinal cord oligodendrocyte cell fate specification(GO:0021530) |
| 0.2 | 8.0 | GO:0007026 | negative regulation of microtubule depolymerization(GO:0007026) |
| 0.2 | 7.8 | GO:0045663 | positive regulation of myoblast differentiation(GO:0045663) |
| 0.2 | 0.2 | GO:0010446 | response to alkaline pH(GO:0010446) |
| 0.2 | 4.8 | GO:0002026 | regulation of the force of heart contraction(GO:0002026) |
| 0.2 | 5.7 | GO:0060314 | regulation of ryanodine-sensitive calcium-release channel activity(GO:0060314) |
| 0.1 | 1.0 | GO:0021747 | cochlear nucleus development(GO:0021747) |
| 0.1 | 1.6 | GO:0072656 | maintenance of protein location in mitochondrion(GO:0072656) |
| 0.1 | 2.9 | GO:0061302 | smooth muscle cell-matrix adhesion(GO:0061302) |
| 0.1 | 1.3 | GO:0035494 | SNARE complex disassembly(GO:0035494) |
| 0.1 | 3.7 | GO:1904262 | negative regulation of TORC1 signaling(GO:1904262) |
| 0.1 | 0.4 | GO:0060151 | peroxisome localization(GO:0060151) microtubule-based peroxisome localization(GO:0060152) |
| 0.1 | 1.8 | GO:0097084 | vascular smooth muscle cell development(GO:0097084) |
| 0.1 | 3.9 | GO:0035988 | chondrocyte proliferation(GO:0035988) |
| 0.1 | 1.9 | GO:1903760 | regulation of voltage-gated potassium channel activity involved in ventricular cardiac muscle cell action potential repolarization(GO:1903760) regulation of potassium ion export across plasma membrane(GO:1903764) regulation of membrane repolarization during ventricular cardiac muscle cell action potential(GO:1905024) |
| 0.1 | 12.8 | GO:0030239 | myofibril assembly(GO:0030239) |
| 0.1 | 0.5 | GO:0036496 | regulation of translational initiation by eIF2 alpha dephosphorylation(GO:0036496) |
| 0.1 | 0.4 | GO:0070634 | transepithelial ammonium transport(GO:0070634) |
| 0.1 | 1.4 | GO:0061732 | mitochondrial acetyl-CoA biosynthetic process from pyruvate(GO:0061732) |
| 0.1 | 1.0 | GO:1903551 | regulation of extracellular exosome assembly(GO:1903551) |
| 0.1 | 11.3 | GO:0010830 | regulation of myotube differentiation(GO:0010830) |
| 0.1 | 2.2 | GO:0050879 | multicellular organismal movement(GO:0050879) musculoskeletal movement(GO:0050881) |
| 0.1 | 0.9 | GO:1900827 | positive regulation of cell communication by electrical coupling(GO:0010650) maintenance of protein location in membrane(GO:0072658) maintenance of protein location in plasma membrane(GO:0072660) positive regulation of membrane depolarization during cardiac muscle cell action potential(GO:1900827) |
| 0.1 | 8.2 | GO:0043268 | positive regulation of potassium ion transport(GO:0043268) |
| 0.1 | 0.8 | GO:0042539 | hypotonic salinity response(GO:0042539) cellular hypotonic salinity response(GO:0071477) |
| 0.1 | 2.2 | GO:0035090 | maintenance of apical/basal cell polarity(GO:0035090) maintenance of epithelial cell apical/basal polarity(GO:0045199) |
| 0.1 | 0.6 | GO:0044858 | plasma membrane raft distribution(GO:0044855) plasma membrane raft localization(GO:0044856) plasma membrane raft polarization(GO:0044858) regulation of plasma membrane raft polarization(GO:1903906) |
| 0.1 | 7.8 | GO:0006730 | one-carbon metabolic process(GO:0006730) |
| 0.1 | 1.3 | GO:2001288 | positive regulation of caveolin-mediated endocytosis(GO:2001288) |
| 0.1 | 0.6 | GO:1903862 | positive regulation of oxidative phosphorylation(GO:1903862) |
| 0.1 | 0.3 | GO:0010966 | regulation of phosphate transport(GO:0010966) |
| 0.1 | 0.6 | GO:0072752 | cellular response to rapamycin(GO:0072752) |
| 0.1 | 1.5 | GO:0014870 | response to muscle inactivity(GO:0014870) |
| 0.1 | 1.1 | GO:0046959 | habituation(GO:0046959) |
| 0.1 | 1.3 | GO:0000414 | regulation of histone H3-K36 methylation(GO:0000414) |
| 0.1 | 0.7 | GO:0060373 | regulation of ventricular cardiac muscle cell membrane depolarization(GO:0060373) |
| 0.1 | 0.4 | GO:1902683 | regulation of receptor localization to synapse(GO:1902683) |
| 0.1 | 1.4 | GO:0002191 | cap-dependent translational initiation(GO:0002191) |
| 0.1 | 0.8 | GO:0090063 | positive regulation of microtubule nucleation(GO:0090063) |
| 0.1 | 5.0 | GO:0007271 | synaptic transmission, cholinergic(GO:0007271) |
| 0.1 | 0.3 | GO:1904640 | response to methionine(GO:1904640) |
| 0.1 | 0.3 | GO:0070564 | positive regulation of vitamin D receptor signaling pathway(GO:0070564) |
| 0.1 | 0.9 | GO:0042791 | 5S class rRNA transcription from RNA polymerase III type 1 promoter(GO:0042791) tRNA transcription from RNA polymerase III promoter(GO:0042797) |
| 0.1 | 2.3 | GO:0045292 | mRNA cis splicing, via spliceosome(GO:0045292) |
| 0.1 | 0.5 | GO:1902774 | late endosome to lysosome transport(GO:1902774) |
| 0.1 | 0.3 | GO:0031106 | septin ring assembly(GO:0000921) septin ring organization(GO:0031106) |
| 0.1 | 0.4 | GO:0051562 | negative regulation of mitochondrial calcium ion concentration(GO:0051562) |
| 0.1 | 0.2 | GO:0036292 | DNA rewinding(GO:0036292) |
| 0.1 | 0.8 | GO:1901098 | positive regulation of autophagosome maturation(GO:1901098) |
| 0.1 | 0.1 | GO:2000974 | negative regulation of mechanoreceptor differentiation(GO:0045632) negative regulation of pro-B cell differentiation(GO:2000974) negative regulation of inner ear receptor cell differentiation(GO:2000981) |
| 0.1 | 0.2 | GO:0099526 | presynaptic signal transduction(GO:0098928) presynapse to nucleus signaling pathway(GO:0099526) |
| 0.1 | 0.2 | GO:0014734 | skeletal muscle hypertrophy(GO:0014734) |
| 0.1 | 0.2 | GO:1905075 | detection of oxygen(GO:0003032) occluding junction disassembly(GO:1905071) regulation of occluding junction disassembly(GO:1905073) positive regulation of occluding junction disassembly(GO:1905075) |
| 0.1 | 5.1 | GO:0032467 | positive regulation of cytokinesis(GO:0032467) |
| 0.1 | 0.3 | GO:0071442 | positive regulation of histone H3-K14 acetylation(GO:0071442) |
| 0.1 | 1.9 | GO:0033275 | muscle filament sliding(GO:0030049) actin-myosin filament sliding(GO:0033275) |
| 0.1 | 0.6 | GO:0061767 | negative regulation of lung blood pressure(GO:0061767) |
| 0.1 | 2.8 | GO:2000369 | regulation of clathrin-mediated endocytosis(GO:2000369) |
| 0.1 | 1.2 | GO:0033572 | transferrin transport(GO:0033572) |
| 0.1 | 2.4 | GO:0031581 | hemidesmosome assembly(GO:0031581) |
| 0.1 | 6.0 | GO:0000381 | regulation of alternative mRNA splicing, via spliceosome(GO:0000381) |
| 0.1 | 1.8 | GO:0008340 | determination of adult lifespan(GO:0008340) |
| 0.1 | 0.7 | GO:0006657 | CDP-choline pathway(GO:0006657) |
| 0.1 | 1.1 | GO:0044341 | sodium-dependent phosphate transport(GO:0044341) |
| 0.1 | 0.5 | GO:0097026 | dendritic cell dendrite assembly(GO:0097026) |
| 0.1 | 0.6 | GO:0032929 | negative regulation of superoxide anion generation(GO:0032929) |
| 0.1 | 0.4 | GO:2001045 | negative regulation of integrin-mediated signaling pathway(GO:2001045) |
| 0.1 | 2.8 | GO:0010738 | regulation of protein kinase A signaling(GO:0010738) |
| 0.1 | 0.2 | GO:0033140 | negative regulation of peptidyl-serine phosphorylation of STAT protein(GO:0033140) |
| 0.1 | 1.0 | GO:2000766 | negative regulation of cytoplasmic translation(GO:2000766) |
| 0.1 | 1.9 | GO:0090141 | positive regulation of mitochondrial fission(GO:0090141) |
| 0.1 | 0.8 | GO:0035871 | protein K11-linked deubiquitination(GO:0035871) |
| 0.1 | 1.2 | GO:0051386 | regulation of neurotrophin TRK receptor signaling pathway(GO:0051386) |
| 0.1 | 2.6 | GO:0046596 | regulation of viral entry into host cell(GO:0046596) |
| 0.1 | 4.8 | GO:0048384 | retinoic acid receptor signaling pathway(GO:0048384) |
| 0.1 | 0.7 | GO:0070543 | response to linoleic acid(GO:0070543) |
| 0.1 | 0.2 | GO:0014732 | skeletal muscle atrophy(GO:0014732) |
| 0.1 | 0.2 | GO:2000843 | testosterone secretion(GO:0035936) regulation of testosterone secretion(GO:2000843) positive regulation of testosterone secretion(GO:2000845) |
| 0.1 | 2.6 | GO:0003301 | physiological muscle hypertrophy(GO:0003298) physiological cardiac muscle hypertrophy(GO:0003301) cell growth involved in cardiac muscle cell development(GO:0061049) |
| 0.1 | 0.3 | GO:0007468 | regulation of rhodopsin gene expression(GO:0007468) |
| 0.1 | 0.7 | GO:0006268 | DNA unwinding involved in DNA replication(GO:0006268) |
| 0.1 | 13.7 | GO:0008286 | insulin receptor signaling pathway(GO:0008286) |
| 0.0 | 0.5 | GO:0032237 | activation of store-operated calcium channel activity(GO:0032237) positive regulation of store-operated calcium channel activity(GO:1901341) |
| 0.0 | 0.1 | GO:0046338 | phosphatidylethanolamine catabolic process(GO:0046338) |
| 0.0 | 1.1 | GO:0060019 | radial glial cell differentiation(GO:0060019) |
| 0.0 | 0.7 | GO:0070327 | thyroid hormone transport(GO:0070327) |
| 0.0 | 0.1 | GO:0014034 | neural crest cell fate commitment(GO:0014034) |
| 0.0 | 0.7 | GO:0015727 | lactate transport(GO:0015727) lactate transmembrane transport(GO:0035873) |
| 0.0 | 0.2 | GO:1902045 | negative regulation of Fas signaling pathway(GO:1902045) |
| 0.0 | 0.6 | GO:0001833 | inner cell mass cell proliferation(GO:0001833) |
| 0.0 | 0.0 | GO:0023021 | termination of signal transduction(GO:0023021) |
| 0.0 | 0.3 | GO:1901029 | negative regulation of mitochondrial outer membrane permeabilization involved in apoptotic signaling pathway(GO:1901029) |
| 0.0 | 0.2 | GO:0006344 | maintenance of chromatin silencing(GO:0006344) |
| 0.0 | 2.2 | GO:0060612 | adipose tissue development(GO:0060612) |
| 0.0 | 0.2 | GO:1904428 | negative regulation of tubulin deacetylation(GO:1904428) |
| 0.0 | 5.8 | GO:0043271 | negative regulation of ion transport(GO:0043271) |
| 0.0 | 5.5 | GO:0007519 | skeletal muscle tissue development(GO:0007519) |
| 0.0 | 1.8 | GO:0051973 | positive regulation of telomerase activity(GO:0051973) |
| 0.0 | 1.0 | GO:0006895 | Golgi to endosome transport(GO:0006895) |
| 0.0 | 0.8 | GO:0045116 | protein neddylation(GO:0045116) |
| 0.0 | 0.4 | GO:1990440 | positive regulation of transcription from RNA polymerase II promoter in response to endoplasmic reticulum stress(GO:1990440) |
| 0.0 | 0.3 | GO:0030263 | apoptotic chromosome condensation(GO:0030263) |
| 0.0 | 1.0 | GO:0007597 | blood coagulation, intrinsic pathway(GO:0007597) |
| 0.0 | 0.4 | GO:0016559 | peroxisome fission(GO:0016559) |
| 0.0 | 0.2 | GO:0051643 | endoplasmic reticulum localization(GO:0051643) |
| 0.0 | 0.3 | GO:0048845 | venous blood vessel morphogenesis(GO:0048845) |
| 0.0 | 1.9 | GO:0051496 | positive regulation of stress fiber assembly(GO:0051496) |
| 0.0 | 1.6 | GO:0006198 | cAMP catabolic process(GO:0006198) |
| 0.0 | 0.2 | GO:0097476 | spinal cord motor neuron migration(GO:0097476) |
| 0.0 | 0.1 | GO:0097475 | motor neuron migration(GO:0097475) |
| 0.0 | 0.1 | GO:1900111 | positive regulation of histone H3-K9 dimethylation(GO:1900111) |
| 0.0 | 0.7 | GO:0070932 | histone H3 deacetylation(GO:0070932) |
| 0.0 | 0.1 | GO:0071283 | regulation of chromosome condensation(GO:0060623) cellular response to iron(III) ion(GO:0071283) |
| 0.0 | 0.4 | GO:0015747 | urate transport(GO:0015747) |
| 0.0 | 0.7 | GO:0003334 | keratinocyte development(GO:0003334) |
| 0.0 | 2.6 | GO:0097031 | NADH dehydrogenase complex assembly(GO:0010257) mitochondrial respiratory chain complex I assembly(GO:0032981) mitochondrial respiratory chain complex I biogenesis(GO:0097031) |
| 0.0 | 0.1 | GO:0036369 | transcription factor catabolic process(GO:0036369) |
| 0.0 | 0.3 | GO:0060017 | parathyroid gland development(GO:0060017) |
| 0.0 | 0.6 | GO:0036010 | protein localization to endosome(GO:0036010) |
| 0.0 | 0.4 | GO:0021796 | cerebral cortex regionalization(GO:0021796) |
| 0.0 | 0.4 | GO:0035542 | regulation of SNARE complex assembly(GO:0035542) |
| 0.0 | 0.4 | GO:0051775 | response to redox state(GO:0051775) |
| 0.0 | 1.1 | GO:0005980 | glycogen catabolic process(GO:0005980) |
| 0.0 | 0.1 | GO:1900108 | inner medullary collecting duct development(GO:0072061) negative regulation of nodal signaling pathway(GO:1900108) |
| 0.0 | 0.6 | GO:0006123 | mitochondrial electron transport, cytochrome c to oxygen(GO:0006123) |
| 0.0 | 0.5 | GO:0070584 | mitochondrion morphogenesis(GO:0070584) |
| 0.0 | 0.4 | GO:0031111 | negative regulation of microtubule polymerization or depolymerization(GO:0031111) |
| 0.0 | 0.2 | GO:0035973 | aggrephagy(GO:0035973) |
| 0.0 | 0.6 | GO:0007216 | G-protein coupled glutamate receptor signaling pathway(GO:0007216) |
| 0.0 | 0.4 | GO:0018026 | peptidyl-lysine monomethylation(GO:0018026) |
| 0.0 | 4.2 | GO:0030518 | intracellular steroid hormone receptor signaling pathway(GO:0030518) |
| 0.0 | 0.3 | GO:2000251 | positive regulation of actin cytoskeleton reorganization(GO:2000251) |
| 0.0 | 0.3 | GO:0007172 | signal complex assembly(GO:0007172) |
| 0.0 | 0.2 | GO:0006013 | mannose metabolic process(GO:0006013) |
| 0.0 | 0.3 | GO:1900745 | positive regulation of p38MAPK cascade(GO:1900745) |
| 0.0 | 0.7 | GO:0010107 | potassium ion import(GO:0010107) |
| 0.0 | 0.5 | GO:0031116 | positive regulation of microtubule polymerization or depolymerization(GO:0031112) positive regulation of microtubule polymerization(GO:0031116) |
| 0.0 | 0.9 | GO:0010591 | regulation of lamellipodium assembly(GO:0010591) |
| 0.0 | 0.2 | GO:0030091 | protein repair(GO:0030091) |
| 0.0 | 0.3 | GO:0045974 | miRNA mediated inhibition of translation(GO:0035278) negative regulation of translation, ncRNA-mediated(GO:0040033) regulation of translation, ncRNA-mediated(GO:0045974) |
| 0.0 | 2.0 | GO:0032436 | positive regulation of proteasomal ubiquitin-dependent protein catabolic process(GO:0032436) |
| 0.0 | 0.1 | GO:0007198 | adenylate cyclase-inhibiting serotonin receptor signaling pathway(GO:0007198) |
| 0.0 | 0.1 | GO:0097498 | endothelial tube lumen extension(GO:0097498) |
| 0.0 | 0.8 | GO:0048488 | synaptic vesicle endocytosis(GO:0048488) |
| 0.0 | 0.2 | GO:0030238 | male sex determination(GO:0030238) |
| 0.0 | 0.4 | GO:0000470 | maturation of LSU-rRNA(GO:0000470) |
| 0.0 | 1.3 | GO:0046847 | filopodium assembly(GO:0046847) |
| 0.0 | 0.1 | GO:0001575 | globoside metabolic process(GO:0001575) |
| 0.0 | 0.2 | GO:1902083 | negative regulation of peptidyl-cysteine S-nitrosylation(GO:1902083) |
| 0.0 | 0.9 | GO:0007077 | mitotic nuclear envelope disassembly(GO:0007077) |
| 0.0 | 0.2 | GO:0051382 | kinetochore assembly(GO:0051382) |
| 0.0 | 0.5 | GO:0019433 | triglyceride catabolic process(GO:0019433) |
Gene overrepresentation in cellular component category:
| Log-likelihood per target | Total log-likelihood | Term | Description |
|---|---|---|---|
| 0.8 | 16.0 | GO:0014701 | junctional sarcoplasmic reticulum membrane(GO:0014701) |
| 0.8 | 5.0 | GO:1990584 | cardiac Troponin complex(GO:1990584) |
| 0.8 | 25.9 | GO:0005892 | acetylcholine-gated channel complex(GO:0005892) |
| 0.5 | 7.1 | GO:0005861 | troponin complex(GO:0005861) |
| 0.5 | 0.5 | GO:0034750 | Scrib-APC-beta-catenin complex(GO:0034750) |
| 0.4 | 5.6 | GO:0097512 | cardiac myofibril(GO:0097512) |
| 0.4 | 19.5 | GO:0005859 | muscle myosin complex(GO:0005859) |
| 0.4 | 1.4 | GO:0097629 | extrinsic component of omegasome membrane(GO:0097629) |
| 0.3 | 2.4 | GO:1990452 | Parkin-FBXW7-Cul1 ubiquitin ligase complex(GO:1990452) |
| 0.3 | 2.6 | GO:1990635 | proximal dendrite(GO:1990635) |
| 0.3 | 3.2 | GO:0016011 | dystroglycan complex(GO:0016011) |
| 0.3 | 12.1 | GO:0016010 | dystrophin-associated glycoprotein complex(GO:0016010) glycoprotein complex(GO:0090665) |
| 0.2 | 12.2 | GO:0031430 | M band(GO:0031430) |
| 0.2 | 5.1 | GO:0036449 | microtubule minus-end(GO:0036449) |
| 0.2 | 6.7 | GO:0001518 | voltage-gated sodium channel complex(GO:0001518) |
| 0.2 | 0.8 | GO:1902912 | pyruvate kinase complex(GO:1902912) |
| 0.2 | 5.1 | GO:0097431 | mitotic spindle pole(GO:0097431) |
| 0.2 | 4.8 | GO:1990454 | L-type voltage-gated calcium channel complex(GO:1990454) |
| 0.2 | 6.5 | GO:0031143 | pseudopodium(GO:0031143) |
| 0.2 | 3.7 | GO:0061700 | GATOR2 complex(GO:0061700) |
| 0.2 | 5.2 | GO:0031672 | A band(GO:0031672) |
| 0.2 | 10.3 | GO:0005891 | voltage-gated calcium channel complex(GO:0005891) |
| 0.2 | 0.9 | GO:0005899 | insulin receptor complex(GO:0005899) |
| 0.2 | 1.0 | GO:0033565 | ESCRT-0 complex(GO:0033565) |
| 0.2 | 0.7 | GO:0097057 | TRAF2-GSTP1 complex(GO:0097057) |
| 0.2 | 44.8 | GO:0030017 | sarcomere(GO:0030017) |
| 0.1 | 3.3 | GO:0043034 | costamere(GO:0043034) |
| 0.1 | 1.8 | GO:0033269 | internode region of axon(GO:0033269) |
| 0.1 | 1.5 | GO:0045254 | pyruvate dehydrogenase complex(GO:0045254) |
| 0.1 | 0.5 | GO:0045323 | interleukin-1 receptor complex(GO:0045323) |
| 0.1 | 0.9 | GO:0071595 | Nem1-Spo7 phosphatase complex(GO:0071595) |
| 0.1 | 1.0 | GO:0000138 | Golgi trans cisterna(GO:0000138) |
| 0.1 | 1.6 | GO:0030123 | AP-3 adaptor complex(GO:0030123) |
| 0.1 | 1.9 | GO:0097025 | MPP7-DLG1-LIN7 complex(GO:0097025) |
| 0.1 | 0.9 | GO:0000127 | transcription factor TFIIIC complex(GO:0000127) |
| 0.1 | 0.5 | GO:0042272 | nuclear RNA export factor complex(GO:0042272) |
| 0.1 | 0.8 | GO:0000220 | vacuolar proton-transporting V-type ATPase, V0 domain(GO:0000220) |
| 0.1 | 0.2 | GO:0099569 | cytoskeleton of presynaptic active zone(GO:0048788) presynaptic active zone cytoplasmic component(GO:0098831) presynaptic cytoskeleton(GO:0099569) |
| 0.1 | 1.9 | GO:0016580 | Sin3 complex(GO:0016580) |
| 0.1 | 0.8 | GO:0060171 | stereocilium membrane(GO:0060171) |
| 0.1 | 0.7 | GO:0016602 | CCAAT-binding factor complex(GO:0016602) |
| 0.1 | 0.6 | GO:0033179 | proton-transporting V-type ATPase, V0 domain(GO:0033179) |
| 0.1 | 0.4 | GO:0070545 | PeBoW complex(GO:0070545) |
| 0.1 | 0.3 | GO:0070044 | synaptobrevin 2-SNAP-25-syntaxin-1a complex(GO:0070044) |
| 0.1 | 2.2 | GO:0031307 | integral component of mitochondrial outer membrane(GO:0031307) |
| 0.1 | 7.0 | GO:0034707 | chloride channel complex(GO:0034707) |
| 0.1 | 0.8 | GO:0005869 | dynactin complex(GO:0005869) |
| 0.1 | 0.7 | GO:0071203 | WASH complex(GO:0071203) |
| 0.0 | 3.6 | GO:0031907 | peroxisomal matrix(GO:0005782) microbody lumen(GO:0031907) |
| 0.0 | 0.9 | GO:0042555 | MCM complex(GO:0042555) |
| 0.0 | 1.2 | GO:0016281 | eukaryotic translation initiation factor 4F complex(GO:0016281) |
| 0.0 | 2.4 | GO:0080008 | Cul4-RING E3 ubiquitin ligase complex(GO:0080008) |
| 0.0 | 1.4 | GO:0035327 | transcriptionally active chromatin(GO:0035327) |
| 0.0 | 0.3 | GO:0005826 | actomyosin contractile ring(GO:0005826) |
| 0.0 | 0.6 | GO:0071144 | SMAD2-SMAD3 protein complex(GO:0071144) |
| 0.0 | 4.6 | GO:0031463 | Cul3-RING ubiquitin ligase complex(GO:0031463) |
| 0.0 | 1.6 | GO:0097228 | sperm principal piece(GO:0097228) |
| 0.0 | 0.5 | GO:0042587 | glycogen granule(GO:0042587) PTW/PP1 phosphatase complex(GO:0072357) |
| 0.0 | 0.6 | GO:0031931 | TORC1 complex(GO:0031931) |
| 0.0 | 0.6 | GO:0032541 | cortical endoplasmic reticulum(GO:0032541) |
| 0.0 | 0.6 | GO:0030478 | actin cap(GO:0030478) |
| 0.0 | 0.2 | GO:0034274 | Atg12-Atg5-Atg16 complex(GO:0034274) |
| 0.0 | 0.7 | GO:0016342 | catenin complex(GO:0016342) |
| 0.0 | 0.6 | GO:0005751 | mitochondrial respiratory chain complex IV(GO:0005751) |
| 0.0 | 0.4 | GO:0044233 | ER-mitochondrion membrane contact site(GO:0044233) |
| 0.0 | 0.7 | GO:0032433 | filopodium tip(GO:0032433) |
| 0.0 | 0.5 | GO:0005845 | mRNA cap binding complex(GO:0005845) |
| 0.0 | 0.3 | GO:0061574 | ASAP complex(GO:0061574) |
| 0.0 | 0.2 | GO:0033268 | node of Ranvier(GO:0033268) |
| 0.0 | 0.9 | GO:0030686 | 90S preribosome(GO:0030686) |
| 0.0 | 1.0 | GO:1990124 | messenger ribonucleoprotein complex(GO:1990124) |
| 0.0 | 3.2 | GO:0005776 | autophagosome(GO:0005776) |
| 0.0 | 0.4 | GO:0097451 | glial limiting end-foot(GO:0097451) |
| 0.0 | 2.3 | GO:0005746 | mitochondrial respiratory chain(GO:0005746) |
| 0.0 | 0.1 | GO:0097125 | cyclin B1-CDK1 complex(GO:0097125) |
| 0.0 | 0.2 | GO:0031462 | Cul2-RING ubiquitin ligase complex(GO:0031462) |
| 0.0 | 0.6 | GO:0046930 | pore complex(GO:0046930) |
| 0.0 | 3.8 | GO:0035579 | specific granule membrane(GO:0035579) |
| 0.0 | 6.7 | GO:0005802 | trans-Golgi network(GO:0005802) |
| 0.0 | 3.6 | GO:0034705 | potassium channel complex(GO:0034705) |
| 0.0 | 0.2 | GO:0046696 | lipopolysaccharide receptor complex(GO:0046696) |
| 0.0 | 0.4 | GO:0005779 | integral component of peroxisomal membrane(GO:0005779) intrinsic component of peroxisomal membrane(GO:0031231) |
| 0.0 | 0.7 | GO:0014704 | intercalated disc(GO:0014704) |
| 0.0 | 0.5 | GO:0097440 | apical dendrite(GO:0097440) |
| 0.0 | 0.4 | GO:0000145 | exocyst(GO:0000145) |
| 0.0 | 0.2 | GO:0071541 | eukaryotic translation initiation factor 3 complex, eIF3m(GO:0071541) |
| 0.0 | 0.2 | GO:0030315 | T-tubule(GO:0030315) |
| 0.0 | 1.1 | GO:0016529 | sarcoplasmic reticulum(GO:0016529) |
| 0.0 | 0.3 | GO:0097038 | perinuclear endoplasmic reticulum(GO:0097038) |
| 0.0 | 1.1 | GO:0043198 | dendritic shaft(GO:0043198) |
| 0.0 | 0.2 | GO:0043596 | nuclear replication fork(GO:0043596) |
| 0.0 | 3.4 | GO:0005741 | mitochondrial outer membrane(GO:0005741) |
| 0.0 | 1.2 | GO:0043195 | terminal bouton(GO:0043195) |
| 0.0 | 0.8 | GO:0048786 | presynaptic active zone(GO:0048786) |
| 0.0 | 0.9 | GO:1904724 | tertiary granule lumen(GO:1904724) |
| 0.0 | 0.7 | GO:0019005 | SCF ubiquitin ligase complex(GO:0019005) |
| 0.0 | 0.3 | GO:0035371 | microtubule plus-end(GO:0035371) |
| 0.0 | 2.4 | GO:0032993 | protein-DNA complex(GO:0032993) |
Gene overrepresentation in molecular function category:
| Log-likelihood per target | Total log-likelihood | Term | Description |
|---|---|---|---|
| 1.2 | 6.1 | GO:0086062 | voltage-gated sodium channel activity involved in Purkinje myocyte action potential(GO:0086062) |
| 1.0 | 3.1 | GO:0061629 | RNA polymerase II sequence-specific DNA binding transcription factor binding(GO:0061629) |
| 0.9 | 9.5 | GO:0004687 | myosin light chain kinase activity(GO:0004687) |
| 0.9 | 5.4 | GO:0030172 | troponin C binding(GO:0030172) |
| 0.9 | 25.9 | GO:0022848 | acetylcholine-gated cation channel activity(GO:0022848) |
| 0.9 | 5.1 | GO:0032038 | myosin II heavy chain binding(GO:0032038) |
| 0.8 | 8.4 | GO:0071253 | connexin binding(GO:0071253) |
| 0.7 | 12.2 | GO:0031433 | telethonin binding(GO:0031433) |
| 0.6 | 4.2 | GO:0004504 | peptidylglycine monooxygenase activity(GO:0004504) peptidylamidoglycolate lyase activity(GO:0004598) |
| 0.6 | 3.5 | GO:0031013 | troponin I binding(GO:0031013) |
| 0.5 | 13.5 | GO:0031432 | titin binding(GO:0031432) |
| 0.5 | 4.7 | GO:0004126 | cytidine deaminase activity(GO:0004126) |
| 0.4 | 1.3 | GO:0016652 | NAD(P)+ transhydrogenase activity(GO:0008746) oxidoreductase activity, acting on NAD(P)H, NAD(P) as acceptor(GO:0016652) |
| 0.4 | 10.3 | GO:0008179 | adenylate cyclase binding(GO:0008179) |
| 0.4 | 4.0 | GO:0050682 | AF-2 domain binding(GO:0050682) |
| 0.4 | 7.8 | GO:0004089 | carbonate dehydratase activity(GO:0004089) |
| 0.4 | 1.1 | GO:0033842 | N-acetyl-beta-glucosaminyl-glycoprotein 4-beta-N-acetylgalactosaminyltransferase activity(GO:0033842) |
| 0.3 | 3.2 | GO:0031014 | troponin T binding(GO:0031014) |
| 0.3 | 2.4 | GO:0050816 | phosphothreonine binding(GO:0050816) |
| 0.3 | 6.8 | GO:0005344 | oxygen transporter activity(GO:0005344) |
| 0.3 | 1.8 | GO:0005353 | fructose transmembrane transporter activity(GO:0005353) |
| 0.3 | 0.9 | GO:0097604 | temperature-gated cation channel activity(GO:0097604) |
| 0.3 | 3.7 | GO:0034618 | arginine binding(GO:0034618) |
| 0.3 | 8.4 | GO:0051371 | muscle alpha-actinin binding(GO:0051371) |
| 0.3 | 27.3 | GO:0008307 | structural constituent of muscle(GO:0008307) |
| 0.2 | 1.1 | GO:0004886 | 9-cis retinoic acid receptor activity(GO:0004886) |
| 0.2 | 0.7 | GO:0035731 | S-nitrosoglutathione binding(GO:0035730) dinitrosyl-iron complex binding(GO:0035731) |
| 0.2 | 1.9 | GO:0043426 | MRF binding(GO:0043426) |
| 0.2 | 1.2 | GO:0072345 | NAADP-sensitive calcium-release channel activity(GO:0072345) |
| 0.2 | 5.7 | GO:0005212 | structural constituent of eye lens(GO:0005212) |
| 0.2 | 0.7 | GO:0016639 | oxidoreductase activity, acting on the CH-NH2 group of donors, NAD or NADP as acceptor(GO:0016639) |
| 0.2 | 0.9 | GO:0017153 | sodium:dicarboxylate symporter activity(GO:0017153) |
| 0.2 | 1.5 | GO:0034604 | pyruvate dehydrogenase activity(GO:0004738) pyruvate dehydrogenase [NAD(P)+] activity(GO:0034603) pyruvate dehydrogenase (NAD+) activity(GO:0034604) |
| 0.2 | 1.3 | GO:0008454 | alpha-1,3-mannosylglycoprotein 4-beta-N-acetylglucosaminyltransferase activity(GO:0008454) |
| 0.2 | 5.4 | GO:0044548 | S100 protein binding(GO:0044548) |
| 0.2 | 1.6 | GO:0004396 | glucokinase activity(GO:0004340) hexokinase activity(GO:0004396) fructokinase activity(GO:0008865) mannokinase activity(GO:0019158) |
| 0.2 | 2.9 | GO:0038062 | protein tyrosine kinase collagen receptor activity(GO:0038062) |
| 0.2 | 3.4 | GO:0001206 | transcriptional repressor activity, RNA polymerase II distal enhancer sequence-specific binding(GO:0001206) |
| 0.2 | 12.2 | GO:0005245 | voltage-gated calcium channel activity(GO:0005245) |
| 0.2 | 0.5 | GO:0005150 | interleukin-1, Type I receptor binding(GO:0005150) |
| 0.2 | 1.7 | GO:0016286 | small conductance calcium-activated potassium channel activity(GO:0016286) |
| 0.1 | 0.4 | GO:0052816 | medium-chain acyl-CoA hydrolase activity(GO:0052815) long-chain acyl-CoA hydrolase activity(GO:0052816) |
| 0.1 | 0.7 | GO:0004105 | choline-phosphate cytidylyltransferase activity(GO:0004105) |
| 0.1 | 4.3 | GO:0070016 | armadillo repeat domain binding(GO:0070016) |
| 0.1 | 0.7 | GO:0086006 | voltage-gated sodium channel activity involved in cardiac muscle cell action potential(GO:0086006) |
| 0.1 | 1.2 | GO:0015319 | sodium:inorganic phosphate symporter activity(GO:0015319) |
| 0.1 | 4.9 | GO:0070064 | proline-rich region binding(GO:0070064) |
| 0.1 | 0.8 | GO:0004743 | pyruvate kinase activity(GO:0004743) |
| 0.1 | 0.9 | GO:0004996 | thyroid-stimulating hormone receptor activity(GO:0004996) |
| 0.1 | 2.0 | GO:0035612 | AP-2 adaptor complex binding(GO:0035612) |
| 0.1 | 2.0 | GO:0008093 | cytoskeletal adaptor activity(GO:0008093) |
| 0.1 | 0.7 | GO:0004719 | protein-L-isoaspartate (D-aspartate) O-methyltransferase activity(GO:0004719) |
| 0.1 | 0.7 | GO:0042030 | ATPase inhibitor activity(GO:0042030) |
| 0.1 | 0.7 | GO:0003998 | acylphosphatase activity(GO:0003998) |
| 0.1 | 1.3 | GO:0042799 | histone methyltransferase activity (H4-K20 specific)(GO:0042799) |
| 0.1 | 8.2 | GO:0018024 | histone-lysine N-methyltransferase activity(GO:0018024) |
| 0.1 | 1.3 | GO:0019871 | sodium channel inhibitor activity(GO:0019871) |
| 0.1 | 1.9 | GO:0097016 | L27 domain binding(GO:0097016) |
| 0.1 | 2.9 | GO:0031698 | beta-2 adrenergic receptor binding(GO:0031698) |
| 0.1 | 3.2 | GO:0098641 | cadherin binding involved in cell-cell adhesion(GO:0098641) |
| 0.1 | 0.3 | GO:0010698 | acetyltransferase activator activity(GO:0010698) |
| 0.1 | 1.1 | GO:0090599 | alpha-glucosidase activity(GO:0090599) |
| 0.1 | 1.2 | GO:0000990 | transcription factor activity, core RNA polymerase binding(GO:0000990) |
| 0.1 | 1.2 | GO:0086008 | voltage-gated potassium channel activity involved in cardiac muscle cell action potential repolarization(GO:0086008) |
| 0.1 | 0.7 | GO:0019788 | NEDD8 transferase activity(GO:0019788) |
| 0.1 | 2.8 | GO:0005388 | calcium-transporting ATPase activity(GO:0005388) |
| 0.1 | 2.7 | GO:0034237 | protein kinase A regulatory subunit binding(GO:0034237) |
| 0.1 | 0.7 | GO:0099580 | ion antiporter activity involved in regulation of postsynaptic membrane potential(GO:0099580) |
| 0.1 | 1.8 | GO:0015467 | G-protein activated inward rectifier potassium channel activity(GO:0015467) |
| 0.1 | 0.6 | GO:0031962 | mineralocorticoid receptor binding(GO:0031962) |
| 0.1 | 0.6 | GO:0045159 | myosin II binding(GO:0045159) |
| 0.1 | 1.3 | GO:0004691 | cAMP-dependent protein kinase activity(GO:0004691) |
| 0.1 | 2.6 | GO:0004708 | MAP kinase kinase activity(GO:0004708) |
| 0.1 | 0.7 | GO:0060002 | plus-end directed microfilament motor activity(GO:0060002) |
| 0.1 | 0.7 | GO:0070892 | lipoteichoic acid receptor activity(GO:0070892) |
| 0.1 | 1.8 | GO:0008190 | eukaryotic initiation factor 4E binding(GO:0008190) |
| 0.1 | 1.0 | GO:0017166 | vinculin binding(GO:0017166) |
| 0.1 | 8.7 | GO:0003730 | mRNA 3'-UTR binding(GO:0003730) |
| 0.1 | 0.5 | GO:0034046 | poly(G) binding(GO:0034046) |
| 0.1 | 0.2 | GO:0005483 | soluble NSF attachment protein activity(GO:0005483) |
| 0.1 | 0.4 | GO:0015277 | kainate selective glutamate receptor activity(GO:0015277) |
| 0.0 | 0.3 | GO:0001515 | opioid peptide activity(GO:0001515) |
| 0.0 | 1.4 | GO:0097602 | cullin family protein binding(GO:0097602) |
| 0.0 | 2.1 | GO:0004115 | 3',5'-cyclic-AMP phosphodiesterase activity(GO:0004115) |
| 0.0 | 0.7 | GO:0015129 | lactate transmembrane transporter activity(GO:0015129) |
| 0.0 | 0.8 | GO:0022820 | potassium:chloride symporter activity(GO:0015379) potassium ion symporter activity(GO:0022820) |
| 0.0 | 3.2 | GO:0043531 | ADP binding(GO:0043531) |
| 0.0 | 2.0 | GO:0031624 | ubiquitin conjugating enzyme binding(GO:0031624) |
| 0.0 | 2.1 | GO:0070530 | K63-linked polyubiquitin binding(GO:0070530) |
| 0.0 | 12.6 | GO:0017124 | SH3 domain binding(GO:0017124) |
| 0.0 | 1.5 | GO:0004190 | aspartic-type endopeptidase activity(GO:0004190) |
| 0.0 | 0.9 | GO:0003680 | AT DNA binding(GO:0003680) |
| 0.0 | 2.1 | GO:0046966 | thyroid hormone receptor binding(GO:0046966) |
| 0.0 | 1.3 | GO:0046961 | ATPase activity, coupled to transmembrane movement of ions, rotational mechanism(GO:0044769) proton-transporting ATPase activity, rotational mechanism(GO:0046961) |
| 0.0 | 0.6 | GO:0051434 | BH3 domain binding(GO:0051434) |
| 0.0 | 0.2 | GO:0098808 | mRNA cap binding(GO:0098808) |
| 0.0 | 1.8 | GO:0004003 | ATP-dependent DNA helicase activity(GO:0004003) |
| 0.0 | 0.2 | GO:0034714 | type III transforming growth factor beta receptor binding(GO:0034714) |
| 0.0 | 17.7 | GO:0008017 | microtubule binding(GO:0008017) |
| 0.0 | 2.0 | GO:0001103 | RNA polymerase II repressing transcription factor binding(GO:0001103) |
| 0.0 | 0.6 | GO:0048156 | tau protein binding(GO:0048156) |
| 0.0 | 0.4 | GO:0019869 | chloride channel inhibitor activity(GO:0019869) |
| 0.0 | 5.6 | GO:0005254 | chloride channel activity(GO:0005254) |
| 0.0 | 0.2 | GO:0032027 | myosin light chain binding(GO:0032027) |
| 0.0 | 0.6 | GO:0004716 | receptor signaling protein tyrosine kinase activity(GO:0004716) |
| 0.0 | 4.1 | GO:0043130 | ubiquitin binding(GO:0043130) |
| 0.0 | 0.8 | GO:0004143 | diacylglycerol kinase activity(GO:0004143) |
| 0.0 | 1.0 | GO:0043325 | phosphatidylinositol-3,4-bisphosphate binding(GO:0043325) |
| 0.0 | 1.4 | GO:0004712 | protein serine/threonine/tyrosine kinase activity(GO:0004712) |
| 0.0 | 1.4 | GO:0004435 | phosphatidylinositol phospholipase C activity(GO:0004435) |
| 0.0 | 0.1 | GO:0061575 | cyclin-dependent protein serine/threonine kinase activator activity(GO:0061575) |
| 0.0 | 0.7 | GO:0008242 | omega peptidase activity(GO:0008242) |
| 0.0 | 1.1 | GO:0004806 | triglyceride lipase activity(GO:0004806) |
| 0.0 | 0.3 | GO:1901612 | cardiolipin binding(GO:1901612) |
| 0.0 | 1.0 | GO:0071949 | FAD binding(GO:0071949) |
| 0.0 | 1.7 | GO:0035255 | ionotropic glutamate receptor binding(GO:0035255) |
| 0.0 | 0.4 | GO:0045295 | gamma-catenin binding(GO:0045295) |
| 0.0 | 5.3 | GO:0044325 | ion channel binding(GO:0044325) |
| 0.0 | 0.6 | GO:0035256 | G-protein coupled glutamate receptor binding(GO:0035256) |
| 0.0 | 1.1 | GO:0003950 | NAD+ ADP-ribosyltransferase activity(GO:0003950) |
| 0.0 | 0.3 | GO:0004457 | lactate dehydrogenase activity(GO:0004457) |
| 0.0 | 0.2 | GO:0005522 | profilin binding(GO:0005522) |
| 0.0 | 0.1 | GO:0004176 | ATP-dependent peptidase activity(GO:0004176) |
| 0.0 | 0.4 | GO:0019911 | structural constituent of myelin sheath(GO:0019911) |
| 0.0 | 0.2 | GO:0047134 | protein-disulfide reductase activity(GO:0047134) |
| 0.0 | 3.9 | GO:0004725 | protein tyrosine phosphatase activity(GO:0004725) |
| 0.0 | 1.2 | GO:0030374 | ligand-dependent nuclear receptor transcription coactivator activity(GO:0030374) |
| 0.0 | 0.1 | GO:0070984 | SET domain binding(GO:0070984) |
| 0.0 | 1.2 | GO:0008137 | NADH dehydrogenase (ubiquinone) activity(GO:0008137) NADH dehydrogenase (quinone) activity(GO:0050136) |
| 0.0 | 1.4 | GO:0016831 | carboxy-lyase activity(GO:0016831) |
| 0.0 | 4.5 | GO:0044822 | mRNA binding(GO:0003729) poly(A) RNA binding(GO:0044822) |
| 0.0 | 3.9 | GO:0005089 | Rho guanyl-nucleotide exchange factor activity(GO:0005089) |
| 0.0 | 0.6 | GO:0016676 | cytochrome-c oxidase activity(GO:0004129) heme-copper terminal oxidase activity(GO:0015002) oxidoreductase activity, acting on a heme group of donors, oxygen as acceptor(GO:0016676) |
| 0.0 | 0.7 | GO:0001784 | phosphotyrosine binding(GO:0001784) |
| 0.0 | 2.7 | GO:0019888 | protein phosphatase regulator activity(GO:0019888) |
| 0.0 | 0.1 | GO:0042296 | ISG15 transferase activity(GO:0042296) |
| 0.0 | 0.4 | GO:0033038 | bitter taste receptor activity(GO:0033038) |
| 0.0 | 0.4 | GO:0015101 | organic cation transmembrane transporter activity(GO:0015101) |
| 0.0 | 0.3 | GO:0005049 | nuclear export signal receptor activity(GO:0005049) |
| 0.0 | 0.1 | GO:1990226 | histone methyltransferase binding(GO:1990226) |
| 0.0 | 0.1 | GO:0060072 | large conductance calcium-activated potassium channel activity(GO:0060072) |
| 0.0 | 0.0 | GO:0008502 | melatonin receptor activity(GO:0008502) |
| 0.0 | 0.1 | GO:0004741 | [pyruvate dehydrogenase (lipoamide)] phosphatase activity(GO:0004741) |
| 0.0 | 0.6 | GO:0071889 | 14-3-3 protein binding(GO:0071889) |
| 0.0 | 1.0 | GO:0004402 | histone acetyltransferase activity(GO:0004402) |
| 0.0 | 0.1 | GO:0047499 | calcium-independent phospholipase A2 activity(GO:0047499) |
| 0.0 | 6.7 | GO:0004842 | ubiquitin-protein transferase activity(GO:0004842) |
| 0.0 | 0.6 | GO:0042162 | telomeric DNA binding(GO:0042162) |
Gene overrepresentation in curated gene sets: canonical pathways category:
| Log-likelihood per target | Total log-likelihood | Term | Description |
|---|---|---|---|
| 0.2 | 9.7 | ST MYOCYTE AD PATHWAY | Myocyte Adrenergic Pathway is a specific case of the generalized Adrenergic Pathway. |
| 0.1 | 15.1 | PID ERBB2 ERBB3 PATHWAY | ErbB2/ErbB3 signaling events |
| 0.1 | 10.8 | SIG CHEMOTAXIS | Genes related to chemotaxis |
| 0.1 | 2.6 | PID P38 GAMMA DELTA PATHWAY | Signaling mediated by p38-gamma and p38-delta |
| 0.1 | 3.4 | PID MYC PATHWAY | C-MYC pathway |
| 0.1 | 10.0 | PID ERBB1 DOWNSTREAM PATHWAY | ErbB1 downstream signaling |
| 0.0 | 6.0 | PID ERA GENOMIC PATHWAY | Validated nuclear estrogen receptor alpha network |
| 0.0 | 0.8 | PID ERBB NETWORK PATHWAY | ErbB receptor signaling network |
| 0.0 | 4.4 | PID TELOMERASE PATHWAY | Regulation of Telomerase |
| 0.0 | 1.6 | PID IGF1 PATHWAY | IGF1 pathway |
| 0.0 | 1.1 | PID RETINOIC ACID PATHWAY | Retinoic acid receptors-mediated signaling |
| 0.0 | 3.1 | PID VEGFR1 2 PATHWAY | Signaling events mediated by VEGFR1 and VEGFR2 |
| 0.0 | 0.6 | PID EPO PATHWAY | EPO signaling pathway |
| 0.0 | 0.6 | PID ERBB1 RECEPTOR PROXIMAL PATHWAY | EGF receptor (ErbB1) signaling pathway |
| 0.0 | 1.3 | PID INSULIN PATHWAY | Insulin Pathway |
| 0.0 | 2.4 | PID TGFBR PATHWAY | TGF-beta receptor signaling |
| 0.0 | 0.8 | PID P38 MKK3 6PATHWAY | p38 MAPK signaling pathway |
| 0.0 | 1.2 | PID BETA CATENIN NUC PATHWAY | Regulation of nuclear beta catenin signaling and target gene transcription |
| 0.0 | 0.8 | PID NCADHERIN PATHWAY | N-cadherin signaling events |
| 0.0 | 0.4 | PID CIRCADIAN PATHWAY | Circadian rhythm pathway |
| 0.0 | 0.8 | PID ATR PATHWAY | ATR signaling pathway |
| 0.0 | 1.3 | PID TRKR PATHWAY | Neurotrophic factor-mediated Trk receptor signaling |
| 0.0 | 0.6 | PID ECADHERIN NASCENT AJ PATHWAY | E-cadherin signaling in the nascent adherens junction |
| 0.0 | 0.3 | PID ARF6 DOWNSTREAM PATHWAY | Arf6 downstream pathway |
| 0.0 | 0.4 | PID RHODOPSIN PATHWAY | Visual signal transduction: Rods |
Gene overrepresentation in curated gene sets: REACTOME pathways category:
| Log-likelihood per target | Total log-likelihood | Term | Description |
|---|---|---|---|
| 1.2 | 25.9 | REACTOME PRESYNAPTIC NICOTINIC ACETYLCHOLINE RECEPTORS | Genes involved in Presynaptic nicotinic acetylcholine receptors |
| 0.4 | 7.8 | REACTOME REVERSIBLE HYDRATION OF CARBON DIOXIDE | Genes involved in Reversible Hydration of Carbon Dioxide |
| 0.3 | 21.9 | REACTOME STRIATED MUSCLE CONTRACTION | Genes involved in Striated Muscle Contraction |
| 0.2 | 9.8 | REACTOME INTERACTION BETWEEN L1 AND ANKYRINS | Genes involved in Interaction between L1 and Ankyrins |
| 0.1 | 5.0 | REACTOME REGULATION OF GENE EXPRESSION IN BETA CELLS | Genes involved in Regulation of gene expression in beta cells |
| 0.1 | 3.1 | REACTOME CASPASE MEDIATED CLEAVAGE OF CYTOSKELETAL PROTEINS | Genes involved in Caspase-mediated cleavage of cytoskeletal proteins |
| 0.1 | 1.6 | REACTOME REGULATION OF PYRUVATE DEHYDROGENASE PDH COMPLEX | Genes involved in Regulation of pyruvate dehydrogenase (PDH) complex |
| 0.1 | 2.9 | REACTOME TRANSFERRIN ENDOCYTOSIS AND RECYCLING | Genes involved in Transferrin endocytosis and recycling |
| 0.1 | 2.6 | REACTOME ACTIVATED TAK1 MEDIATES P38 MAPK ACTIVATION | Genes involved in activated TAK1 mediates p38 MAPK activation |
| 0.1 | 23.2 | REACTOME ANTIGEN PROCESSING UBIQUITINATION PROTEASOME DEGRADATION | Genes involved in Antigen processing: Ubiquitination & Proteasome degradation |
| 0.1 | 1.8 | REACTOME FACILITATIVE NA INDEPENDENT GLUCOSE TRANSPORTERS | Genes involved in Facilitative Na+-independent glucose transporters |
| 0.1 | 3.2 | REACTOME SIGNALING BY FGFR1 FUSION MUTANTS | Genes involved in Signaling by FGFR1 fusion mutants |
| 0.1 | 2.3 | REACTOME IONOTROPIC ACTIVITY OF KAINATE RECEPTORS | Genes involved in Ionotropic activity of Kainate Receptors |
| 0.1 | 3.6 | REACTOME DARPP 32 EVENTS | Genes involved in DARPP-32 events |
| 0.1 | 1.0 | REACTOME PLATELET ADHESION TO EXPOSED COLLAGEN | Genes involved in Platelet Adhesion to exposed collagen |
| 0.1 | 0.9 | REACTOME UNWINDING OF DNA | Genes involved in Unwinding of DNA |
| 0.1 | 1.2 | REACTOME MTORC1 MEDIATED SIGNALLING | Genes involved in mTORC1-mediated signalling |
| 0.0 | 4.8 | REACTOME NCAM1 INTERACTIONS | Genes involved in NCAM1 interactions |
| 0.0 | 1.1 | REACTOME GLYCOGEN BREAKDOWN GLYCOGENOLYSIS | Genes involved in Glycogen breakdown (glycogenolysis) |
| 0.0 | 1.3 | REACTOME CITRIC ACID CYCLE TCA CYCLE | Genes involved in Citric acid cycle (TCA cycle) |
| 0.0 | 0.1 | REACTOME APC C CDC20 MEDIATED DEGRADATION OF CYCLIN B | Genes involved in APC/C:Cdc20 mediated degradation of Cyclin B |
| 0.0 | 0.6 | REACTOME ELEVATION OF CYTOSOLIC CA2 LEVELS | Genes involved in Elevation of cytosolic Ca2+ levels |
| 0.0 | 1.1 | REACTOME ORGANIC CATION ANION ZWITTERION TRANSPORT | Genes involved in Organic cation/anion/zwitterion transport |
| 0.0 | 0.9 | REACTOME BILE SALT AND ORGANIC ANION SLC TRANSPORTERS | Genes involved in Bile salt and organic anion SLC transporters |
| 0.0 | 3.9 | REACTOME LOSS OF NLP FROM MITOTIC CENTROSOMES | Genes involved in Loss of Nlp from mitotic centrosomes |
| 0.0 | 0.9 | REACTOME TANDEM PORE DOMAIN POTASSIUM CHANNELS | Genes involved in Tandem pore domain potassium channels |
| 0.0 | 1.2 | REACTOME SEMA3A PAK DEPENDENT AXON REPULSION | Genes involved in Sema3A PAK dependent Axon repulsion |
| 0.0 | 1.2 | REACTOME CYCLIN E ASSOCIATED EVENTS DURING G1 S TRANSITION | Genes involved in Cyclin E associated events during G1/S transition |
| 0.0 | 0.7 | REACTOME REGULATION OF SIGNALING BY CBL | Genes involved in Regulation of signaling by CBL |
| 0.0 | 1.0 | REACTOME ENDOSOMAL SORTING COMPLEX REQUIRED FOR TRANSPORT ESCRT | Genes involved in Endosomal Sorting Complex Required For Transport (ESCRT) |
| 0.0 | 0.7 | REACTOME PLATELET CALCIUM HOMEOSTASIS | Genes involved in Platelet calcium homeostasis |
| 0.0 | 1.4 | REACTOME GLUCOSE TRANSPORT | Genes involved in Glucose transport |
| 0.0 | 1.1 | REACTOME TRAFFICKING OF GLUR2 CONTAINING AMPA RECEPTORS | Genes involved in Trafficking of GluR2-containing AMPA receptors |
| 0.0 | 0.6 | REACTOME DCC MEDIATED ATTRACTIVE SIGNALING | Genes involved in DCC mediated attractive signaling |
| 0.0 | 0.5 | REACTOME IL1 SIGNALING | Genes involved in Interleukin-1 signaling |
| 0.0 | 0.9 | REACTOME ERK MAPK TARGETS | Genes involved in ERK/MAPK targets |
| 0.0 | 0.8 | REACTOME SHC1 EVENTS IN ERBB4 SIGNALING | Genes involved in SHC1 events in ERBB4 signaling |
| 0.0 | 0.4 | REACTOME ACTIVATION OF CHAPERONES BY ATF6 ALPHA | Genes involved in Activation of Chaperones by ATF6-alpha |
| 0.0 | 2.4 | REACTOME NRAGE SIGNALS DEATH THROUGH JNK | Genes involved in NRAGE signals death through JNK |
| 0.0 | 0.9 | REACTOME CIRCADIAN REPRESSION OF EXPRESSION BY REV ERBA | Genes involved in Circadian Repression of Expression by REV-ERBA |
| 0.0 | 0.7 | REACTOME SYNTHESIS OF PC | Genes involved in Synthesis of PC |
| 0.0 | 0.8 | REACTOME EFFECTS OF PIP2 HYDROLYSIS | Genes involved in Effects of PIP2 hydrolysis |
| 0.0 | 0.6 | REACTOME P130CAS LINKAGE TO MAPK SIGNALING FOR INTEGRINS | Genes involved in p130Cas linkage to MAPK signaling for integrins |
| 0.0 | 0.9 | REACTOME SMAD2 SMAD3 SMAD4 HETEROTRIMER REGULATES TRANSCRIPTION | Genes involved in SMAD2/SMAD3:SMAD4 heterotrimer regulates transcription |
| 0.0 | 3.1 | REACTOME FACTORS INVOLVED IN MEGAKARYOCYTE DEVELOPMENT AND PLATELET PRODUCTION | Genes involved in Factors involved in megakaryocyte development and platelet production |
| 0.0 | 0.4 | REACTOME SYNTHESIS OF BILE ACIDS AND BILE SALTS VIA 7ALPHA HYDROXYCHOLESTEROL | Genes involved in Synthesis of bile acids and bile salts via 7alpha-hydroxycholesterol |
| 0.0 | 0.9 | REACTOME MITOCHONDRIAL PROTEIN IMPORT | Genes involved in Mitochondrial Protein Import |
| 0.0 | 0.4 | REACTOME N GLYCAN ANTENNAE ELONGATION | Genes involved in N-Glycan antennae elongation |
| 0.0 | 0.7 | REACTOME ANTIGEN PROCESSING CROSS PRESENTATION | Genes involved in Antigen processing-Cross presentation |
| 0.0 | 0.6 | REACTOME RNA POL III TRANSCRIPTION INITIATION FROM TYPE 2 PROMOTER | Genes involved in RNA Polymerase III Transcription Initiation From Type 2 Promoter |
| 0.0 | 0.8 | REACTOME ASSOCIATION OF TRIC CCT WITH TARGET PROTEINS DURING BIOSYNTHESIS | Genes involved in Association of TriC/CCT with target proteins during biosynthesis |
| 0.0 | 1.2 | REACTOME RESPIRATORY ELECTRON TRANSPORT | Genes involved in Respiratory electron transport |
| 0.0 | 0.2 | REACTOME ACTIVATION OF BH3 ONLY PROTEINS | Genes involved in Activation of BH3-only proteins |
| 0.0 | 0.7 | REACTOME GLUTATHIONE CONJUGATION | Genes involved in Glutathione conjugation |
| 0.0 | 0.6 | REACTOME MHC CLASS II ANTIGEN PRESENTATION | Genes involved in MHC class II antigen presentation |
| 0.0 | 1.4 | REACTOME NUCLEAR RECEPTOR TRANSCRIPTION PATHWAY | Genes involved in Nuclear Receptor transcription pathway |
| 0.0 | 0.3 | REACTOME G PROTEIN ACTIVATION | Genes involved in G-protein activation |
| 0.0 | 0.5 | REACTOME ANTIVIRAL MECHANISM BY IFN STIMULATED GENES | Genes involved in Antiviral mechanism by IFN-stimulated genes |
| 0.0 | 0.3 | REACTOME IL RECEPTOR SHC SIGNALING | Genes involved in Interleukin receptor SHC signaling |