Project
Illumina Body Map 2 (GSE30611)
Navigation
Downloads
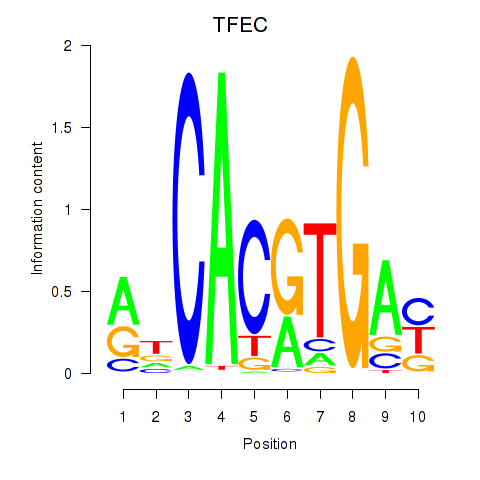
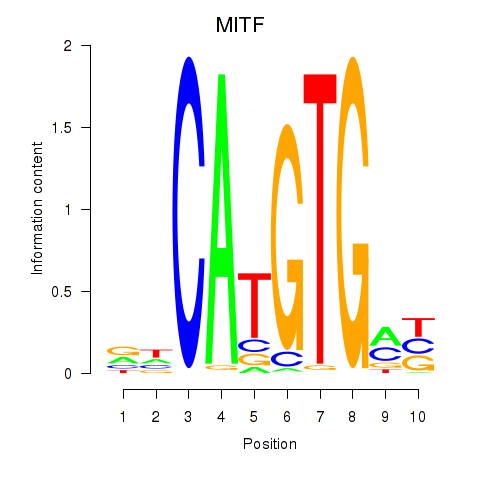
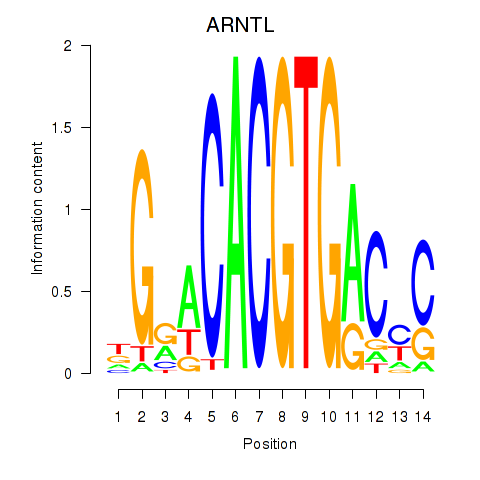
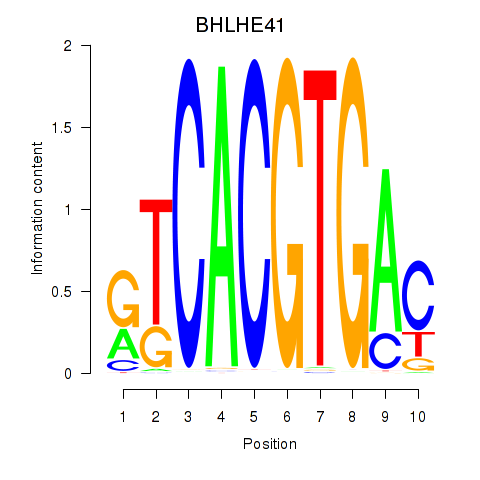
Results for TFEC_MITF_ARNTL_BHLHE41
Z-value: 1.17
Motif logo
Transcription factors associated with TFEC_MITF_ARNTL_BHLHE41
| Gene Symbol | Gene ID | Gene Info |
|---|---|---|
|
TFEC
|
ENSG00000105967.16 | transcription factor EC |
|
MITF
|
ENSG00000187098.17 | melanocyte inducing transcription factor |
|
ARNTL
|
ENSG00000133794.20 | aryl hydrocarbon receptor nuclear translocator like |
|
BHLHE41
|
ENSG00000123095.6 | basic helix-loop-helix family member e41 |
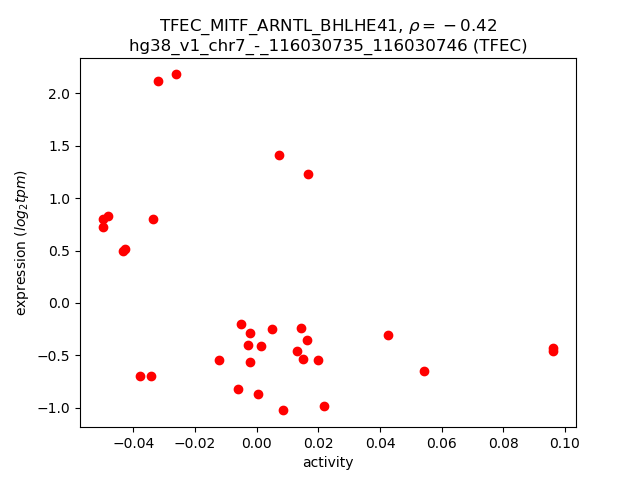
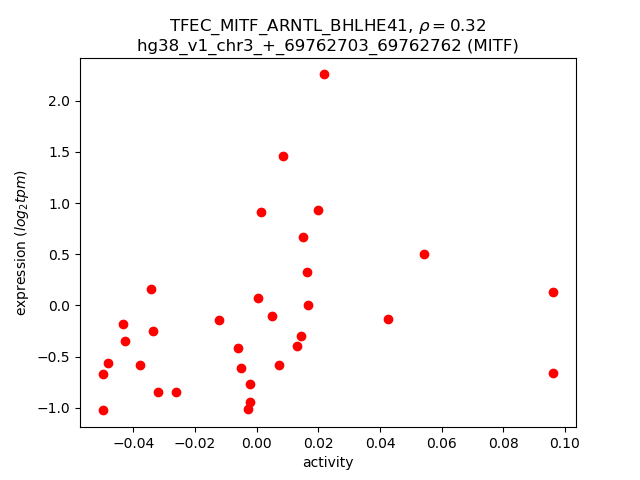
Activity-expression correlation:
| Gene | Promoter | Pearson corr. coef. | P-value | Plot |
|---|---|---|---|---|
| TFEC | hg38_v1_chr7_-_116030735_116030746 | -0.42 | 1.6e-02 | Click! |
| MITF | hg38_v1_chr3_+_69762703_69762762 | 0.32 | 7.1e-02 | Click! |
| BHLHE41 | hg38_v1_chr12_-_26125023_26125047 | 0.23 | 2.0e-01 | Click! |
| ARNTL | hg38_v1_chr11_+_13277639_13277877 | 0.10 | 5.8e-01 | Click! |
Activity profile of TFEC_MITF_ARNTL_BHLHE41 motif
Sorted Z-values of TFEC_MITF_ARNTL_BHLHE41 motif
Network of associatons between targets according to the STRING database.

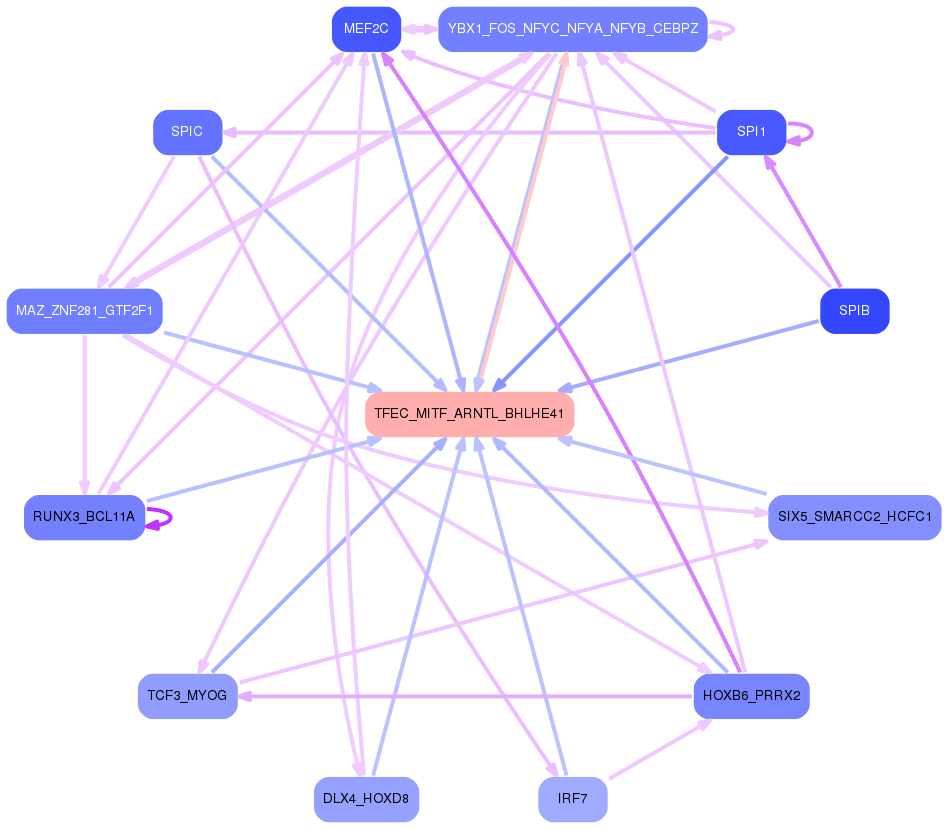
First level regulatory network of TFEC_MITF_ARNTL_BHLHE41
Gene Ontology Analysis
Gene overrepresentation in biological process category:
| Log-likelihood per target | Total log-likelihood | Term | Description |
|---|---|---|---|
| 2.0 | 6.1 | GO:0001207 | histone displacement(GO:0001207) positive regulation of transcription involved in meiotic cell cycle(GO:0051039) |
| 2.0 | 6.0 | GO:0009386 | translational attenuation(GO:0009386) |
| 1.5 | 4.6 | GO:0051695 | actin filament uncapping(GO:0051695) |
| 1.3 | 5.2 | GO:0031106 | septin ring assembly(GO:0000921) septin ring organization(GO:0031106) |
| 1.0 | 3.1 | GO:0006407 | rRNA export from nucleus(GO:0006407) |
| 0.8 | 3.3 | GO:0014022 | neural plate elongation(GO:0014022) convergent extension involved in neural plate elongation(GO:0022007) |
| 0.8 | 3.3 | GO:0000711 | meiotic DNA repair synthesis(GO:0000711) |
| 0.8 | 2.3 | GO:1903697 | negative regulation of microvillus assembly(GO:1903697) |
| 0.8 | 4.5 | GO:0014878 | response to electrical stimulus involved in regulation of muscle adaptation(GO:0014878) |
| 0.8 | 2.3 | GO:1902490 | regulation of sperm capacitation(GO:1902490) |
| 0.7 | 3.4 | GO:0044830 | modulation by host of viral RNA genome replication(GO:0044830) positive regulation of intracellular transport of viral material(GO:1901254) |
| 0.6 | 1.7 | GO:1904482 | response to tetrahydrofolate(GO:1904481) cellular response to tetrahydrofolate(GO:1904482) |
| 0.5 | 0.5 | GO:0036506 | maintenance of unfolded protein(GO:0036506) maintenance of unfolded protein involved in ERAD pathway(GO:1904378) |
| 0.5 | 2.6 | GO:1904925 | positive regulation of macromitophagy(GO:1901526) positive regulation of mitophagy in response to mitochondrial depolarization(GO:1904925) |
| 0.5 | 2.0 | GO:0030576 | Cajal body organization(GO:0030576) |
| 0.5 | 2.4 | GO:0015670 | carbon dioxide transport(GO:0015670) |
| 0.5 | 3.8 | GO:0090238 | positive regulation of arachidonic acid secretion(GO:0090238) |
| 0.5 | 2.7 | GO:0005985 | sucrose metabolic process(GO:0005985) |
| 0.5 | 7.7 | GO:2000766 | negative regulation of cytoplasmic translation(GO:2000766) |
| 0.4 | 3.6 | GO:0019262 | N-acetylneuraminate catabolic process(GO:0019262) |
| 0.4 | 2.7 | GO:0033133 | positive regulation of glucokinase activity(GO:0033133) |
| 0.4 | 4.9 | GO:0098735 | positive regulation of the force of heart contraction(GO:0098735) |
| 0.4 | 1.1 | GO:0070256 | negative regulation of circadian sleep/wake cycle, non-REM sleep(GO:0042323) negative regulation of mucus secretion(GO:0070256) |
| 0.4 | 1.1 | GO:0070407 | oxidation-dependent protein catabolic process(GO:0070407) |
| 0.4 | 2.5 | GO:1900063 | regulation of peroxisome organization(GO:1900063) |
| 0.3 | 2.0 | GO:2001245 | regulation of phosphatidylcholine biosynthetic process(GO:2001245) |
| 0.3 | 1.0 | GO:0036353 | histone H2A-K119 monoubiquitination(GO:0036353) |
| 0.3 | 1.3 | GO:0000961 | negative regulation of mitochondrial RNA catabolic process(GO:0000961) |
| 0.3 | 1.0 | GO:1990519 | pyrimidine nucleotide transport(GO:0006864) mitochondrial pyrimidine nucleotide import(GO:1990519) |
| 0.3 | 1.0 | GO:0071283 | regulation of chromosome condensation(GO:0060623) cellular response to iron(III) ion(GO:0071283) |
| 0.3 | 0.9 | GO:0075732 | viral penetration into host nucleus(GO:0075732) multi-organism nuclear import(GO:1902594) |
| 0.3 | 4.2 | GO:0070495 | regulation of thrombin receptor signaling pathway(GO:0070494) negative regulation of thrombin receptor signaling pathway(GO:0070495) |
| 0.3 | 1.2 | GO:0006556 | S-adenosylmethionine biosynthetic process(GO:0006556) |
| 0.3 | 1.2 | GO:1903568 | negative regulation of protein localization to cilium(GO:1903565) regulation of protein localization to ciliary membrane(GO:1903567) negative regulation of protein localization to ciliary membrane(GO:1903568) |
| 0.3 | 0.9 | GO:0006867 | asparagine transport(GO:0006867) |
| 0.3 | 0.9 | GO:1903061 | establishment of protein localization to endoplasmic reticulum membrane(GO:0097051) positive regulation of protein lipidation(GO:1903061) |
| 0.3 | 0.6 | GO:1902174 | positive regulation of keratinocyte apoptotic process(GO:1902174) |
| 0.3 | 0.8 | GO:0006059 | hexitol metabolic process(GO:0006059) |
| 0.3 | 1.0 | GO:0072429 | response to intra-S DNA damage checkpoint signaling(GO:0072429) |
| 0.3 | 1.5 | GO:0006740 | NADPH regeneration(GO:0006740) |
| 0.2 | 2.2 | GO:0035879 | plasma membrane lactate transport(GO:0035879) |
| 0.2 | 2.2 | GO:0061484 | hematopoietic stem cell homeostasis(GO:0061484) |
| 0.2 | 6.2 | GO:0070816 | phosphorylation of RNA polymerase II C-terminal domain(GO:0070816) |
| 0.2 | 1.3 | GO:0006546 | glycine catabolic process(GO:0006546) glycine decarboxylation via glycine cleavage system(GO:0019464) |
| 0.2 | 0.9 | GO:0044313 | protein K6-linked deubiquitination(GO:0044313) |
| 0.2 | 0.6 | GO:0046878 | positive regulation of saliva secretion(GO:0046878) |
| 0.2 | 0.8 | GO:1902310 | positive regulation of peptidyl-serine dephosphorylation(GO:1902310) |
| 0.2 | 4.3 | GO:0036158 | outer dynein arm assembly(GO:0036158) |
| 0.2 | 1.2 | GO:0010157 | response to chlorate(GO:0010157) |
| 0.2 | 0.6 | GO:0015881 | creatine transport(GO:0015881) creatine transmembrane transport(GO:1902598) |
| 0.2 | 2.5 | GO:0043985 | histone H4-R3 methylation(GO:0043985) |
| 0.2 | 1.1 | GO:0090521 | glomerular visceral epithelial cell migration(GO:0090521) |
| 0.2 | 1.1 | GO:0090611 | ubiquitin-independent protein catabolic process via the multivesicular body sorting pathway(GO:0090611) |
| 0.2 | 1.1 | GO:0008614 | pyridoxine metabolic process(GO:0008614) pyridoxine biosynthetic process(GO:0008615) vitamin B6 biosynthetic process(GO:0042819) |
| 0.2 | 0.7 | GO:0070681 | glutaminyl-tRNAGln biosynthesis via transamidation(GO:0070681) |
| 0.2 | 0.9 | GO:0014886 | transition between slow and fast fiber(GO:0014886) |
| 0.2 | 0.7 | GO:0006617 | SRP-dependent cotranslational protein targeting to membrane, signal sequence recognition(GO:0006617) |
| 0.2 | 1.1 | GO:0071400 | cellular response to oleic acid(GO:0071400) |
| 0.2 | 1.6 | GO:1990834 | response to odorant(GO:1990834) |
| 0.2 | 0.7 | GO:0006210 | pyrimidine nucleobase catabolic process(GO:0006208) thymine catabolic process(GO:0006210) thymine metabolic process(GO:0019859) |
| 0.2 | 0.7 | GO:0097089 | methyl-branched fatty acid metabolic process(GO:0097089) |
| 0.2 | 1.2 | GO:0071104 | response to interleukin-9(GO:0071104) |
| 0.2 | 0.7 | GO:1905069 | nephrogenic mesenchyme morphogenesis(GO:0072134) allantois development(GO:1905069) |
| 0.2 | 0.5 | GO:0032258 | CVT pathway(GO:0032258) |
| 0.2 | 2.6 | GO:0070459 | prolactin secretion(GO:0070459) |
| 0.2 | 1.0 | GO:0043137 | DNA replication, removal of RNA primer(GO:0043137) |
| 0.2 | 0.3 | GO:0061198 | fungiform papilla morphogenesis(GO:0061197) fungiform papilla formation(GO:0061198) |
| 0.2 | 0.6 | GO:1902683 | regulation of receptor localization to synapse(GO:1902683) |
| 0.2 | 1.1 | GO:0051012 | microtubule sliding(GO:0051012) |
| 0.1 | 1.3 | GO:2000973 | regulation of pro-B cell differentiation(GO:2000973) |
| 0.1 | 0.6 | GO:0035606 | peptidyl-cysteine S-trans-nitrosylation(GO:0035606) |
| 0.1 | 0.9 | GO:0071163 | DNA replication preinitiation complex assembly(GO:0071163) |
| 0.1 | 0.3 | GO:0046707 | IDP metabolic process(GO:0046707) IDP catabolic process(GO:0046709) |
| 0.1 | 0.4 | GO:0043490 | malate-aspartate shuttle(GO:0043490) |
| 0.1 | 0.6 | GO:0009436 | glyoxylate catabolic process(GO:0009436) |
| 0.1 | 0.3 | GO:0072019 | proximal convoluted tubule development(GO:0072019) metanephric proximal convoluted tubule development(GO:0072229) |
| 0.1 | 0.3 | GO:0019287 | isopentenyl diphosphate biosynthetic process, mevalonate pathway(GO:0019287) |
| 0.1 | 0.9 | GO:1905123 | regulation of glucosylceramidase activity(GO:1905123) |
| 0.1 | 1.2 | GO:0046465 | dolichyl diphosphate biosynthetic process(GO:0006489) dolichyl diphosphate metabolic process(GO:0046465) |
| 0.1 | 0.5 | GO:0001545 | primary ovarian follicle growth(GO:0001545) |
| 0.1 | 0.4 | GO:0019303 | D-ribose catabolic process(GO:0019303) |
| 0.1 | 0.3 | GO:0071288 | cellular response to mercury ion(GO:0071288) |
| 0.1 | 2.4 | GO:0045475 | locomotor rhythm(GO:0045475) |
| 0.1 | 0.4 | GO:0010768 | negative regulation of transcription from RNA polymerase II promoter in response to UV-induced DNA damage(GO:0010768) transmission of virus(GO:0019089) dissemination or transmission of symbiont from host(GO:0044007) dissemination or transmission of organism from other organism involved in symbiotic interaction(GO:0051821) |
| 0.1 | 0.7 | GO:0010587 | miRNA catabolic process(GO:0010587) |
| 0.1 | 0.5 | GO:0061055 | myotome development(GO:0061055) |
| 0.1 | 0.4 | GO:0031393 | negative regulation of prostaglandin biosynthetic process(GO:0031393) histone H3-K9 deacetylation(GO:1990619) |
| 0.1 | 0.4 | GO:1900368 | regulation of RNA interference(GO:1900368) |
| 0.1 | 0.7 | GO:1902361 | mitochondrial pyruvate transport(GO:0006850) mitochondrial pyruvate transmembrane transport(GO:1902361) |
| 0.1 | 1.7 | GO:0098535 | de novo centriole assembly(GO:0098535) |
| 0.1 | 0.8 | GO:0044789 | modulation by host of viral release from host cell(GO:0044789) positive regulation by host of viral release from host cell(GO:0044791) |
| 0.1 | 1.0 | GO:0022027 | interkinetic nuclear migration(GO:0022027) |
| 0.1 | 0.6 | GO:0014050 | negative regulation of glutamate secretion(GO:0014050) |
| 0.1 | 0.3 | GO:0035732 | nitric oxide storage(GO:0035732) |
| 0.1 | 0.2 | GO:0000957 | mitochondrial RNA catabolic process(GO:0000957) regulation of mitochondrial RNA catabolic process(GO:0000960) |
| 0.1 | 1.8 | GO:2000781 | positive regulation of double-strand break repair(GO:2000781) |
| 0.1 | 1.5 | GO:0034058 | endosomal vesicle fusion(GO:0034058) |
| 0.1 | 0.3 | GO:0001828 | inner cell mass cell fate commitment(GO:0001827) inner cell mass cellular morphogenesis(GO:0001828) |
| 0.1 | 0.5 | GO:0034093 | positive regulation of maintenance of sister chromatid cohesion(GO:0034093) positive regulation of maintenance of mitotic sister chromatid cohesion(GO:0034184) |
| 0.1 | 0.3 | GO:0016340 | calcium-dependent cell-matrix adhesion(GO:0016340) |
| 0.1 | 1.0 | GO:0035494 | SNARE complex disassembly(GO:0035494) |
| 0.1 | 1.0 | GO:2000786 | positive regulation of autophagosome assembly(GO:2000786) |
| 0.1 | 0.3 | GO:1903251 | multi-ciliated epithelial cell differentiation(GO:1903251) |
| 0.1 | 0.4 | GO:0033326 | cerebrospinal fluid secretion(GO:0033326) |
| 0.1 | 1.4 | GO:0010510 | acetyl-CoA biosynthetic process from pyruvate(GO:0006086) regulation of acetyl-CoA biosynthetic process from pyruvate(GO:0010510) regulation of acyl-CoA biosynthetic process(GO:0050812) |
| 0.1 | 1.2 | GO:0018401 | peptidyl-proline hydroxylation to 4-hydroxy-L-proline(GO:0018401) |
| 0.1 | 0.5 | GO:0007206 | phospholipase C-activating G-protein coupled glutamate receptor signaling pathway(GO:0007206) |
| 0.1 | 1.5 | GO:0031580 | membrane raft polarization(GO:0001766) membrane raft distribution(GO:0031580) |
| 0.1 | 7.9 | GO:0048791 | calcium ion-regulated exocytosis of neurotransmitter(GO:0048791) |
| 0.1 | 0.9 | GO:2000252 | negative regulation of feeding behavior(GO:2000252) |
| 0.1 | 1.0 | GO:0010739 | positive regulation of protein kinase A signaling(GO:0010739) |
| 0.1 | 0.3 | GO:0046452 | dihydrofolate metabolic process(GO:0046452) |
| 0.1 | 0.7 | GO:0015808 | L-alanine transport(GO:0015808) |
| 0.1 | 0.4 | GO:1903347 | negative regulation of bicellular tight junction assembly(GO:1903347) |
| 0.1 | 1.1 | GO:0031119 | tRNA pseudouridine synthesis(GO:0031119) |
| 0.1 | 0.3 | GO:0006147 | guanine catabolic process(GO:0006147) |
| 0.1 | 0.1 | GO:0001732 | formation of cytoplasmic translation initiation complex(GO:0001732) |
| 0.1 | 3.9 | GO:0090383 | phagosome acidification(GO:0090383) |
| 0.1 | 3.8 | GO:0006099 | tricarboxylic acid cycle(GO:0006099) |
| 0.1 | 0.9 | GO:0016926 | protein desumoylation(GO:0016926) |
| 0.1 | 0.9 | GO:0043569 | negative regulation of insulin-like growth factor receptor signaling pathway(GO:0043569) |
| 0.1 | 4.3 | GO:0007339 | binding of sperm to zona pellucida(GO:0007339) |
| 0.1 | 1.2 | GO:0034625 | fatty acid elongation, saturated fatty acid(GO:0019367) fatty acid elongation, unsaturated fatty acid(GO:0019368) fatty acid elongation, monounsaturated fatty acid(GO:0034625) fatty acid elongation, polyunsaturated fatty acid(GO:0034626) |
| 0.1 | 0.8 | GO:1990253 | cellular response to leucine starvation(GO:1990253) |
| 0.1 | 1.5 | GO:0030854 | positive regulation of granulocyte differentiation(GO:0030854) |
| 0.1 | 1.0 | GO:0008343 | adult feeding behavior(GO:0008343) |
| 0.1 | 1.6 | GO:0042754 | negative regulation of circadian rhythm(GO:0042754) |
| 0.1 | 0.3 | GO:1905150 | regulation of voltage-gated sodium channel activity(GO:1905150) |
| 0.1 | 0.3 | GO:0033306 | phytol metabolic process(GO:0033306) fatty alcohol metabolic process(GO:1903173) |
| 0.1 | 0.4 | GO:0045925 | positive regulation of female receptivity(GO:0045925) |
| 0.1 | 1.0 | GO:0070131 | positive regulation of mitochondrial translation(GO:0070131) |
| 0.1 | 1.0 | GO:0090306 | spindle assembly involved in meiosis(GO:0090306) |
| 0.1 | 2.5 | GO:0007130 | synaptonemal complex assembly(GO:0007130) |
| 0.1 | 1.6 | GO:0006975 | DNA damage induced protein phosphorylation(GO:0006975) |
| 0.1 | 0.1 | GO:1902954 | regulation of early endosome to recycling endosome transport(GO:1902954) |
| 0.1 | 0.2 | GO:0003050 | regulation of systemic arterial blood pressure by atrial natriuretic peptide(GO:0003050) |
| 0.1 | 1.5 | GO:0010457 | centriole-centriole cohesion(GO:0010457) |
| 0.1 | 1.7 | GO:0034356 | NAD biosynthesis via nicotinamide riboside salvage pathway(GO:0034356) |
| 0.1 | 0.4 | GO:0034201 | response to oleic acid(GO:0034201) |
| 0.1 | 0.3 | GO:1904021 | negative regulation of G-protein coupled receptor internalization(GO:1904021) |
| 0.1 | 3.8 | GO:0097484 | dendrite extension(GO:0097484) |
| 0.1 | 0.3 | GO:0019413 | acetate biosynthetic process(GO:0019413) acetyl-CoA biosynthetic process from acetate(GO:0019427) propionate biosynthetic process(GO:0019542) |
| 0.1 | 0.3 | GO:2000393 | negative regulation of lamellipodium morphogenesis(GO:2000393) |
| 0.1 | 0.3 | GO:0006726 | eye pigment biosynthetic process(GO:0006726) eye pigment metabolic process(GO:0042441) pigment metabolic process involved in developmental pigmentation(GO:0043324) pigment metabolic process involved in pigmentation(GO:0043474) |
| 0.1 | 0.3 | GO:0042335 | cuticle development(GO:0042335) |
| 0.1 | 0.8 | GO:0009407 | toxin catabolic process(GO:0009407) secondary metabolite catabolic process(GO:0090487) |
| 0.1 | 3.6 | GO:0046716 | muscle cell cellular homeostasis(GO:0046716) |
| 0.1 | 1.2 | GO:0060766 | negative regulation of androgen receptor signaling pathway(GO:0060766) |
| 0.1 | 2.8 | GO:0060445 | branching involved in salivary gland morphogenesis(GO:0060445) |
| 0.1 | 0.6 | GO:1901524 | regulation of macromitophagy(GO:1901524) negative regulation of macromitophagy(GO:1901525) |
| 0.1 | 0.9 | GO:0006488 | dolichol-linked oligosaccharide biosynthetic process(GO:0006488) |
| 0.1 | 1.1 | GO:0006782 | protoporphyrinogen IX biosynthetic process(GO:0006782) |
| 0.1 | 1.5 | GO:0006123 | mitochondrial electron transport, cytochrome c to oxygen(GO:0006123) |
| 0.1 | 0.7 | GO:0018095 | protein polyglutamylation(GO:0018095) |
| 0.1 | 0.3 | GO:0046167 | glycerol-3-phosphate biosynthetic process(GO:0046167) |
| 0.1 | 1.2 | GO:0071688 | striated muscle myosin thick filament assembly(GO:0071688) |
| 0.1 | 0.2 | GO:0043438 | acetoacetic acid metabolic process(GO:0043438) |
| 0.1 | 0.8 | GO:1904352 | positive regulation of protein catabolic process in the vacuole(GO:1904352) |
| 0.1 | 0.2 | GO:0002408 | myeloid dendritic cell chemotaxis(GO:0002408) |
| 0.1 | 1.1 | GO:0014029 | neural crest formation(GO:0014029) |
| 0.1 | 0.2 | GO:0015993 | molecular hydrogen transport(GO:0015993) |
| 0.1 | 0.9 | GO:0015886 | heme transport(GO:0015886) |
| 0.1 | 0.5 | GO:0070164 | negative regulation of adiponectin secretion(GO:0070164) |
| 0.1 | 0.3 | GO:0043686 | co-translational protein modification(GO:0043686) |
| 0.0 | 1.1 | GO:1902260 | negative regulation of delayed rectifier potassium channel activity(GO:1902260) |
| 0.0 | 1.3 | GO:0006853 | carnitine shuttle(GO:0006853) |
| 0.0 | 1.1 | GO:0007097 | nuclear migration(GO:0007097) |
| 0.0 | 0.1 | GO:0001543 | ovarian follicle rupture(GO:0001543) |
| 0.0 | 0.2 | GO:0034334 | adherens junction maintenance(GO:0034334) |
| 0.0 | 0.7 | GO:0070197 | meiotic telomere tethering at nuclear periphery(GO:0044821) meiotic attachment of telomere to nuclear envelope(GO:0070197) chromosome attachment to the nuclear envelope(GO:0097240) |
| 0.0 | 0.2 | GO:0019918 | peptidyl-arginine methylation, to symmetrical-dimethyl arginine(GO:0019918) |
| 0.0 | 0.6 | GO:0002759 | regulation of antimicrobial humoral response(GO:0002759) |
| 0.0 | 0.5 | GO:0034723 | DNA replication-dependent nucleosome assembly(GO:0006335) DNA replication-dependent nucleosome organization(GO:0034723) |
| 0.0 | 0.2 | GO:2000685 | mesodermal-endodermal cell signaling(GO:0003131) programmed DNA elimination(GO:0031049) chromosome breakage(GO:0031052) histone H2A-S139 phosphorylation(GO:0035978) positive regulation of cellular response to X-ray(GO:2000685) |
| 0.0 | 0.1 | GO:0000967 | endonucleolytic cleavage to generate mature 5'-end of SSU-rRNA from (SSU-rRNA, 5.8S rRNA, LSU-rRNA)(GO:0000472) rRNA 5'-end processing(GO:0000967) ncRNA 5'-end processing(GO:0034471) |
| 0.0 | 0.3 | GO:0021993 | fourth ventricle development(GO:0021592) initiation of neural tube closure(GO:0021993) |
| 0.0 | 0.4 | GO:0042905 | 9-cis-retinoic acid biosynthetic process(GO:0042904) 9-cis-retinoic acid metabolic process(GO:0042905) |
| 0.0 | 0.9 | GO:0031573 | intra-S DNA damage checkpoint(GO:0031573) |
| 0.0 | 0.1 | GO:0051877 | pigment granule aggregation in cell center(GO:0051877) |
| 0.0 | 0.4 | GO:0031860 | telomeric 3' overhang formation(GO:0031860) |
| 0.0 | 0.2 | GO:0060087 | relaxation of vascular smooth muscle(GO:0060087) |
| 0.0 | 0.4 | GO:0060272 | embryonic skeletal joint morphogenesis(GO:0060272) |
| 0.0 | 0.3 | GO:1900126 | negative regulation of hyaluronan biosynthetic process(GO:1900126) |
| 0.0 | 1.6 | GO:0051123 | RNA polymerase II transcriptional preinitiation complex assembly(GO:0051123) |
| 0.0 | 0.6 | GO:0002191 | cap-dependent translational initiation(GO:0002191) |
| 0.0 | 0.2 | GO:0033274 | response to vitamin B2(GO:0033274) heterochromatin maintenance(GO:0070829) |
| 0.0 | 0.4 | GO:1902459 | positive regulation of stem cell population maintenance(GO:1902459) |
| 0.0 | 1.1 | GO:0043162 | ubiquitin-dependent protein catabolic process via the multivesicular body sorting pathway(GO:0043162) |
| 0.0 | 0.7 | GO:0034498 | early endosome to Golgi transport(GO:0034498) |
| 0.0 | 0.2 | GO:0008588 | release of cytoplasmic sequestered NF-kappaB(GO:0008588) |
| 0.0 | 0.2 | GO:0006169 | adenosine salvage(GO:0006169) dATP biosynthetic process(GO:0006175) |
| 0.0 | 1.1 | GO:0016180 | snRNA processing(GO:0016180) |
| 0.0 | 0.1 | GO:0035519 | protein K29-linked ubiquitination(GO:0035519) |
| 0.0 | 1.3 | GO:2000757 | negative regulation of peptidyl-lysine acetylation(GO:2000757) |
| 0.0 | 0.1 | GO:1902775 | mitochondrial ribosome assembly(GO:0061668) mitochondrial large ribosomal subunit assembly(GO:1902775) |
| 0.0 | 0.9 | GO:1990126 | retrograde transport, endosome to plasma membrane(GO:1990126) |
| 0.0 | 0.8 | GO:0032968 | positive regulation of transcription elongation from RNA polymerase II promoter(GO:0032968) |
| 0.0 | 0.6 | GO:0070934 | CRD-mediated mRNA stabilization(GO:0070934) |
| 0.0 | 0.6 | GO:0045078 | positive regulation of interferon-gamma biosynthetic process(GO:0045078) |
| 0.0 | 0.1 | GO:0071930 | negative regulation of transcription involved in G1/S transition of mitotic cell cycle(GO:0071930) |
| 0.0 | 0.5 | GO:0051601 | exocyst localization(GO:0051601) |
| 0.0 | 0.7 | GO:0045836 | positive regulation of meiotic nuclear division(GO:0045836) |
| 0.0 | 1.2 | GO:0098534 | centriole replication(GO:0007099) centriole assembly(GO:0098534) |
| 0.0 | 0.7 | GO:0035360 | positive regulation of peroxisome proliferator activated receptor signaling pathway(GO:0035360) |
| 0.0 | 0.6 | GO:0009125 | nucleoside monophosphate catabolic process(GO:0009125) |
| 0.0 | 2.2 | GO:0035025 | positive regulation of Rho protein signal transduction(GO:0035025) |
| 0.0 | 0.8 | GO:0000729 | DNA double-strand break processing(GO:0000729) |
| 0.0 | 0.7 | GO:0061470 | T follicular helper cell differentiation(GO:0061470) |
| 0.0 | 0.5 | GO:0071340 | skeletal muscle acetylcholine-gated channel clustering(GO:0071340) |
| 0.0 | 0.8 | GO:0034975 | protein folding in endoplasmic reticulum(GO:0034975) |
| 0.0 | 1.7 | GO:0060325 | face morphogenesis(GO:0060325) |
| 0.0 | 0.3 | GO:0086024 | adrenergic receptor signaling pathway involved in positive regulation of heart rate(GO:0086024) |
| 0.0 | 0.1 | GO:0090365 | regulation of mRNA modification(GO:0090365) |
| 0.0 | 0.7 | GO:0007216 | G-protein coupled glutamate receptor signaling pathway(GO:0007216) |
| 0.0 | 0.3 | GO:0006627 | protein processing involved in protein targeting to mitochondrion(GO:0006627) |
| 0.0 | 0.2 | GO:0048022 | negative regulation of melanin biosynthetic process(GO:0048022) negative regulation of secondary metabolite biosynthetic process(GO:1900377) |
| 0.0 | 0.2 | GO:0018344 | protein geranylgeranylation(GO:0018344) |
| 0.0 | 0.2 | GO:0045113 | regulation of integrin biosynthetic process(GO:0045113) |
| 0.0 | 0.2 | GO:0097461 | ferric iron import(GO:0033216) ferric iron import into cell(GO:0097461) ferric iron import across plasma membrane(GO:0098706) |
| 0.0 | 0.2 | GO:0048936 | peripheral nervous system neuron axonogenesis(GO:0048936) |
| 0.0 | 1.5 | GO:0006270 | DNA replication initiation(GO:0006270) |
| 0.0 | 1.2 | GO:0006607 | NLS-bearing protein import into nucleus(GO:0006607) |
| 0.0 | 0.1 | GO:0061580 | colon epithelial cell migration(GO:0061580) intestinal epithelial cell migration(GO:0061582) |
| 0.0 | 1.4 | GO:0061003 | positive regulation of dendritic spine morphogenesis(GO:0061003) |
| 0.0 | 0.1 | GO:0006272 | leading strand elongation(GO:0006272) |
| 0.0 | 0.3 | GO:0018094 | protein polyglycylation(GO:0018094) |
| 0.0 | 0.2 | GO:0015015 | heparan sulfate proteoglycan biosynthetic process, enzymatic modification(GO:0015015) |
| 0.0 | 1.4 | GO:0051602 | response to electrical stimulus(GO:0051602) |
| 0.0 | 0.1 | GO:1903028 | positive regulation of opsonization(GO:1903028) |
| 0.0 | 0.2 | GO:0071680 | response to indole-3-methanol(GO:0071680) cellular response to indole-3-methanol(GO:0071681) |
| 0.0 | 1.8 | GO:0048635 | negative regulation of muscle organ development(GO:0048635) |
| 0.0 | 0.3 | GO:0006686 | sphingomyelin biosynthetic process(GO:0006686) |
| 0.0 | 0.9 | GO:0006700 | C21-steroid hormone biosynthetic process(GO:0006700) |
| 0.0 | 0.1 | GO:0032377 | regulation of intracellular lipid transport(GO:0032377) regulation of intracellular sterol transport(GO:0032380) regulation of intracellular cholesterol transport(GO:0032383) |
| 0.0 | 0.1 | GO:0001994 | norepinephrine-epinephrine vasoconstriction involved in regulation of systemic arterial blood pressure(GO:0001994) |
| 0.0 | 0.1 | GO:0035526 | retrograde transport, plasma membrane to Golgi(GO:0035526) |
| 0.0 | 0.1 | GO:0032877 | positive regulation of DNA endoreduplication(GO:0032877) |
| 0.0 | 0.1 | GO:0039534 | negative regulation of MDA-5 signaling pathway(GO:0039534) |
| 0.0 | 3.2 | GO:0006368 | transcription elongation from RNA polymerase II promoter(GO:0006368) |
| 0.0 | 0.5 | GO:0036109 | alpha-linolenic acid metabolic process(GO:0036109) |
| 0.0 | 0.3 | GO:0090160 | Golgi to lysosome transport(GO:0090160) |
| 0.0 | 0.9 | GO:0000027 | ribosomal large subunit assembly(GO:0000027) |
| 0.0 | 1.4 | GO:0008333 | endosome to lysosome transport(GO:0008333) |
| 0.0 | 0.4 | GO:0050765 | negative regulation of phagocytosis(GO:0050765) |
| 0.0 | 2.8 | GO:0070125 | mitochondrial translational elongation(GO:0070125) |
| 0.0 | 0.8 | GO:0070987 | error-free translesion synthesis(GO:0070987) |
| 0.0 | 0.3 | GO:0006552 | leucine catabolic process(GO:0006552) |
| 0.0 | 0.1 | GO:1901838 | regulation of transcription of nuclear large rRNA transcript from RNA polymerase I promoter(GO:1901836) positive regulation of transcription of nuclear large rRNA transcript from RNA polymerase I promoter(GO:1901838) |
| 0.0 | 0.3 | GO:0060613 | fat pad development(GO:0060613) |
| 0.0 | 0.5 | GO:0048149 | behavioral response to ethanol(GO:0048149) |
| 0.0 | 0.3 | GO:2000427 | positive regulation of apoptotic cell clearance(GO:2000427) |
| 0.0 | 0.1 | GO:0033314 | mitotic DNA replication checkpoint(GO:0033314) |
| 0.0 | 0.7 | GO:0032543 | mitochondrial translation(GO:0032543) |
| 0.0 | 1.3 | GO:0050690 | regulation of defense response to virus by virus(GO:0050690) |
| 0.0 | 0.2 | GO:0006041 | glucosamine metabolic process(GO:0006041) |
| 0.0 | 0.2 | GO:0046689 | response to mercury ion(GO:0046689) |
| 0.0 | 0.3 | GO:2000628 | regulation of miRNA metabolic process(GO:2000628) |
| 0.0 | 0.1 | GO:0072023 | thick ascending limb development(GO:0072023) metanephric thick ascending limb development(GO:0072233) |
| 0.0 | 0.3 | GO:0042908 | xenobiotic transport(GO:0042908) |
| 0.0 | 0.5 | GO:0016254 | preassembly of GPI anchor in ER membrane(GO:0016254) |
| 0.0 | 0.4 | GO:0090084 | negative regulation of inclusion body assembly(GO:0090084) |
| 0.0 | 0.2 | GO:2000270 | negative regulation of fibroblast apoptotic process(GO:2000270) |
| 0.0 | 0.2 | GO:0071321 | cellular response to cGMP(GO:0071321) |
| 0.0 | 1.8 | GO:0009250 | glycogen biosynthetic process(GO:0005978) glucan biosynthetic process(GO:0009250) |
| 0.0 | 0.2 | GO:0007185 | transmembrane receptor protein tyrosine phosphatase signaling pathway(GO:0007185) |
| 0.0 | 0.1 | GO:1903070 | negative regulation of ER-associated ubiquitin-dependent protein catabolic process(GO:1903070) |
| 0.0 | 0.3 | GO:0021521 | ventral spinal cord interneuron specification(GO:0021521) cell fate specification involved in pattern specification(GO:0060573) |
| 0.0 | 2.0 | GO:0031146 | SCF-dependent proteasomal ubiquitin-dependent protein catabolic process(GO:0031146) |
| 0.0 | 0.2 | GO:0007288 | sperm axoneme assembly(GO:0007288) |
| 0.0 | 0.5 | GO:0033561 | regulation of water loss via skin(GO:0033561) |
| 0.0 | 0.2 | GO:2000609 | regulation of thyroid hormone generation(GO:2000609) |
| 0.0 | 0.5 | GO:0070584 | mitochondrion morphogenesis(GO:0070584) |
| 0.0 | 0.4 | GO:0034384 | high-density lipoprotein particle clearance(GO:0034384) |
| 0.0 | 0.7 | GO:0010738 | regulation of protein kinase A signaling(GO:0010738) |
| 0.0 | 0.1 | GO:0034371 | chylomicron remodeling(GO:0034371) |
| 0.0 | 0.3 | GO:0097201 | negative regulation of transcription from RNA polymerase II promoter in response to stress(GO:0097201) |
| 0.0 | 1.6 | GO:0030317 | sperm motility(GO:0030317) |
| 0.0 | 0.2 | GO:0032025 | response to cobalt ion(GO:0032025) |
| 0.0 | 0.1 | GO:0021860 | pyramidal neuron development(GO:0021860) |
| 0.0 | 0.3 | GO:0000338 | protein deneddylation(GO:0000338) |
| 0.0 | 0.1 | GO:0007549 | dosage compensation(GO:0007549) dosage compensation by inactivation of X chromosome(GO:0009048) |
| 0.0 | 0.1 | GO:1902731 | ovarian cumulus expansion(GO:0001550) fused antrum stage(GO:0048165) negative regulation of chondrocyte proliferation(GO:1902731) |
| 0.0 | 1.2 | GO:0021762 | substantia nigra development(GO:0021762) |
| 0.0 | 1.4 | GO:0043966 | histone H3 acetylation(GO:0043966) |
| 0.0 | 0.7 | GO:0046329 | negative regulation of JNK cascade(GO:0046329) |
| 0.0 | 0.6 | GO:0021680 | cerebellar Purkinje cell layer development(GO:0021680) |
| 0.0 | 0.2 | GO:0072189 | ureter development(GO:0072189) |
| 0.0 | 0.3 | GO:2001135 | regulation of endocytic recycling(GO:2001135) |
| 0.0 | 0.2 | GO:0030643 | cellular phosphate ion homeostasis(GO:0030643) cellular trivalent inorganic anion homeostasis(GO:0072502) |
| 0.0 | 0.6 | GO:0072661 | protein targeting to plasma membrane(GO:0072661) |
| 0.0 | 0.7 | GO:0032012 | regulation of ARF protein signal transduction(GO:0032012) |
| 0.0 | 0.5 | GO:0006359 | regulation of transcription from RNA polymerase III promoter(GO:0006359) |
| 0.0 | 0.0 | GO:0071962 | mitotic sister chromatid cohesion, centromeric(GO:0071962) |
| 0.0 | 0.7 | GO:0070534 | protein K63-linked ubiquitination(GO:0070534) |
| 0.0 | 0.2 | GO:0007638 | mechanosensory behavior(GO:0007638) |
| 0.0 | 0.1 | GO:2000645 | negative regulation of receptor catabolic process(GO:2000645) |
| 0.0 | 0.2 | GO:0018206 | peptidyl-methionine modification(GO:0018206) |
| 0.0 | 0.2 | GO:0021756 | striatum development(GO:0021756) |
| 0.0 | 0.1 | GO:0006500 | N-terminal protein palmitoylation(GO:0006500) |
| 0.0 | 0.3 | GO:0006516 | glycoprotein catabolic process(GO:0006516) |
| 0.0 | 0.0 | GO:0071344 | diphosphate metabolic process(GO:0071344) |
| 0.0 | 1.1 | GO:0035176 | social behavior(GO:0035176) intraspecies interaction between organisms(GO:0051703) |
| 0.0 | 0.2 | GO:0021554 | optic nerve development(GO:0021554) |
| 0.0 | 1.7 | GO:0006919 | activation of cysteine-type endopeptidase activity involved in apoptotic process(GO:0006919) |
| 0.0 | 0.2 | GO:0006559 | L-phenylalanine metabolic process(GO:0006558) L-phenylalanine catabolic process(GO:0006559) erythrose 4-phosphate/phosphoenolpyruvate family amino acid metabolic process(GO:1902221) erythrose 4-phosphate/phosphoenolpyruvate family amino acid catabolic process(GO:1902222) |
| 0.0 | 0.5 | GO:0006471 | protein ADP-ribosylation(GO:0006471) |
| 0.0 | 0.3 | GO:0006744 | ubiquinone biosynthetic process(GO:0006744) quinone biosynthetic process(GO:1901663) |
| 0.0 | 0.1 | GO:0045905 | translational frameshifting(GO:0006452) positive regulation of translational termination(GO:0045905) |
| 0.0 | 0.0 | GO:0035674 | tricarboxylic acid transmembrane transport(GO:0035674) |
| 0.0 | 0.2 | GO:0035278 | miRNA mediated inhibition of translation(GO:0035278) negative regulation of translation, ncRNA-mediated(GO:0040033) regulation of translation, ncRNA-mediated(GO:0045974) |
| 0.0 | 0.2 | GO:0030422 | production of siRNA involved in RNA interference(GO:0030422) |
| 0.0 | 0.1 | GO:0015811 | L-cystine transport(GO:0015811) |
| 0.0 | 0.1 | GO:0048251 | elastic fiber assembly(GO:0048251) |
| 0.0 | 1.1 | GO:0007157 | heterophilic cell-cell adhesion via plasma membrane cell adhesion molecules(GO:0007157) |
| 0.0 | 0.9 | GO:0060395 | SMAD protein signal transduction(GO:0060395) |
| 0.0 | 0.3 | GO:0071420 | response to histamine(GO:0034776) cellular response to histamine(GO:0071420) |
| 0.0 | 0.3 | GO:0032094 | response to food(GO:0032094) |
| 0.0 | 0.1 | GO:0075525 | viral translational termination-reinitiation(GO:0075525) |
| 0.0 | 0.2 | GO:0042921 | glucocorticoid receptor signaling pathway(GO:0042921) |
| 0.0 | 0.2 | GO:0060856 | establishment of blood-brain barrier(GO:0060856) |
| 0.0 | 0.1 | GO:0044210 | 'de novo' CTP biosynthetic process(GO:0044210) |
| 0.0 | 0.5 | GO:0007140 | male meiosis(GO:0007140) |
| 0.0 | 0.2 | GO:1904424 | positive regulation of growth hormone secretion(GO:0060124) regulation of GTP binding(GO:1904424) |
| 0.0 | 0.5 | GO:0009268 | response to pH(GO:0009268) |
Gene overrepresentation in cellular component category:
| Log-likelihood per target | Total log-likelihood | Term | Description |
|---|---|---|---|
| 1.4 | 5.5 | GO:0031084 | BLOC-2 complex(GO:0031084) |
| 0.7 | 3.7 | GO:0033596 | TSC1-TSC2 complex(GO:0033596) |
| 0.7 | 3.4 | GO:1902737 | dendritic filopodium(GO:1902737) |
| 0.6 | 7.1 | GO:0000439 | core TFIIH complex(GO:0000439) |
| 0.5 | 5.2 | GO:0005826 | actomyosin contractile ring(GO:0005826) |
| 0.5 | 3.3 | GO:0000801 | central element(GO:0000801) |
| 0.4 | 2.3 | GO:0000221 | vacuolar proton-transporting V-type ATPase, V1 domain(GO:0000221) |
| 0.4 | 1.1 | GO:0044611 | nuclear pore inner ring(GO:0044611) |
| 0.4 | 3.9 | GO:0045252 | oxoglutarate dehydrogenase complex(GO:0045252) |
| 0.3 | 5.0 | GO:0097512 | cardiac myofibril(GO:0097512) |
| 0.3 | 3.1 | GO:0036157 | outer dynein arm(GO:0036157) |
| 0.3 | 2.7 | GO:0030893 | meiotic cohesin complex(GO:0030893) |
| 0.3 | 1.3 | GO:0005960 | glycine cleavage complex(GO:0005960) |
| 0.2 | 1.0 | GO:0097125 | cyclin B1-CDK1 complex(GO:0097125) |
| 0.2 | 0.2 | GO:1990023 | mitotic spindle midzone(GO:1990023) |
| 0.2 | 0.9 | GO:0035101 | FACT complex(GO:0035101) |
| 0.2 | 7.8 | GO:1990124 | messenger ribonucleoprotein complex(GO:1990124) |
| 0.2 | 0.7 | GO:0000229 | cytoplasmic chromosome(GO:0000229) |
| 0.2 | 2.3 | GO:0005879 | axonemal microtubule(GO:0005879) |
| 0.2 | 5.9 | GO:0005671 | Ada2/Gcn5/Ada3 transcription activator complex(GO:0005671) |
| 0.2 | 0.6 | GO:1990843 | subsarcolemmal mitochondrion(GO:1990843) interfibrillar mitochondrion(GO:1990844) |
| 0.2 | 1.0 | GO:0070044 | synaptobrevin 2-SNAP-25-syntaxin-1a complex(GO:0070044) |
| 0.2 | 0.7 | GO:0030956 | glutamyl-tRNA(Gln) amidotransferase complex(GO:0030956) |
| 0.2 | 3.1 | GO:0033391 | chromatoid body(GO:0033391) |
| 0.2 | 1.0 | GO:0048476 | Holliday junction resolvase complex(GO:0048476) |
| 0.1 | 0.7 | GO:0030906 | retromer, cargo-selective complex(GO:0030906) |
| 0.1 | 0.7 | GO:0035841 | new growing cell tip(GO:0035841) |
| 0.1 | 1.3 | GO:1990635 | proximal dendrite(GO:1990635) |
| 0.1 | 1.1 | GO:0070695 | FHF complex(GO:0070695) |
| 0.1 | 1.7 | GO:0005672 | transcription factor TFIIA complex(GO:0005672) |
| 0.1 | 0.5 | GO:0098592 | cytoplasmic side of apical plasma membrane(GO:0098592) |
| 0.1 | 0.7 | GO:1990131 | Gtr1-Gtr2 GTPase complex(GO:1990131) |
| 0.1 | 1.4 | GO:0031466 | Cul5-RING ubiquitin ligase complex(GO:0031466) |
| 0.1 | 0.9 | GO:0033263 | CORVET complex(GO:0033263) |
| 0.1 | 0.3 | GO:0042565 | RNA nuclear export complex(GO:0042565) |
| 0.1 | 1.2 | GO:0005664 | origin recognition complex(GO:0000808) nuclear origin of replication recognition complex(GO:0005664) |
| 0.1 | 1.2 | GO:0043190 | ATP-binding cassette (ABC) transporter complex(GO:0043190) |
| 0.1 | 1.4 | GO:0030914 | STAGA complex(GO:0030914) |
| 0.1 | 1.1 | GO:0044294 | dendritic growth cone(GO:0044294) |
| 0.1 | 1.3 | GO:0033018 | sarcoplasmic reticulum lumen(GO:0033018) |
| 0.1 | 2.3 | GO:0097225 | sperm midpiece(GO:0097225) |
| 0.1 | 1.9 | GO:0030127 | COPII vesicle coat(GO:0030127) |
| 0.1 | 0.1 | GO:0043614 | multi-eIF complex(GO:0043614) |
| 0.1 | 0.4 | GO:0071148 | TEAD-1-YAP complex(GO:0071148) TEAD-2-YAP complex(GO:0071149) |
| 0.1 | 0.3 | GO:0097057 | TRAF2-GSTP1 complex(GO:0097057) |
| 0.1 | 0.8 | GO:0032777 | Piccolo NuA4 histone acetyltransferase complex(GO:0032777) |
| 0.1 | 1.5 | GO:0005751 | mitochondrial respiratory chain complex IV(GO:0005751) |
| 0.1 | 0.5 | GO:0033186 | CAF-1 complex(GO:0033186) |
| 0.1 | 1.3 | GO:0002199 | zona pellucida receptor complex(GO:0002199) |
| 0.1 | 3.6 | GO:0002080 | acrosomal membrane(GO:0002080) |
| 0.1 | 2.8 | GO:0031143 | pseudopodium(GO:0031143) |
| 0.1 | 1.0 | GO:0072546 | ER membrane protein complex(GO:0072546) |
| 0.1 | 4.7 | GO:0031430 | M band(GO:0031430) |
| 0.1 | 5.4 | GO:0016235 | aggresome(GO:0016235) |
| 0.1 | 0.3 | GO:0071008 | U2-type post-mRNA release spliceosomal complex(GO:0071008) |
| 0.1 | 0.2 | GO:0097135 | cyclin E2-CDK2 complex(GO:0097135) |
| 0.1 | 1.8 | GO:0000780 | condensed nuclear chromosome, centromeric region(GO:0000780) |
| 0.1 | 0.3 | GO:1990498 | mitotic spindle microtubule(GO:1990498) |
| 0.1 | 0.7 | GO:0005786 | signal recognition particle, endoplasmic reticulum targeting(GO:0005786) |
| 0.1 | 1.1 | GO:0032039 | integrator complex(GO:0032039) |
| 0.1 | 1.1 | GO:0090543 | Flemming body(GO:0090543) |
| 0.1 | 0.2 | GO:0008537 | proteasome activator complex(GO:0008537) |
| 0.1 | 0.3 | GO:0030905 | retromer, tubulation complex(GO:0030905) |
| 0.1 | 0.5 | GO:0030896 | checkpoint clamp complex(GO:0030896) |
| 0.1 | 0.3 | GO:0005899 | insulin receptor complex(GO:0005899) |
| 0.1 | 0.5 | GO:0030915 | Smc5-Smc6 complex(GO:0030915) |
| 0.1 | 1.4 | GO:0000242 | pericentriolar material(GO:0000242) |
| 0.1 | 0.6 | GO:0031313 | extrinsic component of endosome membrane(GO:0031313) |
| 0.1 | 0.4 | GO:0033553 | rDNA heterochromatin(GO:0033553) |
| 0.1 | 4.1 | GO:0005834 | heterotrimeric G-protein complex(GO:0005834) |
| 0.0 | 0.8 | GO:0071203 | WASH complex(GO:0071203) |
| 0.0 | 0.2 | GO:0045323 | interleukin-1 receptor complex(GO:0045323) |
| 0.0 | 2.1 | GO:0044665 | MLL1/2 complex(GO:0044665) MLL1 complex(GO:0071339) |
| 0.0 | 0.5 | GO:0071818 | BAT3 complex(GO:0071818) ER membrane insertion complex(GO:0072379) |
| 0.0 | 0.7 | GO:0030123 | AP-3 adaptor complex(GO:0030123) |
| 0.0 | 3.2 | GO:0042645 | nucleoid(GO:0009295) mitochondrial nucleoid(GO:0042645) |
| 0.0 | 1.1 | GO:0016461 | unconventional myosin complex(GO:0016461) |
| 0.0 | 3.2 | GO:0005762 | organellar large ribosomal subunit(GO:0000315) mitochondrial large ribosomal subunit(GO:0005762) |
| 0.0 | 0.1 | GO:1902636 | kinociliary basal body(GO:1902636) |
| 0.0 | 0.5 | GO:0000506 | glycosylphosphatidylinositol-N-acetylglucosaminyltransferase (GPI-GnT) complex(GO:0000506) |
| 0.0 | 3.7 | GO:0032592 | integral component of mitochondrial membrane(GO:0032592) |
| 0.0 | 1.2 | GO:0035327 | transcriptionally active chromatin(GO:0035327) |
| 0.0 | 0.2 | GO:0098855 | HCN channel complex(GO:0098855) |
| 0.0 | 2.7 | GO:0009925 | basal plasma membrane(GO:0009925) |
| 0.0 | 0.6 | GO:0005869 | dynactin complex(GO:0005869) |
| 0.0 | 0.5 | GO:0071204 | histone pre-mRNA 3'end processing complex(GO:0071204) |
| 0.0 | 0.6 | GO:0070187 | telosome(GO:0070187) |
| 0.0 | 0.3 | GO:0033180 | proton-transporting V-type ATPase, V1 domain(GO:0033180) |
| 0.0 | 0.5 | GO:0030991 | intraciliary transport particle A(GO:0030991) |
| 0.0 | 0.8 | GO:0005847 | mRNA cleavage and polyadenylation specificity factor complex(GO:0005847) |
| 0.0 | 0.2 | GO:0005968 | Rab-protein geranylgeranyltransferase complex(GO:0005968) |
| 0.0 | 0.2 | GO:0002177 | manchette(GO:0002177) |
| 0.0 | 0.3 | GO:0002169 | 3-methylcrotonyl-CoA carboxylase complex, mitochondrial(GO:0002169) methylcrotonoyl-CoA carboxylase complex(GO:1905202) |
| 0.0 | 1.0 | GO:0005682 | U5 snRNP(GO:0005682) |
| 0.0 | 3.5 | GO:0097014 | axoneme(GO:0005930) ciliary plasm(GO:0097014) |
| 0.0 | 0.6 | GO:0005641 | nuclear envelope lumen(GO:0005641) |
| 0.0 | 2.4 | GO:0005844 | polysome(GO:0005844) |
| 0.0 | 0.7 | GO:0060077 | inhibitory synapse(GO:0060077) |
| 0.0 | 2.1 | GO:0019005 | SCF ubiquitin ligase complex(GO:0019005) |
| 0.0 | 6.4 | GO:0030018 | Z disc(GO:0030018) |
| 0.0 | 0.5 | GO:0099634 | postsynaptic specialization membrane(GO:0099634) |
| 0.0 | 0.5 | GO:0000153 | cytoplasmic ubiquitin ligase complex(GO:0000153) |
| 0.0 | 3.7 | GO:0031514 | motile cilium(GO:0031514) |
| 0.0 | 0.4 | GO:0035631 | CD40 receptor complex(GO:0035631) |
| 0.0 | 0.2 | GO:0032391 | photoreceptor connecting cilium(GO:0032391) |
| 0.0 | 0.2 | GO:0035985 | senescence-associated heterochromatin focus(GO:0035985) |
| 0.0 | 5.6 | GO:0001650 | fibrillar center(GO:0001650) |
| 0.0 | 0.1 | GO:0035032 | phosphatidylinositol 3-kinase complex, class III(GO:0035032) |
| 0.0 | 0.1 | GO:0035189 | Rb-E2F complex(GO:0035189) |
| 0.0 | 2.3 | GO:0005746 | mitochondrial respiratory chain(GO:0005746) |
| 0.0 | 0.7 | GO:0033176 | proton-transporting V-type ATPase complex(GO:0033176) |
| 0.0 | 0.2 | GO:0034388 | Pwp2p-containing subcomplex of 90S preribosome(GO:0034388) |
| 0.0 | 2.3 | GO:0030017 | sarcomere(GO:0030017) |
| 0.0 | 3.6 | GO:0017053 | transcriptional repressor complex(GO:0017053) |
| 0.0 | 0.4 | GO:0008091 | spectrin(GO:0008091) |
| 0.0 | 0.3 | GO:0044233 | ER-mitochondrion membrane contact site(GO:0044233) |
| 0.0 | 1.0 | GO:0034364 | high-density lipoprotein particle(GO:0034364) |
| 0.0 | 0.6 | GO:0030686 | 90S preribosome(GO:0030686) |
| 0.0 | 2.4 | GO:0000922 | spindle pole(GO:0000922) |
| 0.0 | 0.2 | GO:0005827 | polar microtubule(GO:0005827) |
| 0.0 | 0.6 | GO:0000407 | pre-autophagosomal structure(GO:0000407) |
| 0.0 | 0.5 | GO:1902562 | NuA4 histone acetyltransferase complex(GO:0035267) H4/H2A histone acetyltransferase complex(GO:0043189) H4 histone acetyltransferase complex(GO:1902562) |
| 0.0 | 0.2 | GO:0016600 | flotillin complex(GO:0016600) |
| 0.0 | 0.5 | GO:0030687 | preribosome, large subunit precursor(GO:0030687) |
| 0.0 | 0.1 | GO:0090498 | extrinsic component of Golgi membrane(GO:0090498) |
| 0.0 | 1.8 | GO:0016528 | sarcoplasm(GO:0016528) |
| 0.0 | 0.1 | GO:0016589 | NURF complex(GO:0016589) |
| 0.0 | 0.2 | GO:0030904 | retromer complex(GO:0030904) |
| 0.0 | 0.6 | GO:0005614 | interstitial matrix(GO:0005614) |
| 0.0 | 10.2 | GO:0005874 | microtubule(GO:0005874) |
| 0.0 | 1.2 | GO:0033116 | endoplasmic reticulum-Golgi intermediate compartment membrane(GO:0033116) |
| 0.0 | 0.4 | GO:0016327 | apicolateral plasma membrane(GO:0016327) |
| 0.0 | 1.4 | GO:0005902 | microvillus(GO:0005902) |
| 0.0 | 0.3 | GO:0098563 | integral component of synaptic vesicle membrane(GO:0030285) intrinsic component of synaptic vesicle membrane(GO:0098563) |
| 0.0 | 0.8 | GO:0048786 | presynaptic active zone(GO:0048786) |
| 0.0 | 1.3 | GO:0031093 | platelet alpha granule lumen(GO:0031093) |
| 0.0 | 0.2 | GO:0031465 | Cul4B-RING E3 ubiquitin ligase complex(GO:0031465) |
| 0.0 | 1.4 | GO:0005643 | nuclear pore(GO:0005643) |
| 0.0 | 0.3 | GO:0000178 | exosome (RNase complex)(GO:0000178) |
| 0.0 | 1.2 | GO:0005778 | peroxisomal membrane(GO:0005778) microbody membrane(GO:0031903) |
| 0.0 | 0.1 | GO:0070557 | PCNA-p21 complex(GO:0070557) |
Gene overrepresentation in molecular function category:
| Log-likelihood per target | Total log-likelihood | Term | Description |
|---|---|---|---|
| 1.5 | 6.2 | GO:0005163 | nerve growth factor receptor binding(GO:0005163) |
| 0.7 | 2.0 | GO:0070538 | oleic acid binding(GO:0070538) |
| 0.7 | 4.0 | GO:0030375 | thyroid hormone receptor activator activity(GO:0010861) thyroid hormone receptor coactivator activity(GO:0030375) |
| 0.6 | 3.9 | GO:0004591 | oxoglutarate dehydrogenase (succinyl-transferring) activity(GO:0004591) |
| 0.5 | 1.5 | GO:0008746 | NAD(P)+ transhydrogenase activity(GO:0008746) oxidoreductase activity, acting on NAD(P)H, NAD(P) as acceptor(GO:0016652) |
| 0.5 | 2.4 | GO:0004802 | transketolase activity(GO:0004802) |
| 0.4 | 1.3 | GO:0004047 | aminomethyltransferase activity(GO:0004047) |
| 0.4 | 1.7 | GO:0042132 | fructose 1,6-bisphosphate 1-phosphatase activity(GO:0042132) |
| 0.4 | 1.5 | GO:0070095 | fructose-6-phosphate binding(GO:0070095) |
| 0.4 | 1.1 | GO:0070362 | mitochondrial light strand promoter anti-sense binding(GO:0070361) mitochondrial heavy strand promoter anti-sense binding(GO:0070362) mitochondrial heavy strand promoter sense binding(GO:0070364) |
| 0.4 | 1.1 | GO:0004574 | oligo-1,6-glucosidase activity(GO:0004574) |
| 0.3 | 3.4 | GO:0034046 | poly(G) binding(GO:0034046) |
| 0.3 | 1.7 | GO:0070905 | serine binding(GO:0070905) |
| 0.3 | 1.0 | GO:0016309 | 1-phosphatidylinositol-5-phosphate 4-kinase activity(GO:0016309) |
| 0.3 | 1.0 | GO:0015218 | pyrimidine nucleotide transmembrane transporter activity(GO:0015218) |
| 0.3 | 1.7 | GO:0042030 | ATPase inhibitor activity(GO:0042030) |
| 0.3 | 0.9 | GO:0015182 | L-histidine transmembrane transporter activity(GO:0005290) L-asparagine transmembrane transporter activity(GO:0015182) |
| 0.3 | 1.1 | GO:0004733 | pyridoxamine-phosphate oxidase activity(GO:0004733) |
| 0.3 | 1.1 | GO:0004853 | uroporphyrinogen decarboxylase activity(GO:0004853) |
| 0.3 | 3.8 | GO:0047499 | calcium-independent phospholipase A2 activity(GO:0047499) |
| 0.3 | 6.6 | GO:0008353 | RNA polymerase II carboxy-terminal domain kinase activity(GO:0008353) |
| 0.3 | 5.3 | GO:0031681 | G-protein beta-subunit binding(GO:0031681) |
| 0.2 | 1.5 | GO:0004741 | [pyruvate dehydrogenase (lipoamide)] phosphatase activity(GO:0004741) |
| 0.2 | 7.2 | GO:0035925 | mRNA 3'-UTR AU-rich region binding(GO:0035925) |
| 0.2 | 1.0 | GO:0005483 | soluble NSF attachment protein activity(GO:0005483) |
| 0.2 | 1.1 | GO:0032795 | heterotrimeric G-protein binding(GO:0032795) |
| 0.2 | 3.1 | GO:0045504 | dynein heavy chain binding(GO:0045504) |
| 0.2 | 2.1 | GO:0008865 | glucokinase activity(GO:0004340) hexokinase activity(GO:0004396) fructokinase activity(GO:0008865) mannokinase activity(GO:0019158) |
| 0.2 | 5.0 | GO:0032036 | myosin heavy chain binding(GO:0032036) |
| 0.2 | 0.8 | GO:0001601 | peptide YY receptor activity(GO:0001601) |
| 0.2 | 0.6 | GO:0035605 | peptidyl-cysteine S-nitrosylase activity(GO:0035605) |
| 0.2 | 1.8 | GO:0061665 | SUMO ligase activity(GO:0061665) |
| 0.2 | 0.8 | GO:0052810 | 1-phosphatidylinositol-5-kinase activity(GO:0052810) |
| 0.2 | 1.0 | GO:0061575 | cyclin-dependent protein serine/threonine kinase activator activity(GO:0061575) |
| 0.2 | 0.6 | GO:0005308 | creatine transmembrane transporter activity(GO:0005308) |
| 0.2 | 0.7 | GO:0050567 | glutaminyl-tRNA synthase (glutamine-hydrolyzing) activity(GO:0050567) |
| 0.2 | 1.3 | GO:0003873 | 6-phosphofructo-2-kinase activity(GO:0003873) |
| 0.2 | 1.1 | GO:0050252 | retinol O-fatty-acyltransferase activity(GO:0050252) |
| 0.2 | 0.7 | GO:0003953 | NAD+ nucleosidase activity(GO:0003953) |
| 0.2 | 1.0 | GO:0030976 | thiamine pyrophosphate binding(GO:0030976) |
| 0.2 | 0.8 | GO:0036033 | mediator complex binding(GO:0036033) |
| 0.2 | 0.5 | GO:0099530 | G-protein coupled receptor activity involved in regulation of postsynaptic membrane potential(GO:0099530) |
| 0.2 | 1.1 | GO:0015562 | efflux transmembrane transporter activity(GO:0015562) |
| 0.2 | 0.8 | GO:0008466 | glycogenin glucosyltransferase activity(GO:0008466) |
| 0.2 | 1.1 | GO:0005119 | smoothened binding(GO:0005119) hedgehog family protein binding(GO:0097108) |
| 0.2 | 0.5 | GO:0019777 | Atg12 transferase activity(GO:0019777) |
| 0.1 | 2.2 | GO:0015129 | lactate transmembrane transporter activity(GO:0015129) |
| 0.1 | 3.9 | GO:0031432 | titin binding(GO:0031432) |
| 0.1 | 0.8 | GO:0045174 | glutathione dehydrogenase (ascorbate) activity(GO:0045174) methylarsonate reductase activity(GO:0050610) |
| 0.1 | 0.7 | GO:0019912 | cyclin-dependent protein kinase activating kinase activity(GO:0019912) |
| 0.1 | 1.0 | GO:0017108 | 5'-flap endonuclease activity(GO:0017108) |
| 0.1 | 0.8 | GO:0004647 | phosphoserine phosphatase activity(GO:0004647) |
| 0.1 | 2.7 | GO:0015250 | water channel activity(GO:0015250) |
| 0.1 | 0.5 | GO:0004963 | follicle-stimulating hormone receptor activity(GO:0004963) |
| 0.1 | 0.4 | GO:0015633 | zinc transporting ATPase activity(GO:0015633) |
| 0.1 | 1.5 | GO:0001162 | RNA polymerase II intronic transcription regulatory region sequence-specific DNA binding(GO:0001162) |
| 0.1 | 1.7 | GO:0030274 | LIM domain binding(GO:0030274) |
| 0.1 | 1.0 | GO:0004095 | carnitine O-palmitoyltransferase activity(GO:0004095) |
| 0.1 | 0.4 | GO:0032129 | histone deacetylase activity (H3-K9 specific)(GO:0032129) NAD-dependent histone deacetylase activity (H3-K9 specific)(GO:0046969) |
| 0.1 | 0.7 | GO:0050833 | pyruvate transmembrane transporter activity(GO:0050833) |
| 0.1 | 0.3 | GO:0000224 | peptide-N4-(N-acetyl-beta-glucosaminyl)asparagine amidase activity(GO:0000224) |
| 0.1 | 0.3 | GO:0035730 | S-nitrosoglutathione binding(GO:0035730) dinitrosyl-iron complex binding(GO:0035731) |
| 0.1 | 1.0 | GO:0008821 | crossover junction endodeoxyribonuclease activity(GO:0008821) |
| 0.1 | 0.4 | GO:0008384 | IkappaB kinase activity(GO:0008384) |
| 0.1 | 0.3 | GO:0090631 | pre-miRNA transporter activity(GO:0090631) |
| 0.1 | 0.5 | GO:0005010 | insulin-like growth factor-activated receptor activity(GO:0005010) |
| 0.1 | 1.2 | GO:0019826 | oxygen sensor activity(GO:0019826) |
| 0.1 | 1.3 | GO:0008553 | hydrogen-exporting ATPase activity, phosphorylative mechanism(GO:0008553) |
| 0.1 | 0.3 | GO:0046577 | long-chain-alcohol oxidase activity(GO:0046577) |
| 0.1 | 5.0 | GO:0070577 | lysine-acetylated histone binding(GO:0070577) |
| 0.1 | 2.1 | GO:0005068 | transmembrane receptor protein tyrosine kinase adaptor activity(GO:0005068) |
| 0.1 | 1.5 | GO:0008020 | G-protein coupled photoreceptor activity(GO:0008020) |
| 0.1 | 3.3 | GO:0032794 | GTPase activating protein binding(GO:0032794) |
| 0.1 | 0.5 | GO:0004348 | glucosylceramidase activity(GO:0004348) |
| 0.1 | 0.6 | GO:0005105 | type 1 fibroblast growth factor receptor binding(GO:0005105) |
| 0.1 | 0.3 | GO:0002094 | polyprenyltransferase activity(GO:0002094) |
| 0.1 | 0.3 | GO:0072545 | tyrosine binding(GO:0072545) |
| 0.1 | 0.9 | GO:0019784 | NEDD8-specific protease activity(GO:0019784) |
| 0.1 | 0.7 | GO:0015180 | L-alanine transmembrane transporter activity(GO:0015180) alanine transmembrane transporter activity(GO:0022858) |
| 0.1 | 0.7 | GO:0030942 | endoplasmic reticulum signal peptide binding(GO:0030942) |
| 0.1 | 0.3 | GO:0008892 | guanine deaminase activity(GO:0008892) |
| 0.1 | 0.3 | GO:0031687 | A2A adenosine receptor binding(GO:0031687) |
| 0.1 | 0.4 | GO:0015183 | L-aspartate transmembrane transporter activity(GO:0015183) |
| 0.1 | 0.6 | GO:0016833 | oxo-acid-lyase activity(GO:0016833) |
| 0.1 | 5.3 | GO:0050699 | WW domain binding(GO:0050699) |
| 0.1 | 0.2 | GO:0004980 | melanocyte-stimulating hormone receptor activity(GO:0004980) |
| 0.1 | 2.0 | GO:0036312 | phosphatidylinositol 3-kinase regulatory subunit binding(GO:0036312) |
| 0.1 | 1.5 | GO:0019911 | structural constituent of myelin sheath(GO:0019911) |
| 0.1 | 1.4 | GO:0042975 | peroxisome proliferator activated receptor binding(GO:0042975) |
| 0.1 | 0.3 | GO:0019144 | ADP-sugar diphosphatase activity(GO:0019144) |
| 0.1 | 0.3 | GO:1990460 | leptin receptor binding(GO:1990460) |
| 0.1 | 0.3 | GO:0003985 | acetyl-CoA C-acetyltransferase activity(GO:0003985) |
| 0.1 | 0.7 | GO:0050682 | AF-2 domain binding(GO:0050682) |
| 0.1 | 1.2 | GO:0050693 | LBD domain binding(GO:0050693) |
| 0.1 | 7.4 | GO:0005544 | calcium-dependent phospholipid binding(GO:0005544) |
| 0.1 | 0.3 | GO:0004461 | lactose synthase activity(GO:0004461) |
| 0.1 | 0.7 | GO:0048039 | ubiquinone binding(GO:0048039) |
| 0.1 | 1.1 | GO:0017056 | structural constituent of nuclear pore(GO:0017056) |
| 0.1 | 2.4 | GO:0034237 | protein kinase A regulatory subunit binding(GO:0034237) |
| 0.1 | 0.2 | GO:0016838 | carbon-oxygen lyase activity, acting on phosphates(GO:0016838) |
| 0.1 | 1.3 | GO:0036442 | hydrogen-exporting ATPase activity(GO:0036442) |
| 0.1 | 0.3 | GO:0004370 | glycerol kinase activity(GO:0004370) |
| 0.1 | 0.4 | GO:0050816 | phosphoserine binding(GO:0050815) phosphothreonine binding(GO:0050816) |
| 0.1 | 0.5 | GO:0017176 | phosphatidylinositol N-acetylglucosaminyltransferase activity(GO:0017176) |
| 0.1 | 2.6 | GO:0005109 | frizzled binding(GO:0005109) |
| 0.1 | 1.0 | GO:0010314 | phosphatidylinositol-5-phosphate binding(GO:0010314) |
| 0.0 | 1.0 | GO:0009982 | pseudouridine synthase activity(GO:0009982) |
| 0.0 | 0.3 | GO:0033188 | sphingomyelin synthase activity(GO:0033188) ceramide cholinephosphotransferase activity(GO:0047493) |
| 0.0 | 0.3 | GO:0003987 | acetate-CoA ligase activity(GO:0003987) |
| 0.0 | 1.7 | GO:0016676 | cytochrome-c oxidase activity(GO:0004129) heme-copper terminal oxidase activity(GO:0015002) oxidoreductase activity, acting on a heme group of donors, oxygen as acceptor(GO:0016676) |
| 0.0 | 0.2 | GO:0016716 | oxidoreductase activity, acting on paired donors, with incorporation or reduction of molecular oxygen, another compound as one donor, and incorporation of one atom of oxygen(GO:0016716) |
| 0.0 | 2.9 | GO:0061631 | ubiquitin conjugating enzyme activity(GO:0061631) |
| 0.0 | 1.6 | GO:0004707 | MAP kinase activity(GO:0004707) |
| 0.0 | 0.2 | GO:0035501 | MH1 domain binding(GO:0035501) |
| 0.0 | 0.4 | GO:1904288 | BAT3 complex binding(GO:1904288) |
| 0.0 | 1.2 | GO:0070402 | NADPH binding(GO:0070402) |
| 0.0 | 0.3 | GO:0030618 | transforming growth factor beta receptor, pathway-specific cytoplasmic mediator activity(GO:0030618) |
| 0.0 | 0.2 | GO:0004663 | Rab geranylgeranyltransferase activity(GO:0004663) |
| 0.0 | 0.5 | GO:0003997 | acyl-CoA oxidase activity(GO:0003997) |
| 0.0 | 1.2 | GO:0097493 | structural molecule activity conferring elasticity(GO:0097493) |
| 0.0 | 0.6 | GO:0050291 | sphingosine N-acyltransferase activity(GO:0050291) |
| 0.0 | 0.8 | GO:0008179 | adenylate cyclase binding(GO:0008179) |
| 0.0 | 1.9 | GO:0008139 | nuclear localization sequence binding(GO:0008139) |
| 0.0 | 0.2 | GO:0016426 | tRNA (adenine) methyltransferase activity(GO:0016426) |
| 0.0 | 1.1 | GO:0005095 | GTPase inhibitor activity(GO:0005095) |
| 0.0 | 0.2 | GO:0004489 | methylenetetrahydrofolate reductase (NAD(P)H) activity(GO:0004489) |
| 0.0 | 0.2 | GO:0004001 | adenosine kinase activity(GO:0004001) |
| 0.0 | 1.2 | GO:0051537 | 2 iron, 2 sulfur cluster binding(GO:0051537) |
| 0.0 | 0.2 | GO:0004505 | phenylalanine 4-monooxygenase activity(GO:0004505) |
| 0.0 | 0.2 | GO:0017095 | heparan sulfate 6-O-sulfotransferase activity(GO:0017095) |
| 0.0 | 0.2 | GO:0051185 | coenzyme transporter activity(GO:0051185) |
| 0.0 | 0.6 | GO:0003688 | DNA replication origin binding(GO:0003688) |
| 0.0 | 0.1 | GO:0051990 | (R)-2-hydroxyglutarate dehydrogenase activity(GO:0051990) |
| 0.0 | 0.4 | GO:0051880 | G-quadruplex DNA binding(GO:0051880) |
| 0.0 | 0.5 | GO:0008568 | microtubule-severing ATPase activity(GO:0008568) |
| 0.0 | 1.2 | GO:0005003 | ephrin receptor activity(GO:0005003) |
| 0.0 | 0.6 | GO:0003996 | acyl-CoA ligase activity(GO:0003996) |
| 0.0 | 0.1 | GO:0046970 | NAD-dependent histone deacetylase activity (H4-K16 specific)(GO:0046970) |
| 0.0 | 0.2 | GO:0008823 | cupric reductase activity(GO:0008823) ferric-chelate reductase (NADPH) activity(GO:0052851) |
| 0.0 | 0.1 | GO:0016639 | oxidoreductase activity, acting on the CH-NH2 group of donors, NAD or NADP as acceptor(GO:0016639) |
| 0.0 | 0.1 | GO:0004937 | alpha1-adrenergic receptor activity(GO:0004937) |
| 0.0 | 0.4 | GO:0004565 | beta-galactosidase activity(GO:0004565) |
| 0.0 | 1.5 | GO:0051959 | dynein light intermediate chain binding(GO:0051959) |
| 0.0 | 0.3 | GO:0004485 | methylcrotonoyl-CoA carboxylase activity(GO:0004485) |
| 0.0 | 0.5 | GO:0019871 | sodium channel inhibitor activity(GO:0019871) |
| 0.0 | 0.1 | GO:0017129 | triglyceride binding(GO:0017129) |
| 0.0 | 0.5 | GO:0000182 | rDNA binding(GO:0000182) |
| 0.0 | 0.8 | GO:0004535 | poly(A)-specific ribonuclease activity(GO:0004535) |
| 0.0 | 2.1 | GO:0001103 | RNA polymerase II repressing transcription factor binding(GO:0001103) |
| 0.0 | 3.5 | GO:0019213 | deacetylase activity(GO:0019213) |
| 0.0 | 0.1 | GO:0003988 | acetyl-CoA C-acyltransferase activity(GO:0003988) long-chain-3-hydroxyacyl-CoA dehydrogenase activity(GO:0016509) |
| 0.0 | 0.2 | GO:0008273 | calcium, potassium:sodium antiporter activity(GO:0008273) |
| 0.0 | 0.3 | GO:0016174 | NAD(P)H oxidase activity(GO:0016174) |
| 0.0 | 0.7 | GO:0000062 | fatty-acyl-CoA binding(GO:0000062) |
| 0.0 | 0.2 | GO:0031871 | proteinase activated receptor binding(GO:0031871) |
| 0.0 | 0.1 | GO:0030337 | DNA polymerase processivity factor activity(GO:0030337) |
| 0.0 | 0.3 | GO:0070735 | protein-glycine ligase activity(GO:0070735) |
| 0.0 | 0.3 | GO:0019238 | cyclohydrolase activity(GO:0019238) |
| 0.0 | 1.9 | GO:0070491 | repressing transcription factor binding(GO:0070491) |
| 0.0 | 1.4 | GO:0071855 | neuropeptide receptor binding(GO:0071855) |
| 0.0 | 0.3 | GO:0003857 | 3-hydroxyacyl-CoA dehydrogenase activity(GO:0003857) |
| 0.0 | 1.1 | GO:0070064 | proline-rich region binding(GO:0070064) |
| 0.0 | 0.1 | GO:0047066 | phospholipid-hydroperoxide glutathione peroxidase activity(GO:0047066) |
| 0.0 | 0.4 | GO:0001758 | retinal dehydrogenase activity(GO:0001758) |
| 0.0 | 0.3 | GO:0051998 | carboxyl-O-methyltransferase activity(GO:0010340) protein carboxyl O-methyltransferase activity(GO:0051998) |
| 0.0 | 0.2 | GO:0061133 | endopeptidase activator activity(GO:0061133) |
| 0.0 | 0.3 | GO:0031698 | beta-2 adrenergic receptor binding(GO:0031698) |
| 0.0 | 0.1 | GO:0072590 | N-acetyl-L-aspartate-L-glutamate ligase activity(GO:0072590) |
| 0.0 | 0.9 | GO:0000030 | mannosyltransferase activity(GO:0000030) |
| 0.0 | 1.6 | GO:0048487 | beta-tubulin binding(GO:0048487) |
| 0.0 | 0.3 | GO:0008559 | xenobiotic-transporting ATPase activity(GO:0008559) |
| 0.0 | 0.3 | GO:0000774 | adenyl-nucleotide exchange factor activity(GO:0000774) |
| 0.0 | 0.2 | GO:0035243 | protein-arginine omega-N symmetric methyltransferase activity(GO:0035243) |
| 0.0 | 1.2 | GO:0031624 | ubiquitin conjugating enzyme binding(GO:0031624) |
| 0.0 | 2.2 | GO:0004177 | aminopeptidase activity(GO:0004177) |
| 0.0 | 0.4 | GO:0070324 | thyroid hormone binding(GO:0070324) |
| 0.0 | 1.0 | GO:0005234 | extracellular-glutamate-gated ion channel activity(GO:0005234) |
| 0.0 | 2.1 | GO:0050660 | flavin adenine dinucleotide binding(GO:0050660) |
| 0.0 | 0.5 | GO:0030332 | cyclin binding(GO:0030332) |
| 0.0 | 5.8 | GO:0042393 | histone binding(GO:0042393) |
| 0.0 | 0.6 | GO:0005184 | neuropeptide hormone activity(GO:0005184) |
| 0.0 | 0.2 | GO:0004594 | pantothenate kinase activity(GO:0004594) |
| 0.0 | 0.3 | GO:0001075 | transcription factor activity, RNA polymerase II core promoter sequence-specific binding involved in preinitiation complex assembly(GO:0001075) |
| 0.0 | 0.8 | GO:0004697 | protein kinase C activity(GO:0004697) |
| 0.0 | 0.2 | GO:0002151 | G-quadruplex RNA binding(GO:0002151) |
| 0.0 | 0.2 | GO:0070740 | tubulin-glutamic acid ligase activity(GO:0070740) |
| 0.0 | 0.1 | GO:0004925 | prolactin receptor activity(GO:0004925) |
| 0.0 | 0.2 | GO:0005222 | intracellular cAMP activated cation channel activity(GO:0005222) |
| 0.0 | 0.6 | GO:0005247 | voltage-gated chloride channel activity(GO:0005247) |
| 0.0 | 0.6 | GO:0033130 | acetylcholine receptor binding(GO:0033130) |
| 0.0 | 0.5 | GO:0017049 | GTP-Rho binding(GO:0017049) |
| 0.0 | 0.3 | GO:0032051 | clathrin light chain binding(GO:0032051) |
| 0.0 | 0.3 | GO:0022851 | GABA-gated chloride ion channel activity(GO:0022851) |
| 0.0 | 0.1 | GO:0036219 | GTP diphosphatase activity(GO:0036219) 2-hydroxy-adenosine triphosphate pyrophosphatase activity(GO:0044713) 2-hydroxy-(deoxy)adenosine-triphosphate pyrophosphatase activity(GO:0044714) ATP diphosphatase activity(GO:0047693) |
| 0.0 | 0.1 | GO:0004720 | protein-lysine 6-oxidase activity(GO:0004720) |
| 0.0 | 0.1 | GO:0051032 | nucleic acid transmembrane transporter activity(GO:0051032) RNA transmembrane transporter activity(GO:0051033) |
| 0.0 | 0.1 | GO:0090541 | MIT domain binding(GO:0090541) |
| 0.0 | 1.0 | GO:0035035 | histone acetyltransferase binding(GO:0035035) |
| 0.0 | 0.0 | GO:0052858 | peptidyl-lysine N-acetyltransferase activity, acting on acetyl phosphate as donor(GO:0052858) |
| 0.0 | 0.1 | GO:0004773 | steryl-sulfatase activity(GO:0004773) |
| 0.0 | 0.1 | GO:0004614 | phosphoglucomutase activity(GO:0004614) |
| 0.0 | 0.1 | GO:0008308 | voltage-gated anion channel activity(GO:0008308) |
| 0.0 | 1.9 | GO:0004722 | protein serine/threonine phosphatase activity(GO:0004722) |
| 0.0 | 0.1 | GO:0031728 | CCR3 chemokine receptor binding(GO:0031728) |
| 0.0 | 0.4 | GO:0102391 | decanoate--CoA ligase activity(GO:0102391) |
| 0.0 | 0.8 | GO:0004693 | cyclin-dependent protein serine/threonine kinase activity(GO:0004693) |
| 0.0 | 0.4 | GO:0019200 | carbohydrate kinase activity(GO:0019200) |
| 0.0 | 0.1 | GO:0033170 | DNA clamp loader activity(GO:0003689) protein-DNA loading ATPase activity(GO:0033170) |
| 0.0 | 1.1 | GO:0005160 | transforming growth factor beta receptor binding(GO:0005160) |
| 0.0 | 1.1 | GO:0016765 | transferase activity, transferring alkyl or aryl (other than methyl) groups(GO:0016765) |
| 0.0 | 0.4 | GO:0031418 | L-ascorbic acid binding(GO:0031418) |
| 0.0 | 0.2 | GO:0016842 | amidine-lyase activity(GO:0016842) |
| 0.0 | 0.0 | GO:0004342 | glucosamine-6-phosphate deaminase activity(GO:0004342) |
| 0.0 | 0.3 | GO:0034185 | apolipoprotein binding(GO:0034185) |
| 0.0 | 0.3 | GO:0004708 | MAP kinase kinase activity(GO:0004708) |
| 0.0 | 1.7 | GO:0030165 | PDZ domain binding(GO:0030165) |
| 0.0 | 0.2 | GO:0015321 | sodium-dependent phosphate transmembrane transporter activity(GO:0015321) |
| 0.0 | 0.1 | GO:0043996 | histone acetyltransferase activity (H4-K5 specific)(GO:0043995) histone acetyltransferase activity (H4-K8 specific)(GO:0043996) histone acetyltransferase activity (H4-K16 specific)(GO:0046972) |
| 0.0 | 0.1 | GO:0015184 | L-cystine transmembrane transporter activity(GO:0015184) |
| 0.0 | 0.2 | GO:0005149 | interleukin-1 receptor binding(GO:0005149) |
| 0.0 | 0.2 | GO:0052629 | phosphatidylinositol-3,5-bisphosphate 3-phosphatase activity(GO:0052629) |
| 0.0 | 0.6 | GO:0050136 | NADH dehydrogenase (ubiquinone) activity(GO:0008137) NADH dehydrogenase (quinone) activity(GO:0050136) |
| 0.0 | 0.2 | GO:0005537 | mannose binding(GO:0005537) |
| 0.0 | 0.1 | GO:0005025 | transforming growth factor beta receptor activity, type I(GO:0005025) |
| 0.0 | 0.2 | GO:0015245 | fatty acid transporter activity(GO:0015245) |
| 0.0 | 0.1 | GO:0003883 | CTP synthase activity(GO:0003883) |
| 0.0 | 0.7 | GO:0004402 | histone acetyltransferase activity(GO:0004402) |
| 0.0 | 0.2 | GO:0051371 | muscle alpha-actinin binding(GO:0051371) |
Gene overrepresentation in curated gene sets: canonical pathways category:
| Log-likelihood per target | Total log-likelihood | Term | Description |
|---|---|---|---|
| 0.2 | 6.0 | PID P38 GAMMA DELTA PATHWAY | Signaling mediated by p38-gamma and p38-delta |
| 0.2 | 4.5 | PID THROMBIN PAR4 PATHWAY | PAR4-mediated thrombin signaling events |
| 0.1 | 5.0 | PID WNT CANONICAL PATHWAY | Canonical Wnt signaling pathway |
| 0.1 | 7.3 | PID AURORA A PATHWAY | Aurora A signaling |
| 0.1 | 1.0 | PID FOXM1 PATHWAY | FOXM1 transcription factor network |
| 0.1 | 1.2 | PID RANBP2 PATHWAY | Sumoylation by RanBP2 regulates transcriptional repression |
| 0.0 | 1.0 | PID ALK2 PATHWAY | ALK2 signaling events |
| 0.0 | 1.2 | PID HIF1A PATHWAY | Hypoxic and oxygen homeostasis regulation of HIF-1-alpha |
| 0.0 | 3.4 | PID LKB1 PATHWAY | LKB1 signaling events |
| 0.0 | 0.3 | PID HDAC CLASSIII PATHWAY | Signaling events mediated by HDAC Class III |
| 0.0 | 1.1 | PID HEDGEHOG 2PATHWAY | Signaling events mediated by the Hedgehog family |
| 0.0 | 1.2 | SA B CELL RECEPTOR COMPLEXES | Antigen binding to B cell receptors activates protein tyrosine kinases, such as the Src family, which ultimate activate MAP kinases. |
| 0.0 | 0.9 | PID ECADHERIN KERATINOCYTE PATHWAY | E-cadherin signaling in keratinocytes |
| 0.0 | 1.0 | PID EPHA FWDPATHWAY | EPHA forward signaling |
| 0.0 | 3.6 | PID P75 NTR PATHWAY | p75(NTR)-mediated signaling |
| 0.0 | 1.0 | PID MYC PATHWAY | C-MYC pathway |
| 0.0 | 0.8 | PID SYNDECAN 3 PATHWAY | Syndecan-3-mediated signaling events |
| 0.0 | 1.9 | PID DELTA NP63 PATHWAY | Validated transcriptional targets of deltaNp63 isoforms |
| 0.0 | 1.3 | SIG INSULIN RECEPTOR PATHWAY IN CARDIAC MYOCYTES | Genes related to the insulin receptor pathway |
| 0.0 | 1.5 | SIG REGULATION OF THE ACTIN CYTOSKELETON BY RHO GTPASES | Genes related to regulation of the actin cytoskeleton |
| 0.0 | 1.4 | PID HNF3B PATHWAY | FOXA2 and FOXA3 transcription factor networks |
| 0.0 | 1.1 | PID AR TF PATHWAY | Regulation of Androgen receptor activity |
| 0.0 | 0.4 | ST INTERLEUKIN 4 PATHWAY | Interleukin 4 (IL-4) Pathway |
| 0.0 | 1.0 | PID PLK1 PATHWAY | PLK1 signaling events |
| 0.0 | 0.8 | PID ARF6 TRAFFICKING PATHWAY | Arf6 trafficking events |
Gene overrepresentation in curated gene sets: REACTOME pathways category:
| Log-likelihood per target | Total log-likelihood | Term | Description |
|---|---|---|---|
| 0.2 | 6.6 | REACTOME FORMATION OF INCISION COMPLEX IN GG NER | Genes involved in Formation of incision complex in GG-NER |
| 0.2 | 2.7 | REACTOME PASSIVE TRANSPORT BY AQUAPORINS | Genes involved in Passive Transport by Aquaporins |
| 0.1 | 3.2 | REACTOME REGULATION OF RHEB GTPASE ACTIVITY BY AMPK | Genes involved in Regulation of Rheb GTPase activity by AMPK |
| 0.1 | 10.8 | REACTOME STRIATED MUSCLE CONTRACTION | Genes involved in Striated Muscle Contraction |
| 0.1 | 1.9 | REACTOME E2F ENABLED INHIBITION OF PRE REPLICATION COMPLEX FORMATION | Genes involved in E2F-enabled inhibition of pre-replication complex formation |
| 0.1 | 3.8 | REACTOME ACYL CHAIN REMODELLING OF PE | Genes involved in Acyl chain remodelling of PE |
| 0.1 | 4.2 | REACTOME INSULIN RECEPTOR RECYCLING | Genes involved in Insulin receptor recycling |
| 0.1 | 1.7 | REACTOME SYNTHESIS OF SUBSTRATES IN N GLYCAN BIOSYTHESIS | Genes involved in Synthesis of substrates in N-glycan biosythesis |
| 0.1 | 2.2 | REACTOME BILE SALT AND ORGANIC ANION SLC TRANSPORTERS | Genes involved in Bile salt and organic anion SLC transporters |
| 0.1 | 1.0 | REACTOME REMOVAL OF THE FLAP INTERMEDIATE FROM THE C STRAND | Genes involved in Removal of the Flap Intermediate from the C-strand |
| 0.1 | 2.2 | REACTOME DSCAM INTERACTIONS | Genes involved in DSCAM interactions |
| 0.1 | 6.5 | REACTOME MEIOTIC SYNAPSIS | Genes involved in Meiotic Synapsis |
| 0.1 | 3.1 | REACTOME SIGNALING BY HIPPO | Genes involved in Signaling by Hippo |
| 0.1 | 0.9 | REACTOME ASSOCIATION OF LICENSING FACTORS WITH THE PRE REPLICATIVE COMPLEX | Genes involved in Association of licensing factors with the pre-replicative complex |
| 0.1 | 1.4 | REACTOME REGULATION OF PYRUVATE DEHYDROGENASE PDH COMPLEX | Genes involved in Regulation of pyruvate dehydrogenase (PDH) complex |
| 0.1 | 1.2 | REACTOME NEF MEDIATED DOWNREGULATION OF MHC CLASS I COMPLEX CELL SURFACE EXPRESSION | Genes involved in Nef mediated downregulation of MHC class I complex cell surface expression |
| 0.1 | 2.8 | REACTOME SIGNALING BY NODAL | Genes involved in Signaling by NODAL |
| 0.1 | 0.1 | REACTOME PROLONGED ERK ACTIVATION EVENTS | Genes involved in Prolonged ERK activation events |
| 0.1 | 2.2 | REACTOME RAP1 SIGNALLING | Genes involved in Rap1 signalling |
| 0.1 | 1.4 | REACTOME ACTIVATED AMPK STIMULATES FATTY ACID OXIDATION IN MUSCLE | Genes involved in Activated AMPK stimulates fatty-acid oxidation in muscle |
| 0.1 | 3.3 | REACTOME GLUCOSE TRANSPORT | Genes involved in Glucose transport |
| 0.0 | 1.4 | REACTOME CITRIC ACID CYCLE TCA CYCLE | Genes involved in Citric acid cycle (TCA cycle) |
| 0.0 | 3.6 | REACTOME GLUCONEOGENESIS | Genes involved in Gluconeogenesis |
| 0.0 | 1.3 | REACTOME GLYCOLYSIS | Genes involved in Glycolysis |
| 0.0 | 1.1 | REACTOME BRANCHED CHAIN AMINO ACID CATABOLISM | Genes involved in Branched-chain amino acid catabolism |
| 0.0 | 0.7 | REACTOME PYRUVATE METABOLISM AND CITRIC ACID TCA CYCLE | Genes involved in Pyruvate metabolism and Citric Acid (TCA) cycle |
| 0.0 | 0.4 | REACTOME P75NTR RECRUITS SIGNALLING COMPLEXES | Genes involved in p75NTR recruits signalling complexes |
| 0.0 | 1.2 | REACTOME PEROXISOMAL LIPID METABOLISM | Genes involved in Peroxisomal lipid metabolism |
| 0.0 | 0.5 | REACTOME HORMONE LIGAND BINDING RECEPTORS | Genes involved in Hormone ligand-binding receptors |
| 0.0 | 1.2 | REACTOME OXYGEN DEPENDENT PROLINE HYDROXYLATION OF HYPOXIA INDUCIBLE FACTOR ALPHA | Genes involved in Oxygen-dependent Proline Hydroxylation of Hypoxia-inducible Factor Alpha |
| 0.0 | 1.2 | REACTOME SYNTHESIS OF VERY LONG CHAIN FATTY ACYL COAS | Genes involved in Synthesis of very long-chain fatty acyl-CoAs |
| 0.0 | 1.2 | REACTOME GLUTATHIONE CONJUGATION | Genes involved in Glutathione conjugation |
| 0.0 | 1.2 | REACTOME SULFUR AMINO ACID METABOLISM | Genes involved in Sulfur amino acid metabolism |
| 0.0 | 0.3 | REACTOME ASSEMBLY OF THE PRE REPLICATIVE COMPLEX | Genes involved in Assembly of the pre-replicative complex |
| 0.0 | 0.5 | REACTOME SYNTHESIS OF PIPS AT THE LATE ENDOSOME MEMBRANE | Genes involved in Synthesis of PIPs at the late endosome membrane |
| 0.0 | 0.6 | REACTOME REGULATORY RNA PATHWAYS | Genes involved in Regulatory RNA pathways |
| 0.0 | 9.6 | REACTOME ANTIGEN PROCESSING UBIQUITINATION PROTEASOME DEGRADATION | Genes involved in Antigen processing: Ubiquitination & Proteasome degradation |
| 0.0 | 1.3 | REACTOME REGULATION OF SIGNALING BY CBL | Genes involved in Regulation of signaling by CBL |
| 0.0 | 0.5 | REACTOME MITOCHONDRIAL FATTY ACID BETA OXIDATION | Genes involved in Mitochondrial Fatty Acid Beta-Oxidation |
| 0.0 | 0.8 | REACTOME GLYCOGEN BREAKDOWN GLYCOGENOLYSIS | Genes involved in Glycogen breakdown (glycogenolysis) |
| 0.0 | 1.3 | REACTOME RNA POL II TRANSCRIPTION PRE INITIATION AND PROMOTER OPENING | Genes involved in RNA Polymerase II Transcription Pre-Initiation And Promoter Opening |
| 0.0 | 0.5 | REACTOME MTORC1 MEDIATED SIGNALLING | Genes involved in mTORC1-mediated signalling |
| 0.0 | 0.4 | REACTOME PURINE RIBONUCLEOSIDE MONOPHOSPHATE BIOSYNTHESIS | Genes involved in Purine ribonucleoside monophosphate biosynthesis |
| 0.0 | 2.1 | REACTOME LOSS OF NLP FROM MITOTIC CENTROSOMES | Genes involved in Loss of Nlp from mitotic centrosomes |
| 0.0 | 0.4 | REACTOME ELONGATION ARREST AND RECOVERY | Genes involved in Elongation arrest and recovery |
| 0.0 | 0.9 | REACTOME SPHINGOLIPID DE NOVO BIOSYNTHESIS | Genes involved in Sphingolipid de novo biosynthesis |
| 0.0 | 0.5 | REACTOME SYNTHESIS OF GLYCOSYLPHOSPHATIDYLINOSITOL GPI | Genes involved in Synthesis of glycosylphosphatidylinositol (GPI) |
| 0.0 | 0.2 | REACTOME METABOLISM OF POLYAMINES | Genes involved in Metabolism of polyamines |
| 0.0 | 0.5 | REACTOME DEPOSITION OF NEW CENPA CONTAINING NUCLEOSOMES AT THE CENTROMERE | Genes involved in Deposition of New CENPA-containing Nucleosomes at the Centromere |
| 0.0 | 0.8 | REACTOME ASSOCIATION OF TRIC CCT WITH TARGET PROTEINS DURING BIOSYNTHESIS | Genes involved in Association of TriC/CCT with target proteins during biosynthesis |
| 0.0 | 0.5 | REACTOME MHC CLASS II ANTIGEN PRESENTATION | Genes involved in MHC class II antigen presentation |
| 0.0 | 1.2 | REACTOME VOLTAGE GATED POTASSIUM CHANNELS | Genes involved in Voltage gated Potassium channels |
| 0.0 | 0.3 | REACTOME ANTIGEN PRESENTATION FOLDING ASSEMBLY AND PEPTIDE LOADING OF CLASS I MHC | Genes involved in Antigen Presentation: Folding, assembly and peptide loading of class I MHC |
| 0.0 | 0.8 | REACTOME ABC FAMILY PROTEINS MEDIATED TRANSPORT | Genes involved in ABC-family proteins mediated transport |
| 0.0 | 0.3 | REACTOME DESTABILIZATION OF MRNA BY KSRP | Genes involved in Destabilization of mRNA by KSRP |
| 0.0 | 0.4 | REACTOME HOMOLOGOUS RECOMBINATION REPAIR OF REPLICATION INDEPENDENT DOUBLE STRAND BREAKS | Genes involved in Homologous recombination repair of replication-independent double-strand breaks |
| 0.0 | 4.2 | REACTOME SIGNALING BY RHO GTPASES | Genes involved in Signaling by Rho GTPases |
| 0.0 | 0.3 | REACTOME TGF BETA RECEPTOR SIGNALING IN EMT EPITHELIAL TO MESENCHYMAL TRANSITION | Genes involved in TGF-beta receptor signaling in EMT (epithelial to mesenchymal transition) |
| 0.0 | 0.2 | REACTOME APOPTOTIC CLEAVAGE OF CELL ADHESION PROTEINS | Genes involved in Apoptotic cleavage of cell adhesion proteins |
| 0.0 | 0.4 | REACTOME RETROGRADE NEUROTROPHIN SIGNALLING | Genes involved in Retrograde neurotrophin signalling |
| 0.0 | 0.3 | REACTOME N GLYCAN ANTENNAE ELONGATION | Genes involved in N-Glycan antennae elongation |
| 0.0 | 0.5 | REACTOME DARPP 32 EVENTS | Genes involved in DARPP-32 events |
| 0.0 | 0.1 | REACTOME CHYLOMICRON MEDIATED LIPID TRANSPORT | Genes involved in Chylomicron-mediated lipid transport |
| 0.0 | 1.6 | REACTOME METABOLISM OF AMINO ACIDS AND DERIVATIVES | Genes involved in Metabolism of amino acids and derivatives |