Project
Illumina Body Map 2 (GSE30611)
Navigation
Downloads
Results for UAAGACU
Z-value: 0.27
Motif logo

miRNA associated with seed UAAGACU
| Name | miRBASE accession |
|---|---|
|
hsa-miR-499a-5p
|
MIMAT0002870 |
Activity profile of UAAGACU motif
Sorted Z-values of UAAGACU motif
| Promoter | Log-likelihood | Transcript | Gene | Gene Info |
|---|---|---|---|---|
| chr5_-_159099909 | 0.60 |
ENST00000313708.11
|
EBF1
|
EBF transcription factor 1 |
| chr8_-_23854796 | 0.49 |
ENST00000290271.7
|
STC1
|
stanniocalcin 1 |
| chr5_+_55738017 | 0.47 |
ENST00000514278.6
ENST00000353507.9 ENST00000506511.5 ENST00000505374.6 ENST00000515709.5 ENST00000506848.5 ENST00000514679.5 |
DDX4
|
DEAD-box helicase 4 |
| chrY_+_12904860 | 0.42 |
ENST00000336079.8
|
DDX3Y
|
DEAD-box helicase 3 Y-linked |
| chr7_-_140176970 | 0.26 |
ENST00000397560.7
|
KDM7A
|
lysine demethylase 7A |
| chr3_+_61561561 | 0.26 |
ENST00000474889.6
|
PTPRG
|
protein tyrosine phosphatase receptor type G |
| chr16_+_54930827 | 0.26 |
ENST00000394636.9
|
IRX5
|
iroquois homeobox 5 |
| chr11_-_86955385 | 0.25 |
ENST00000531380.2
|
FZD4
|
frizzled class receptor 4 |
| chr2_-_86337654 | 0.25 |
ENST00000165698.9
|
REEP1
|
receptor accessory protein 1 |
| chr6_+_21593742 | 0.25 |
ENST00000244745.4
|
SOX4
|
SRY-box transcription factor 4 |
| chr2_+_176122712 | 0.24 |
ENST00000249499.8
|
HOXD9
|
homeobox D9 |
| chr10_+_61901678 | 0.22 |
ENST00000644638.1
ENST00000681100.1 ENST00000279873.12 |
ARID5B
|
AT-rich interaction domain 5B |
| chr1_+_42682388 | 0.22 |
ENST00000321358.12
ENST00000332220.10 |
YBX1
|
Y-box binding protein 1 |
| chr17_+_68512379 | 0.20 |
ENST00000392711.5
ENST00000585427.5 ENST00000589228.6 ENST00000536854.6 ENST00000588702.5 ENST00000589309.5 |
PRKAR1A
|
protein kinase cAMP-dependent type I regulatory subunit alpha |
| chr1_-_225653045 | 0.19 |
ENST00000366843.6
ENST00000366844.7 |
ENAH
|
ENAH actin regulator |
| chr7_-_120858066 | 0.18 |
ENST00000222747.8
|
TSPAN12
|
tetraspanin 12 |
| chr6_+_104957099 | 0.17 |
ENST00000345080.5
|
LIN28B
|
lin-28 homolog B |
| chr1_-_205813177 | 0.17 |
ENST00000367137.4
|
SLC41A1
|
solute carrier family 41 member 1 |
| chrX_+_68829009 | 0.16 |
ENST00000204961.5
|
EFNB1
|
ephrin B1 |
| chr20_+_52972347 | 0.16 |
ENST00000371497.10
|
TSHZ2
|
teashirt zinc finger homeobox 2 |
| chr9_-_125189721 | 0.16 |
ENST00000456642.1
ENST00000373547.9 ENST00000415905.5 ENST00000451402.5 |
PPP6C
|
protein phosphatase 6 catalytic subunit |
| chr11_-_128522264 | 0.15 |
ENST00000531611.5
|
ETS1
|
ETS proto-oncogene 1, transcription factor |
| chr8_+_57994455 | 0.15 |
ENST00000361488.7
|
FAM110B
|
family with sequence similarity 110 member B |
| chr10_-_32056376 | 0.15 |
ENST00000302418.5
|
KIF5B
|
kinesin family member 5B |
| chr22_+_21417357 | 0.14 |
ENST00000407464.7
|
HIC2
|
HIC ZBTB transcriptional repressor 2 |
| chr9_-_34126661 | 0.14 |
ENST00000361264.9
|
DCAF12
|
DDB1 and CUL4 associated factor 12 |
| chr2_+_176116768 | 0.14 |
ENST00000249501.5
|
HOXD10
|
homeobox D10 |
| chr17_-_8630713 | 0.13 |
ENST00000411957.1
ENST00000360416.8 |
MYH10
|
myosin heavy chain 10 |
| chr3_+_43286512 | 0.13 |
ENST00000454177.5
ENST00000429705.6 ENST00000296088.12 ENST00000437827.1 |
SNRK
|
SNF related kinase |
| chr8_+_11704151 | 0.13 |
ENST00000526716.5
ENST00000532059.6 ENST00000335135.8 ENST00000622443.3 |
GATA4
|
GATA binding protein 4 |
| chr16_-_80804581 | 0.12 |
ENST00000570137.7
|
CDYL2
|
chromodomain Y like 2 |
| chr13_+_101452629 | 0.12 |
ENST00000622834.4
ENST00000545560.6 ENST00000376180.8 |
ITGBL1
|
integrin subunit beta like 1 |
| chr18_-_28177102 | 0.11 |
ENST00000413878.2
ENST00000269141.8 |
CDH2
|
cadherin 2 |
| chr6_+_36678699 | 0.11 |
ENST00000405375.5
ENST00000244741.10 ENST00000373711.3 |
CDKN1A
|
cyclin dependent kinase inhibitor 1A |
| chr18_-_61892997 | 0.11 |
ENST00000312828.4
|
RNF152
|
ring finger protein 152 |
| chr6_-_13711817 | 0.11 |
ENST00000011619.6
|
RANBP9
|
RAN binding protein 9 |
| chr16_-_46621345 | 0.11 |
ENST00000303383.8
|
SHCBP1
|
SHC binding and spindle associated 1 |
| chr9_-_23821275 | 0.10 |
ENST00000380110.8
|
ELAVL2
|
ELAV like RNA binding protein 2 |
| chr14_+_105314711 | 0.10 |
ENST00000447393.6
ENST00000547217.5 |
PACS2
|
phosphofurin acidic cluster sorting protein 2 |
| chr10_-_35642286 | 0.09 |
ENST00000374694.3
|
FZD8
|
frizzled class receptor 8 |
| chr4_+_139015751 | 0.08 |
ENST00000280614.4
|
NOCT
|
nocturnin |
| chr10_-_931684 | 0.08 |
ENST00000316157.8
|
LARP4B
|
La ribonucleoprotein 4B |
| chr5_-_115544734 | 0.07 |
ENST00000274457.5
|
FEM1C
|
fem-1 homolog C |
| chr17_+_40062956 | 0.07 |
ENST00000450525.7
|
THRA
|
thyroid hormone receptor alpha |
| chr12_+_67648737 | 0.07 |
ENST00000344096.4
ENST00000393555.3 |
DYRK2
|
dual specificity tyrosine phosphorylation regulated kinase 2 |
| chr9_+_94030776 | 0.07 |
ENST00000375360.7
|
PTPDC1
|
protein tyrosine phosphatase domain containing 1 |
| chr14_-_50231570 | 0.07 |
ENST00000216373.10
|
SOS2
|
SOS Ras/Rho guanine nucleotide exchange factor 2 |
| chr12_-_92929236 | 0.07 |
ENST00000322349.13
|
EEA1
|
early endosome antigen 1 |
| chr1_-_38873322 | 0.06 |
ENST00000397572.5
ENST00000494695.4 |
MYCBP
|
MYC binding protein |
| chr1_+_89633086 | 0.06 |
ENST00000370454.9
|
LRRC8C
|
leucine rich repeat containing 8 VRAC subunit C |
| chr13_+_49997019 | 0.06 |
ENST00000420995.6
ENST00000356017.8 ENST00000378182.4 ENST00000457662.2 |
TRIM13
|
tripartite motif containing 13 |
| chr10_-_87818153 | 0.06 |
ENST00000308448.11
ENST00000680024.1 |
ATAD1
|
ATPase family AAA domain containing 1 |
| chr4_+_122826679 | 0.06 |
ENST00000264498.8
|
FGF2
|
fibroblast growth factor 2 |
| chr3_-_15332526 | 0.06 |
ENST00000383791.8
|
SH3BP5
|
SH3 domain binding protein 5 |
| chr22_+_29883158 | 0.05 |
ENST00000333027.7
ENST00000401950.7 ENST00000445401.5 ENST00000323630.9 ENST00000351488.7 |
MTMR3
|
myotubularin related protein 3 |
| chr13_-_49792675 | 0.05 |
ENST00000261667.8
|
KPNA3
|
karyopherin subunit alpha 3 |
| chr2_-_64653906 | 0.05 |
ENST00000313349.3
|
SERTAD2
|
SERTA domain containing 2 |
| chr1_+_19596960 | 0.05 |
ENST00000617872.4
ENST00000322753.7 ENST00000602662.1 |
MICOS10
NBL1
|
mitochondrial contact site and cristae organizing system subunit 10 NBL1, DAN family BMP antagonist |
| chr2_-_171894227 | 0.05 |
ENST00000422440.7
|
SLC25A12
|
solute carrier family 25 member 12 |
| chr4_+_158768955 | 0.04 |
ENST00000264433.11
|
FNIP2
|
folliculin interacting protein 2 |
| chr9_+_79571767 | 0.03 |
ENST00000376544.7
|
TLE4
|
TLE family member 4, transcriptional corepressor |
| chr6_+_163414637 | 0.03 |
ENST00000453779.6
ENST00000275262.11 ENST00000392127.6 |
QKI
|
QKI, KH domain containing RNA binding |
| chr8_+_42896883 | 0.03 |
ENST00000307602.9
|
HOOK3
|
hook microtubule tethering protein 3 |
| chr17_+_60600178 | 0.03 |
ENST00000629650.2
ENST00000305921.8 |
PPM1D
|
protein phosphatase, Mg2+/Mn2+ dependent 1D |
| chr7_+_139231225 | 0.03 |
ENST00000473989.8
|
UBN2
|
ubinuclein 2 |
| chr12_+_71754834 | 0.03 |
ENST00000261263.5
|
RAB21
|
RAB21, member RAS oncogene family |
| chr19_-_3700390 | 0.03 |
ENST00000679885.1
ENST00000537021.1 ENST00000589578.5 ENST00000539785.5 ENST00000335312.8 |
PIP5K1C
|
phosphatidylinositol-4-phosphate 5-kinase type 1 gamma |
| chr12_-_42144823 | 0.03 |
ENST00000398675.8
|
GXYLT1
|
glucoside xylosyltransferase 1 |
| chr15_+_56918612 | 0.02 |
ENST00000438423.6
ENST00000267811.9 ENST00000333725.10 ENST00000559609.5 |
TCF12
|
transcription factor 12 |
| chr14_-_105021043 | 0.02 |
ENST00000392590.3
ENST00000336219.4 |
CDCA4
|
cell division cycle associated 4 |
| chr6_+_37257762 | 0.02 |
ENST00000373491.3
|
TBC1D22B
|
TBC1 domain family member 22B |
| chr15_+_44537136 | 0.02 |
ENST00000261868.10
ENST00000535391.5 |
EIF3J
|
eukaryotic translation initiation factor 3 subunit J |
| chr7_-_44885446 | 0.02 |
ENST00000395699.5
|
PURB
|
purine rich element binding protein B |
| chr5_-_131796921 | 0.02 |
ENST00000307968.11
ENST00000307954.12 |
FNIP1
|
folliculin interacting protein 1 |
| chr2_-_207166818 | 0.02 |
ENST00000423015.5
|
KLF7
|
Kruppel like factor 7 |
| chr18_-_24397784 | 0.01 |
ENST00000399441.4
ENST00000319481.8 |
OSBPL1A
|
oxysterol binding protein like 1A |
| chr3_+_89107649 | 0.01 |
ENST00000452448.6
ENST00000494014.1 |
EPHA3
|
EPH receptor A3 |
| chr3_-_72446623 | 0.01 |
ENST00000477973.4
|
RYBP
|
RING1 and YY1 binding protein |
| chr1_+_35931076 | 0.01 |
ENST00000397828.3
ENST00000373191.9 |
AGO3
|
argonaute RISC catalytic component 3 |
| chr1_+_96721762 | 0.01 |
ENST00000675735.1
ENST00000609116.5 ENST00000674951.1 ENST00000426398.3 ENST00000370197.5 ENST00000370198.5 |
PTBP2
|
polypyrimidine tract binding protein 2 |
| chr6_-_165662100 | 0.01 |
ENST00000366882.6
|
PDE10A
|
phosphodiesterase 10A |
| chr1_-_16352420 | 0.01 |
ENST00000375592.8
|
FBXO42
|
F-box protein 42 |
| chr10_+_11823348 | 0.01 |
ENST00000277570.10
ENST00000622831.4 |
PROSER2
|
proline and serine rich 2 |
| chr7_+_65873068 | 0.01 |
ENST00000360768.5
|
VKORC1L1
|
vitamin K epoxide reductase complex subunit 1 like 1 |
| chr2_+_66435558 | 0.01 |
ENST00000488550.5
|
MEIS1
|
Meis homeobox 1 |
| chr7_-_106661148 | 0.00 |
ENST00000523505.3
|
CCDC71L
|
coiled-coil domain containing 71 like |
Network of associatons between targets according to the STRING database.

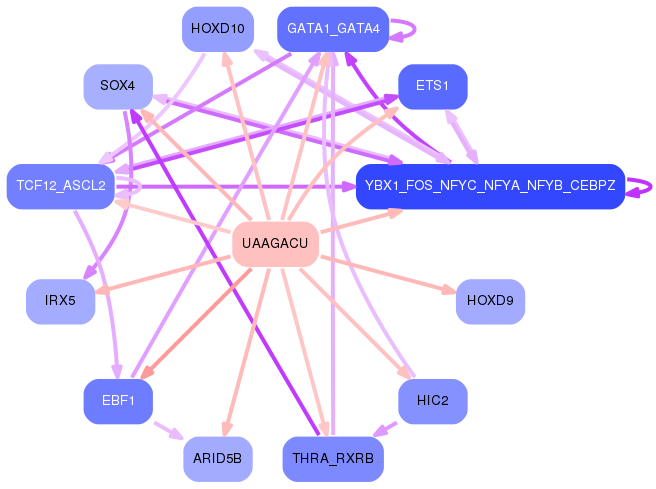
First level regulatory network of UAAGACU
Gene Ontology Analysis
Gene overrepresentation in biological process category:
| Log-likelihood per target | Total log-likelihood | Term | Description |
|---|---|---|---|
| 0.1 | 0.3 | GO:0061300 | cerebellum vasculature development(GO:0061300) |
| 0.1 | 0.3 | GO:0035574 | histone H4-K20 demethylation(GO:0035574) |
| 0.0 | 0.2 | GO:0035905 | N-terminal peptidyl-lysine acetylation(GO:0018076) ascending aorta development(GO:0035905) ascending aorta morphogenesis(GO:0035910) |
| 0.0 | 0.3 | GO:0060040 | retinal bipolar neuron differentiation(GO:0060040) |
| 0.0 | 0.5 | GO:0001886 | endothelial cell morphogenesis(GO:0001886) |
| 0.0 | 0.3 | GO:1903385 | regulation of homophilic cell adhesion(GO:1903385) |
| 0.0 | 0.1 | GO:1905150 | regulation of voltage-gated sodium channel activity(GO:1905150) |
| 0.0 | 0.1 | GO:0003290 | atrial septum secundum morphogenesis(GO:0003290) embryonic heart tube anterior/posterior pattern specification(GO:0035054) |
| 0.0 | 0.2 | GO:0010587 | miRNA catabolic process(GO:0010587) |
| 0.0 | 0.5 | GO:0034587 | piRNA metabolic process(GO:0034587) |
| 0.0 | 0.2 | GO:0010961 | cellular magnesium ion homeostasis(GO:0010961) |
| 0.0 | 0.1 | GO:0042660 | positive regulation of cell fate specification(GO:0042660) |
| 0.0 | 0.1 | GO:1904562 | phosphatidylinositol 5-phosphate metabolic process(GO:1904562) |
| 0.0 | 0.1 | GO:0021592 | fourth ventricle development(GO:0021592) |
| 0.0 | 0.0 | GO:1902594 | viral penetration into host nucleus(GO:0075732) multi-organism nuclear import(GO:1902594) |
| 0.0 | 0.0 | GO:0043490 | malate-aspartate shuttle(GO:0043490) |
| 0.0 | 0.1 | GO:0045925 | positive regulation of female receptivity(GO:0045925) |
| 0.0 | 0.2 | GO:0070934 | CRD-mediated mRNA stabilization(GO:0070934) |
| 0.0 | 0.4 | GO:0048935 | peripheral nervous system neuron differentiation(GO:0048934) peripheral nervous system neuron development(GO:0048935) |
| 0.0 | 0.2 | GO:1904996 | PML body organization(GO:0030578) positive regulation of leukocyte adhesion to vascular endothelial cell(GO:1904996) |
| 0.0 | 0.1 | GO:0060574 | intestinal epithelial cell maturation(GO:0060574) |
| 0.0 | 0.2 | GO:0046007 | negative regulation of activated T cell proliferation(GO:0046007) |
| 0.0 | 0.1 | GO:1902897 | regulation of postsynaptic density protein 95 clustering(GO:1902897) |
Gene overrepresentation in cellular component category:
| Log-likelihood per target | Total log-likelihood | Term | Description |
|---|---|---|---|
| 0.1 | 0.5 | GO:0071547 | piP-body(GO:0071547) |
| 0.0 | 0.1 | GO:0070557 | PCNA-p21 complex(GO:0070557) |
| 0.0 | 0.1 | GO:0097513 | myosin II filament(GO:0097513) |
| 0.0 | 0.2 | GO:0071204 | histone pre-mRNA 3'end processing complex(GO:0071204) |
| 0.0 | 0.1 | GO:1990851 | Wnt-Frizzled-LRP5/6 complex(GO:1990851) |
| 0.0 | 0.1 | GO:0044308 | axonal spine(GO:0044308) |
Gene overrepresentation in molecular function category:
| Log-likelihood per target | Total log-likelihood | Term | Description |
|---|---|---|---|
| 0.1 | 0.3 | GO:0035575 | histone demethylase activity (H4-K20 specific)(GO:0035575) |
| 0.0 | 0.1 | GO:0099609 | microtubule lateral binding(GO:0099609) |
| 0.0 | 0.3 | GO:0005499 | vitamin D binding(GO:0005499) |
| 0.0 | 0.3 | GO:0031849 | olfactory receptor binding(GO:0031849) |
| 0.0 | 0.1 | GO:0019912 | cyclin-dependent protein kinase activating kinase activity(GO:0019912) |
| 0.0 | 0.5 | GO:0042813 | Wnt-activated receptor activity(GO:0042813) |
| 0.0 | 0.6 | GO:0070742 | C2H2 zinc finger domain binding(GO:0070742) |