Project
Illumina Body Map 2 (GSE30611)
Navigation
Downloads
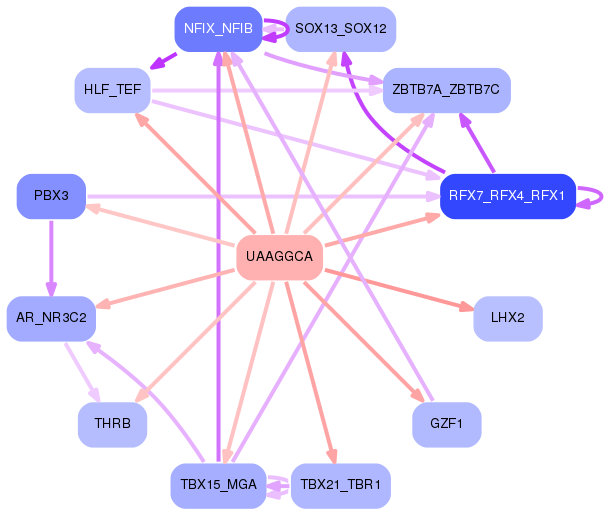
Results for UAAGGCA
Z-value: 0.97
Motif logo

miRNA associated with seed UAAGGCA
| Name | miRBASE accession |
|---|---|
|
hsa-miR-124-3p.2
|
|
|
hsa-miR-506-3p
|
Activity profile of UAAGGCA motif
Sorted Z-values of UAAGGCA motif
Network of associatons between targets according to the STRING database.

First level regulatory network of UAAGGCA
Gene Ontology Analysis
Gene overrepresentation in biological process category:
| Log-likelihood per target | Total log-likelihood | Term | Description |
|---|---|---|---|
| 0.9 | 2.8 | GO:1905154 | negative regulation of synaptic vesicle recycling(GO:1903422) negative regulation of membrane invagination(GO:1905154) calcium ion regulated lysosome exocytosis(GO:1990927) |
| 0.9 | 3.4 | GO:0033693 | neurofilament bundle assembly(GO:0033693) |
| 0.8 | 3.3 | GO:0098971 | anterograde dendritic transport of neurotransmitter receptor complex(GO:0098971) |
| 0.6 | 1.8 | GO:0006533 | aspartate catabolic process(GO:0006533) |
| 0.5 | 1.4 | GO:0050717 | positive regulation of interleukin-1 alpha secretion(GO:0050717) |
| 0.4 | 1.2 | GO:0098928 | presynaptic signal transduction(GO:0098928) presynapse to nucleus signaling pathway(GO:0099526) |
| 0.4 | 1.8 | GO:0098904 | regulation of AV node cell action potential(GO:0098904) |
| 0.3 | 1.7 | GO:0035544 | negative regulation of SNARE complex assembly(GO:0035544) |
| 0.3 | 0.9 | GO:1904908 | negative regulation of maintenance of sister chromatid cohesion(GO:0034092) negative regulation of maintenance of mitotic sister chromatid cohesion(GO:0034183) maintenance of mitotic sister chromatid cohesion, telomeric(GO:0099403) mitotic sister chromatid cohesion, telomeric(GO:0099404) regulation of maintenance of mitotic sister chromatid cohesion, telomeric(GO:1904907) negative regulation of maintenance of mitotic sister chromatid cohesion, telomeric(GO:1904908) |
| 0.3 | 0.9 | GO:1902630 | regulation of membrane hyperpolarization(GO:1902630) |
| 0.3 | 1.4 | GO:0051643 | endoplasmic reticulum localization(GO:0051643) |
| 0.3 | 1.5 | GO:0050915 | sensory perception of sour taste(GO:0050915) |
| 0.2 | 1.4 | GO:1901907 | diadenosine polyphosphate catabolic process(GO:0015961) diphosphoinositol polyphosphate metabolic process(GO:0071543) diadenosine pentaphosphate metabolic process(GO:1901906) diadenosine pentaphosphate catabolic process(GO:1901907) diadenosine hexaphosphate metabolic process(GO:1901908) diadenosine hexaphosphate catabolic process(GO:1901909) adenosine 5'-(hexahydrogen pentaphosphate) metabolic process(GO:1901910) adenosine 5'-(hexahydrogen pentaphosphate) catabolic process(GO:1901911) |
| 0.2 | 2.8 | GO:0019375 | galactosylceramide biosynthetic process(GO:0006682) galactolipid biosynthetic process(GO:0019375) |
| 0.2 | 0.9 | GO:0006663 | platelet activating factor biosynthetic process(GO:0006663) |
| 0.2 | 0.9 | GO:0006208 | pyrimidine nucleobase catabolic process(GO:0006208) thymine catabolic process(GO:0006210) thymine metabolic process(GO:0019859) |
| 0.2 | 0.9 | GO:1902683 | regulation of receptor localization to synapse(GO:1902683) |
| 0.2 | 1.0 | GO:1901503 | ether lipid biosynthetic process(GO:0008611) glycerol ether biosynthetic process(GO:0046504) ether biosynthetic process(GO:1901503) |
| 0.2 | 0.8 | GO:0009443 | pyridoxal 5'-phosphate salvage(GO:0009443) |
| 0.2 | 2.6 | GO:0099525 | presynaptic dense core granule exocytosis(GO:0099525) |
| 0.2 | 2.5 | GO:0051612 | negative regulation of neurotransmitter uptake(GO:0051581) regulation of serotonin uptake(GO:0051611) negative regulation of serotonin uptake(GO:0051612) |
| 0.2 | 0.6 | GO:0043396 | corticotropin-releasing hormone secretion(GO:0043396) regulation of corticotropin-releasing hormone secretion(GO:0043397) |
| 0.2 | 0.7 | GO:0031548 | regulation of brain-derived neurotrophic factor receptor signaling pathway(GO:0031548) |
| 0.2 | 3.1 | GO:0097105 | presynaptic membrane assembly(GO:0097105) |
| 0.2 | 1.0 | GO:0048294 | negative regulation of isotype switching to IgE isotypes(GO:0048294) |
| 0.2 | 1.7 | GO:0019276 | UDP-N-acetylgalactosamine metabolic process(GO:0019276) |
| 0.2 | 0.5 | GO:0001579 | medium-chain fatty acid transport(GO:0001579) |
| 0.2 | 0.7 | GO:0038018 | Wnt receptor catabolic process(GO:0038018) |
| 0.2 | 1.1 | GO:0032383 | regulation of intracellular lipid transport(GO:0032377) regulation of intracellular sterol transport(GO:0032380) regulation of intracellular cholesterol transport(GO:0032383) |
| 0.2 | 2.4 | GO:1901843 | positive regulation of high voltage-gated calcium channel activity(GO:1901843) |
| 0.2 | 0.5 | GO:0090310 | negative regulation of methylation-dependent chromatin silencing(GO:0090310) |
| 0.2 | 0.5 | GO:1903031 | regulation of microtubule plus-end binding(GO:1903031) positive regulation of microtubule plus-end binding(GO:1903033) |
| 0.1 | 1.3 | GO:0043314 | negative regulation of neutrophil degranulation(GO:0043314) |
| 0.1 | 0.5 | GO:1900737 | regulation of proteinase activated receptor activity(GO:1900276) negative regulation of phospholipase C-activating G-protein coupled receptor signaling pathway(GO:1900737) |
| 0.1 | 0.9 | GO:0033159 | negative regulation of protein import into nucleus, translocation(GO:0033159) |
| 0.1 | 0.9 | GO:0021764 | amygdala development(GO:0021764) |
| 0.1 | 0.4 | GO:1903774 | positive regulation of viral budding via host ESCRT complex(GO:1903774) |
| 0.1 | 0.7 | GO:0015853 | adenine transport(GO:0015853) |
| 0.1 | 1.3 | GO:0099601 | regulation of neurotransmitter receptor activity(GO:0099601) |
| 0.1 | 1.0 | GO:0051725 | protein de-ADP-ribosylation(GO:0051725) |
| 0.1 | 0.3 | GO:0060003 | copper ion export(GO:0060003) |
| 0.1 | 0.9 | GO:0033353 | S-adenosylmethionine cycle(GO:0033353) |
| 0.1 | 0.7 | GO:0046340 | diacylglycerol catabolic process(GO:0046340) |
| 0.1 | 0.3 | GO:0009125 | nucleoside monophosphate catabolic process(GO:0009125) |
| 0.1 | 0.3 | GO:0006850 | mitochondrial pyruvate transport(GO:0006850) mitochondrial pyruvate transmembrane transport(GO:1902361) |
| 0.1 | 0.3 | GO:0006667 | sphinganine metabolic process(GO:0006667) |
| 0.1 | 0.3 | GO:0051066 | dihydrobiopterin metabolic process(GO:0051066) |
| 0.1 | 0.1 | GO:0048378 | lateral mesodermal cell differentiation(GO:0048371) lateral mesodermal cell fate commitment(GO:0048372) lateral mesodermal cell fate specification(GO:0048377) regulation of lateral mesodermal cell fate specification(GO:0048378) |
| 0.1 | 0.5 | GO:0009082 | branched-chain amino acid biosynthetic process(GO:0009082) leucine biosynthetic process(GO:0009098) valine biosynthetic process(GO:0009099) |
| 0.1 | 0.5 | GO:0072709 | cellular response to sorbitol(GO:0072709) |
| 0.1 | 0.6 | GO:0048631 | regulation of skeletal muscle tissue growth(GO:0048631) |
| 0.1 | 0.7 | GO:0015798 | myo-inositol transport(GO:0015798) |
| 0.1 | 0.8 | GO:0048165 | ovarian cumulus expansion(GO:0001550) fused antrum stage(GO:0048165) negative regulation of chondrocyte proliferation(GO:1902731) |
| 0.1 | 1.1 | GO:0031547 | brain-derived neurotrophic factor receptor signaling pathway(GO:0031547) |
| 0.1 | 0.7 | GO:0048549 | endosome localization(GO:0032439) positive regulation of pinocytosis(GO:0048549) |
| 0.1 | 1.2 | GO:0045964 | positive regulation of catecholamine metabolic process(GO:0045915) positive regulation of dopamine metabolic process(GO:0045964) |
| 0.1 | 0.4 | GO:0032474 | otolith morphogenesis(GO:0032474) |
| 0.1 | 0.8 | GO:0035879 | plasma membrane lactate transport(GO:0035879) |
| 0.1 | 0.3 | GO:0031104 | dendrite regeneration(GO:0031104) |
| 0.1 | 0.3 | GO:1905150 | regulation of voltage-gated sodium channel activity(GO:1905150) |
| 0.1 | 0.3 | GO:0030327 | prenylated protein catabolic process(GO:0030327) |
| 0.1 | 2.5 | GO:0061162 | establishment of monopolar cell polarity(GO:0061162) |
| 0.1 | 0.4 | GO:1902261 | positive regulation of delayed rectifier potassium channel activity(GO:1902261) |
| 0.1 | 0.3 | GO:1903998 | regulation of eating behavior(GO:1903998) |
| 0.1 | 0.8 | GO:0006868 | glutamine transport(GO:0006868) |
| 0.1 | 0.3 | GO:1990167 | protein K27-linked deubiquitination(GO:1990167) |
| 0.1 | 0.5 | GO:0097461 | ferric iron import into cell(GO:0097461) ferric iron import across plasma membrane(GO:0098706) |
| 0.1 | 1.3 | GO:0048671 | negative regulation of collateral sprouting(GO:0048671) |
| 0.1 | 0.4 | GO:0046167 | glycerol-3-phosphate biosynthetic process(GO:0046167) |
| 0.1 | 0.7 | GO:0006880 | intracellular sequestering of iron ion(GO:0006880) sequestering of iron ion(GO:0097577) |
| 0.1 | 1.1 | GO:0086016 | AV node cell action potential(GO:0086016) AV node cell to bundle of His cell signaling(GO:0086027) |
| 0.1 | 0.6 | GO:1903593 | regulation of histamine secretion by mast cell(GO:1903593) |
| 0.1 | 1.0 | GO:0002175 | protein localization to paranode region of axon(GO:0002175) |
| 0.1 | 0.6 | GO:0021592 | fourth ventricle development(GO:0021592) |
| 0.1 | 0.7 | GO:1902231 | positive regulation of intrinsic apoptotic signaling pathway in response to DNA damage(GO:1902231) |
| 0.1 | 0.4 | GO:0033615 | mitochondrial proton-transporting ATP synthase complex assembly(GO:0033615) |
| 0.1 | 0.3 | GO:0002188 | translation reinitiation(GO:0002188) |
| 0.1 | 0.9 | GO:0046940 | nucleoside monophosphate phosphorylation(GO:0046940) |
| 0.1 | 0.4 | GO:2000812 | regulation of barbed-end actin filament capping(GO:2000812) |
| 0.1 | 0.3 | GO:0072365 | regulation of cellular ketone metabolic process by negative regulation of transcription from RNA polymerase II promoter(GO:0072365) |
| 0.1 | 1.0 | GO:0007258 | JUN phosphorylation(GO:0007258) |
| 0.1 | 0.3 | GO:1903070 | negative regulation of ER-associated ubiquitin-dependent protein catabolic process(GO:1903070) |
| 0.1 | 3.5 | GO:0035774 | positive regulation of insulin secretion involved in cellular response to glucose stimulus(GO:0035774) |
| 0.1 | 0.3 | GO:0061763 | multivesicular body-lysosome fusion(GO:0061763) |
| 0.1 | 0.9 | GO:1902514 | regulation of calcium ion transmembrane transport via high voltage-gated calcium channel(GO:1902514) |
| 0.1 | 0.7 | GO:0000160 | phosphorelay signal transduction system(GO:0000160) |
| 0.1 | 1.3 | GO:1904259 | regulation of basement membrane assembly involved in embryonic body morphogenesis(GO:1904259) positive regulation of basement membrane assembly involved in embryonic body morphogenesis(GO:1904261) basement membrane assembly involved in embryonic body morphogenesis(GO:2001197) |
| 0.1 | 0.6 | GO:0021914 | negative regulation of smoothened signaling pathway involved in ventral spinal cord patterning(GO:0021914) |
| 0.1 | 0.5 | GO:0006620 | posttranslational protein targeting to membrane(GO:0006620) |
| 0.1 | 0.7 | GO:0071787 | endoplasmic reticulum tubular network assembly(GO:0071787) |
| 0.1 | 0.4 | GO:1903566 | positive regulation of protein localization to cilium(GO:1903566) |
| 0.1 | 0.1 | GO:0021896 | forebrain astrocyte differentiation(GO:0021896) forebrain astrocyte development(GO:0021897) |
| 0.1 | 1.0 | GO:1902043 | positive regulation of extrinsic apoptotic signaling pathway via death domain receptors(GO:1902043) |
| 0.1 | 0.4 | GO:1990481 | mRNA pseudouridine synthesis(GO:1990481) |
| 0.1 | 0.3 | GO:1900039 | positive regulation of cellular response to hypoxia(GO:1900039) |
| 0.1 | 1.3 | GO:0007220 | Notch receptor processing(GO:0007220) |
| 0.1 | 0.6 | GO:2000601 | positive regulation of Arp2/3 complex-mediated actin nucleation(GO:2000601) |
| 0.1 | 0.5 | GO:0018103 | protein C-linked glycosylation(GO:0018103) peptidyl-tryptophan modification(GO:0018211) protein C-linked glycosylation via tryptophan(GO:0018317) protein C-linked glycosylation via 2'-alpha-mannosyl-L-tryptophan(GO:0018406) |
| 0.1 | 0.8 | GO:0071786 | endoplasmic reticulum tubular network organization(GO:0071786) |
| 0.1 | 0.9 | GO:0015886 | heme transport(GO:0015886) |
| 0.1 | 0.5 | GO:0098735 | positive regulation of the force of heart contraction(GO:0098735) |
| 0.0 | 0.6 | GO:0070315 | G1 to G0 transition involved in cell differentiation(GO:0070315) |
| 0.0 | 0.2 | GO:0034402 | recruitment of 3'-end processing factors to RNA polymerase II holoenzyme complex(GO:0034402) |
| 0.0 | 1.1 | GO:0045199 | maintenance of apical/basal cell polarity(GO:0035090) maintenance of epithelial cell apical/basal polarity(GO:0045199) |
| 0.0 | 0.1 | GO:0036324 | vascular endothelial growth factor receptor-2 signaling pathway(GO:0036324) |
| 0.0 | 0.8 | GO:0019317 | fucose catabolic process(GO:0019317) L-fucose metabolic process(GO:0042354) L-fucose catabolic process(GO:0042355) |
| 0.0 | 0.7 | GO:0061088 | regulation of sequestering of zinc ion(GO:0061088) |
| 0.0 | 0.6 | GO:0048670 | regulation of collateral sprouting(GO:0048670) |
| 0.0 | 0.3 | GO:0071286 | cellular response to magnesium ion(GO:0071286) |
| 0.0 | 0.4 | GO:0010265 | SCF complex assembly(GO:0010265) |
| 0.0 | 0.1 | GO:2000502 | negative regulation of natural killer cell chemotaxis(GO:2000502) |
| 0.0 | 1.2 | GO:0015671 | oxygen transport(GO:0015671) |
| 0.0 | 1.8 | GO:0032012 | regulation of ARF protein signal transduction(GO:0032012) |
| 0.0 | 0.1 | GO:0072675 | osteoclast fusion(GO:0072675) |
| 0.0 | 0.4 | GO:0006398 | mRNA 3'-end processing by stem-loop binding and cleavage(GO:0006398) |
| 0.0 | 0.9 | GO:0010839 | negative regulation of keratinocyte proliferation(GO:0010839) |
| 0.0 | 0.1 | GO:0010512 | negative regulation of phosphatidylinositol biosynthetic process(GO:0010512) |
| 0.0 | 0.5 | GO:0010459 | negative regulation of heart rate(GO:0010459) |
| 0.0 | 0.2 | GO:0035750 | protein localization to myelin sheath abaxonal region(GO:0035750) |
| 0.0 | 0.8 | GO:0006152 | purine nucleoside catabolic process(GO:0006152) purine ribonucleoside catabolic process(GO:0046130) |
| 0.0 | 0.5 | GO:1902857 | positive regulation of nonmotile primary cilium assembly(GO:1902857) |
| 0.0 | 1.2 | GO:0006688 | glycosphingolipid biosynthetic process(GO:0006688) |
| 0.0 | 0.2 | GO:1902498 | regulation of protein autoubiquitination(GO:1902498) |
| 0.0 | 1.1 | GO:0044342 | type B pancreatic cell proliferation(GO:0044342) |
| 0.0 | 2.5 | GO:1900449 | regulation of glutamate receptor signaling pathway(GO:1900449) |
| 0.0 | 2.2 | GO:0035235 | ionotropic glutamate receptor signaling pathway(GO:0035235) |
| 0.0 | 0.1 | GO:0070682 | proteasome regulatory particle assembly(GO:0070682) |
| 0.0 | 0.6 | GO:0035988 | chondrocyte proliferation(GO:0035988) |
| 0.0 | 0.1 | GO:0060061 | Spemann organizer formation(GO:0060061) |
| 0.0 | 0.5 | GO:0021869 | forebrain ventricular zone progenitor cell division(GO:0021869) |
| 0.0 | 0.1 | GO:1901350 | cell-cell signaling involved in cell-cell junction organization(GO:1901350) |
| 0.0 | 0.1 | GO:1903588 | negative regulation of blood vessel endothelial cell proliferation involved in sprouting angiogenesis(GO:1903588) |
| 0.0 | 0.4 | GO:0015871 | choline transport(GO:0015871) |
| 0.0 | 1.2 | GO:0042953 | lipoprotein transport(GO:0042953) lipoprotein localization(GO:0044872) |
| 0.0 | 0.4 | GO:0035404 | histone-serine phosphorylation(GO:0035404) |
| 0.0 | 0.3 | GO:0034036 | purine ribonucleoside bisphosphate biosynthetic process(GO:0034036) 3'-phosphoadenosine 5'-phosphosulfate biosynthetic process(GO:0050428) |
| 0.0 | 0.4 | GO:0006268 | DNA unwinding involved in DNA replication(GO:0006268) |
| 0.0 | 0.7 | GO:0032926 | negative regulation of activin receptor signaling pathway(GO:0032926) |
| 0.0 | 0.3 | GO:0038033 | positive regulation of endothelial cell chemotaxis by VEGF-activated vascular endothelial growth factor receptor signaling pathway(GO:0038033) protein kinase D signaling(GO:0089700) |
| 0.0 | 0.1 | GO:0060743 | epithelial cell maturation involved in prostate gland development(GO:0060743) |
| 0.0 | 1.3 | GO:0007616 | long-term memory(GO:0007616) |
| 0.0 | 0.3 | GO:0032286 | central nervous system myelin maintenance(GO:0032286) |
| 0.0 | 0.2 | GO:0035434 | copper ion transmembrane transport(GO:0035434) |
| 0.0 | 1.3 | GO:0042462 | eye photoreceptor cell development(GO:0042462) |
| 0.0 | 0.4 | GO:0016081 | synaptic vesicle docking(GO:0016081) |
| 0.0 | 0.3 | GO:0060576 | intestinal epithelial cell development(GO:0060576) |
| 0.0 | 0.2 | GO:0060526 | prostate glandular acinus morphogenesis(GO:0060526) prostate epithelial cord arborization involved in prostate glandular acinus morphogenesis(GO:0060527) |
| 0.0 | 0.1 | GO:0007386 | compartment pattern specification(GO:0007386) |
| 0.0 | 2.0 | GO:0007157 | heterophilic cell-cell adhesion via plasma membrane cell adhesion molecules(GO:0007157) |
| 0.0 | 0.3 | GO:0032482 | Rab protein signal transduction(GO:0032482) |
| 0.0 | 1.7 | GO:0046949 | fatty-acyl-CoA biosynthetic process(GO:0046949) |
| 0.0 | 2.8 | GO:0006501 | C-terminal protein lipidation(GO:0006501) |
| 0.0 | 0.5 | GO:0031290 | retinal ganglion cell axon guidance(GO:0031290) |
| 0.0 | 1.1 | GO:0045671 | negative regulation of osteoclast differentiation(GO:0045671) |
| 0.0 | 0.3 | GO:0045792 | negative regulation of cell size(GO:0045792) |
| 0.0 | 1.9 | GO:0010812 | negative regulation of cell-substrate adhesion(GO:0010812) |
| 0.0 | 1.4 | GO:0010765 | positive regulation of sodium ion transport(GO:0010765) |
| 0.0 | 0.3 | GO:0045475 | locomotor rhythm(GO:0045475) |
| 0.0 | 0.5 | GO:0021957 | corticospinal tract morphogenesis(GO:0021957) |
| 0.0 | 0.1 | GO:0010796 | regulation of multivesicular body size(GO:0010796) |
| 0.0 | 0.2 | GO:0060372 | regulation of atrial cardiac muscle cell membrane repolarization(GO:0060372) |
| 0.0 | 0.3 | GO:0060628 | regulation of ER to Golgi vesicle-mediated transport(GO:0060628) |
| 0.0 | 0.3 | GO:0045722 | positive regulation of gluconeogenesis(GO:0045722) |
| 0.0 | 0.2 | GO:0052203 | modulation by symbiont of host molecular function(GO:0052055) modulation of catalytic activity in other organism involved in symbiotic interaction(GO:0052203) modulation by host of symbiont catalytic activity(GO:0052422) |
| 0.0 | 0.5 | GO:0019511 | peptidyl-proline hydroxylation(GO:0019511) |
| 0.0 | 0.6 | GO:0051642 | centrosome localization(GO:0051642) |
| 0.0 | 0.3 | GO:1903003 | positive regulation of protein deubiquitination(GO:1903003) |
| 0.0 | 2.0 | GO:0015914 | phospholipid transport(GO:0015914) |
| 0.0 | 0.5 | GO:0036152 | phosphatidylethanolamine acyl-chain remodeling(GO:0036152) |
| 0.0 | 0.7 | GO:1903861 | positive regulation of dendrite extension(GO:1903861) |
| 0.0 | 1.9 | GO:0051965 | positive regulation of synapse assembly(GO:0051965) |
| 0.0 | 0.3 | GO:0006264 | mitochondrial DNA replication(GO:0006264) |
| 0.0 | 1.0 | GO:0014047 | glutamate secretion(GO:0014047) |
| 0.0 | 0.2 | GO:0008050 | female courtship behavior(GO:0008050) |
| 0.0 | 0.6 | GO:0016338 | calcium-independent cell-cell adhesion via plasma membrane cell-adhesion molecules(GO:0016338) |
| 0.0 | 0.4 | GO:0007097 | nuclear migration(GO:0007097) |
| 0.0 | 0.2 | GO:1900086 | positive regulation of peptidyl-tyrosine autophosphorylation(GO:1900086) |
| 0.0 | 1.4 | GO:0002028 | regulation of sodium ion transport(GO:0002028) |
| 0.0 | 0.5 | GO:0090005 | negative regulation of establishment of protein localization to plasma membrane(GO:0090005) |
| 0.0 | 0.1 | GO:0019626 | short-chain fatty acid catabolic process(GO:0019626) |
| 0.0 | 0.0 | GO:2000078 | type B pancreatic cell maturation(GO:0072560) positive regulation of type B pancreatic cell development(GO:2000078) |
| 0.0 | 0.9 | GO:0007214 | gamma-aminobutyric acid signaling pathway(GO:0007214) |
| 0.0 | 0.0 | GO:0019085 | early viral transcription(GO:0019085) |
| 0.0 | 0.1 | GO:0071596 | ubiquitin-dependent protein catabolic process via the N-end rule pathway(GO:0071596) |
| 0.0 | 1.1 | GO:0021795 | cerebral cortex cell migration(GO:0021795) |
| 0.0 | 0.2 | GO:1903025 | regulation of RNA polymerase II regulatory region sequence-specific DNA binding(GO:1903025) |
| 0.0 | 0.2 | GO:0000055 | ribosomal large subunit export from nucleus(GO:0000055) |
| 0.0 | 1.9 | GO:0003333 | amino acid transmembrane transport(GO:0003333) |
| 0.0 | 0.2 | GO:0018206 | peptidyl-methionine modification(GO:0018206) |
| 0.0 | 0.3 | GO:0060384 | innervation(GO:0060384) |
| 0.0 | 0.3 | GO:0034389 | lipid particle organization(GO:0034389) |
| 0.0 | 0.2 | GO:0032793 | positive regulation of CREB transcription factor activity(GO:0032793) |
| 0.0 | 0.3 | GO:0042759 | long-chain fatty acid biosynthetic process(GO:0042759) |
| 0.0 | 0.3 | GO:0045187 | regulation of circadian sleep/wake cycle(GO:0042749) regulation of circadian sleep/wake cycle, sleep(GO:0045187) |
| 0.0 | 1.0 | GO:0015701 | bicarbonate transport(GO:0015701) |
| 0.0 | 0.0 | GO:0021834 | embryonic olfactory bulb interneuron precursor migration(GO:0021831) chemorepulsion involved in embryonic olfactory bulb interneuron precursor migration(GO:0021834) apoptotic process involved in luteolysis(GO:0061364) |
| 0.0 | 0.2 | GO:0030422 | production of siRNA involved in RNA interference(GO:0030422) |
| 0.0 | 0.2 | GO:0070070 | proton-transporting V-type ATPase complex assembly(GO:0070070) vacuolar proton-transporting V-type ATPase complex assembly(GO:0070072) |
| 0.0 | 0.1 | GO:0031087 | deadenylation-independent decapping of nuclear-transcribed mRNA(GO:0031087) |
| 0.0 | 0.4 | GO:0060314 | regulation of ryanodine-sensitive calcium-release channel activity(GO:0060314) |
| 0.0 | 0.2 | GO:0051665 | membrane raft localization(GO:0051665) |
Gene overrepresentation in cellular component category:
| Log-likelihood per target | Total log-likelihood | Term | Description |
|---|---|---|---|
| 0.4 | 1.2 | GO:0048788 | cytoskeleton of presynaptic active zone(GO:0048788) presynaptic active zone cytoplasmic component(GO:0098831) presynaptic cytoskeleton(GO:0099569) |
| 0.3 | 1.0 | GO:0070931 | Golgi-associated vesicle lumen(GO:0070931) |
| 0.3 | 2.8 | GO:0048787 | presynaptic active zone membrane(GO:0048787) |
| 0.3 | 1.8 | GO:0098843 | postsynaptic endocytic zone(GO:0098843) |
| 0.2 | 1.5 | GO:0044308 | axonal spine(GO:0044308) |
| 0.2 | 3.4 | GO:0097418 | neurofibrillary tangle(GO:0097418) |
| 0.2 | 3.3 | GO:0035253 | ciliary rootlet(GO:0035253) |
| 0.2 | 0.8 | GO:0031933 | telomeric heterochromatin(GO:0031933) |
| 0.1 | 0.5 | GO:0039714 | viral factory(GO:0039713) cytoplasmic viral factory(GO:0039714) host cell viral assembly compartment(GO:0072517) |
| 0.1 | 1.6 | GO:0032593 | insulin-responsive compartment(GO:0032593) |
| 0.1 | 2.4 | GO:0014701 | junctional sarcoplasmic reticulum membrane(GO:0014701) |
| 0.1 | 0.3 | GO:0055087 | Ski complex(GO:0055087) |
| 0.1 | 2.4 | GO:1990454 | L-type voltage-gated calcium channel complex(GO:1990454) |
| 0.1 | 0.5 | GO:0034681 | integrin alpha11-beta1 complex(GO:0034681) |
| 0.1 | 1.1 | GO:0043190 | ATP-binding cassette (ABC) transporter complex(GO:0043190) |
| 0.1 | 0.5 | GO:0043291 | RAVE complex(GO:0043291) |
| 0.1 | 0.7 | GO:0044326 | dendritic spine neck(GO:0044326) |
| 0.1 | 0.8 | GO:0042025 | host cell nucleus(GO:0042025) |
| 0.1 | 0.3 | GO:0071001 | U4/U6 snRNP(GO:0071001) |
| 0.1 | 1.3 | GO:0045180 | basal cortex(GO:0045180) |
| 0.1 | 0.9 | GO:1990712 | HFE-transferrin receptor complex(GO:1990712) |
| 0.1 | 1.1 | GO:0032059 | bleb(GO:0032059) |
| 0.0 | 1.9 | GO:0033268 | node of Ranvier(GO:0033268) |
| 0.0 | 0.7 | GO:0044354 | pinosome(GO:0044352) macropinosome(GO:0044354) |
| 0.0 | 0.2 | GO:0071006 | U2-type catalytic step 1 spliceosome(GO:0071006) |
| 0.0 | 1.0 | GO:0033270 | paranode region of axon(GO:0033270) |
| 0.0 | 0.3 | GO:0044305 | calyx of Held(GO:0044305) |
| 0.0 | 0.5 | GO:0030981 | cortical microtubule cytoskeleton(GO:0030981) |
| 0.0 | 6.6 | GO:0042734 | presynaptic membrane(GO:0042734) |
| 0.0 | 0.9 | GO:0042622 | photoreceptor outer segment membrane(GO:0042622) |
| 0.0 | 0.6 | GO:0031209 | SCAR complex(GO:0031209) |
| 0.0 | 1.1 | GO:0001518 | voltage-gated sodium channel complex(GO:0001518) |
| 0.0 | 0.3 | GO:0005971 | ribonucleoside-diphosphate reductase complex(GO:0005971) |
| 0.0 | 1.1 | GO:0046930 | pore complex(GO:0046930) |
| 0.0 | 0.1 | GO:0071920 | cleavage body(GO:0071920) |
| 0.0 | 0.8 | GO:0032585 | multivesicular body membrane(GO:0032585) |
| 0.0 | 0.2 | GO:0097422 | tubular endosome(GO:0097422) |
| 0.0 | 0.7 | GO:0005662 | DNA replication factor A complex(GO:0005662) |
| 0.0 | 0.4 | GO:0071204 | histone pre-mRNA 3'end processing complex(GO:0071204) |
| 0.0 | 1.0 | GO:0005779 | integral component of peroxisomal membrane(GO:0005779) intrinsic component of peroxisomal membrane(GO:0031231) |
| 0.0 | 0.2 | GO:0005967 | mitochondrial pyruvate dehydrogenase complex(GO:0005967) |
| 0.0 | 6.6 | GO:0031225 | anchored component of membrane(GO:0031225) |
| 0.0 | 0.4 | GO:0005869 | dynactin complex(GO:0005869) |
| 0.0 | 0.1 | GO:0098837 | postsynaptic recycling endosome(GO:0098837) |
| 0.0 | 0.3 | GO:0017059 | serine C-palmitoyltransferase complex(GO:0017059) endoplasmic reticulum palmitoyltransferase complex(GO:0031211) |
| 0.0 | 0.5 | GO:0005686 | U2 snRNP(GO:0005686) |
| 0.0 | 0.4 | GO:0031618 | nuclear pericentric heterochromatin(GO:0031618) |
| 0.0 | 0.2 | GO:0043219 | lateral loop(GO:0043219) |
| 0.0 | 1.3 | GO:0032281 | AMPA glutamate receptor complex(GO:0032281) |
| 0.0 | 0.8 | GO:0032809 | neuronal cell body membrane(GO:0032809) cell body membrane(GO:0044298) |
| 0.0 | 0.4 | GO:0000813 | ESCRT I complex(GO:0000813) |
| 0.0 | 0.5 | GO:0031588 | nucleotide-activated protein kinase complex(GO:0031588) |
| 0.0 | 0.2 | GO:0016011 | dystroglycan complex(GO:0016011) sarcoglycan complex(GO:0016012) |
| 0.0 | 0.7 | GO:0042101 | T cell receptor complex(GO:0042101) |
| 0.0 | 0.9 | GO:1902711 | GABA-A receptor complex(GO:1902711) |
| 0.0 | 0.2 | GO:0016593 | Cdc73/Paf1 complex(GO:0016593) |
| 0.0 | 1.6 | GO:0034704 | calcium channel complex(GO:0034704) |
| 0.0 | 0.5 | GO:0032839 | dendrite cytoplasm(GO:0032839) |
| 0.0 | 3.2 | GO:0005875 | microtubule associated complex(GO:0005875) |
| 0.0 | 0.2 | GO:0031466 | Cul5-RING ubiquitin ligase complex(GO:0031466) |
| 0.0 | 0.4 | GO:0097381 | photoreceptor disc membrane(GO:0097381) |
| 0.0 | 0.4 | GO:0034045 | pre-autophagosomal structure membrane(GO:0034045) |
| 0.0 | 2.0 | GO:0005930 | axoneme(GO:0005930) ciliary plasm(GO:0097014) |
| 0.0 | 0.3 | GO:0031045 | dense core granule(GO:0031045) |
| 0.0 | 5.2 | GO:0045211 | postsynaptic membrane(GO:0045211) |
| 0.0 | 0.3 | GO:0000815 | ESCRT III complex(GO:0000815) |
| 0.0 | 1.6 | GO:0008076 | voltage-gated potassium channel complex(GO:0008076) |
| 0.0 | 5.2 | GO:0098793 | presynapse(GO:0098793) |
| 0.0 | 0.1 | GO:0097165 | nuclear stress granule(GO:0097165) |
| 0.0 | 0.3 | GO:0005639 | integral component of nuclear inner membrane(GO:0005639) intrinsic component of nuclear inner membrane(GO:0031229) |
| 0.0 | 0.2 | GO:0030127 | COPII vesicle coat(GO:0030127) |
| 0.0 | 0.2 | GO:0008290 | F-actin capping protein complex(GO:0008290) |
| 0.0 | 7.8 | GO:0045202 | synapse(GO:0045202) |
| 0.0 | 0.3 | GO:0005671 | Ada2/Gcn5/Ada3 transcription activator complex(GO:0005671) |
| 0.0 | 0.1 | GO:0030914 | STAGA complex(GO:0030914) |
Gene overrepresentation in molecular function category:
| Log-likelihood per target | Total log-likelihood | Term | Description |
|---|---|---|---|
| 0.4 | 1.2 | GO:0036505 | prosaposin receptor activity(GO:0036505) |
| 0.4 | 1.7 | GO:0035248 | alpha-1,4-N-acetylgalactosaminyltransferase activity(GO:0035248) |
| 0.4 | 2.3 | GO:0005219 | ryanodine-sensitive calcium-release channel activity(GO:0005219) |
| 0.3 | 1.0 | GO:0030156 | benzodiazepine receptor binding(GO:0030156) |
| 0.3 | 1.3 | GO:0030550 | acetylcholine receptor inhibitor activity(GO:0030550) |
| 0.3 | 1.5 | GO:0044736 | acid-sensing ion channel activity(GO:0044736) |
| 0.3 | 0.9 | GO:0086057 | voltage-gated calcium channel activity involved in bundle of His cell action potential(GO:0086057) |
| 0.3 | 2.0 | GO:0004768 | stearoyl-CoA 9-desaturase activity(GO:0004768) acyl-CoA desaturase activity(GO:0016215) |
| 0.3 | 0.8 | GO:0015616 | DNA translocase activity(GO:0015616) |
| 0.2 | 1.0 | GO:0008798 | beta-aspartyl-peptidase activity(GO:0008798) |
| 0.2 | 1.0 | GO:0044378 | non-sequence-specific DNA binding, bending(GO:0044378) |
| 0.2 | 1.4 | GO:0052842 | endopolyphosphatase activity(GO:0000298) diphosphoinositol-polyphosphate diphosphatase activity(GO:0008486) bis(5'-adenosyl)-hexaphosphatase activity(GO:0034431) bis(5'-adenosyl)-pentaphosphatase activity(GO:0034432) inositol diphosphate tetrakisphosphate diphosphatase activity(GO:0052840) inositol bisdiphosphate tetrakisphosphate diphosphatase activity(GO:0052841) inositol diphosphate pentakisphosphate diphosphatase activity(GO:0052842) inositol-1-diphosphate-2,3,4,5,6-pentakisphosphate diphosphatase activity(GO:0052843) inositol-3-diphosphate-1,2,4,5,6-pentakisphosphate diphosphatase activity(GO:0052844) inositol-5-diphosphate-1,2,3,4,6-pentakisphosphate diphosphatase activity(GO:0052845) inositol-1,5-bisdiphosphate-2,3,4,6-tetrakisphosphate 1-diphosphatase activity(GO:0052846) inositol-1,5-bisdiphosphate-2,3,4,6-tetrakisphosphate 5-diphosphatase activity(GO:0052847) inositol-3,5-bisdiphosphate-2,3,4,6-tetrakisphosphate 5-diphosphatase activity(GO:0052848) |
| 0.2 | 0.9 | GO:0047192 | 1-alkylglycerophosphocholine O-acetyltransferase activity(GO:0047192) |
| 0.2 | 1.8 | GO:0004046 | aminoacylase activity(GO:0004046) |
| 0.2 | 0.7 | GO:0033878 | hormone-sensitive lipase activity(GO:0033878) |
| 0.2 | 0.8 | GO:0008478 | pyridoxal kinase activity(GO:0008478) |
| 0.2 | 1.0 | GO:0080019 | fatty-acyl-CoA reductase (alcohol-forming) activity(GO:0080019) |
| 0.2 | 0.7 | GO:0032427 | GBD domain binding(GO:0032427) |
| 0.2 | 2.3 | GO:0008526 | phosphatidylinositol transporter activity(GO:0008526) |
| 0.1 | 0.7 | GO:0048403 | brain-derived neurotrophic factor binding(GO:0048403) |
| 0.1 | 0.6 | GO:0004307 | ethanolaminephosphotransferase activity(GO:0004307) |
| 0.1 | 0.9 | GO:0005105 | type 1 fibroblast growth factor receptor binding(GO:0005105) |
| 0.1 | 0.9 | GO:0016802 | adenosylhomocysteinase activity(GO:0004013) trialkylsulfonium hydrolase activity(GO:0016802) |
| 0.1 | 0.4 | GO:0050405 | [hydroxymethylglutaryl-CoA reductase (NADPH)] kinase activity(GO:0047322) [acetyl-CoA carboxylase] kinase activity(GO:0050405) |
| 0.1 | 0.6 | GO:0070404 | NADH binding(GO:0070404) |
| 0.1 | 0.4 | GO:0071207 | histone pre-mRNA stem-loop binding(GO:0071207) |
| 0.1 | 1.4 | GO:0004931 | extracellular ATP-gated cation channel activity(GO:0004931) ATP-gated ion channel activity(GO:0035381) |
| 0.1 | 0.3 | GO:0004618 | copper-exporting ATPase activity(GO:0004008) phosphoglycerate kinase activity(GO:0004618) copper-transporting ATPase activity(GO:0043682) |
| 0.1 | 1.8 | GO:0004971 | AMPA glutamate receptor activity(GO:0004971) |
| 0.1 | 0.3 | GO:0008193 | tRNA guanylyltransferase activity(GO:0008193) |
| 0.1 | 1.1 | GO:0086006 | voltage-gated sodium channel activity involved in cardiac muscle cell action potential(GO:0086006) |
| 0.1 | 0.6 | GO:0046899 | nucleoside triphosphate adenylate kinase activity(GO:0046899) |
| 0.1 | 0.5 | GO:0004084 | branched-chain-amino-acid transaminase activity(GO:0004084) L-leucine transaminase activity(GO:0052654) L-valine transaminase activity(GO:0052655) L-isoleucine transaminase activity(GO:0052656) |
| 0.1 | 0.3 | GO:0090541 | MIT domain binding(GO:0090541) |
| 0.1 | 0.8 | GO:0031849 | olfactory receptor binding(GO:0031849) |
| 0.1 | 1.5 | GO:0086056 | voltage-gated calcium channel activity involved in AV node cell action potential(GO:0086056) |
| 0.1 | 0.5 | GO:0070579 | methylcytosine dioxygenase activity(GO:0070579) |
| 0.1 | 1.5 | GO:0015386 | potassium:proton antiporter activity(GO:0015386) |
| 0.1 | 0.8 | GO:0015186 | L-glutamine transmembrane transporter activity(GO:0015186) |
| 0.1 | 3.3 | GO:0008574 | ATP-dependent microtubule motor activity, plus-end-directed(GO:0008574) |
| 0.1 | 0.5 | GO:0035614 | snRNA stem-loop binding(GO:0035614) |
| 0.1 | 0.5 | GO:0008823 | cupric reductase activity(GO:0008823) ferric-chelate reductase (NADPH) activity(GO:0052851) |
| 0.1 | 0.4 | GO:0004370 | glycerol kinase activity(GO:0004370) |
| 0.1 | 1.1 | GO:0015288 | porin activity(GO:0015288) |
| 0.1 | 0.5 | GO:0045504 | dynein heavy chain binding(GO:0045504) |
| 0.1 | 1.0 | GO:0016909 | JUN kinase activity(GO:0004705) SAP kinase activity(GO:0016909) |
| 0.1 | 0.3 | GO:0005169 | neurotrophin TRKB receptor binding(GO:0005169) |
| 0.1 | 0.5 | GO:0031871 | proteinase activated receptor binding(GO:0031871) |
| 0.1 | 0.6 | GO:0005223 | intracellular cGMP activated cation channel activity(GO:0005223) |
| 0.1 | 0.8 | GO:0030368 | interleukin-17 receptor activity(GO:0030368) |
| 0.1 | 1.7 | GO:0031404 | chloride ion binding(GO:0031404) |
| 0.1 | 0.9 | GO:0008046 | axon guidance receptor activity(GO:0008046) |
| 0.1 | 0.9 | GO:0030911 | TPR domain binding(GO:0030911) |
| 0.1 | 2.9 | GO:0034237 | protein kinase A regulatory subunit binding(GO:0034237) |
| 0.1 | 0.1 | GO:0001888 | glucuronyl-galactosyl-proteoglycan 4-alpha-N-acetylglucosaminyltransferase activity(GO:0001888) |
| 0.1 | 1.9 | GO:0008191 | metalloendopeptidase inhibitor activity(GO:0008191) |
| 0.1 | 0.7 | GO:0000155 | phosphorelay sensor kinase activity(GO:0000155) |
| 0.1 | 1.0 | GO:0004551 | nucleotide diphosphatase activity(GO:0004551) |
| 0.1 | 0.6 | GO:0001517 | N-acetylglucosamine 6-O-sulfotransferase activity(GO:0001517) |
| 0.1 | 0.5 | GO:0004656 | procollagen-proline 4-dioxygenase activity(GO:0004656) |
| 0.1 | 0.7 | GO:0015166 | polyol transmembrane transporter activity(GO:0015166) |
| 0.1 | 2.1 | GO:0005112 | Notch binding(GO:0005112) |
| 0.1 | 0.5 | GO:0000285 | 1-phosphatidylinositol-3-phosphate 5-kinase activity(GO:0000285) |
| 0.1 | 0.2 | GO:0031753 | endothelial differentiation G-protein coupled receptor binding(GO:0031753) Edg-2 lysophosphatidic acid receptor binding(GO:0031755) |
| 0.1 | 0.8 | GO:0046920 | alpha-(1->3)-fucosyltransferase activity(GO:0046920) |
| 0.1 | 0.8 | GO:0005025 | transforming growth factor beta receptor activity, type I(GO:0005025) |
| 0.1 | 2.8 | GO:0035250 | UDP-galactosyltransferase activity(GO:0035250) |
| 0.1 | 0.8 | GO:0015129 | lactate transmembrane transporter activity(GO:0015129) |
| 0.1 | 0.5 | GO:0099580 | ion antiporter activity involved in regulation of postsynaptic membrane potential(GO:0099580) |
| 0.1 | 0.9 | GO:0015232 | heme transporter activity(GO:0015232) |
| 0.1 | 0.3 | GO:0050833 | pyruvate transmembrane transporter activity(GO:0050833) |
| 0.1 | 1.2 | GO:0005344 | oxygen transporter activity(GO:0005344) |
| 0.1 | 0.5 | GO:0098639 | collagen binding involved in cell-matrix adhesion(GO:0098639) |
| 0.1 | 1.0 | GO:0008140 | cAMP response element binding protein binding(GO:0008140) |
| 0.0 | 0.9 | GO:0010314 | phosphatidylinositol-5-phosphate binding(GO:0010314) |
| 0.0 | 0.4 | GO:0003828 | alpha-N-acetylneuraminate alpha-2,8-sialyltransferase activity(GO:0003828) |
| 0.0 | 0.6 | GO:0043176 | amine binding(GO:0043176) serotonin binding(GO:0051378) |
| 0.0 | 0.1 | GO:0070975 | FHA domain binding(GO:0070975) |
| 0.0 | 0.4 | GO:0015220 | choline transmembrane transporter activity(GO:0015220) |
| 0.0 | 0.7 | GO:0022851 | GABA-gated chloride ion channel activity(GO:0022851) |
| 0.0 | 0.5 | GO:0047144 | 2-acylglycerol-3-phosphate O-acyltransferase activity(GO:0047144) |
| 0.0 | 1.9 | GO:0005086 | ARF guanyl-nucleotide exchange factor activity(GO:0005086) |
| 0.0 | 0.3 | GO:0016454 | serine C-palmitoyltransferase activity(GO:0004758) C-palmitoyltransferase activity(GO:0016454) |
| 0.0 | 0.2 | GO:0008321 | Ral guanyl-nucleotide exchange factor activity(GO:0008321) |
| 0.0 | 0.3 | GO:0016728 | ribonucleoside-diphosphate reductase activity, thioredoxin disulfide as acceptor(GO:0004748) oxidoreductase activity, acting on CH or CH2 groups, disulfide as acceptor(GO:0016728) ribonucleoside-diphosphate reductase activity(GO:0061731) |
| 0.0 | 1.0 | GO:0000062 | fatty-acyl-CoA binding(GO:0000062) |
| 0.0 | 2.5 | GO:0031369 | translation initiation factor binding(GO:0031369) |
| 0.0 | 1.4 | GO:0005001 | transmembrane receptor protein tyrosine phosphatase activity(GO:0005001) transmembrane receptor protein phosphatase activity(GO:0019198) |
| 0.0 | 0.1 | GO:0031727 | CCR2 chemokine receptor binding(GO:0031727) |
| 0.0 | 0.3 | GO:0016670 | oxidoreductase activity, acting on a sulfur group of donors, oxygen as acceptor(GO:0016670) |
| 0.0 | 0.3 | GO:0070290 | N-acylphosphatidylethanolamine-specific phospholipase D activity(GO:0070290) |
| 0.0 | 0.2 | GO:0004740 | pyruvate dehydrogenase (acetyl-transferring) kinase activity(GO:0004740) |
| 0.0 | 0.8 | GO:0008510 | sodium:bicarbonate symporter activity(GO:0008510) |
| 0.0 | 0.3 | GO:1904929 | coreceptor activity involved in Wnt signaling pathway, planar cell polarity pathway(GO:1904929) |
| 0.0 | 0.5 | GO:0015245 | fatty acid transporter activity(GO:0015245) |
| 0.0 | 0.3 | GO:0030621 | U4 snRNA binding(GO:0030621) |
| 0.0 | 0.2 | GO:0005375 | copper ion transmembrane transporter activity(GO:0005375) |
| 0.0 | 0.8 | GO:0050321 | tau-protein kinase activity(GO:0050321) |
| 0.0 | 1.3 | GO:0031624 | ubiquitin conjugating enzyme binding(GO:0031624) |
| 0.0 | 1.4 | GO:0050699 | WW domain binding(GO:0050699) |
| 0.0 | 0.4 | GO:0009982 | pseudouridine synthase activity(GO:0009982) |
| 0.0 | 0.5 | GO:0015095 | magnesium ion transmembrane transporter activity(GO:0015095) |
| 0.0 | 0.6 | GO:0070006 | metalloaminopeptidase activity(GO:0070006) |
| 0.0 | 0.4 | GO:0005522 | profilin binding(GO:0005522) |
| 0.0 | 0.3 | GO:0019531 | oxalate transmembrane transporter activity(GO:0019531) |
| 0.0 | 0.3 | GO:0102338 | fatty acid elongase activity(GO:0009922) 3-oxo-arachidoyl-CoA synthase activity(GO:0102336) 3-oxo-cerotoyl-CoA synthase activity(GO:0102337) 3-oxo-lignoceronyl-CoA synthase activity(GO:0102338) |
| 0.0 | 2.3 | GO:0048365 | Rac GTPase binding(GO:0048365) |
| 0.0 | 0.1 | GO:1904455 | ubiquitin-specific protease activity involved in negative regulation of ERAD pathway(GO:1904455) |
| 0.0 | 0.4 | GO:0016423 | tRNA (guanine) methyltransferase activity(GO:0016423) |
| 0.0 | 0.4 | GO:0003691 | double-stranded telomeric DNA binding(GO:0003691) |
| 0.0 | 0.4 | GO:0005234 | extracellular-glutamate-gated ion channel activity(GO:0005234) |
| 0.0 | 0.2 | GO:0004839 | ubiquitin activating enzyme activity(GO:0004839) |
| 0.0 | 0.3 | GO:0015271 | outward rectifier potassium channel activity(GO:0015271) |
| 0.0 | 0.7 | GO:0005385 | zinc ion transmembrane transporter activity(GO:0005385) |
| 0.0 | 3.9 | GO:0005200 | structural constituent of cytoskeleton(GO:0005200) |
| 0.0 | 0.3 | GO:0008253 | 5'-nucleotidase activity(GO:0008253) |
| 0.0 | 0.2 | GO:0034452 | dynactin binding(GO:0034452) |
| 0.0 | 1.5 | GO:0005546 | phosphatidylinositol-4,5-bisphosphate binding(GO:0005546) |
| 0.0 | 0.5 | GO:0005109 | frizzled binding(GO:0005109) |
| 0.0 | 0.1 | GO:0098821 | BMP receptor activity(GO:0098821) |
| 0.0 | 0.0 | GO:1990698 | palmitoleoyltransferase activity(GO:1990698) |
| 0.0 | 0.2 | GO:0086008 | voltage-gated potassium channel activity involved in cardiac muscle cell action potential repolarization(GO:0086008) |
| 0.0 | 0.1 | GO:0071253 | connexin binding(GO:0071253) |
| 0.0 | 2.4 | GO:0000149 | SNARE binding(GO:0000149) |
| 0.0 | 0.9 | GO:0008200 | ion channel inhibitor activity(GO:0008200) |
| 0.0 | 0.2 | GO:0008503 | benzodiazepine receptor activity(GO:0008503) |
| 0.0 | 0.3 | GO:0008331 | high voltage-gated calcium channel activity(GO:0008331) |
| 0.0 | 0.7 | GO:0005246 | calcium channel regulator activity(GO:0005246) |
| 0.0 | 0.5 | GO:0038191 | neuropilin binding(GO:0038191) |
| 0.0 | 0.4 | GO:0000030 | mannosyltransferase activity(GO:0000030) |
| 0.0 | 0.1 | GO:0008607 | phosphorylase kinase regulator activity(GO:0008607) |
| 0.0 | 0.3 | GO:0031435 | mitogen-activated protein kinase kinase kinase binding(GO:0031435) |
| 0.0 | 0.5 | GO:0051010 | microtubule plus-end binding(GO:0051010) |
| 0.0 | 0.2 | GO:0004707 | MAP kinase activity(GO:0004707) |
| 0.0 | 0.5 | GO:0043015 | gamma-tubulin binding(GO:0043015) |
Gene overrepresentation in curated gene sets: canonical pathways category:
| Log-likelihood per target | Total log-likelihood | Term | Description |
|---|---|---|---|
| 0.0 | 0.3 | PID ER NONGENOMIC PATHWAY | Plasma membrane estrogen receptor signaling |
| 0.0 | 2.1 | PID LIS1 PATHWAY | Lissencephaly gene (LIS1) in neuronal migration and development |
| 0.0 | 1.9 | NABA PROTEOGLYCANS | Genes encoding proteoglycans |
| 0.0 | 1.1 | PID CONE PATHWAY | Visual signal transduction: Cones |
| 0.0 | 0.5 | PID TCR JNK PATHWAY | JNK signaling in the CD4+ TCR pathway |
| 0.0 | 0.9 | SA PTEN PATHWAY | PTEN is a tumor suppressor that dephosphorylates the lipid messenger phosphatidylinositol triphosphate. |
| 0.0 | 2.2 | PID NOTCH PATHWAY | Notch signaling pathway |
| 0.0 | 0.8 | PID EPHA FWDPATHWAY | EPHA forward signaling |
| 0.0 | 0.7 | PID INSULIN GLUCOSE PATHWAY | Insulin-mediated glucose transport |
| 0.0 | 1.1 | PID WNT NONCANONICAL PATHWAY | Noncanonical Wnt signaling pathway |
| 0.0 | 0.3 | PID HEDGEHOG 2PATHWAY | Signaling events mediated by the Hedgehog family |
| 0.0 | 0.8 | PID NCADHERIN PATHWAY | N-cadherin signaling events |
| 0.0 | 0.1 | PID IGF1 PATHWAY | IGF1 pathway |
Gene overrepresentation in curated gene sets: REACTOME pathways category:
| Log-likelihood per target | Total log-likelihood | Term | Description |
|---|---|---|---|
| 0.1 | 3.4 | REACTOME KINESINS | Genes involved in Kinesins |
| 0.1 | 1.4 | REACTOME THE NLRP3 INFLAMMASOME | Genes involved in The NLRP3 inflammasome |
| 0.1 | 2.9 | REACTOME ACTIVATED NOTCH1 TRANSMITS SIGNAL TO THE NUCLEUS | Genes involved in Activated NOTCH1 Transmits Signal to the Nucleus |
| 0.0 | 2.9 | REACTOME ADHERENS JUNCTIONS INTERACTIONS | Genes involved in Adherens junctions interactions |
| 0.0 | 0.3 | REACTOME RAP1 SIGNALLING | Genes involved in Rap1 signalling |
| 0.0 | 1.4 | REACTOME BRANCHED CHAIN AMINO ACID CATABOLISM | Genes involved in Branched-chain amino acid catabolism |
| 0.0 | 1.4 | REACTOME ACYL CHAIN REMODELLING OF PC | Genes involved in Acyl chain remodelling of PC |
| 0.0 | 1.1 | REACTOME ABCA TRANSPORTERS IN LIPID HOMEOSTASIS | Genes involved in ABCA transporters in lipid homeostasis |
| 0.0 | 1.5 | REACTOME JNK C JUN KINASES PHOSPHORYLATION AND ACTIVATION MEDIATED BY ACTIVATED HUMAN TAK1 | Genes involved in JNK (c-Jun kinases) phosphorylation and activation mediated by activated human TAK1 |
| 0.0 | 1.8 | REACTOME TRAFFICKING OF GLUR2 CONTAINING AMPA RECEPTORS | Genes involved in Trafficking of GluR2-containing AMPA receptors |
| 0.0 | 0.6 | REACTOME SEROTONIN RECEPTORS | Genes involved in Serotonin receptors |
| 0.0 | 0.8 | REACTOME BILE SALT AND ORGANIC ANION SLC TRANSPORTERS | Genes involved in Bile salt and organic anion SLC transporters |
| 0.0 | 0.4 | REACTOME MEMBRANE BINDING AND TARGETTING OF GAG PROTEINS | Genes involved in Membrane binding and targetting of GAG proteins |
| 0.0 | 2.2 | REACTOME VOLTAGE GATED POTASSIUM CHANNELS | Genes involved in Voltage gated Potassium channels |
| 0.0 | 0.9 | REACTOME PEROXISOMAL LIPID METABOLISM | Genes involved in Peroxisomal lipid metabolism |
| 0.0 | 1.5 | REACTOME INHIBITION OF INSULIN SECRETION BY ADRENALINE NORADRENALINE | Genes involved in Inhibition of Insulin Secretion by Adrenaline/Noradrenaline |
| 0.0 | 0.5 | REACTOME REGULATION OF RHEB GTPASE ACTIVITY BY AMPK | Genes involved in Regulation of Rheb GTPase activity by AMPK |
| 0.0 | 0.3 | REACTOME ROLE OF SECOND MESSENGERS IN NETRIN1 SIGNALING | Genes involved in Role of second messengers in netrin-1 signaling |
| 0.0 | 0.5 | REACTOME INTEGRIN CELL SURFACE INTERACTIONS | Genes involved in Integrin cell surface interactions |
| 0.0 | 1.1 | REACTOME SIGNALING BY BMP | Genes involved in Signaling by BMP |
| 0.0 | 1.5 | REACTOME SIGNALING BY ROBO RECEPTOR | Genes involved in Signaling by Robo receptor |
| 0.0 | 0.4 | REACTOME SLBP DEPENDENT PROCESSING OF REPLICATION DEPENDENT HISTONE PRE MRNAS | Genes involved in SLBP Dependent Processing of Replication-Dependent Histone Pre-mRNAs |
| 0.0 | 0.9 | REACTOME GABA A RECEPTOR ACTIVATION | Genes involved in GABA A receptor activation |
| 0.0 | 0.3 | REACTOME PYRIMIDINE CATABOLISM | Genes involved in Pyrimidine catabolism |
| 0.0 | 0.7 | REACTOME HORMONE SENSITIVE LIPASE HSL MEDIATED TRIACYLGLYCEROL HYDROLYSIS | Genes involved in Hormone-sensitive lipase (HSL)-mediated triacylglycerol hydrolysis |
| 0.0 | 3.2 | REACTOME TRANSPORT OF INORGANIC CATIONS ANIONS AND AMINO ACIDS OLIGOPEPTIDES | Genes involved in Transport of inorganic cations/anions and amino acids/oligopeptides |
| 0.0 | 0.6 | REACTOME KERATAN SULFATE BIOSYNTHESIS | Genes involved in Keratan sulfate biosynthesis |
| 0.0 | 0.3 | REACTOME PROCESSING OF CAPPED INTRONLESS PRE MRNA | Genes involved in Processing of Capped Intronless Pre-mRNA |
| 0.0 | 1.3 | REACTOME NRAGE SIGNALS DEATH THROUGH JNK | Genes involved in NRAGE signals death through JNK |
| 0.0 | 0.2 | REACTOME NEPHRIN INTERACTIONS | Genes involved in Nephrin interactions |