Project
Illumina Body Map 2 (GSE30611)
Navigation
Downloads
Results for UCAAGUA
Z-value: 1.06
Motif logo

miRNA associated with seed UCAAGUA
| Name | miRBASE accession |
|---|---|
|
hsa-miR-1297
|
MIMAT0005886 |
|
hsa-miR-26a-5p
|
MIMAT0000082 |
|
hsa-miR-26b-5p
|
MIMAT0000083 |
|
hsa-miR-4465
|
MIMAT0018992 |
Activity profile of UCAAGUA motif
Sorted Z-values of UCAAGUA motif
| Promoter | Log-likelihood | Transcript | Gene | Gene Info |
|---|---|---|---|---|
| chr4_-_108168919 | 2.19 |
ENST00000265165.6
|
LEF1
|
lymphoid enhancer binding factor 1 |
| chr17_+_70169516 | 2.02 |
ENST00000243457.4
|
KCNJ2
|
potassium inwardly rectifying channel subfamily J member 2 |
| chrY_+_12904860 | 1.93 |
ENST00000336079.8
|
DDX3Y
|
DEAD-box helicase 3 Y-linked |
| chr18_-_28177102 | 1.77 |
ENST00000413878.2
ENST00000269141.8 |
CDH2
|
cadherin 2 |
| chr12_+_64610458 | 1.52 |
ENST00000542104.6
|
RASSF3
|
Ras association domain family member 3 |
| chr19_+_926001 | 1.47 |
ENST00000263620.8
|
ARID3A
|
AT-rich interaction domain 3A |
| chr6_+_15246054 | 1.38 |
ENST00000341776.7
|
JARID2
|
jumonji and AT-rich interaction domain containing 2 |
| chr12_+_4273751 | 1.35 |
ENST00000675880.1
ENST00000261254.8 |
CCND2
|
cyclin D2 |
| chr8_-_129939694 | 1.34 |
ENST00000522250.5
ENST00000522941.5 ENST00000522746.5 ENST00000520204.5 ENST00000519070.5 ENST00000520254.5 ENST00000519824.6 |
CYRIB
|
CYFIP related Rac1 interactor B |
| chr10_-_97334698 | 1.33 |
ENST00000371019.4
|
FRAT2
|
FRAT regulator of WNT signaling pathway 2 |
| chr8_-_65842051 | 1.31 |
ENST00000401827.8
|
PDE7A
|
phosphodiesterase 7A |
| chr15_+_90001300 | 1.30 |
ENST00000268154.9
|
ZNF710
|
zinc finger protein 710 |
| chr5_+_96936071 | 1.27 |
ENST00000231368.10
|
LNPEP
|
leucyl and cystinyl aminopeptidase |
| chr1_+_244051275 | 1.21 |
ENST00000358704.4
|
ZBTB18
|
zinc finger and BTB domain containing 18 |
| chr22_-_17773976 | 1.17 |
ENST00000317361.11
|
BID
|
BH3 interacting domain death agonist |
| chr7_-_92833896 | 1.17 |
ENST00000265734.8
|
CDK6
|
cyclin dependent kinase 6 |
| chr12_+_62260338 | 1.14 |
ENST00000353364.7
ENST00000549523.5 |
USP15
|
ubiquitin specific peptidase 15 |
| chr22_+_40177917 | 1.13 |
ENST00000454349.7
ENST00000335727.13 |
TNRC6B
|
trinucleotide repeat containing adaptor 6B |
| chr12_+_752551 | 1.12 |
ENST00000315939.11
ENST00000340908.9 ENST00000535572.5 |
WNK1
|
WNK lysine deficient protein kinase 1 |
| chr8_-_81112055 | 1.09 |
ENST00000220597.4
|
PAG1
|
phosphoprotein membrane anchor with glycosphingolipid microdomains 1 |
| chr22_-_21735776 | 1.08 |
ENST00000339468.8
|
YPEL1
|
yippee like 1 |
| chr10_-_72088533 | 1.07 |
ENST00000373109.7
|
SPOCK2
|
SPARC (osteonectin), cwcv and kazal like domains proteoglycan 2 |
| chr6_-_107824294 | 1.06 |
ENST00000369020.8
ENST00000369022.6 |
SCML4
|
Scm polycomb group protein like 4 |
| chr1_+_179954740 | 1.06 |
ENST00000491495.2
ENST00000367607.8 |
CEP350
|
centrosomal protein 350 |
| chr20_-_36646146 | 1.05 |
ENST00000262866.9
|
SLA2
|
Src like adaptor 2 |
| chr13_-_99971739 | 1.05 |
ENST00000267294.4
|
ZIC5
|
Zic family member 5 |
| chr17_-_67245165 | 1.04 |
ENST00000580168.5
ENST00000358691.10 |
HELZ
|
helicase with zinc finger |
| chr1_-_201023694 | 1.04 |
ENST00000332129.6
ENST00000422435.2 ENST00000461742.7 |
KIF21B
|
kinesin family member 21B |
| chr7_-_148884159 | 1.01 |
ENST00000478654.5
ENST00000460911.5 ENST00000350995.6 |
EZH2
|
enhancer of zeste 2 polycomb repressive complex 2 subunit |
| chr9_-_23821275 | 1.01 |
ENST00000380110.8
|
ELAVL2
|
ELAV like RNA binding protein 2 |
| chrX_+_118495803 | 1.00 |
ENST00000276202.9
ENST00000276204.10 |
DOCK11
|
dedicator of cytokinesis 11 |
| chr10_-_6580245 | 0.99 |
ENST00000263125.10
|
PRKCQ
|
protein kinase C theta |
| chr5_-_157575767 | 0.99 |
ENST00000257527.9
|
ADAM19
|
ADAM metallopeptidase domain 19 |
| chr1_+_26826682 | 0.98 |
ENST00000374142.9
|
ZDHHC18
|
zinc finger DHHC-type palmitoyltransferase 18 |
| chr6_+_34236865 | 0.96 |
ENST00000674029.1
ENST00000447654.5 ENST00000347617.10 ENST00000401473.7 ENST00000311487.9 |
HMGA1
|
high mobility group AT-hook 1 |
| chr11_+_126211767 | 0.96 |
ENST00000528985.5
ENST00000529731.5 ENST00000360194.8 ENST00000530043.5 ENST00000533050.6 |
FAM118B
|
family with sequence similarity 118 member B |
| chr3_-_48898813 | 0.96 |
ENST00000319017.5
ENST00000430379.5 |
SLC25A20
|
solute carrier family 25 member 20 |
| chr2_+_73984902 | 0.95 |
ENST00000409262.8
|
TET3
|
tet methylcytosine dioxygenase 3 |
| chr10_+_110644306 | 0.95 |
ENST00000369519.4
|
RBM20
|
RNA binding motif protein 20 |
| chr3_+_53161120 | 0.92 |
ENST00000394729.6
ENST00000330452.8 ENST00000652449.1 |
PRKCD
|
protein kinase C delta |
| chr5_-_100903252 | 0.92 |
ENST00000231461.10
|
ST8SIA4
|
ST8 alpha-N-acetyl-neuraminide alpha-2,8-sialyltransferase 4 |
| chr7_-_139777986 | 0.91 |
ENST00000406875.8
|
HIPK2
|
homeodomain interacting protein kinase 2 |
| chr2_+_206443496 | 0.91 |
ENST00000264377.8
|
ADAM23
|
ADAM metallopeptidase domain 23 |
| chr6_-_42451910 | 0.90 |
ENST00000372922.8
ENST00000541110.5 |
TRERF1
|
transcriptional regulating factor 1 |
| chr14_+_102592611 | 0.90 |
ENST00000262241.7
|
RCOR1
|
REST corepressor 1 |
| chr9_-_35115839 | 0.89 |
ENST00000378566.5
ENST00000322813.10 |
FAM214B
|
family with sequence similarity 214 member B |
| chr5_-_160312524 | 0.89 |
ENST00000520748.1
ENST00000257536.13 ENST00000393977.7 |
CCNJL
|
cyclin J like |
| chr17_+_29390326 | 0.87 |
ENST00000261716.8
|
TAOK1
|
TAO kinase 1 |
| chr3_-_120094436 | 0.87 |
ENST00000264235.13
ENST00000677034.1 |
GSK3B
|
glycogen synthase kinase 3 beta |
| chr1_+_38991239 | 0.86 |
ENST00000432648.8
ENST00000446189.6 ENST00000372984.8 |
AKIRIN1
|
akirin 1 |
| chr3_+_98732236 | 0.86 |
ENST00000265261.10
ENST00000483910.5 ENST00000460774.5 |
ST3GAL6
|
ST3 beta-galactoside alpha-2,3-sialyltransferase 6 |
| chr16_+_30699155 | 0.82 |
ENST00000262518.9
|
SRCAP
|
Snf2 related CREBBP activator protein |
| chr1_-_92483947 | 0.82 |
ENST00000370332.5
|
GFI1
|
growth factor independent 1 transcriptional repressor |
| chr13_-_75482151 | 0.82 |
ENST00000377636.8
|
TBC1D4
|
TBC1 domain family member 4 |
| chr8_+_11704151 | 0.80 |
ENST00000526716.5
ENST00000532059.6 ENST00000335135.8 ENST00000622443.3 |
GATA4
|
GATA binding protein 4 |
| chrX_-_132218124 | 0.79 |
ENST00000342983.6
|
RAP2C
|
RAP2C, member of RAS oncogene family |
| chr12_-_57846686 | 0.79 |
ENST00000548823.1
ENST00000398073.7 |
CTDSP2
|
CTD small phosphatase 2 |
| chr16_+_30923565 | 0.79 |
ENST00000338343.10
|
FBXL19
|
F-box and leucine rich repeat protein 19 |
| chr16_-_46748337 | 0.78 |
ENST00000394809.9
|
MYLK3
|
myosin light chain kinase 3 |
| chr18_-_76495191 | 0.78 |
ENST00000443185.7
|
ZNF516
|
zinc finger protein 516 |
| chr2_-_168247569 | 0.78 |
ENST00000355999.5
|
STK39
|
serine/threonine kinase 39 |
| chr8_-_37899454 | 0.78 |
ENST00000522727.5
ENST00000287263.8 ENST00000330843.9 |
RAB11FIP1
|
RAB11 family interacting protein 1 |
| chr4_-_46993520 | 0.78 |
ENST00000264318.4
|
GABRA4
|
gamma-aminobutyric acid type A receptor subunit alpha4 |
| chr13_-_21459226 | 0.77 |
ENST00000320220.13
|
ZDHHC20
|
zinc finger DHHC-type palmitoyltransferase 20 |
| chr9_-_37034261 | 0.77 |
ENST00000358127.9
ENST00000377852.7 ENST00000523241.6 |
PAX5
|
paired box 5 |
| chr7_+_141074038 | 0.75 |
ENST00000565468.6
ENST00000610315.1 |
TMEM178B
|
transmembrane protein 178B |
| chr10_+_84328625 | 0.74 |
ENST00000224756.12
|
CCSER2
|
coiled-coil serine rich protein 2 |
| chr3_-_13420307 | 0.74 |
ENST00000254508.7
|
NUP210
|
nucleoporin 210 |
| chr15_-_61229297 | 0.73 |
ENST00000335670.11
|
RORA
|
RAR related orphan receptor A |
| chr14_+_70907450 | 0.73 |
ENST00000304743.7
|
PCNX1
|
pecanex 1 |
| chr12_-_92145838 | 0.73 |
ENST00000256015.5
|
BTG1
|
BTG anti-proliferation factor 1 |
| chr11_-_64878612 | 0.71 |
ENST00000320631.8
|
EHD1
|
EH domain containing 1 |
| chr3_+_47282930 | 0.71 |
ENST00000232766.6
ENST00000437353.5 |
KLHL18
|
kelch like family member 18 |
| chr13_-_78603539 | 0.70 |
ENST00000377208.7
|
POU4F1
|
POU class 4 homeobox 1 |
| chr1_+_167630093 | 0.70 |
ENST00000537350.5
ENST00000361496.3 ENST00000367854.8 |
RCSD1
|
RCSD domain containing 1 |
| chr3_+_43690880 | 0.69 |
ENST00000458276.7
|
ABHD5
|
abhydrolase domain containing 5, lysophosphatidic acid acyltransferase |
| chr14_+_102777461 | 0.69 |
ENST00000560371.5
ENST00000347662.8 |
TRAF3
|
TNF receptor associated factor 3 |
| chr9_+_112750722 | 0.69 |
ENST00000374232.8
|
SNX30
|
sorting nexin family member 30 |
| chr11_+_14643782 | 0.69 |
ENST00000282096.9
|
PDE3B
|
phosphodiesterase 3B |
| chr2_+_84971093 | 0.68 |
ENST00000456682.1
ENST00000409785.9 |
KCMF1
|
potassium channel modulatory factor 1 |
| chr3_-_112499457 | 0.68 |
ENST00000334529.10
|
BTLA
|
B and T lymphocyte associated |
| chr14_+_52730154 | 0.68 |
ENST00000354586.5
ENST00000442123.6 |
STYX
|
serine/threonine/tyrosine interacting protein |
| chr8_-_73878816 | 0.68 |
ENST00000602593.6
ENST00000651945.1 ENST00000419880.7 ENST00000517608.5 ENST00000650817.1 |
UBE2W
|
ubiquitin conjugating enzyme E2 W |
| chr4_+_56907876 | 0.68 |
ENST00000640168.2
ENST00000309042.12 |
REST
|
RE1 silencing transcription factor |
| chr17_-_50866347 | 0.68 |
ENST00000499247.3
|
TOB1
|
transducer of ERBB2, 1 |
| chr8_-_67343768 | 0.67 |
ENST00000262215.8
|
ARFGEF1
|
ADP ribosylation factor guanine nucleotide exchange factor 1 |
| chr1_-_6180265 | 0.67 |
ENST00000262450.8
|
CHD5
|
chromodomain helicase DNA binding protein 5 |
| chr3_+_32817990 | 0.67 |
ENST00000383763.6
|
TRIM71
|
tripartite motif containing 71 |
| chr17_-_79797030 | 0.66 |
ENST00000269385.9
|
CBX8
|
chromobox 8 |
| chr8_-_8893548 | 0.66 |
ENST00000276282.7
|
MFHAS1
|
malignant fibrous histiocytoma amplified sequence 1 |
| chr3_-_125595488 | 0.66 |
ENST00000296220.6
|
OSBPL11
|
oxysterol binding protein like 11 |
| chr2_+_119759875 | 0.66 |
ENST00000263708.7
|
PTPN4
|
protein tyrosine phosphatase non-receptor type 4 |
| chr20_-_53593829 | 0.66 |
ENST00000371471.7
|
ZNF217
|
zinc finger protein 217 |
| chr10_-_58267868 | 0.65 |
ENST00000373935.4
|
IPMK
|
inositol polyphosphate multikinase |
| chr2_+_197804583 | 0.65 |
ENST00000428675.6
|
PLCL1
|
phospholipase C like 1 (inactive) |
| chr16_+_11668414 | 0.64 |
ENST00000329565.6
|
SNN
|
stannin |
| chr10_+_58334998 | 0.64 |
ENST00000373910.9
|
UBE2D1
|
ubiquitin conjugating enzyme E2 D1 |
| chr9_-_120714457 | 0.63 |
ENST00000373930.4
|
MEGF9
|
multiple EGF like domains 9 |
| chr2_+_169827432 | 0.63 |
ENST00000272793.11
|
UBR3
|
ubiquitin protein ligase E3 component n-recognin 3 |
| chr6_+_104957099 | 0.63 |
ENST00000345080.5
|
LIN28B
|
lin-28 homolog B |
| chr1_+_32108035 | 0.62 |
ENST00000373625.8
|
KPNA6
|
karyopherin subunit alpha 6 |
| chr10_-_27240743 | 0.62 |
ENST00000677901.1
ENST00000677960.1 ENST00000677440.1 ENST00000396271.8 ENST00000677141.1 ENST00000677311.1 ENST00000677667.1 ENST00000677200.1 ENST00000676997.1 ENST00000676511.1 |
ACBD5
|
acyl-CoA binding domain containing 5 |
| chr5_+_72816643 | 0.62 |
ENST00000337273.10
ENST00000523768.5 |
TNPO1
|
transportin 1 |
| chr2_+_201451711 | 0.62 |
ENST00000194530.8
ENST00000392249.6 |
STRADB
|
STE20 related adaptor beta |
| chr10_+_87863595 | 0.62 |
ENST00000371953.8
|
PTEN
|
phosphatase and tensin homolog |
| chr17_-_68291116 | 0.62 |
ENST00000327268.8
ENST00000580666.6 |
SLC16A6
|
solute carrier family 16 member 6 |
| chr7_+_128715385 | 0.61 |
ENST00000315184.9
|
FAM71F1
|
family with sequence similarity 71 member F1 |
| chr7_+_139231225 | 0.61 |
ENST00000473989.8
|
UBN2
|
ubinuclein 2 |
| chr10_-_92243246 | 0.61 |
ENST00000412050.8
ENST00000614585.4 |
CPEB3
|
cytoplasmic polyadenylation element binding protein 3 |
| chr7_-_100479142 | 0.60 |
ENST00000300181.7
ENST00000393991.5 |
TSC22D4
|
TSC22 domain family member 4 |
| chr2_+_113890039 | 0.60 |
ENST00000443297.5
ENST00000263238.7 ENST00000415792.5 |
ACTR3
|
actin related protein 3 |
| chr17_+_32486975 | 0.58 |
ENST00000313401.4
|
CDK5R1
|
cyclin dependent kinase 5 regulatory subunit 1 |
| chrX_+_41085436 | 0.58 |
ENST00000324545.9
ENST00000378308.7 |
USP9X
|
ubiquitin specific peptidase 9 X-linked |
| chr2_+_148644706 | 0.57 |
ENST00000258484.11
|
EPC2
|
enhancer of polycomb homolog 2 |
| chr1_-_16352420 | 0.57 |
ENST00000375592.8
|
FBXO42
|
F-box protein 42 |
| chr2_+_12716893 | 0.57 |
ENST00000381465.2
ENST00000155926.9 |
TRIB2
|
tribbles pseudokinase 2 |
| chr17_-_4366616 | 0.57 |
ENST00000572484.5
ENST00000396981.7 |
UBE2G1
|
ubiquitin conjugating enzyme E2 G1 |
| chr17_-_65056659 | 0.57 |
ENST00000439174.7
|
GNA13
|
G protein subunit alpha 13 |
| chr8_-_115668966 | 0.56 |
ENST00000395715.8
|
TRPS1
|
transcriptional repressor GATA binding 1 |
| chr12_+_131894615 | 0.55 |
ENST00000321867.6
|
ULK1
|
unc-51 like autophagy activating kinase 1 |
| chr1_-_84690406 | 0.55 |
ENST00000605755.5
ENST00000342203.8 ENST00000437941.6 |
SSX2IP
|
SSX family member 2 interacting protein |
| chr5_-_60700094 | 0.54 |
ENST00000453022.6
ENST00000265036.10 |
DEPDC1B
|
DEP domain containing 1B |
| chr1_-_217089627 | 0.54 |
ENST00000361525.7
|
ESRRG
|
estrogen related receptor gamma |
| chr9_+_112380080 | 0.54 |
ENST00000398803.1
ENST00000398805.8 |
HSDL2
|
hydroxysteroid dehydrogenase like 2 |
| chr15_-_82046119 | 0.53 |
ENST00000558133.1
|
MEX3B
|
mex-3 RNA binding family member B |
| chrX_-_80809854 | 0.53 |
ENST00000373275.5
|
BRWD3
|
bromodomain and WD repeat domain containing 3 |
| chr5_-_147782518 | 0.53 |
ENST00000507386.5
|
JAKMIP2
|
janus kinase and microtubule interacting protein 2 |
| chr16_-_12803785 | 0.53 |
ENST00000433677.6
ENST00000261660.4 ENST00000381774.9 |
CPPED1
|
calcineurin like phosphoesterase domain containing 1 |
| chr18_-_72867945 | 0.52 |
ENST00000327305.11
|
NETO1
|
neuropilin and tolloid like 1 |
| chr5_+_56815534 | 0.52 |
ENST00000399503.4
|
MAP3K1
|
mitogen-activated protein kinase kinase kinase 1 |
| chr8_+_97644164 | 0.52 |
ENST00000336273.8
|
MTDH
|
metadherin |
| chr1_-_35557378 | 0.52 |
ENST00000325722.8
ENST00000469892.5 |
KIAA0319L
|
KIAA0319 like |
| chr1_-_19485468 | 0.51 |
ENST00000375142.5
|
CAPZB
|
capping actin protein of muscle Z-line subunit beta |
| chr21_+_43865200 | 0.51 |
ENST00000291572.13
|
AGPAT3
|
1-acylglycerol-3-phosphate O-acyltransferase 3 |
| chr1_-_51519236 | 0.51 |
ENST00000371730.6
ENST00000371733.8 |
EPS15
|
epidermal growth factor receptor pathway substrate 15 |
| chr12_+_31959406 | 0.51 |
ENST00000540924.5
ENST00000312561.9 |
RESF1
|
retroelement silencing factor 1 |
| chr10_-_32347109 | 0.51 |
ENST00000469059.2
ENST00000319778.11 |
EPC1
|
enhancer of polycomb homolog 1 |
| chr2_-_212538766 | 0.50 |
ENST00000342788.9
|
ERBB4
|
erb-b2 receptor tyrosine kinase 4 |
| chr15_-_64356074 | 0.50 |
ENST00000634811.1
ENST00000303052.13 ENST00000607537.6 |
CSNK1G1
|
casein kinase 1 gamma 1 |
| chr3_+_196739839 | 0.50 |
ENST00000327134.7
|
PAK2
|
p21 (RAC1) activated kinase 2 |
| chr1_-_9910169 | 0.50 |
ENST00000377263.6
|
CTNNBIP1
|
catenin beta interacting protein 1 |
| chr2_+_46542474 | 0.50 |
ENST00000238738.9
|
RHOQ
|
ras homolog family member Q |
| chr1_-_103108512 | 0.50 |
ENST00000370096.9
ENST00000647280.1 ENST00000644186.1 |
COL11A1
|
collagen type XI alpha 1 chain |
| chr3_+_150408314 | 0.50 |
ENST00000361875.7
|
TSC22D2
|
TSC22 domain family member 2 |
| chr12_-_46268989 | 0.50 |
ENST00000549049.5
ENST00000439706.5 ENST00000398637.10 |
SLC38A1
|
solute carrier family 38 member 1 |
| chr1_-_38873322 | 0.49 |
ENST00000397572.5
ENST00000494695.4 |
MYCBP
|
MYC binding protein |
| chr17_-_19867929 | 0.49 |
ENST00000361658.6
ENST00000395544.9 |
ULK2
|
unc-51 like autophagy activating kinase 2 |
| chr3_-_115071333 | 0.49 |
ENST00000462705.5
|
ZBTB20
|
zinc finger and BTB domain containing 20 |
| chr8_+_55102012 | 0.49 |
ENST00000327381.7
|
XKR4
|
XK related 4 |
| chr2_-_23927107 | 0.49 |
ENST00000238789.10
|
ATAD2B
|
ATPase family AAA domain containing 2B |
| chr1_+_113929600 | 0.49 |
ENST00000369558.5
ENST00000369561.8 |
HIPK1
|
homeodomain interacting protein kinase 1 |
| chr1_+_212285383 | 0.49 |
ENST00000261461.7
|
PPP2R5A
|
protein phosphatase 2 regulatory subunit B'alpha |
| chr5_+_173888335 | 0.48 |
ENST00000265085.10
|
CPEB4
|
cytoplasmic polyadenylation element binding protein 4 |
| chr5_-_16179783 | 0.48 |
ENST00000332432.9
|
MARCHF11
|
membrane associated ring-CH-type finger 11 |
| chr9_-_107489754 | 0.48 |
ENST00000610832.1
ENST00000374672.5 |
KLF4
|
Kruppel like factor 4 |
| chr3_-_196432397 | 0.47 |
ENST00000381887.7
ENST00000296328.9 ENST00000428095.1 |
UBXN7
|
UBX domain protein 7 |
| chr18_-_21111778 | 0.47 |
ENST00000399799.3
|
ROCK1
|
Rho associated coiled-coil containing protein kinase 1 |
| chr16_+_67109925 | 0.47 |
ENST00000219139.8
ENST00000563853.6 ENST00000569914.5 ENST00000569600.5 |
C16orf70
|
chromosome 16 open reading frame 70 |
| chr9_-_136050502 | 0.46 |
ENST00000371753.5
|
NACC2
|
NACC family member 2 |
| chr7_+_39950187 | 0.46 |
ENST00000181839.10
|
CDK13
|
cyclin dependent kinase 13 |
| chr5_+_61332236 | 0.46 |
ENST00000252744.6
|
ZSWIM6
|
zinc finger SWIM-type containing 6 |
| chr9_-_20622479 | 0.46 |
ENST00000380338.9
|
MLLT3
|
MLLT3 super elongation complex subunit |
| chr17_+_28042660 | 0.46 |
ENST00000407008.8
|
NLK
|
nemo like kinase |
| chr3_-_138834752 | 0.46 |
ENST00000477593.5
ENST00000483968.5 |
PIK3CB
|
phosphatidylinositol-4,5-bisphosphate 3-kinase catalytic subunit beta |
| chr12_+_71664281 | 0.46 |
ENST00000308086.3
|
THAP2
|
THAP domain containing 2 |
| chr1_+_10032832 | 0.45 |
ENST00000253251.12
ENST00000672724.1 ENST00000343090.11 |
UBE4B
|
ubiquitination factor E4B |
| chr14_-_70809494 | 0.45 |
ENST00000381250.8
ENST00000554752.7 ENST00000555993.6 |
MAP3K9
|
mitogen-activated protein kinase kinase kinase 9 |
| chr14_+_57268963 | 0.45 |
ENST00000261558.8
|
AP5M1
|
adaptor related protein complex 5 subunit mu 1 |
| chr22_+_41092585 | 0.45 |
ENST00000263253.9
|
EP300
|
E1A binding protein p300 |
| chr9_-_123184233 | 0.44 |
ENST00000447404.6
|
STRBP
|
spermatid perinuclear RNA binding protein |
| chr15_-_48963912 | 0.44 |
ENST00000332408.9
|
SHC4
|
SHC adaptor protein 4 |
| chr6_-_17706852 | 0.44 |
ENST00000262077.3
|
NUP153
|
nucleoporin 153 |
| chr5_-_79512794 | 0.43 |
ENST00000282260.10
ENST00000508576.5 ENST00000535690.1 |
HOMER1
|
homer scaffold protein 1 |
| chr1_-_46668454 | 0.43 |
ENST00000576409.5
|
ATPAF1
|
ATP synthase mitochondrial F1 complex assembly factor 1 |
| chr18_+_62523002 | 0.43 |
ENST00000269499.10
|
ZCCHC2
|
zinc finger CCHC-type containing 2 |
| chr9_+_89311187 | 0.43 |
ENST00000314355.7
|
CKS2
|
CDC28 protein kinase regulatory subunit 2 |
| chr22_+_45163910 | 0.43 |
ENST00000347635.9
ENST00000407019.6 ENST00000424634.5 ENST00000417702.5 ENST00000430547.5 |
NUP50
|
nucleoporin 50 |
| chr1_+_35883189 | 0.43 |
ENST00000674304.1
ENST00000373204.6 ENST00000674426.1 |
AGO1
|
argonaute RISC component 1 |
| chr10_+_125719689 | 0.43 |
ENST00000337623.7
ENST00000356792.9 |
EDRF1
|
erythroid differentiation regulatory factor 1 |
| chr6_+_24494939 | 0.42 |
ENST00000348925.2
ENST00000357578.8 |
ALDH5A1
|
aldehyde dehydrogenase 5 family member A1 |
| chr12_-_116277677 | 0.41 |
ENST00000281928.9
|
MED13L
|
mediator complex subunit 13L |
| chr14_+_103334176 | 0.41 |
ENST00000560338.5
ENST00000560763.5 ENST00000216554.8 |
EIF5
|
eukaryotic translation initiation factor 5 |
| chr1_-_114716729 | 0.41 |
ENST00000369535.5
|
NRAS
|
NRAS proto-oncogene, GTPase |
| chr3_-_172711005 | 0.41 |
ENST00000424772.2
ENST00000475381.7 |
NCEH1
|
neutral cholesterol ester hydrolase 1 |
| chr4_-_170003738 | 0.40 |
ENST00000502832.1
ENST00000393704.3 |
MFAP3L
|
microfibril associated protein 3 like |
| chr4_+_98995709 | 0.40 |
ENST00000296411.11
ENST00000625963.1 |
METAP1
|
methionyl aminopeptidase 1 |
| chr4_+_139301478 | 0.40 |
ENST00000296543.10
ENST00000398947.1 |
NAA15
|
N-alpha-acetyltransferase 15, NatA auxiliary subunit |
| chr15_-_42457513 | 0.40 |
ENST00000565611.5
ENST00000263805.8 |
ZNF106
|
zinc finger protein 106 |
| chr16_-_5033916 | 0.39 |
ENST00000381955.7
ENST00000312251.8 |
NAGPA
|
N-acetylglucosamine-1-phosphodiester alpha-N-acetylglucosaminidase |
| chr15_+_63504583 | 0.39 |
ENST00000380324.8
ENST00000561442.5 ENST00000560070.5 |
USP3
|
ubiquitin specific peptidase 3 |
| chr7_-_151877105 | 0.39 |
ENST00000287878.9
ENST00000652321.1 |
PRKAG2
|
protein kinase AMP-activated non-catalytic subunit gamma 2 |
| chr3_-_129688691 | 0.39 |
ENST00000432054.6
|
TMCC1
|
transmembrane and coiled-coil domain family 1 |
| chr4_+_151409169 | 0.39 |
ENST00000435205.6
|
FAM160A1
|
family with sequence similarity 160 member A1 |
| chr12_-_46372763 | 0.39 |
ENST00000256689.10
|
SLC38A2
|
solute carrier family 38 member 2 |
| chr3_-_182980531 | 0.39 |
ENST00000292782.9
ENST00000632685.1 |
DCUN1D1
|
defective in cullin neddylation 1 domain containing 1 |
| chr5_+_140114085 | 0.38 |
ENST00000331327.5
|
PURA
|
purine rich element binding protein A |
| chr12_-_77065526 | 0.38 |
ENST00000547316.1
ENST00000416496.6 ENST00000550669.5 ENST00000322886.12 |
E2F7
|
E2F transcription factor 7 |
| chr3_-_58433810 | 0.38 |
ENST00000474765.1
ENST00000485460.5 ENST00000302746.11 ENST00000383714.8 |
PDHB
|
pyruvate dehydrogenase E1 subunit beta |
| chr9_-_3525968 | 0.38 |
ENST00000382004.7
ENST00000617270.5 ENST00000449190.5 |
RFX3
|
regulatory factor X3 |
| chr2_-_157628852 | 0.38 |
ENST00000243349.13
|
ACVR1C
|
activin A receptor type 1C |
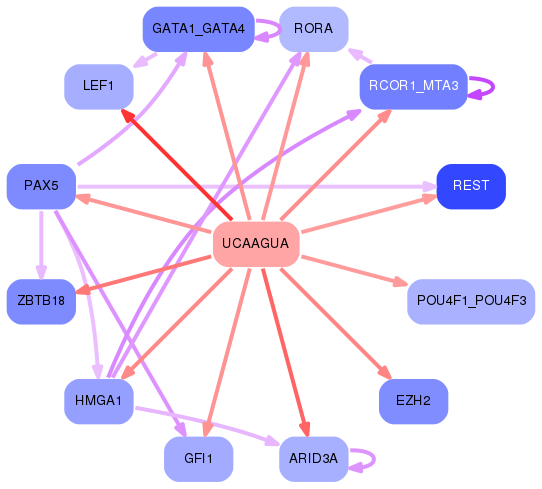
Network of associatons between targets according to the STRING database.

First level regulatory network of UCAAGUA
Gene Ontology Analysis
Gene overrepresentation in biological process category:
| Log-likelihood per target | Total log-likelihood | Term | Description |
|---|---|---|---|
| 0.4 | 2.0 | GO:0090076 | relaxation of skeletal muscle(GO:0090076) |
| 0.3 | 1.0 | GO:0036333 | hepatocyte homeostasis(GO:0036333) response to tetrachloromethane(GO:1904772) |
| 0.3 | 1.0 | GO:0006844 | acyl carnitine transport(GO:0006844) acyl carnitine transmembrane transport(GO:1902616) |
| 0.3 | 1.0 | GO:0044725 | chromatin reprogramming in the zygote(GO:0044725) |
| 0.3 | 1.9 | GO:0023016 | signal transduction by trans-phosphorylation(GO:0023016) |
| 0.3 | 2.2 | GO:0061152 | trachea submucosa development(GO:0061152) trachea gland development(GO:0061153) |
| 0.3 | 0.8 | GO:0070105 | positive regulation of interleukin-6-mediated signaling pathway(GO:0070105) |
| 0.3 | 0.8 | GO:1902594 | viral penetration into host nucleus(GO:0075732) multi-organism nuclear import(GO:1902594) |
| 0.3 | 1.3 | GO:0002528 | regulation of vascular permeability involved in acute inflammatory response(GO:0002528) |
| 0.2 | 1.0 | GO:0035712 | T-helper 2 cell activation(GO:0035712) regulation of T-helper 2 cell activation(GO:2000569) positive regulation of T-helper 2 cell activation(GO:2000570) |
| 0.2 | 0.9 | GO:2000754 | regulation of phospholipid scramblase activity(GO:1900161) positive regulation of phospholipid scramblase activity(GO:1900163) regulation of glucosylceramide catabolic process(GO:2000752) positive regulation of glucosylceramide catabolic process(GO:2000753) regulation of sphingomyelin catabolic process(GO:2000754) positive regulation of sphingomyelin catabolic process(GO:2000755) |
| 0.2 | 0.7 | GO:0097086 | amniotic stem cell differentiation(GO:0097086) negative regulation of dense core granule biogenesis(GO:2000706) negative regulation of mesenchymal stem cell differentiation(GO:2000740) regulation of amniotic stem cell differentiation(GO:2000797) negative regulation of amniotic stem cell differentiation(GO:2000798) |
| 0.2 | 0.7 | GO:0098532 | histone H3-K27 trimethylation(GO:0098532) |
| 0.2 | 0.7 | GO:0071930 | negative regulation of transcription involved in G1/S transition of mitotic cell cycle(GO:0071930) |
| 0.2 | 1.1 | GO:0090402 | oncogene-induced cell senescence(GO:0090402) |
| 0.2 | 0.6 | GO:1900365 | positive regulation of mRNA polyadenylation(GO:1900365) |
| 0.2 | 0.8 | GO:0003290 | atrial septum secundum morphogenesis(GO:0003290) embryonic heart tube anterior/posterior pattern specification(GO:0035054) |
| 0.2 | 0.6 | GO:0021718 | superior olivary nucleus development(GO:0021718) superior olivary nucleus maturation(GO:0021722) |
| 0.2 | 0.7 | GO:0021538 | epithalamus development(GO:0021538) habenula development(GO:0021986) |
| 0.2 | 0.8 | GO:2000312 | regulation of kainate selective glutamate receptor activity(GO:2000312) |
| 0.2 | 1.1 | GO:0035616 | histone H2B conserved C-terminal lysine deubiquitination(GO:0035616) |
| 0.2 | 1.8 | GO:1902897 | regulation of postsynaptic density protein 95 clustering(GO:1902897) |
| 0.2 | 0.6 | GO:0030576 | Cajal body organization(GO:0030576) |
| 0.2 | 0.6 | GO:0060024 | rhythmic synaptic transmission(GO:0060024) negative regulation of ribosome biogenesis(GO:0090071) positive regulation of TRAIL-activated apoptotic signaling pathway(GO:1903984) |
| 0.1 | 0.7 | GO:0018076 | N-terminal peptidyl-lysine acetylation(GO:0018076) |
| 0.1 | 0.5 | GO:0051490 | negative regulation of filopodium assembly(GO:0051490) |
| 0.1 | 1.3 | GO:0002480 | antigen processing and presentation of exogenous peptide antigen via MHC class I, TAP-independent(GO:0002480) |
| 0.1 | 1.9 | GO:2000271 | positive regulation of fibroblast apoptotic process(GO:2000271) |
| 0.1 | 0.4 | GO:1901383 | negative regulation of chorionic trophoblast cell proliferation(GO:1901383) |
| 0.1 | 0.6 | GO:0071596 | ubiquitin-dependent protein catabolic process via the N-end rule pathway(GO:0071596) |
| 0.1 | 0.9 | GO:2000077 | negative regulation of dopaminergic neuron differentiation(GO:1904339) negative regulation of type B pancreatic cell development(GO:2000077) |
| 0.1 | 0.5 | GO:2000342 | negative regulation of chemokine (C-X-C motif) ligand 2 production(GO:2000342) |
| 0.1 | 1.0 | GO:0075044 | autophagy of host cells involved in interaction with symbiont(GO:0075044) autophagy involved in symbiotic interaction(GO:0075071) |
| 0.1 | 0.3 | GO:0048250 | mitochondrial iron ion transport(GO:0048250) |
| 0.1 | 0.6 | GO:0045074 | interleukin-10 biosynthetic process(GO:0042091) regulation of interleukin-10 biosynthetic process(GO:0045074) |
| 0.1 | 0.7 | GO:0090283 | regulation of protein glycosylation in Golgi(GO:0090283) |
| 0.1 | 0.8 | GO:2001023 | regulation of response to drug(GO:2001023) |
| 0.1 | 0.3 | GO:0033024 | mast cell homeostasis(GO:0033023) mast cell apoptotic process(GO:0033024) regulation of mast cell apoptotic process(GO:0033025) |
| 0.1 | 0.5 | GO:0061026 | cardiac muscle tissue regeneration(GO:0061026) |
| 0.1 | 0.7 | GO:0006540 | glutamate decarboxylation to succinate(GO:0006540) |
| 0.1 | 0.7 | GO:0045204 | MAPK export from nucleus(GO:0045204) |
| 0.1 | 0.4 | GO:0072560 | type B pancreatic cell maturation(GO:0072560) |
| 0.1 | 2.1 | GO:0045974 | miRNA mediated inhibition of translation(GO:0035278) negative regulation of translation, ncRNA-mediated(GO:0040033) regulation of translation, ncRNA-mediated(GO:0045974) |
| 0.1 | 0.5 | GO:1903347 | negative regulation of bicellular tight junction assembly(GO:1903347) |
| 0.1 | 1.4 | GO:0060235 | lens induction in camera-type eye(GO:0060235) |
| 0.1 | 0.5 | GO:0033031 | positive regulation of neutrophil apoptotic process(GO:0033031) |
| 0.1 | 1.2 | GO:0043697 | dedifferentiation(GO:0043696) cell dedifferentiation(GO:0043697) |
| 0.1 | 0.6 | GO:0010587 | miRNA catabolic process(GO:0010587) |
| 0.1 | 0.3 | GO:0002339 | B cell selection(GO:0002339) |
| 0.1 | 0.4 | GO:0007206 | phospholipase C-activating G-protein coupled glutamate receptor signaling pathway(GO:0007206) |
| 0.1 | 0.3 | GO:2000298 | regulation of Rho-dependent protein serine/threonine kinase activity(GO:2000298) |
| 0.1 | 0.8 | GO:0070164 | negative regulation of adiponectin secretion(GO:0070164) |
| 0.1 | 0.5 | GO:2001271 | negative regulation of cysteine-type endopeptidase activity involved in execution phase of apoptosis(GO:2001271) |
| 0.1 | 0.2 | GO:0071921 | establishment of sister chromatid cohesion(GO:0034085) cohesin loading(GO:0071921) regulation of cohesin loading(GO:0071922) |
| 0.1 | 0.8 | GO:0008063 | Toll signaling pathway(GO:0008063) |
| 0.1 | 0.7 | GO:2001137 | positive regulation of endocytic recycling(GO:2001137) |
| 0.1 | 0.6 | GO:0035973 | aggrephagy(GO:0035973) |
| 0.1 | 1.4 | GO:0051574 | positive regulation of histone H3-K9 methylation(GO:0051574) |
| 0.1 | 0.4 | GO:0002904 | positive regulation of B cell apoptotic process(GO:0002904) |
| 0.1 | 0.6 | GO:0016344 | meiotic chromosome movement towards spindle pole(GO:0016344) |
| 0.1 | 0.7 | GO:0010890 | positive regulation of sequestering of triglyceride(GO:0010890) |
| 0.1 | 0.5 | GO:0019065 | receptor-mediated endocytosis of virus by host cell(GO:0019065) endocytosis involved in viral entry into host cell(GO:0075509) |
| 0.1 | 0.4 | GO:0033615 | mitochondrial proton-transporting ATP synthase complex assembly(GO:0033615) |
| 0.1 | 0.1 | GO:1900248 | cytoplasmic translational elongation(GO:0002182) regulation of cytoplasmic translational elongation(GO:1900247) negative regulation of cytoplasmic translational elongation(GO:1900248) |
| 0.1 | 0.6 | GO:0070236 | negative regulation of activation-induced cell death of T cells(GO:0070236) |
| 0.1 | 0.2 | GO:0001543 | ovarian follicle rupture(GO:0001543) |
| 0.1 | 0.8 | GO:0031339 | negative regulation of vesicle fusion(GO:0031339) |
| 0.1 | 1.6 | GO:0071481 | cellular response to X-ray(GO:0071481) |
| 0.1 | 0.9 | GO:0006707 | cholesterol catabolic process(GO:0006707) sterol catabolic process(GO:0016127) |
| 0.1 | 0.4 | GO:0034670 | chemotaxis to arachidonic acid(GO:0034670) response to arachidonic acid(GO:1904550) |
| 0.1 | 0.2 | GO:0060268 | negative regulation of respiratory burst(GO:0060268) |
| 0.1 | 0.7 | GO:0043951 | negative regulation of cAMP-mediated signaling(GO:0043951) |
| 0.1 | 0.3 | GO:0003409 | optic vesicle morphogenesis(GO:0003404) optic cup structural organization(GO:0003409) |
| 0.1 | 0.6 | GO:1900122 | positive regulation of receptor binding(GO:1900122) |
| 0.1 | 0.2 | GO:0042727 | flavin-containing compound biosynthetic process(GO:0042727) |
| 0.1 | 1.0 | GO:0002315 | marginal zone B cell differentiation(GO:0002315) |
| 0.1 | 0.5 | GO:1902231 | positive regulation of intrinsic apoptotic signaling pathway in response to DNA damage(GO:1902231) |
| 0.1 | 0.3 | GO:1903588 | negative regulation of blood vessel endothelial cell proliferation involved in sprouting angiogenesis(GO:1903588) |
| 0.1 | 0.2 | GO:0003365 | establishment of cell polarity involved in ameboidal cell migration(GO:0003365) |
| 0.1 | 0.2 | GO:2001280 | positive regulation of prostaglandin biosynthetic process(GO:0031394) positive regulation of fibroblast growth factor production(GO:0090271) positive regulation of unsaturated fatty acid biosynthetic process(GO:2001280) |
| 0.1 | 0.5 | GO:0008626 | granzyme-mediated apoptotic signaling pathway(GO:0008626) |
| 0.0 | 0.7 | GO:0010898 | positive regulation of triglyceride catabolic process(GO:0010898) |
| 0.0 | 0.2 | GO:1904761 | negative regulation of myofibroblast differentiation(GO:1904761) |
| 0.0 | 1.1 | GO:0019800 | peptide cross-linking via chondroitin 4-sulfate glycosaminoglycan(GO:0019800) |
| 0.0 | 0.3 | GO:0071557 | histone H3-K27 demethylation(GO:0071557) |
| 0.0 | 0.2 | GO:1990569 | UDP-N-acetylglucosamine transport(GO:0015788) UDP-N-acetylglucosamine transmembrane transport(GO:1990569) |
| 0.0 | 0.2 | GO:0043686 | co-translational protein modification(GO:0043686) |
| 0.0 | 0.3 | GO:0071630 | nucleus-associated proteasomal ubiquitin-dependent protein catabolic process(GO:0071630) |
| 0.0 | 2.1 | GO:0006607 | NLS-bearing protein import into nucleus(GO:0006607) |
| 0.0 | 0.2 | GO:0034402 | recruitment of 3'-end processing factors to RNA polymerase II holoenzyme complex(GO:0034402) |
| 0.0 | 0.9 | GO:0001574 | ganglioside biosynthetic process(GO:0001574) |
| 0.0 | 0.8 | GO:0051573 | negative regulation of histone H3-K9 methylation(GO:0051573) |
| 0.0 | 0.3 | GO:0072385 | minus-end-directed organelle transport along microtubule(GO:0072385) |
| 0.0 | 0.2 | GO:1904382 | protein deglycosylation involved in glycoprotein catabolic process(GO:0035977) glycoprotein ERAD pathway(GO:0097466) mannose trimming involved in glycoprotein ERAD pathway(GO:1904382) |
| 0.0 | 2.0 | GO:0018345 | protein palmitoylation(GO:0018345) |
| 0.0 | 0.7 | GO:0018206 | peptidyl-methionine modification(GO:0018206) |
| 0.0 | 0.7 | GO:0071474 | cellular hyperosmotic response(GO:0071474) |
| 0.0 | 0.1 | GO:2000616 | negative regulation of histone H3-K9 acetylation(GO:2000616) |
| 0.0 | 1.3 | GO:1904886 | beta-catenin destruction complex disassembly(GO:1904886) |
| 0.0 | 0.7 | GO:0021694 | cerebellar Purkinje cell layer formation(GO:0021694) cerebellar Purkinje cell differentiation(GO:0021702) |
| 0.0 | 0.9 | GO:0070933 | histone H4 deacetylation(GO:0070933) |
| 0.0 | 0.4 | GO:0007256 | activation of JNKK activity(GO:0007256) |
| 0.0 | 0.5 | GO:0090219 | negative regulation of lipid kinase activity(GO:0090219) |
| 0.0 | 0.1 | GO:2000686 | regulation of rubidium ion transmembrane transporter activity(GO:2000686) |
| 0.0 | 0.3 | GO:0042796 | snRNA transcription from RNA polymerase III promoter(GO:0042796) |
| 0.0 | 1.2 | GO:0032486 | Rap protein signal transduction(GO:0032486) |
| 0.0 | 0.6 | GO:0036010 | protein localization to endosome(GO:0036010) |
| 0.0 | 0.6 | GO:0031584 | activation of phospholipase D activity(GO:0031584) |
| 0.0 | 0.2 | GO:0060800 | regulation of cell differentiation involved in embryonic placenta development(GO:0060800) |
| 0.0 | 0.2 | GO:0044314 | protein K27-linked ubiquitination(GO:0044314) |
| 0.0 | 0.3 | GO:0090116 | C-5 methylation of cytosine(GO:0090116) |
| 0.0 | 0.4 | GO:0061732 | mitochondrial acetyl-CoA biosynthetic process from pyruvate(GO:0061732) |
| 0.0 | 1.1 | GO:0034453 | microtubule anchoring(GO:0034453) |
| 0.0 | 0.3 | GO:1903912 | negative regulation of PERK-mediated unfolded protein response(GO:1903898) negative regulation of endoplasmic reticulum stress-induced eIF2 alpha phosphorylation(GO:1903912) |
| 0.0 | 0.5 | GO:0031936 | negative regulation of chromatin silencing(GO:0031936) |
| 0.0 | 0.4 | GO:2000643 | positive regulation of early endosome to late endosome transport(GO:2000643) |
| 0.0 | 0.7 | GO:0060213 | regulation of nuclear-transcribed mRNA poly(A) tail shortening(GO:0060211) positive regulation of nuclear-transcribed mRNA poly(A) tail shortening(GO:0060213) |
| 0.0 | 0.4 | GO:0001731 | formation of translation preinitiation complex(GO:0001731) |
| 0.0 | 0.4 | GO:0043249 | erythrocyte maturation(GO:0043249) |
| 0.0 | 0.3 | GO:0061052 | negative regulation of cell growth involved in cardiac muscle cell development(GO:0061052) |
| 0.0 | 0.2 | GO:0030070 | insulin processing(GO:0030070) |
| 0.0 | 0.4 | GO:0006268 | DNA unwinding involved in DNA replication(GO:0006268) |
| 0.0 | 0.6 | GO:1904293 | negative regulation of ERAD pathway(GO:1904293) |
| 0.0 | 0.4 | GO:0033299 | secretion of lysosomal enzymes(GO:0033299) |
| 0.0 | 1.0 | GO:0015838 | amino-acid betaine transport(GO:0015838) |
| 0.0 | 0.5 | GO:1902916 | positive regulation of protein polyubiquitination(GO:1902916) |
| 0.0 | 0.3 | GO:0097012 | cellular response to granulocyte macrophage colony-stimulating factor stimulus(GO:0097011) response to granulocyte macrophage colony-stimulating factor(GO:0097012) |
| 0.0 | 0.5 | GO:2000766 | negative regulation of cytoplasmic translation(GO:2000766) |
| 0.0 | 0.1 | GO:0034421 | post-translational protein acetylation(GO:0034421) |
| 0.0 | 1.8 | GO:0010501 | RNA secondary structure unwinding(GO:0010501) |
| 0.0 | 0.1 | GO:0051413 | response to cortisone(GO:0051413) |
| 0.0 | 0.5 | GO:2000096 | positive regulation of Wnt signaling pathway, planar cell polarity pathway(GO:2000096) |
| 0.0 | 0.3 | GO:0010820 | positive regulation of T cell chemotaxis(GO:0010820) |
| 0.0 | 0.5 | GO:0035020 | regulation of Rac protein signal transduction(GO:0035020) |
| 0.0 | 0.5 | GO:0050910 | detection of mechanical stimulus involved in sensory perception of sound(GO:0050910) |
| 0.0 | 0.2 | GO:0015015 | heparan sulfate proteoglycan biosynthetic process, enzymatic modification(GO:0015015) |
| 0.0 | 0.2 | GO:0010909 | regulation of heparan sulfate proteoglycan biosynthetic process(GO:0010908) positive regulation of heparan sulfate proteoglycan biosynthetic process(GO:0010909) positive regulation of proteoglycan biosynthetic process(GO:1902730) |
| 0.0 | 0.3 | GO:0033235 | positive regulation of protein sumoylation(GO:0033235) |
| 0.0 | 0.3 | GO:0032927 | positive regulation of activin receptor signaling pathway(GO:0032927) |
| 0.0 | 1.2 | GO:0006409 | tRNA export from nucleus(GO:0006409) tRNA-containing ribonucleoprotein complex export from nucleus(GO:0071431) |
| 0.0 | 0.3 | GO:0032020 | ISG15-protein conjugation(GO:0032020) |
| 0.0 | 0.3 | GO:0007023 | post-chaperonin tubulin folding pathway(GO:0007023) |
| 0.0 | 0.7 | GO:0032967 | positive regulation of collagen biosynthetic process(GO:0032967) |
| 0.0 | 0.7 | GO:0043968 | histone H2A acetylation(GO:0043968) |
| 0.0 | 0.3 | GO:0021520 | spinal cord motor neuron cell fate specification(GO:0021520) |
| 0.0 | 0.2 | GO:0038028 | insulin receptor signaling pathway via phosphatidylinositol 3-kinase(GO:0038028) |
| 0.0 | 0.2 | GO:0072502 | cellular phosphate ion homeostasis(GO:0030643) cellular trivalent inorganic anion homeostasis(GO:0072502) |
| 0.0 | 0.7 | GO:0050849 | negative regulation of calcium-mediated signaling(GO:0050849) |
| 0.0 | 0.9 | GO:0071354 | cellular response to interleukin-6(GO:0071354) |
| 0.0 | 0.3 | GO:0034312 | diol biosynthetic process(GO:0034312) sphingosine biosynthetic process(GO:0046512) |
| 0.0 | 0.5 | GO:0090005 | negative regulation of establishment of protein localization to plasma membrane(GO:0090005) |
| 0.0 | 0.2 | GO:1902237 | positive regulation of endoplasmic reticulum stress-induced intrinsic apoptotic signaling pathway(GO:1902237) |
| 0.0 | 0.1 | GO:1904117 | traversing start control point of mitotic cell cycle(GO:0007089) response to vasopressin(GO:1904116) cellular response to vasopressin(GO:1904117) |
| 0.0 | 0.1 | GO:1903774 | positive regulation of viral budding via host ESCRT complex(GO:1903774) |
| 0.0 | 0.2 | GO:0031087 | deadenylation-independent decapping of nuclear-transcribed mRNA(GO:0031087) |
| 0.0 | 0.1 | GO:0043653 | mitochondrial fragmentation involved in apoptotic process(GO:0043653) |
| 0.0 | 0.2 | GO:0021684 | cerebellar granular layer formation(GO:0021684) cerebellar granule cell differentiation(GO:0021707) |
| 0.0 | 0.1 | GO:0006408 | snRNA export from nucleus(GO:0006408) |
| 0.0 | 0.5 | GO:0016024 | CDP-diacylglycerol biosynthetic process(GO:0016024) |
| 0.0 | 0.3 | GO:0015074 | DNA integration(GO:0015074) |
| 0.0 | 0.1 | GO:0061163 | endoplasmic reticulum polarization(GO:0061163) actin filament bundle retrograde transport(GO:0061573) actin filament bundle distribution(GO:0070650) |
| 0.0 | 0.7 | GO:0071218 | cellular response to misfolded protein(GO:0071218) |
| 0.0 | 0.3 | GO:0033631 | cell-cell adhesion mediated by integrin(GO:0033631) |
| 0.0 | 0.3 | GO:0061088 | regulation of sequestering of zinc ion(GO:0061088) |
| 0.0 | 0.1 | GO:1903378 | positive regulation of oxidative stress-induced neuron intrinsic apoptotic signaling pathway(GO:1903378) |
| 0.0 | 1.0 | GO:0033120 | positive regulation of RNA splicing(GO:0033120) |
| 0.0 | 0.1 | GO:0048789 | cytoskeletal matrix organization at active zone(GO:0048789) neurexin clustering involved in presynaptic membrane assembly(GO:0097115) retrograde trans-synaptic signaling by trans-synaptic protein complex(GO:0098942) |
| 0.0 | 0.1 | GO:0051684 | maintenance of Golgi location(GO:0051684) |
| 0.0 | 0.3 | GO:0002517 | T cell tolerance induction(GO:0002517) |
| 0.0 | 0.3 | GO:0019532 | oxalate transport(GO:0019532) |
| 0.0 | 0.3 | GO:0042355 | fucose catabolic process(GO:0019317) L-fucose metabolic process(GO:0042354) L-fucose catabolic process(GO:0042355) |
| 0.0 | 0.3 | GO:0035751 | regulation of lysosomal lumen pH(GO:0035751) |
| 0.0 | 0.1 | GO:0044339 | canonical Wnt signaling pathway involved in osteoblast differentiation(GO:0044339) |
| 0.0 | 0.1 | GO:0035694 | mitochondrial protein catabolic process(GO:0035694) |
| 0.0 | 0.1 | GO:0000183 | chromatin silencing at rDNA(GO:0000183) |
| 0.0 | 1.1 | GO:0000186 | activation of MAPKK activity(GO:0000186) |
| 0.0 | 0.8 | GO:0050873 | brown fat cell differentiation(GO:0050873) |
| 0.0 | 0.1 | GO:0034723 | DNA replication-dependent nucleosome assembly(GO:0006335) DNA replication-dependent nucleosome organization(GO:0034723) |
| 0.0 | 0.3 | GO:1990118 | sodium ion import across plasma membrane(GO:0098719) sodium ion import into cell(GO:1990118) |
| 0.0 | 0.3 | GO:0090141 | positive regulation of mitochondrial fission(GO:0090141) |
| 0.0 | 0.2 | GO:0006390 | transcription from mitochondrial promoter(GO:0006390) |
| 0.0 | 0.2 | GO:0035871 | protein K11-linked deubiquitination(GO:0035871) |
| 0.0 | 0.0 | GO:0090298 | negative regulation of mitochondrial DNA replication(GO:0090298) negative regulation of mitochondrial DNA metabolic process(GO:1901859) |
| 0.0 | 0.1 | GO:0098700 | neurotransmitter loading into synaptic vesicle(GO:0098700) |
| 0.0 | 0.1 | GO:0006617 | SRP-dependent cotranslational protein targeting to membrane, signal sequence recognition(GO:0006617) |
| 0.0 | 0.7 | GO:2001240 | negative regulation of signal transduction in absence of ligand(GO:1901099) negative regulation of extrinsic apoptotic signaling pathway in absence of ligand(GO:2001240) |
| 0.0 | 0.6 | GO:0032456 | endocytic recycling(GO:0032456) |
| 0.0 | 0.8 | GO:0006198 | cAMP catabolic process(GO:0006198) |
| 0.0 | 0.3 | GO:0045116 | protein neddylation(GO:0045116) |
| 0.0 | 0.4 | GO:0016578 | histone deubiquitination(GO:0016578) |
| 0.0 | 0.4 | GO:0007020 | microtubule nucleation(GO:0007020) |
| 0.0 | 1.2 | GO:0006977 | DNA damage response, signal transduction by p53 class mediator resulting in cell cycle arrest(GO:0006977) |
| 0.0 | 0.1 | GO:0017183 | peptidyl-diphthamide metabolic process(GO:0017182) peptidyl-diphthamide biosynthetic process from peptidyl-histidine(GO:0017183) |
| 0.0 | 0.2 | GO:0001829 | trophectodermal cell differentiation(GO:0001829) |
| 0.0 | 0.5 | GO:0070534 | protein K63-linked ubiquitination(GO:0070534) |
| 0.0 | 0.6 | GO:0007223 | Wnt signaling pathway, calcium modulating pathway(GO:0007223) |
| 0.0 | 0.8 | GO:2000134 | negative regulation of G1/S transition of mitotic cell cycle(GO:2000134) |
| 0.0 | 0.1 | GO:0045779 | negative regulation of bone resorption(GO:0045779) |
| 0.0 | 0.4 | GO:0006379 | mRNA cleavage(GO:0006379) |
| 0.0 | 0.2 | GO:0038203 | TORC2 signaling(GO:0038203) |
| 0.0 | 0.4 | GO:0072600 | establishment of protein localization to Golgi(GO:0072600) |
Gene overrepresentation in cellular component category:
| Log-likelihood per target | Total log-likelihood | Term | Description |
|---|---|---|---|
| 0.3 | 1.3 | GO:0031905 | early endosome lumen(GO:0031905) |
| 0.2 | 1.3 | GO:0097129 | cyclin D2-CDK4 complex(GO:0097129) |
| 0.2 | 0.5 | GO:0005592 | collagen type XI trimer(GO:0005592) |
| 0.1 | 0.6 | GO:0097629 | extrinsic component of omegasome membrane(GO:0097629) |
| 0.1 | 1.1 | GO:0035985 | senescence-associated heterochromatin focus(GO:0035985) |
| 0.1 | 1.1 | GO:0032777 | Piccolo NuA4 histone acetyltransferase complex(GO:0032777) |
| 0.1 | 0.6 | GO:0016533 | cyclin-dependent protein kinase 5 holoenzyme complex(GO:0016533) |
| 0.1 | 2.2 | GO:1990907 | beta-catenin-TCF complex(GO:1990907) |
| 0.1 | 0.3 | GO:0034657 | GID complex(GO:0034657) |
| 0.1 | 0.7 | GO:0020016 | ciliary pocket(GO:0020016) ciliary pocket membrane(GO:0020018) |
| 0.1 | 0.3 | GO:0035189 | Rb-E2F complex(GO:0035189) |
| 0.1 | 0.5 | GO:0002945 | cyclin K-CDK13 complex(GO:0002945) |
| 0.1 | 0.3 | GO:0071062 | alphav-beta3 integrin-vitronectin complex(GO:0071062) |
| 0.1 | 0.4 | GO:0098592 | cytoplasmic side of apical plasma membrane(GO:0098592) |
| 0.1 | 2.0 | GO:0045120 | pronucleus(GO:0045120) |
| 0.1 | 0.3 | GO:1990075 | periciliary membrane compartment(GO:1990075) |
| 0.1 | 1.8 | GO:0016342 | catenin complex(GO:0016342) |
| 0.1 | 0.2 | GO:0032116 | SMC loading complex(GO:0032116) |
| 0.1 | 1.1 | GO:0008290 | F-actin capping protein complex(GO:0008290) |
| 0.1 | 0.4 | GO:0048179 | activin receptor complex(GO:0048179) |
| 0.1 | 0.9 | GO:1990909 | Wnt signalosome(GO:1990909) |
| 0.1 | 0.3 | GO:0035363 | histone locus body(GO:0035363) |
| 0.0 | 0.4 | GO:0031415 | NatA complex(GO:0031415) |
| 0.0 | 0.4 | GO:1990589 | ATF4-CREB1 transcription factor complex(GO:1990589) |
| 0.0 | 1.4 | GO:0035098 | ESC/E(Z) complex(GO:0035098) |
| 0.0 | 0.3 | GO:0070876 | SOSS complex(GO:0070876) |
| 0.0 | 0.3 | GO:0070695 | FHF complex(GO:0070695) |
| 0.0 | 0.1 | GO:0033186 | CAF-1 complex(GO:0033186) |
| 0.0 | 0.3 | GO:0030289 | protein phosphatase 4 complex(GO:0030289) |
| 0.0 | 0.2 | GO:0090571 | RNA polymerase II transcription repressor complex(GO:0090571) |
| 0.0 | 1.3 | GO:0030014 | CCR4-NOT complex(GO:0030014) |
| 0.0 | 0.7 | GO:0035631 | CD40 receptor complex(GO:0035631) |
| 0.0 | 0.5 | GO:0044666 | MLL3/4 complex(GO:0044666) |
| 0.0 | 0.5 | GO:0046581 | intercellular canaliculus(GO:0046581) |
| 0.0 | 0.6 | GO:0035749 | myelin sheath adaxonal region(GO:0035749) |
| 0.0 | 0.4 | GO:0098559 | cytoplasmic side of early endosome membrane(GO:0098559) |
| 0.0 | 0.4 | GO:0045254 | pyruvate dehydrogenase complex(GO:0045254) |
| 0.0 | 0.7 | GO:0035102 | PRC1 complex(GO:0035102) |
| 0.0 | 0.5 | GO:0098839 | postsynaptic density membrane(GO:0098839) |
| 0.0 | 0.8 | GO:0032045 | guanyl-nucleotide exchange factor complex(GO:0032045) |
| 0.0 | 0.6 | GO:0034098 | VCP-NPL4-UFD1 AAA ATPase complex(GO:0034098) |
| 0.0 | 0.4 | GO:0097136 | Bcl-2 family protein complex(GO:0097136) |
| 0.0 | 0.3 | GO:0030897 | HOPS complex(GO:0030897) |
| 0.0 | 0.6 | GO:0005885 | Arp2/3 protein complex(GO:0005885) |
| 0.0 | 0.6 | GO:0031588 | nucleotide-activated protein kinase complex(GO:0031588) |
| 0.0 | 0.5 | GO:0032059 | bleb(GO:0032059) |
| 0.0 | 0.9 | GO:0090545 | NuRD complex(GO:0016581) CHD-type complex(GO:0090545) |
| 0.0 | 0.2 | GO:0090543 | Flemming body(GO:0090543) |
| 0.0 | 0.5 | GO:0030877 | beta-catenin destruction complex(GO:0030877) |
| 0.0 | 0.4 | GO:0070578 | RISC-loading complex(GO:0070578) |
| 0.0 | 0.3 | GO:0097197 | tetraspanin-enriched microdomain(GO:0097197) |
| 0.0 | 1.8 | GO:0016235 | aggresome(GO:0016235) |
| 0.0 | 0.1 | GO:0042587 | glycogen granule(GO:0042587) |
| 0.0 | 1.7 | GO:0000118 | histone deacetylase complex(GO:0000118) |
| 0.0 | 0.8 | GO:0000791 | euchromatin(GO:0000791) |
| 0.0 | 3.1 | GO:0005643 | nuclear pore(GO:0005643) |
| 0.0 | 0.4 | GO:0005847 | mRNA cleavage and polyadenylation specificity factor complex(GO:0005847) |
| 0.0 | 0.6 | GO:1990124 | messenger ribonucleoprotein complex(GO:1990124) |
| 0.0 | 0.4 | GO:0070938 | contractile ring(GO:0070938) |
| 0.0 | 0.1 | GO:0044609 | DBIRD complex(GO:0044609) |
| 0.0 | 0.2 | GO:0005955 | calcineurin complex(GO:0005955) |
| 0.0 | 0.4 | GO:0034045 | pre-autophagosomal structure membrane(GO:0034045) |
| 0.0 | 1.3 | GO:0045171 | intercellular bridge(GO:0045171) |
| 0.0 | 0.8 | GO:1902711 | GABA-A receptor complex(GO:1902711) |
| 0.0 | 0.4 | GO:0005662 | DNA replication factor A complex(GO:0005662) |
| 0.0 | 0.4 | GO:0017146 | NMDA selective glutamate receptor complex(GO:0017146) |
| 0.0 | 0.2 | GO:0042788 | polysomal ribosome(GO:0042788) |
| 0.0 | 2.1 | GO:0017053 | transcriptional repressor complex(GO:0017053) |
| 0.0 | 0.2 | GO:0071986 | Ragulator complex(GO:0071986) |
| 0.0 | 2.5 | GO:0044291 | cell-cell contact zone(GO:0044291) |
| 0.0 | 0.1 | GO:0016600 | flotillin complex(GO:0016600) |
| 0.0 | 0.9 | GO:0000307 | cyclin-dependent protein kinase holoenzyme complex(GO:0000307) |
| 0.0 | 0.2 | GO:0000812 | Swr1 complex(GO:0000812) |
| 0.0 | 2.2 | GO:0016605 | PML body(GO:0016605) |
| 0.0 | 0.2 | GO:0097524 | sperm plasma membrane(GO:0097524) |
| 0.0 | 0.3 | GO:0046930 | pore complex(GO:0046930) |
| 0.0 | 1.2 | GO:0032592 | integral component of mitochondrial membrane(GO:0032592) |
| 0.0 | 0.3 | GO:0000164 | protein phosphatase type 1 complex(GO:0000164) |
| 0.0 | 2.2 | GO:0000932 | cytoplasmic mRNA processing body(GO:0000932) |
| 0.0 | 0.5 | GO:0034451 | centriolar satellite(GO:0034451) |
| 0.0 | 0.2 | GO:0016461 | unconventional myosin complex(GO:0016461) |
| 0.0 | 0.3 | GO:0061200 | clathrin-sculpted gamma-aminobutyric acid transport vesicle(GO:0061200) clathrin-sculpted gamma-aminobutyric acid transport vesicle membrane(GO:0061202) |
| 0.0 | 0.2 | GO:0008278 | cohesin complex(GO:0008278) |
| 0.0 | 0.5 | GO:0043034 | costamere(GO:0043034) |
| 0.0 | 0.6 | GO:0016592 | mediator complex(GO:0016592) |
| 0.0 | 0.1 | GO:0016589 | NURF complex(GO:0016589) |
| 0.0 | 0.6 | GO:0000159 | protein phosphatase type 2A complex(GO:0000159) |
| 0.0 | 1.8 | GO:0035770 | ribonucleoprotein granule(GO:0035770) |
| 0.0 | 0.1 | GO:0072669 | tRNA-splicing ligase complex(GO:0072669) |
| 0.0 | 1.5 | GO:0035578 | azurophil granule lumen(GO:0035578) |
| 0.0 | 0.2 | GO:0061700 | GATOR2 complex(GO:0061700) |
| 0.0 | 0.3 | GO:0005892 | acetylcholine-gated channel complex(GO:0005892) |
Gene overrepresentation in molecular function category:
| Log-likelihood per target | Total log-likelihood | Term | Description |
|---|---|---|---|
| 0.3 | 1.0 | GO:0015227 | acyl carnitine transmembrane transporter activity(GO:0015227) |
| 0.3 | 1.2 | GO:0098770 | FBXO family protein binding(GO:0098770) |
| 0.2 | 0.7 | GO:0004119 | cGMP-inhibited cyclic-nucleotide phosphodiesterase activity(GO:0004119) |
| 0.2 | 0.6 | GO:0016534 | cyclin-dependent protein kinase 5 activator activity(GO:0016534) |
| 0.2 | 1.1 | GO:0061649 | ubiquitinated histone binding(GO:0061649) |
| 0.2 | 0.9 | GO:0070579 | methylcytosine dioxygenase activity(GO:0070579) |
| 0.2 | 0.9 | GO:0052798 | beta-galactoside alpha-2,3-sialyltransferase activity(GO:0052798) |
| 0.2 | 0.5 | GO:0051717 | inositol-1,3,4,5-tetrakisphosphate 3-phosphatase activity(GO:0051717) |
| 0.2 | 0.7 | GO:0061628 | H3K27me3 modified histone binding(GO:0061628) |
| 0.2 | 0.7 | GO:0051765 | inositol tetrakisphosphate kinase activity(GO:0051765) |
| 0.1 | 4.0 | GO:0045295 | gamma-catenin binding(GO:0045295) |
| 0.1 | 0.4 | GO:0038100 | nodal binding(GO:0038100) |
| 0.1 | 0.5 | GO:0032427 | GBD domain binding(GO:0032427) |
| 0.1 | 0.9 | GO:0004699 | calcium-independent protein kinase C activity(GO:0004699) |
| 0.1 | 0.9 | GO:0003828 | alpha-N-acetylneuraminate alpha-2,8-sialyltransferase activity(GO:0003828) |
| 0.1 | 0.4 | GO:0004739 | pyruvate dehydrogenase (acetyl-transferring) activity(GO:0004739) |
| 0.1 | 0.4 | GO:1904455 | ubiquitin-specific protease activity involved in negative regulation of ERAD pathway(GO:1904455) |
| 0.1 | 2.0 | GO:0015467 | G-protein activated inward rectifier potassium channel activity(GO:0015467) voltage-gated potassium channel activity involved in cardiac muscle cell action potential repolarization(GO:0086008) |
| 0.1 | 0.6 | GO:0031752 | D5 dopamine receptor binding(GO:0031752) |
| 0.1 | 0.5 | GO:0001010 | transcription factor activity, sequence-specific DNA binding transcription factor recruiting(GO:0001010) |
| 0.1 | 0.8 | GO:0004687 | myosin light chain kinase activity(GO:0004687) |
| 0.1 | 1.1 | GO:0019869 | chloride channel inhibitor activity(GO:0019869) |
| 0.1 | 0.2 | GO:0047322 | [hydroxymethylglutaryl-CoA reductase (NADPH)] kinase activity(GO:0047322) [acetyl-CoA carboxylase] kinase activity(GO:0050405) |
| 0.1 | 0.4 | GO:0004706 | JUN kinase kinase kinase activity(GO:0004706) |
| 0.1 | 1.0 | GO:0046976 | histone methyltransferase activity (H3-K27 specific)(GO:0046976) |
| 0.1 | 0.7 | GO:0050682 | AF-2 domain binding(GO:0050682) |
| 0.1 | 0.4 | GO:0071074 | eukaryotic initiation factor eIF2 binding(GO:0071074) |
| 0.1 | 0.3 | GO:0072590 | N-acetyl-L-aspartate-L-glutamate ligase activity(GO:0072590) |
| 0.1 | 1.2 | GO:0055106 | ubiquitin-protein transferase regulator activity(GO:0055106) |
| 0.1 | 0.4 | GO:0032422 | purine-rich negative regulatory element binding(GO:0032422) |
| 0.1 | 0.4 | GO:0042030 | ATPase inhibitor activity(GO:0042030) |
| 0.1 | 0.9 | GO:0046790 | virion binding(GO:0046790) |
| 0.1 | 0.8 | GO:0008420 | CTD phosphatase activity(GO:0008420) |
| 0.1 | 0.2 | GO:0000822 | inositol hexakisphosphate binding(GO:0000822) |
| 0.1 | 0.3 | GO:0061676 | importin-alpha family protein binding(GO:0061676) |
| 0.1 | 0.8 | GO:0051525 | NFAT protein binding(GO:0051525) |
| 0.1 | 0.7 | GO:0008142 | oxysterol binding(GO:0008142) |
| 0.1 | 0.4 | GO:0004468 | lysine N-acetyltransferase activity, acting on acetyl phosphate as donor(GO:0004468) |
| 0.1 | 0.9 | GO:0031996 | thioesterase binding(GO:0031996) |
| 0.1 | 0.4 | GO:0004771 | sterol esterase activity(GO:0004771) |
| 0.1 | 0.5 | GO:0061665 | SUMO ligase activity(GO:0061665) |
| 0.0 | 1.0 | GO:0042975 | peroxisome proliferator activated receptor binding(GO:0042975) |
| 0.0 | 0.2 | GO:0005462 | UDP-N-acetylglucosamine transmembrane transporter activity(GO:0005462) |
| 0.0 | 2.4 | GO:0008139 | nuclear localization sequence binding(GO:0008139) |
| 0.0 | 0.4 | GO:1990763 | arrestin family protein binding(GO:1990763) |
| 0.0 | 2.0 | GO:0019707 | protein-cysteine S-palmitoyltransferase activity(GO:0019706) protein-cysteine S-acyltransferase activity(GO:0019707) |
| 0.0 | 0.7 | GO:0004726 | non-membrane spanning protein tyrosine phosphatase activity(GO:0004726) |
| 0.0 | 0.2 | GO:0036033 | mediator complex binding(GO:0036033) |
| 0.0 | 0.2 | GO:0050510 | N-acetylgalactosaminyl-proteoglycan 3-beta-glucuronosyltransferase activity(GO:0050510) |
| 0.0 | 0.8 | GO:0008503 | benzodiazepine receptor activity(GO:0008503) |
| 0.0 | 0.1 | GO:0052853 | (S)-2-hydroxy-acid oxidase activity(GO:0003973) very-long-chain-(S)-2-hydroxy-acid oxidase activity(GO:0052852) long-chain-(S)-2-hydroxy-long-chain-acid oxidase activity(GO:0052853) medium-chain-(S)-2-hydroxy-acid oxidase activity(GO:0052854) |
| 0.0 | 1.1 | GO:0008191 | metalloendopeptidase inhibitor activity(GO:0008191) |
| 0.0 | 0.2 | GO:0047280 | nicotinamide phosphoribosyltransferase activity(GO:0047280) |
| 0.0 | 0.6 | GO:0008526 | phosphatidylinositol transporter activity(GO:0008526) |
| 0.0 | 1.1 | GO:0005068 | transmembrane receptor protein tyrosine kinase adaptor activity(GO:0005068) |
| 0.0 | 0.7 | GO:0015271 | outward rectifier potassium channel activity(GO:0015271) |
| 0.0 | 0.3 | GO:0003886 | DNA (cytosine-5-)-methyltransferase activity(GO:0003886) |
| 0.0 | 0.2 | GO:0061575 | cyclin-dependent protein serine/threonine kinase activator activity(GO:0061575) |
| 0.0 | 0.3 | GO:0004351 | glutamate decarboxylase activity(GO:0004351) |
| 0.0 | 2.0 | GO:0061631 | ubiquitin conjugating enzyme activity(GO:0061631) |
| 0.0 | 1.4 | GO:0004709 | MAP kinase kinase kinase activity(GO:0004709) |
| 0.0 | 0.2 | GO:0017095 | heparan sulfate 6-O-sulfotransferase activity(GO:0017095) |
| 0.0 | 0.5 | GO:0035005 | 1-phosphatidylinositol-4-phosphate 3-kinase activity(GO:0035005) |
| 0.0 | 0.4 | GO:0008607 | phosphorylase kinase regulator activity(GO:0008607) |
| 0.0 | 0.1 | GO:0003953 | NAD+ nucleosidase activity(GO:0003953) |
| 0.0 | 0.1 | GO:0035501 | MH1 domain binding(GO:0035501) |
| 0.0 | 1.0 | GO:0004697 | protein kinase C activity(GO:0004697) |
| 0.0 | 1.5 | GO:0051059 | NF-kappaB binding(GO:0051059) |
| 0.0 | 1.1 | GO:0035198 | miRNA binding(GO:0035198) |
| 0.0 | 1.3 | GO:0000900 | translation repressor activity, nucleic acid binding(GO:0000900) |
| 0.0 | 0.2 | GO:0004666 | prostaglandin-endoperoxide synthase activity(GO:0004666) arachidonate 15-lipoxygenase activity(GO:0050473) |
| 0.0 | 0.3 | GO:0005138 | interleukin-6 receptor binding(GO:0005138) |
| 0.0 | 0.5 | GO:0004716 | receptor signaling protein tyrosine kinase activity(GO:0004716) |
| 0.0 | 0.7 | GO:0034450 | ubiquitin-ubiquitin ligase activity(GO:0034450) |
| 0.0 | 0.3 | GO:0017040 | ceramidase activity(GO:0017040) |
| 0.0 | 0.3 | GO:0071558 | histone demethylase activity (H3-K27 specific)(GO:0071558) |
| 0.0 | 1.2 | GO:0003841 | 1-acylglycerol-3-phosphate O-acyltransferase activity(GO:0003841) |
| 0.0 | 0.5 | GO:0070016 | armadillo repeat domain binding(GO:0070016) |
| 0.0 | 0.2 | GO:0004571 | mannosyl-oligosaccharide 1,2-alpha-mannosidase activity(GO:0004571) |
| 0.0 | 0.2 | GO:0004305 | ethanolamine kinase activity(GO:0004305) |
| 0.0 | 0.3 | GO:0017002 | activin-activated receptor activity(GO:0017002) |
| 0.0 | 0.3 | GO:0043184 | vascular endothelial growth factor receptor 2 binding(GO:0043184) |
| 0.0 | 0.3 | GO:0004322 | ferroxidase activity(GO:0004322) oxidoreductase activity, oxidizing metal ions, oxygen as acceptor(GO:0016724) |
| 0.0 | 1.4 | GO:0032452 | histone demethylase activity(GO:0032452) |
| 0.0 | 0.3 | GO:0015288 | porin activity(GO:0015288) |
| 0.0 | 2.5 | GO:0034212 | peptide N-acetyltransferase activity(GO:0034212) |
| 0.0 | 1.2 | GO:0005123 | death receptor binding(GO:0005123) |
| 0.0 | 0.6 | GO:0004707 | MAP kinase activity(GO:0004707) |
| 0.0 | 0.2 | GO:1990405 | protein antigen binding(GO:1990405) |
| 0.0 | 0.6 | GO:0008301 | DNA binding, bending(GO:0008301) |
| 0.0 | 0.6 | GO:0000062 | fatty-acyl-CoA binding(GO:0000062) |
| 0.0 | 0.7 | GO:0034237 | protein kinase A regulatory subunit binding(GO:0034237) |
| 0.0 | 0.6 | GO:0050811 | GABA receptor binding(GO:0050811) |
| 0.0 | 0.3 | GO:0004972 | NMDA glutamate receptor activity(GO:0004972) |
| 0.0 | 0.5 | GO:0008353 | RNA polymerase II carboxy-terminal domain kinase activity(GO:0008353) |
| 0.0 | 0.3 | GO:0046920 | alpha-(1->3)-fucosyltransferase activity(GO:0046920) |
| 0.0 | 2.0 | GO:0004004 | ATP-dependent RNA helicase activity(GO:0004004) |
| 0.0 | 0.3 | GO:0015386 | potassium:proton antiporter activity(GO:0015386) |
| 0.0 | 0.5 | GO:0017049 | GTP-Rho binding(GO:0017049) |
| 0.0 | 0.3 | GO:0005381 | iron ion transmembrane transporter activity(GO:0005381) |
| 0.0 | 0.4 | GO:0015929 | hexosaminidase activity(GO:0015929) |
| 0.0 | 0.3 | GO:0019531 | oxalate transmembrane transporter activity(GO:0019531) |
| 0.0 | 0.4 | GO:0051400 | BH domain binding(GO:0051400) |
| 0.0 | 0.8 | GO:0004702 | receptor signaling protein serine/threonine kinase activity(GO:0004702) |
| 0.0 | 0.4 | GO:0035256 | G-protein coupled glutamate receptor binding(GO:0035256) |
| 0.0 | 0.1 | GO:0016936 | galactoside binding(GO:0016936) |
| 0.0 | 0.8 | GO:0004115 | 3',5'-cyclic-AMP phosphodiesterase activity(GO:0004115) |
| 0.0 | 0.3 | GO:0034452 | dynactin binding(GO:0034452) |
| 0.0 | 1.4 | GO:0019003 | GDP binding(GO:0019003) |
| 0.0 | 0.2 | GO:0004723 | calcium-dependent protein serine/threonine phosphatase activity(GO:0004723) |
| 0.0 | 0.1 | GO:1990247 | N6-methyladenosine-containing RNA binding(GO:1990247) |
| 0.0 | 0.2 | GO:0004579 | dolichyl-diphosphooligosaccharide-protein glycotransferase activity(GO:0004579) |
| 0.0 | 1.7 | GO:0005070 | SH3/SH2 adaptor activity(GO:0005070) |
| 0.0 | 0.6 | GO:0031624 | ubiquitin conjugating enzyme binding(GO:0031624) |
| 0.0 | 0.6 | GO:0008536 | Ran GTPase binding(GO:0008536) |
| 0.0 | 1.1 | GO:0004407 | histone deacetylase activity(GO:0004407) |
| 0.0 | 0.1 | GO:0070087 | chromo shadow domain binding(GO:0070087) |
| 0.0 | 0.7 | GO:0001205 | transcriptional activator activity, RNA polymerase II distal enhancer sequence-specific binding(GO:0001205) |
| 0.0 | 0.1 | GO:0016807 | cysteine-type carboxypeptidase activity(GO:0016807) cysteine-type exopeptidase activity(GO:0070004) |
Gene overrepresentation in curated gene sets: canonical pathways category:
| Log-likelihood per target | Total log-likelihood | Term | Description |
|---|---|---|---|
| 0.1 | 3.2 | PID INSULIN GLUCOSE PATHWAY | Insulin-mediated glucose transport |
| 0.1 | 1.4 | SA PROGRAMMED CELL DEATH | Programmed cell death, or apoptosis, eliminates damaged or unneeded cells. |
| 0.0 | 1.0 | PID THROMBIN PAR4 PATHWAY | PAR4-mediated thrombin signaling events |
| 0.0 | 2.5 | PID IL2 STAT5 PATHWAY | IL2 signaling events mediated by STAT5 |
| 0.0 | 2.1 | PID SMAD2 3PATHWAY | Regulation of cytoplasmic and nuclear SMAD2/3 signaling |
| 0.0 | 5.0 | PID TCR PATHWAY | TCR signaling in naïve CD4+ T cells |
| 0.0 | 3.6 | PID P53 REGULATION PATHWAY | p53 pathway |
| 0.0 | 1.8 | PID NCADHERIN PATHWAY | N-cadherin signaling events |
| 0.0 | 1.0 | PID MYC PATHWAY | C-MYC pathway |
| 0.0 | 0.3 | ST JAK STAT PATHWAY | Jak-STAT Pathway |
| 0.0 | 0.9 | PID P38 MKK3 6PATHWAY | p38 MAPK signaling pathway |
| 0.0 | 1.2 | PID MAPK TRK PATHWAY | Trk receptor signaling mediated by the MAPK pathway |
| 0.0 | 0.3 | PID ALK1 PATHWAY | ALK1 signaling events |
| 0.0 | 1.0 | PID MTOR 4PATHWAY | mTOR signaling pathway |
| 0.0 | 1.1 | PID HES HEY PATHWAY | Notch-mediated HES/HEY network |
| 0.0 | 2.0 | PID MYC ACTIV PATHWAY | Validated targets of C-MYC transcriptional activation |
| 0.0 | 0.7 | PID CD40 PATHWAY | CD40/CD40L signaling |
| 0.0 | 2.7 | PID BETA CATENIN NUC PATHWAY | Regulation of nuclear beta catenin signaling and target gene transcription |
| 0.0 | 0.8 | PID PS1 PATHWAY | Presenilin action in Notch and Wnt signaling |
| 0.0 | 1.5 | PID MET PATHWAY | Signaling events mediated by Hepatocyte Growth Factor Receptor (c-Met) |
| 0.0 | 0.4 | ST JNK MAPK PATHWAY | JNK MAPK Pathway |
| 0.0 | 0.2 | SA B CELL RECEPTOR COMPLEXES | Antigen binding to B cell receptors activates protein tyrosine kinases, such as the Src family, which ultimate activate MAP kinases. |
| 0.0 | 0.9 | PID ERBB4 PATHWAY | ErbB4 signaling events |
Gene overrepresentation in curated gene sets: REACTOME pathways category:
| Log-likelihood per target | Total log-likelihood | Term | Description |
|---|---|---|---|
| 0.1 | 1.3 | REACTOME ENDOSOMAL VACUOLAR PATHWAY | Genes involved in Endosomal/Vacuolar pathway |
| 0.1 | 1.0 | REACTOME APOBEC3G MEDIATED RESISTANCE TO HIV1 INFECTION | Genes involved in APOBEC3G mediated resistance to HIV-1 infection |
| 0.1 | 0.5 | REACTOME TRAF6 MEDIATED NFKB ACTIVATION | Genes involved in TRAF6 mediated NF-kB activation |
| 0.1 | 1.4 | REACTOME TRAF3 DEPENDENT IRF ACTIVATION PATHWAY | Genes involved in TRAF3-dependent IRF activation pathway |
| 0.1 | 2.2 | REACTOME ACTIVATED AMPK STIMULATES FATTY ACID OXIDATION IN MUSCLE | Genes involved in Activated AMPK stimulates fatty-acid oxidation in muscle |
| 0.1 | 1.5 | REACTOME ACTIVATION OF BH3 ONLY PROTEINS | Genes involved in Activation of BH3-only proteins |
| 0.1 | 1.8 | REACTOME CTNNB1 PHOSPHORYLATION CASCADE | Genes involved in Beta-catenin phosphorylation cascade |
| 0.0 | 2.1 | REACTOME DOWNSTREAM TCR SIGNALING | Genes involved in Downstream TCR signaling |
| 0.0 | 0.6 | REACTOME THROMBOXANE SIGNALLING THROUGH TP RECEPTOR | Genes involved in Thromboxane signalling through TP receptor |
| 0.0 | 0.3 | REACTOME INHIBITION OF REPLICATION INITIATION OF DAMAGED DNA BY RB1 E2F1 | Genes involved in Inhibition of replication initiation of damaged DNA by RB1/E2F1 |
| 0.0 | 0.5 | REACTOME SYNTHESIS SECRETION AND DEACYLATION OF GHRELIN | Genes involved in Synthesis, Secretion, and Deacylation of Ghrelin |
| 0.0 | 1.1 | REACTOME PHOSPHORYLATION OF CD3 AND TCR ZETA CHAINS | Genes involved in Phosphorylation of CD3 and TCR zeta chains |
| 0.0 | 2.0 | REACTOME INHIBITION OF VOLTAGE GATED CA2 CHANNELS VIA GBETA GAMMA SUBUNITS | Genes involved in Inhibition of voltage gated Ca2+ channels via Gbeta/gamma subunits |
| 0.0 | 2.2 | REACTOME G1 PHASE | Genes involved in G1 Phase |
| 0.0 | 1.6 | REACTOME REGULATION OF GLUCOKINASE BY GLUCOKINASE REGULATORY PROTEIN | Genes involved in Regulation of Glucokinase by Glucokinase Regulatory Protein |
| 0.0 | 0.4 | REACTOME RAF MAP KINASE CASCADE | Genes involved in RAF/MAP kinase cascade |
| 0.0 | 0.3 | REACTOME REGULATED PROTEOLYSIS OF P75NTR | Genes involved in Regulated proteolysis of p75NTR |
| 0.0 | 0.7 | REACTOME SIGNALING BY NODAL | Genes involved in Signaling by NODAL |
| 0.0 | 0.6 | REACTOME DESTABILIZATION OF MRNA BY TRISTETRAPROLIN TTP | Genes involved in Destabilization of mRNA by Tristetraprolin (TTP) |
| 0.0 | 0.8 | REACTOME CD28 DEPENDENT VAV1 PATHWAY | Genes involved in CD28 dependent Vav1 pathway |
| 0.0 | 1.8 | REACTOME PRE NOTCH EXPRESSION AND PROCESSING | Genes involved in Pre-NOTCH Expression and Processing |
| 0.0 | 0.7 | REACTOME HORMONE SENSITIVE LIPASE HSL MEDIATED TRIACYLGLYCEROL HYDROLYSIS | Genes involved in Hormone-sensitive lipase (HSL)-mediated triacylglycerol hydrolysis |
| 0.0 | 0.8 | REACTOME SYNTHESIS SECRETION AND INACTIVATION OF GIP | Genes involved in Synthesis, Secretion, and Inactivation of Glucose-dependent Insulinotropic Polypeptide (GIP) |
| 0.0 | 1.2 | REACTOME DOWNREGULATION OF SMAD2 3 SMAD4 TRANSCRIPTIONAL ACTIVITY | Genes involved in Downregulation of SMAD2/3:SMAD4 transcriptional activity |
| 0.0 | 0.1 | REACTOME IRAK1 RECRUITS IKK COMPLEX | Genes involved in IRAK1 recruits IKK complex |
| 0.0 | 0.4 | REACTOME REGULATION OF PYRUVATE DEHYDROGENASE PDH COMPLEX | Genes involved in Regulation of pyruvate dehydrogenase (PDH) complex |
| 0.0 | 1.3 | REACTOME CA DEPENDENT EVENTS | Genes involved in Ca-dependent events |
| 0.0 | 0.8 | REACTOME GABA A RECEPTOR ACTIVATION | Genes involved in GABA A receptor activation |
| 0.0 | 1.5 | REACTOME MYOGENESIS | Genes involved in Myogenesis |
| 0.0 | 0.9 | REACTOME COLLAGEN FORMATION | Genes involved in Collagen formation |
| 0.0 | 0.7 | REACTOME CGMP EFFECTS | Genes involved in cGMP effects |
| 0.0 | 0.5 | REACTOME SHC1 EVENTS IN ERBB4 SIGNALING | Genes involved in SHC1 events in ERBB4 signaling |
| 0.0 | 0.1 | REACTOME TRANSPORT OF MATURE MRNA DERIVED FROM AN INTRONLESS TRANSCRIPT | Genes involved in Transport of Mature mRNA Derived from an Intronless Transcript |
| 0.0 | 0.3 | REACTOME N GLYCAN TRIMMING IN THE ER AND CALNEXIN CALRETICULIN CYCLE | Genes involved in N-glycan trimming in the ER and Calnexin/Calreticulin cycle |
| 0.0 | 0.3 | REACTOME REGULATION OF IFNG SIGNALING | Genes involved in Regulation of IFNG signaling |
| 0.0 | 0.7 | REACTOME GABA SYNTHESIS RELEASE REUPTAKE AND DEGRADATION | Genes involved in GABA synthesis, release, reuptake and degradation |
| 0.0 | 0.5 | REACTOME SYNTHESIS OF PA | Genes involved in Synthesis of PA |
| 0.0 | 0.5 | REACTOME CIRCADIAN REPRESSION OF EXPRESSION BY REV ERBA | Genes involved in Circadian Repression of Expression by REV-ERBA |
| 0.0 | 0.4 | REACTOME GRB2 SOS PROVIDES LINKAGE TO MAPK SIGNALING FOR INTERGRINS | Genes involved in GRB2:SOS provides linkage to MAPK signaling for Intergrins |
| 0.0 | 0.5 | REACTOME EGFR DOWNREGULATION | Genes involved in EGFR downregulation |