Project
Illumina Body Map 2 (GSE30611)
Navigation
Downloads
Results for UCACAUU
Z-value: 0.66
Motif logo

miRNA associated with seed UCACAUU
| Name | miRBASE accession |
|---|---|
|
hsa-miR-130a-5p
|
MIMAT0004593 |
|
hsa-miR-23a-3p
|
MIMAT0000078 |
|
hsa-miR-23b-3p
|
MIMAT0000418 |
|
hsa-miR-23c
|
MIMAT0018000 |
Activity profile of UCACAUU motif
Sorted Z-values of UCACAUU motif
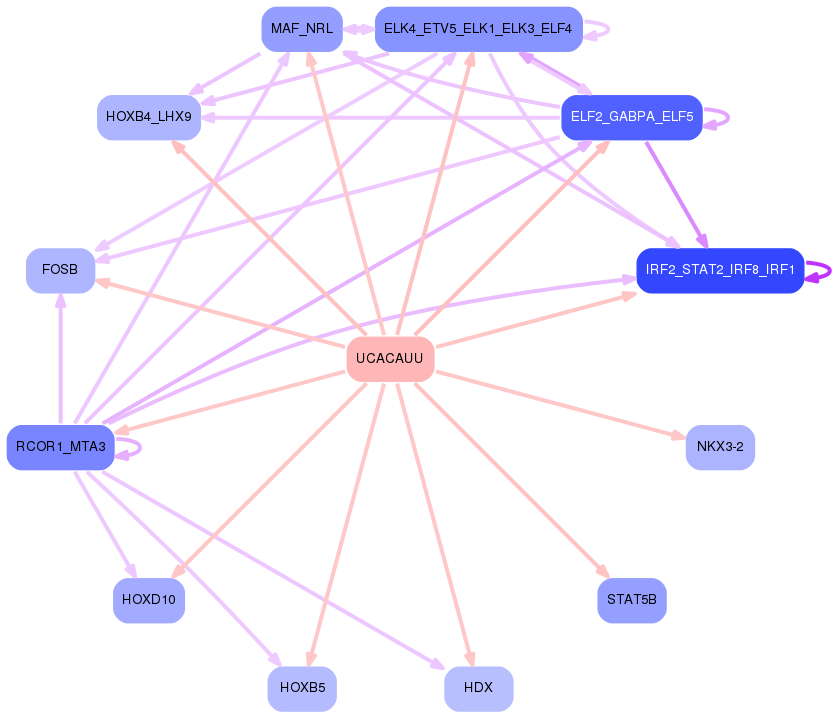
Network of associatons between targets according to the STRING database.

First level regulatory network of UCACAUU
Gene Ontology Analysis
Gene overrepresentation in biological process category:
| Log-likelihood per target | Total log-likelihood | Term | Description |
|---|---|---|---|
| 0.5 | 1.4 | GO:2000417 | negative regulation of eosinophil migration(GO:2000417) |
| 0.4 | 1.1 | GO:0060434 | bronchus morphogenesis(GO:0060434) |
| 0.3 | 0.8 | GO:0045643 | regulation of eosinophil differentiation(GO:0045643) positive regulation of eosinophil differentiation(GO:0045645) |
| 0.2 | 1.0 | GO:0032811 | negative regulation of epinephrine secretion(GO:0032811) epidermal growth factor-activated receptor transactivation by G-protein coupled receptor signaling pathway(GO:0035625) |
| 0.2 | 0.8 | GO:0060024 | rhythmic synaptic transmission(GO:0060024) negative regulation of ribosome biogenesis(GO:0090071) positive regulation of TRAIL-activated apoptotic signaling pathway(GO:1903984) |
| 0.2 | 0.9 | GO:0007181 | transforming growth factor beta receptor complex assembly(GO:0007181) |
| 0.1 | 0.5 | GO:0044691 | tooth eruption(GO:0044691) |
| 0.1 | 0.4 | GO:0031247 | actin rod assembly(GO:0031247) |
| 0.1 | 0.4 | GO:0034970 | histone H3-R2 methylation(GO:0034970) |
| 0.1 | 0.5 | GO:1901165 | positive regulation of trophoblast cell migration(GO:1901165) |
| 0.1 | 0.3 | GO:1901383 | negative regulation of chorionic trophoblast cell proliferation(GO:1901383) |
| 0.1 | 0.3 | GO:1901874 | negative regulation of post-translational protein modification(GO:1901874) |
| 0.1 | 0.3 | GO:0071962 | mitotic sister chromatid cohesion, centromeric(GO:0071962) |
| 0.1 | 0.4 | GO:0046379 | extracellular polysaccharide biosynthetic process(GO:0045226) extracellular polysaccharide metabolic process(GO:0046379) |
| 0.1 | 0.3 | GO:1902309 | negative regulation of peptidyl-serine dephosphorylation(GO:1902309) |
| 0.1 | 0.3 | GO:2000118 | regulation of sodium-dependent phosphate transport(GO:2000118) |
| 0.1 | 0.9 | GO:0001712 | ectodermal cell fate commitment(GO:0001712) |
| 0.1 | 0.6 | GO:0045588 | positive regulation of gamma-delta T cell differentiation(GO:0045588) |
| 0.1 | 0.3 | GO:1903031 | regulation of microtubule plus-end binding(GO:1903031) positive regulation of microtubule plus-end binding(GO:1903033) |
| 0.1 | 0.3 | GO:1904017 | cellular response to Thyroglobulin triiodothyronine(GO:1904017) |
| 0.1 | 1.0 | GO:0048539 | bone marrow development(GO:0048539) |
| 0.1 | 0.2 | GO:1990654 | sebum secreting cell proliferation(GO:1990654) |
| 0.1 | 0.2 | GO:0006597 | spermine biosynthetic process(GO:0006597) |
| 0.1 | 0.2 | GO:0042660 | positive regulation of cell fate specification(GO:0042660) |
| 0.1 | 0.4 | GO:0060938 | cardiac fibroblast cell differentiation(GO:0060935) cardiac fibroblast cell development(GO:0060936) epicardium-derived cardiac fibroblast cell differentiation(GO:0060938) epicardium-derived cardiac fibroblast cell development(GO:0060939) |
| 0.1 | 1.3 | GO:0006265 | DNA topological change(GO:0006265) |
| 0.1 | 0.2 | GO:0050720 | interleukin-1 beta biosynthetic process(GO:0050720) |
| 0.1 | 0.7 | GO:0031087 | deadenylation-independent decapping of nuclear-transcribed mRNA(GO:0031087) |
| 0.1 | 0.1 | GO:1901382 | chorionic trophoblast cell proliferation(GO:0097360) regulation of chorionic trophoblast cell proliferation(GO:1901382) |
| 0.1 | 0.3 | GO:0002408 | myeloid dendritic cell chemotaxis(GO:0002408) |
| 0.1 | 0.3 | GO:0052229 | multi-organism catabolic process(GO:0044035) development of symbiont involved in interaction with host(GO:0044115) modulation of development of symbiont involved in interaction with host(GO:0044145) negative regulation of development of symbiont involved in interaction with host(GO:0044147) metabolism of substance in other organism involved in symbiotic interaction(GO:0052214) catabolism of substance in other organism involved in symbiotic interaction(GO:0052227) metabolism of macromolecule in other organism involved in symbiotic interaction(GO:0052229) catabolism by host of symbiont macromolecule(GO:0052360) catabolism by organism of macromolecule in other organism involved in symbiotic interaction(GO:0052361) catabolism by host of symbiont protein(GO:0052362) catabolism by organism of protein in other organism involved in symbiotic interaction(GO:0052363) catabolism by host of substance in symbiont(GO:0052364) metabolism by host of symbiont macromolecule(GO:0052416) metabolism by host of symbiont protein(GO:0052417) metabolism by organism of protein in other organism involved in symbiotic interaction(GO:0052418) metabolism by host of substance in symbiont(GO:0052419) |
| 0.1 | 0.8 | GO:0010606 | positive regulation of cytoplasmic mRNA processing body assembly(GO:0010606) |
| 0.1 | 0.4 | GO:0034124 | regulation of MyD88-dependent toll-like receptor signaling pathway(GO:0034124) |
| 0.1 | 0.2 | GO:0032304 | negative regulation of icosanoid secretion(GO:0032304) |
| 0.1 | 0.2 | GO:0044725 | chromatin reprogramming in the zygote(GO:0044725) |
| 0.1 | 1.3 | GO:0002158 | osteoclast proliferation(GO:0002158) |
| 0.1 | 1.1 | GO:0007221 | positive regulation of transcription of Notch receptor target(GO:0007221) |
| 0.1 | 0.2 | GO:0060741 | prostate gland stromal morphogenesis(GO:0060741) |
| 0.1 | 0.3 | GO:0044339 | canonical Wnt signaling pathway involved in osteoblast differentiation(GO:0044339) |
| 0.1 | 0.2 | GO:0061443 | endocardial cushion cell differentiation(GO:0061443) |
| 0.1 | 1.4 | GO:0030322 | stabilization of membrane potential(GO:0030322) |
| 0.1 | 0.2 | GO:0043321 | regulation of natural killer cell degranulation(GO:0043321) positive regulation of natural killer cell degranulation(GO:0043323) |
| 0.0 | 0.5 | GO:0001866 | NK T cell proliferation(GO:0001866) |
| 0.0 | 0.3 | GO:1903553 | positive regulation of extracellular exosome assembly(GO:1903553) |
| 0.0 | 0.6 | GO:0034285 | response to sucrose(GO:0009744) response to disaccharide(GO:0034285) |
| 0.0 | 0.5 | GO:0035694 | mitochondrial protein catabolic process(GO:0035694) |
| 0.0 | 0.2 | GO:0002636 | positive regulation of germinal center formation(GO:0002636) |
| 0.0 | 0.1 | GO:0006097 | glyoxylate cycle(GO:0006097) |
| 0.0 | 0.2 | GO:0010260 | organ senescence(GO:0010260) |
| 0.0 | 0.6 | GO:0048280 | vesicle fusion with Golgi apparatus(GO:0048280) |
| 0.0 | 1.2 | GO:0030208 | dermatan sulfate biosynthetic process(GO:0030208) |
| 0.0 | 0.1 | GO:0061300 | cerebellum vasculature development(GO:0061300) |
| 0.0 | 0.0 | GO:1990785 | response to water-immersion restraint stress(GO:1990785) |
| 0.0 | 0.1 | GO:0090526 | regulation of gluconeogenesis involved in cellular glucose homeostasis(GO:0090526) |
| 0.0 | 0.4 | GO:0033088 | negative regulation of immature T cell proliferation in thymus(GO:0033088) |
| 0.0 | 0.2 | GO:0035574 | histone H4-K20 demethylation(GO:0035574) |
| 0.0 | 0.2 | GO:0060800 | regulation of cell differentiation involved in embryonic placenta development(GO:0060800) |
| 0.0 | 0.2 | GO:0072734 | response to staurosporine(GO:0072733) cellular response to staurosporine(GO:0072734) |
| 0.0 | 0.4 | GO:0090204 | protein localization to nuclear pore(GO:0090204) |
| 0.0 | 0.2 | GO:1904566 | response to 1-oleoyl-sn-glycerol 3-phosphate(GO:1904565) cellular response to 1-oleoyl-sn-glycerol 3-phosphate(GO:1904566) |
| 0.0 | 0.3 | GO:0097527 | necroptotic signaling pathway(GO:0097527) |
| 0.0 | 0.1 | GO:1902269 | positive regulation of polyamine transmembrane transport(GO:1902269) |
| 0.0 | 0.2 | GO:0018242 | protein O-linked glycosylation via serine(GO:0018242) |
| 0.0 | 0.1 | GO:0060876 | semicircular canal formation(GO:0060876) |
| 0.0 | 0.1 | GO:1903527 | positive regulation of membrane tubulation(GO:1903527) |
| 0.0 | 0.2 | GO:0051135 | regulation of NK T cell activation(GO:0051133) positive regulation of NK T cell activation(GO:0051135) |
| 0.0 | 0.3 | GO:0043951 | negative regulation of cAMP-mediated signaling(GO:0043951) |
| 0.0 | 0.1 | GO:0016094 | polyprenol biosynthetic process(GO:0016094) |
| 0.0 | 0.3 | GO:0007217 | tachykinin receptor signaling pathway(GO:0007217) |
| 0.0 | 0.5 | GO:0021520 | spinal cord motor neuron cell fate specification(GO:0021520) |
| 0.0 | 0.2 | GO:0015014 | heparan sulfate proteoglycan biosynthetic process, polysaccharide chain biosynthetic process(GO:0015014) |
| 0.0 | 0.1 | GO:0070634 | transepithelial ammonium transport(GO:0070634) |
| 0.0 | 0.1 | GO:0071557 | histone H3-K27 demethylation(GO:0071557) |
| 0.0 | 0.1 | GO:1903615 | regulation of protein tyrosine phosphatase activity(GO:1903613) positive regulation of protein tyrosine phosphatase activity(GO:1903615) |
| 0.0 | 0.1 | GO:0070966 | nuclear-transcribed mRNA catabolic process, no-go decay(GO:0070966) |
| 0.0 | 0.1 | GO:1903181 | regulation of dopamine biosynthetic process(GO:1903179) positive regulation of dopamine biosynthetic process(GO:1903181) |
| 0.0 | 0.1 | GO:0051461 | positive regulation of corticotropin secretion(GO:0051461) |
| 0.0 | 0.3 | GO:0048194 | Golgi vesicle budding(GO:0048194) |
| 0.0 | 0.3 | GO:1903715 | regulation of aerobic respiration(GO:1903715) |
| 0.0 | 0.3 | GO:0001672 | regulation of chromatin assembly or disassembly(GO:0001672) |
| 0.0 | 0.1 | GO:0070901 | mitochondrial tRNA methylation(GO:0070901) |
| 0.0 | 1.4 | GO:0007257 | activation of JUN kinase activity(GO:0007257) |
| 0.0 | 0.3 | GO:0019367 | fatty acid elongation, saturated fatty acid(GO:0019367) fatty acid elongation, unsaturated fatty acid(GO:0019368) fatty acid elongation, monounsaturated fatty acid(GO:0034625) fatty acid elongation, polyunsaturated fatty acid(GO:0034626) |
| 0.0 | 0.2 | GO:1900041 | negative regulation of interleukin-2 secretion(GO:1900041) |
| 0.0 | 0.7 | GO:0032486 | Rap protein signal transduction(GO:0032486) |
| 0.0 | 0.1 | GO:0050653 | chondroitin sulfate proteoglycan biosynthetic process, polysaccharide chain biosynthetic process(GO:0050653) |
| 0.0 | 0.1 | GO:1904211 | membrane protein proteolysis involved in retrograde protein transport, ER to cytosol(GO:1904211) |
| 0.0 | 0.1 | GO:0043686 | co-translational protein modification(GO:0043686) |
| 0.0 | 0.1 | GO:0006177 | GMP biosynthetic process(GO:0006177) |
| 0.0 | 0.2 | GO:1902741 | interferon-alpha secretion(GO:0072642) regulation of interferon-alpha secretion(GO:1902739) positive regulation of interferon-alpha secretion(GO:1902741) |
| 0.0 | 0.3 | GO:0060576 | intestinal epithelial cell development(GO:0060576) |
| 0.0 | 0.2 | GO:1900113 | negative regulation of histone H3-K9 trimethylation(GO:1900113) |
| 0.0 | 0.2 | GO:0035583 | sequestering of TGFbeta in extracellular matrix(GO:0035583) |
| 0.0 | 0.1 | GO:0090156 | cellular sphingolipid homeostasis(GO:0090156) |
| 0.0 | 0.1 | GO:0006043 | glucosamine catabolic process(GO:0006043) |
| 0.0 | 0.1 | GO:1902962 | regulation of metalloendopeptidase activity involved in amyloid precursor protein catabolic process(GO:1902962) negative regulation of metalloendopeptidase activity involved in amyloid precursor protein catabolic process(GO:1902963) |
| 0.0 | 0.1 | GO:0006864 | pyrimidine nucleotide transport(GO:0006864) mitochondrial pyrimidine nucleotide import(GO:1990519) |
| 0.0 | 0.1 | GO:2001271 | negative regulation of cysteine-type endopeptidase activity involved in execution phase of apoptosis(GO:2001271) |
| 0.0 | 0.2 | GO:0018401 | peptidyl-proline hydroxylation to 4-hydroxy-L-proline(GO:0018401) |
| 0.0 | 0.1 | GO:0051088 | PMA-inducible membrane protein ectodomain proteolysis(GO:0051088) |
| 0.0 | 0.2 | GO:0034723 | DNA replication-dependent nucleosome assembly(GO:0006335) negative regulation of chromatin silencing(GO:0031936) DNA replication-dependent nucleosome organization(GO:0034723) |
| 0.0 | 0.2 | GO:0071798 | response to prostaglandin D(GO:0071798) cellular response to prostaglandin D stimulus(GO:0071799) |
| 0.0 | 0.3 | GO:0001778 | plasma membrane repair(GO:0001778) |
| 0.0 | 0.1 | GO:0033037 | polysaccharide localization(GO:0033037) |
| 0.0 | 0.1 | GO:2000687 | negative regulation of rubidium ion transport(GO:2000681) negative regulation of rubidium ion transmembrane transporter activity(GO:2000687) |
| 0.0 | 0.2 | GO:0002051 | osteoblast fate commitment(GO:0002051) |
| 0.0 | 0.2 | GO:0060449 | bud elongation involved in lung branching(GO:0060449) |
| 0.0 | 0.3 | GO:0038203 | TORC2 signaling(GO:0038203) |
| 0.0 | 0.4 | GO:0043619 | regulation of transcription from RNA polymerase II promoter in response to oxidative stress(GO:0043619) |
| 0.0 | 0.3 | GO:0030206 | chondroitin sulfate biosynthetic process(GO:0030206) |
| 0.0 | 0.2 | GO:0010040 | response to iron(II) ion(GO:0010040) |
| 0.0 | 0.1 | GO:1901254 | modulation by host of viral RNA genome replication(GO:0044830) positive regulation of intracellular transport of viral material(GO:1901254) |
| 0.0 | 0.3 | GO:0060707 | trophoblast giant cell differentiation(GO:0060707) |
| 0.0 | 0.5 | GO:0010172 | embryonic body morphogenesis(GO:0010172) |
| 0.0 | 2.0 | GO:0071260 | cellular response to mechanical stimulus(GO:0071260) |
| 0.0 | 0.2 | GO:0042373 | vitamin K metabolic process(GO:0042373) |
| 0.0 | 0.2 | GO:1903608 | protein localization to cytoplasmic stress granule(GO:1903608) |
| 0.0 | 0.1 | GO:0061087 | positive regulation of histone H3-K27 methylation(GO:0061087) |
| 0.0 | 0.2 | GO:1904379 | protein localization to cytosolic proteasome complex(GO:1904327) protein localization to cytosolic proteasome complex involved in ERAD pathway(GO:1904379) |
| 0.0 | 0.1 | GO:0061767 | negative regulation of lung blood pressure(GO:0061767) |
| 0.0 | 0.5 | GO:0042744 | hydrogen peroxide catabolic process(GO:0042744) |
| 0.0 | 0.3 | GO:0043983 | histone H4-K12 acetylation(GO:0043983) |
| 0.0 | 0.2 | GO:0010739 | positive regulation of protein kinase A signaling(GO:0010739) |
| 0.0 | 0.1 | GO:0002329 | pre-B cell differentiation(GO:0002329) |
| 0.0 | 0.1 | GO:0034141 | positive regulation of toll-like receptor 3 signaling pathway(GO:0034141) |
| 0.0 | 0.2 | GO:0035562 | negative regulation of chromatin binding(GO:0035562) |
| 0.0 | 0.2 | GO:0098582 | innate vocalization behavior(GO:0098582) |
| 0.0 | 0.0 | GO:0097198 | histone H3-K36 trimethylation(GO:0097198) |
| 0.0 | 0.1 | GO:1903826 | arginine transmembrane transport(GO:1903826) |
| 0.0 | 0.1 | GO:2000270 | negative regulation of fibroblast apoptotic process(GO:2000270) |
| 0.0 | 0.0 | GO:0019046 | release from viral latency(GO:0019046) regulation of DNA strand elongation(GO:0060382) |
| 0.0 | 0.3 | GO:0043517 | positive regulation of DNA damage response, signal transduction by p53 class mediator(GO:0043517) |
| 0.0 | 0.0 | GO:0061312 | BMP signaling pathway involved in heart development(GO:0061312) |
| 0.0 | 0.1 | GO:0046092 | deoxycytidine metabolic process(GO:0046092) |
| 0.0 | 0.2 | GO:0070934 | CRD-mediated mRNA stabilization(GO:0070934) |
| 0.0 | 0.1 | GO:0016139 | glycoside catabolic process(GO:0016139) |
| 0.0 | 0.3 | GO:0070933 | histone H4 deacetylation(GO:0070933) |
| 0.0 | 0.1 | GO:0007089 | traversing start control point of mitotic cell cycle(GO:0007089) response to vasopressin(GO:1904116) cellular response to vasopressin(GO:1904117) |
| 0.0 | 0.1 | GO:0097680 | double-strand break repair via classical nonhomologous end joining(GO:0097680) |
| 0.0 | 0.1 | GO:0042905 | 9-cis-retinoic acid biosynthetic process(GO:0042904) 9-cis-retinoic acid metabolic process(GO:0042905) |
| 0.0 | 0.4 | GO:0051412 | response to corticosterone(GO:0051412) |
| 0.0 | 0.4 | GO:1904886 | beta-catenin destruction complex disassembly(GO:1904886) |
| 0.0 | 0.1 | GO:0002318 | myeloid progenitor cell differentiation(GO:0002318) |
| 0.0 | 0.2 | GO:0036148 | phosphatidylglycerol acyl-chain remodeling(GO:0036148) |
| 0.0 | 0.2 | GO:0045945 | urea cycle(GO:0000050) positive regulation of transcription from RNA polymerase III promoter(GO:0045945) |
| 0.0 | 0.0 | GO:1904806 | regulation of protein oxidation(GO:1904806) positive regulation of protein oxidation(GO:1904808) |
| 0.0 | 0.1 | GO:0005981 | regulation of glycogen catabolic process(GO:0005981) |
Gene overrepresentation in cellular component category:
| Log-likelihood per target | Total log-likelihood | Term | Description |
|---|---|---|---|
| 0.1 | 1.1 | GO:0070022 | transforming growth factor beta receptor homodimeric complex(GO:0070022) |
| 0.1 | 0.9 | GO:0034673 | inhibin-betaglycan-ActRII complex(GO:0034673) |
| 0.1 | 0.3 | GO:0048179 | activin receptor complex(GO:0048179) |
| 0.1 | 1.0 | GO:0035749 | myelin sheath adaxonal region(GO:0035749) |
| 0.1 | 0.7 | GO:0031298 | replication fork protection complex(GO:0031298) |
| 0.0 | 0.2 | GO:1990851 | Wnt-Frizzled-LRP5/6 complex(GO:1990851) |
| 0.0 | 0.1 | GO:0070685 | macropinocytic cup(GO:0070685) |
| 0.0 | 0.3 | GO:0031415 | NatA complex(GO:0031415) |
| 0.0 | 0.3 | GO:0005826 | actomyosin contractile ring(GO:0005826) |
| 0.0 | 0.5 | GO:0034663 | endoplasmic reticulum chaperone complex(GO:0034663) |
| 0.0 | 0.1 | GO:0070381 | endosome to plasma membrane transport vesicle(GO:0070381) |
| 0.0 | 0.2 | GO:0097165 | nuclear stress granule(GO:0097165) |
| 0.0 | 0.1 | GO:0034665 | integrin alpha1-beta1 complex(GO:0034665) |
| 0.0 | 0.6 | GO:0032982 | myosin filament(GO:0032982) |
| 0.0 | 0.3 | GO:0030981 | cortical microtubule cytoskeleton(GO:0030981) |
| 0.0 | 0.2 | GO:0044666 | MLL3/4 complex(GO:0044666) |
| 0.0 | 0.4 | GO:0061700 | GATOR2 complex(GO:0061700) |
| 0.0 | 0.2 | GO:0072487 | MSL complex(GO:0072487) |
| 0.0 | 0.6 | GO:0030014 | CCR4-NOT complex(GO:0030014) |
| 0.0 | 0.1 | GO:1902737 | dendritic filopodium(GO:1902737) |
| 0.0 | 0.1 | GO:0042765 | GPI-anchor transamidase complex(GO:0042765) |
| 0.0 | 0.1 | GO:0035339 | SPOTS complex(GO:0035339) |
| 0.0 | 0.2 | GO:0001940 | male pronucleus(GO:0001940) |
| 0.0 | 0.1 | GO:1990604 | IRE1-TRAF2-ASK1 complex(GO:1990604) |
| 0.0 | 1.5 | GO:1904724 | tertiary granule lumen(GO:1904724) |
| 0.0 | 0.2 | GO:0044194 | cytolytic granule(GO:0044194) |
| 0.0 | 0.1 | GO:0097422 | retromer, cargo-selective complex(GO:0030906) tubular endosome(GO:0097422) |
| 0.0 | 0.4 | GO:0048188 | Set1C/COMPASS complex(GO:0048188) |
| 0.0 | 0.1 | GO:0005638 | lamin filament(GO:0005638) |
| 0.0 | 0.1 | GO:0005787 | signal peptidase complex(GO:0005787) |
| 0.0 | 0.3 | GO:0031265 | CD95 death-inducing signaling complex(GO:0031265) |
| 0.0 | 0.2 | GO:0035631 | CD40 receptor complex(GO:0035631) |
| 0.0 | 0.5 | GO:0031092 | platelet alpha granule membrane(GO:0031092) |
| 0.0 | 0.2 | GO:0071682 | endocytic vesicle lumen(GO:0071682) |
| 0.0 | 0.1 | GO:0071458 | integral component of cytoplasmic side of endoplasmic reticulum membrane(GO:0071458) |
| 0.0 | 0.4 | GO:0005721 | pericentric heterochromatin(GO:0005721) |
Gene overrepresentation in molecular function category:
| Log-likelihood per target | Total log-likelihood | Term | Description |
|---|---|---|---|
| 0.4 | 1.1 | GO:0005026 | transforming growth factor beta receptor activity, type II(GO:0005026) |
| 0.3 | 1.0 | GO:0031696 | alpha2-adrenergic receptor activity(GO:0004938) alpha-2C adrenergic receptor binding(GO:0031696) |
| 0.3 | 0.9 | GO:0070123 | transforming growth factor beta receptor activity, type III(GO:0070123) |
| 0.3 | 0.8 | GO:0051717 | inositol-1,3,4,5-tetrakisphosphate 3-phosphatase activity(GO:0051717) |
| 0.2 | 1.1 | GO:0016941 | natriuretic peptide receptor activity(GO:0016941) |
| 0.2 | 0.6 | GO:0004948 | calcitonin receptor activity(GO:0004948) |
| 0.1 | 0.6 | GO:0044378 | non-sequence-specific DNA binding, bending(GO:0044378) |
| 0.1 | 1.4 | GO:0004957 | prostaglandin E receptor activity(GO:0004957) |
| 0.1 | 0.4 | GO:0004119 | cGMP-inhibited cyclic-nucleotide phosphodiesterase activity(GO:0004119) |
| 0.1 | 0.3 | GO:0038100 | nodal binding(GO:0038100) |
| 0.1 | 0.3 | GO:0052858 | peptidyl-lysine N-acetyltransferase activity, acting on acetyl phosphate as donor(GO:0052858) |
| 0.1 | 0.3 | GO:0005137 | interleukin-5 receptor binding(GO:0005137) |
| 0.1 | 0.5 | GO:0005152 | interleukin-1 receptor antagonist activity(GO:0005152) |
| 0.1 | 0.4 | GO:0035241 | protein-arginine omega-N monomethyltransferase activity(GO:0035241) |
| 0.1 | 0.7 | GO:0003917 | DNA topoisomerase type I activity(GO:0003917) |
| 0.1 | 0.4 | GO:0050501 | hyaluronan synthase activity(GO:0050501) |
| 0.1 | 0.3 | GO:0050613 | delta14-sterol reductase activity(GO:0050613) |
| 0.1 | 0.2 | GO:0030158 | protein xylosyltransferase activity(GO:0030158) |
| 0.1 | 0.2 | GO:1904928 | coreceptor activity involved in canonical Wnt signaling pathway(GO:1904928) |
| 0.1 | 0.2 | GO:0004874 | aryl hydrocarbon receptor activity(GO:0004874) |
| 0.1 | 0.2 | GO:0004958 | prostaglandin F receptor activity(GO:0004958) |
| 0.1 | 0.2 | GO:0030350 | iron-responsive element binding(GO:0030350) |
| 0.1 | 0.3 | GO:0047696 | beta-adrenergic receptor kinase activity(GO:0047696) |
| 0.1 | 1.4 | GO:0022841 | potassium ion leak channel activity(GO:0022841) |
| 0.1 | 0.2 | GO:0008384 | IkappaB kinase activity(GO:0008384) |
| 0.0 | 1.3 | GO:0030957 | Tat protein binding(GO:0030957) |
| 0.0 | 0.1 | GO:0033142 | progesterone receptor binding(GO:0033142) |
| 0.0 | 0.1 | GO:0050509 | N-acetylglucosaminyl-proteoglycan 4-beta-glucuronosyltransferase activity(GO:0050509) |
| 0.0 | 0.2 | GO:0051765 | inositol tetrakisphosphate kinase activity(GO:0051765) |
| 0.0 | 0.1 | GO:0004450 | isocitrate dehydrogenase (NADP+) activity(GO:0004450) (R)-2-hydroxyglutarate dehydrogenase activity(GO:0051990) |
| 0.0 | 0.8 | GO:0055106 | ubiquitin-protein transferase regulator activity(GO:0055106) |
| 0.0 | 0.2 | GO:0070579 | methylcytosine dioxygenase activity(GO:0070579) |
| 0.0 | 0.2 | GO:0035575 | histone demethylase activity (H4-K20 specific)(GO:0035575) |
| 0.0 | 0.3 | GO:0043120 | tumor necrosis factor binding(GO:0043120) |
| 0.0 | 0.2 | GO:0032422 | purine-rich negative regulatory element binding(GO:0032422) |
| 0.0 | 0.4 | GO:0019826 | oxygen sensor activity(GO:0019826) |
| 0.0 | 1.5 | GO:0004709 | MAP kinase kinase kinase activity(GO:0004709) |
| 0.0 | 0.2 | GO:0016900 | oxidoreductase activity, acting on the CH-OH group of donors, disulfide as acceptor(GO:0016900) vitamin-K-epoxide reductase (warfarin-sensitive) activity(GO:0047057) |
| 0.0 | 0.3 | GO:0019834 | phospholipase A2 inhibitor activity(GO:0019834) |
| 0.0 | 0.8 | GO:0004535 | poly(A)-specific ribonuclease activity(GO:0004535) |
| 0.0 | 0.9 | GO:0004653 | polypeptide N-acetylgalactosaminyltransferase activity(GO:0004653) |
| 0.0 | 1.3 | GO:0005540 | hyaluronic acid binding(GO:0005540) |
| 0.0 | 0.2 | GO:0050659 | N-acetylgalactosamine 4-sulfate 6-O-sulfotransferase activity(GO:0050659) |
| 0.0 | 0.4 | GO:0046790 | virion binding(GO:0046790) |
| 0.0 | 0.1 | GO:0008511 | sodium:potassium:chloride symporter activity(GO:0008511) |
| 0.0 | 0.1 | GO:0071558 | histone demethylase activity (H3-K27 specific)(GO:0071558) |
| 0.0 | 0.6 | GO:0042813 | Wnt-activated receptor activity(GO:0042813) |
| 0.0 | 0.2 | GO:0004727 | prenylated protein tyrosine phosphatase activity(GO:0004727) |
| 0.0 | 0.1 | GO:0050115 | myosin-light-chain-phosphatase activity(GO:0050115) |
| 0.0 | 0.2 | GO:0044729 | hemi-methylated DNA-binding(GO:0044729) |
| 0.0 | 0.3 | GO:0102338 | fatty acid elongase activity(GO:0009922) 3-oxo-arachidoyl-CoA synthase activity(GO:0102336) 3-oxo-cerotoyl-CoA synthase activity(GO:0102337) 3-oxo-lignoceronyl-CoA synthase activity(GO:0102338) |
| 0.0 | 0.1 | GO:0035500 | MH2 domain binding(GO:0035500) |
| 0.0 | 0.7 | GO:0035259 | glucocorticoid receptor binding(GO:0035259) |
| 0.0 | 0.2 | GO:0030023 | extracellular matrix constituent conferring elasticity(GO:0030023) |
| 0.0 | 0.1 | GO:0004342 | glucosamine-6-phosphate deaminase activity(GO:0004342) |
| 0.0 | 0.1 | GO:0015218 | pyrimidine nucleotide transmembrane transporter activity(GO:0015218) |
| 0.0 | 0.1 | GO:0016428 | tRNA (cytosine-5-)-methyltransferase activity(GO:0016428) |
| 0.0 | 0.1 | GO:0003923 | GPI-anchor transamidase activity(GO:0003923) |
| 0.0 | 0.4 | GO:0015467 | G-protein activated inward rectifier potassium channel activity(GO:0015467) |
| 0.0 | 0.1 | GO:0042978 | ornithine decarboxylase activator activity(GO:0042978) |
| 0.0 | 0.2 | GO:0047144 | 2-acylglycerol-3-phosphate O-acyltransferase activity(GO:0047144) |
| 0.0 | 0.1 | GO:0009019 | tRNA (guanine-N1-)-methyltransferase activity(GO:0009019) |
| 0.0 | 0.3 | GO:0017154 | semaphorin receptor activity(GO:0017154) |
| 0.0 | 0.1 | GO:0042328 | heparan sulfate N-acetylglucosaminyltransferase activity(GO:0042328) |
| 0.0 | 0.4 | GO:0042800 | histone methyltransferase activity (H3-K4 specific)(GO:0042800) |
| 0.0 | 0.2 | GO:0001162 | RNA polymerase II intronic transcription regulatory region sequence-specific DNA binding(GO:0001162) |
| 0.0 | 0.1 | GO:0004605 | phosphatidate cytidylyltransferase activity(GO:0004605) |
| 0.0 | 0.6 | GO:0070273 | phosphatidylinositol-4-phosphate binding(GO:0070273) |
| 0.0 | 0.1 | GO:0004305 | ethanolamine kinase activity(GO:0004305) |
| 0.0 | 0.1 | GO:0098639 | collagen binding involved in cell-matrix adhesion(GO:0098639) |
| 0.0 | 0.2 | GO:0070915 | lysophosphatidic acid receptor activity(GO:0070915) |
| 0.0 | 0.1 | GO:0070728 | leucine binding(GO:0070728) |
| 0.0 | 0.3 | GO:0061578 | Lys63-specific deubiquitinase activity(GO:0061578) |
| 0.0 | 0.1 | GO:0047237 | glucuronylgalactosylproteoglycan 4-beta-N-acetylgalactosaminyltransferase activity(GO:0047237) |
| 0.0 | 0.1 | GO:0071936 | coreceptor activity involved in Wnt signaling pathway(GO:0071936) |
| 0.0 | 0.2 | GO:0052650 | NADP-retinol dehydrogenase activity(GO:0052650) |
| 0.0 | 0.5 | GO:0005521 | lamin binding(GO:0005521) |
| 0.0 | 0.2 | GO:0051864 | histone demethylase activity (H3-K9 specific)(GO:0032454) histone demethylase activity (H3-K36 specific)(GO:0051864) |
| 0.0 | 0.4 | GO:0003756 | protein disulfide isomerase activity(GO:0003756) intramolecular oxidoreductase activity, transposing S-S bonds(GO:0016864) |
| 0.0 | 0.0 | GO:0035650 | AP-1 adaptor complex binding(GO:0035650) |
| 0.0 | 0.2 | GO:0000774 | adenyl-nucleotide exchange factor activity(GO:0000774) |
| 0.0 | 0.1 | GO:0015181 | arginine transmembrane transporter activity(GO:0015181) |
| 0.0 | 0.5 | GO:0031492 | nucleosomal DNA binding(GO:0031492) |
| 0.0 | 0.5 | GO:0004198 | calcium-dependent cysteine-type endopeptidase activity(GO:0004198) |
| 0.0 | 0.1 | GO:0004797 | deoxycytidine kinase activity(GO:0004137) thymidine kinase activity(GO:0004797) |
| 0.0 | 1.1 | GO:0019003 | GDP binding(GO:0019003) |
| 0.0 | 0.1 | GO:0016416 | O-palmitoyltransferase activity(GO:0016416) |
Gene overrepresentation in curated gene sets: canonical pathways category:
| Log-likelihood per target | Total log-likelihood | Term | Description |
|---|---|---|---|
| 0.0 | 1.1 | PID TCR JNK PATHWAY | JNK signaling in the CD4+ TCR pathway |
| 0.0 | 1.4 | PID TOLL ENDOGENOUS PATHWAY | Endogenous TLR signaling |
| 0.0 | 1.2 | SA PTEN PATHWAY | PTEN is a tumor suppressor that dephosphorylates the lipid messenger phosphatidylinositol triphosphate. |
| 0.0 | 0.6 | PID IL5 PATHWAY | IL5-mediated signaling events |
| 0.0 | 2.4 | PID TGFBR PATHWAY | TGF-beta receptor signaling |
| 0.0 | 1.7 | PID HES HEY PATHWAY | Notch-mediated HES/HEY network |
| 0.0 | 0.5 | SA CASPASE CASCADE | Apoptosis is mediated by caspases, cysteine proteases arranged in a proteolytic cascade. |
| 0.0 | 0.5 | PID WNT SIGNALING PATHWAY | Wnt signaling network |
| 0.0 | 0.6 | PID IFNG PATHWAY | IFN-gamma pathway |
| 0.0 | 0.6 | PID PRL SIGNALING EVENTS PATHWAY | Signaling events mediated by PRL |
Gene overrepresentation in curated gene sets: REACTOME pathways category:
| Log-likelihood per target | Total log-likelihood | Term | Description |
|---|---|---|---|
| 0.1 | 1.6 | REACTOME PROSTANOID LIGAND RECEPTORS | Genes involved in Prostanoid ligand receptors |
| 0.0 | 0.3 | REACTOME RECEPTOR LIGAND BINDING INITIATES THE SECOND PROTEOLYTIC CLEAVAGE OF NOTCH RECEPTOR | Genes involved in Receptor-ligand binding initiates the second proteolytic cleavage of Notch receptor |
| 0.0 | 1.2 | REACTOME NOTCH HLH TRANSCRIPTION PATHWAY | Genes involved in Notch-HLH transcription pathway |
| 0.0 | 0.8 | REACTOME NEGATIVE REGULATION OF THE PI3K AKT NETWORK | Genes involved in Negative regulation of the PI3K/AKT network |
| 0.0 | 1.2 | REACTOME CS DS DEGRADATION | Genes involved in CS/DS degradation |
| 0.0 | 1.3 | REACTOME TRAF6 MEDIATED NFKB ACTIVATION | Genes involved in TRAF6 mediated NF-kB activation |
| 0.0 | 1.1 | REACTOME TGF BETA RECEPTOR SIGNALING IN EMT EPITHELIAL TO MESENCHYMAL TRANSITION | Genes involved in TGF-beta receptor signaling in EMT (epithelial to mesenchymal transition) |
| 0.0 | 0.5 | REACTOME APOPTOSIS INDUCED DNA FRAGMENTATION | Genes involved in Apoptosis induced DNA fragmentation |
| 0.0 | 0.4 | REACTOME TRAFFICKING AND PROCESSING OF ENDOSOMAL TLR | Genes involved in Trafficking and processing of endosomal TLR |
| 0.0 | 1.0 | REACTOME AMINE LIGAND BINDING RECEPTORS | Genes involved in Amine ligand-binding receptors |
| 0.0 | 0.6 | REACTOME TRAF6 MEDIATED IRF7 ACTIVATION | Genes involved in TRAF6 mediated IRF7 activation |
| 0.0 | 0.6 | REACTOME IL 7 SIGNALING | Genes involved in Interleukin-7 signaling |
| 0.0 | 0.4 | REACTOME HYALURONAN METABOLISM | Genes involved in Hyaluronan metabolism |
| 0.0 | 0.7 | REACTOME DOWNREGULATION OF TGF BETA RECEPTOR SIGNALING | Genes involved in Downregulation of TGF-beta receptor signaling |
| 0.0 | 0.1 | REACTOME REGULATION OF ORNITHINE DECARBOXYLASE ODC | Genes involved in Regulation of ornithine decarboxylase (ODC) |
| 0.0 | 0.4 | REACTOME OTHER SEMAPHORIN INTERACTIONS | Genes involved in Other semaphorin interactions |
| 0.0 | 0.5 | REACTOME REGULATION OF HYPOXIA INDUCIBLE FACTOR HIF BY OXYGEN | Genes involved in Regulation of Hypoxia-inducible Factor (HIF) by Oxygen |
| 0.0 | 0.2 | REACTOME SIGNALING BY FGFR3 MUTANTS | Genes involved in Signaling by FGFR3 mutants |
| 0.0 | 0.5 | REACTOME G0 AND EARLY G1 | Genes involved in G0 and Early G1 |
| 0.0 | 0.2 | REACTOME METABOLISM OF POLYAMINES | Genes involved in Metabolism of polyamines |
| 0.0 | 0.2 | REACTOME ACYL CHAIN REMODELLING OF PG | Genes involved in Acyl chain remodelling of PG |
| 0.0 | 0.4 | REACTOME CTNNB1 PHOSPHORYLATION CASCADE | Genes involved in Beta-catenin phosphorylation cascade |
| 0.0 | 0.5 | REACTOME YAP1 AND WWTR1 TAZ STIMULATED GENE EXPRESSION | Genes involved in YAP1- and WWTR1 (TAZ)-stimulated gene expression |
| 0.0 | 0.2 | REACTOME DESTABILIZATION OF MRNA BY TRISTETRAPROLIN TTP | Genes involved in Destabilization of mRNA by Tristetraprolin (TTP) |
| 0.0 | 0.3 | REACTOME CHONDROITIN SULFATE BIOSYNTHESIS | Genes involved in Chondroitin sulfate biosynthesis |