Project
Illumina Body Map 2 (GSE30611)
Navigation
Downloads
Results for UGACCUA
Z-value: 0.19
Motif logo

miRNA associated with seed UGACCUA
| Name | miRBASE accession |
|---|---|
|
hsa-miR-192-5p
|
MIMAT0000222 |
|
hsa-miR-215-5p
|
MIMAT0000272 |
Activity profile of UGACCUA motif
Sorted Z-values of UGACCUA motif
| Promoter | Log-likelihood | Transcript | Gene | Gene Info |
|---|---|---|---|---|
| chr2_+_181985846 | 0.24 |
ENST00000682840.1
ENST00000409137.7 ENST00000280295.7 |
PPP1R1C
|
protein phosphatase 1 regulatory inhibitor subunit 1C |
| chr7_+_107470050 | 0.23 |
ENST00000304402.6
|
GPR22
|
G protein-coupled receptor 22 |
| chr1_-_31373067 | 0.22 |
ENST00000373713.7
|
FABP3
|
fatty acid binding protein 3 |
| chr5_+_6448832 | 0.18 |
ENST00000399816.4
|
UBE2QL1
|
ubiquitin conjugating enzyme E2 Q family like 1 |
| chr9_+_12693327 | 0.18 |
ENST00000388918.10
|
TYRP1
|
tyrosinase related protein 1 |
| chr17_+_39868197 | 0.14 |
ENST00000348931.9
ENST00000583811.5 ENST00000584588.5 ENST00000377940.3 |
ZPBP2
|
zona pellucida binding protein 2 |
| chr5_+_173888335 | 0.14 |
ENST00000265085.10
|
CPEB4
|
cytoplasmic polyadenylation element binding protein 4 |
| chr19_+_30372364 | 0.12 |
ENST00000355537.4
|
ZNF536
|
zinc finger protein 536 |
| chr1_-_9910169 | 0.11 |
ENST00000377263.6
|
CTNNBIP1
|
catenin beta interacting protein 1 |
| chr9_-_124771304 | 0.10 |
ENST00000416460.6
ENST00000487099.7 |
NR6A1
|
nuclear receptor subfamily 6 group A member 1 |
| chr12_-_13981544 | 0.10 |
ENST00000609686.4
|
GRIN2B
|
glutamate ionotropic receptor NMDA type subunit 2B |
| chr5_-_74640719 | 0.08 |
ENST00000302351.9
ENST00000509127.2 |
ENC1
|
ectodermal-neural cortex 1 |
| chr6_+_116877236 | 0.08 |
ENST00000332958.3
|
RFX6
|
regulatory factor X6 |
| chr17_+_2796404 | 0.08 |
ENST00000366401.8
ENST00000254695.13 ENST00000542807.1 |
RAP1GAP2
|
RAP1 GTPase activating protein 2 |
| chr7_+_28412511 | 0.07 |
ENST00000357727.7
|
CREB5
|
cAMP responsive element binding protein 5 |
| chr5_-_39074377 | 0.07 |
ENST00000514735.1
ENST00000357387.8 ENST00000296782.9 |
RICTOR
|
RPTOR independent companion of MTOR complex 2 |
| chr6_+_122996227 | 0.07 |
ENST00000275162.10
|
CLVS2
|
clavesin 2 |
| chr17_-_4940023 | 0.07 |
ENST00000225665.12
ENST00000544061.6 |
SLC25A11
|
solute carrier family 25 member 11 |
| chr8_+_60678705 | 0.07 |
ENST00000423902.7
|
CHD7
|
chromodomain helicase DNA binding protein 7 |
| chr12_+_51662781 | 0.07 |
ENST00000355133.7
ENST00000599343.5 |
SCN8A
|
sodium voltage-gated channel alpha subunit 8 |
| chr20_-_43189733 | 0.07 |
ENST00000373187.5
ENST00000356100.6 ENST00000373184.5 ENST00000373190.5 |
PTPRT
|
protein tyrosine phosphatase receptor type T |
| chr12_+_752551 | 0.07 |
ENST00000315939.11
ENST00000340908.9 ENST00000535572.5 |
WNK1
|
WNK lysine deficient protein kinase 1 |
| chr3_-_9249623 | 0.07 |
ENST00000383836.8
|
SRGAP3
|
SLIT-ROBO Rho GTPase activating protein 3 |
| chr22_-_21867610 | 0.06 |
ENST00000215832.11
ENST00000398822.7 |
MAPK1
|
mitogen-activated protein kinase 1 |
| chr15_+_89088417 | 0.06 |
ENST00000569550.5
ENST00000565066.5 ENST00000565973.5 ENST00000352732.10 |
ABHD2
|
abhydrolase domain containing 2, acylglycerol lipase |
| chr4_+_183099244 | 0.06 |
ENST00000403733.8
|
WWC2
|
WW and C2 domain containing 2 |
| chr3_-_115071333 | 0.06 |
ENST00000462705.5
|
ZBTB20
|
zinc finger and BTB domain containing 20 |
| chr18_+_52340179 | 0.06 |
ENST00000442544.7
|
DCC
|
DCC netrin 1 receptor |
| chr6_+_39048765 | 0.06 |
ENST00000373256.5
|
GLP1R
|
glucagon like peptide 1 receptor |
| chr7_+_98106852 | 0.06 |
ENST00000297293.6
|
LMTK2
|
lemur tyrosine kinase 2 |
| chr2_+_114442616 | 0.06 |
ENST00000410059.6
|
DPP10
|
dipeptidyl peptidase like 10 |
| chr3_+_38453832 | 0.06 |
ENST00000352511.5
|
ACVR2B
|
activin A receptor type 2B |
| chr17_+_29390326 | 0.06 |
ENST00000261716.8
|
TAOK1
|
TAO kinase 1 |
| chr1_+_233614096 | 0.06 |
ENST00000366621.8
|
KCNK1
|
potassium two pore domain channel subfamily K member 1 |
| chr15_-_65377991 | 0.05 |
ENST00000327987.9
|
IGDCC3
|
immunoglobulin superfamily DCC subclass member 3 |
| chrX_-_24027186 | 0.05 |
ENST00000328046.8
|
KLHL15
|
kelch like family member 15 |
| chrX_+_131058340 | 0.05 |
ENST00000276211.10
ENST00000370922.5 |
ARHGAP36
|
Rho GTPase activating protein 36 |
| chr21_-_37916440 | 0.05 |
ENST00000609713.2
|
KCNJ6
|
potassium inwardly rectifying channel subfamily J member 6 |
| chr4_+_171813397 | 0.05 |
ENST00000506823.6
|
GALNTL6
|
polypeptide N-acetylgalactosaminyltransferase like 6 |
| chr14_+_57268963 | 0.05 |
ENST00000261558.8
|
AP5M1
|
adaptor related protein complex 5 subunit mu 1 |
| chr17_-_35121487 | 0.04 |
ENST00000593039.5
|
ENSG00000267618.5
|
RAD51L3-RFFL readthrough |
| chr8_+_124539097 | 0.04 |
ENST00000606244.2
ENST00000276689.8 ENST00000518008.5 ENST00000517367.1 |
NDUFB9
|
NADH:ubiquinone oxidoreductase subunit B9 |
| chr17_-_58517835 | 0.04 |
ENST00000579921.1
ENST00000579925.5 ENST00000323456.9 |
MTMR4
|
myotubularin related protein 4 |
| chr6_+_166999309 | 0.04 |
ENST00000622353.4
ENST00000366847.9 ENST00000349556.4 |
CEP43
|
centrosomal protein 43 |
| chr6_-_116060859 | 0.04 |
ENST00000606080.2
|
FRK
|
fyn related Src family tyrosine kinase |
| chr15_-_72117712 | 0.04 |
ENST00000444904.5
ENST00000564571.5 |
MYO9A
|
myosin IXA |
| chr13_+_57631735 | 0.03 |
ENST00000377918.8
|
PCDH17
|
protocadherin 17 |
| chr8_-_88327475 | 0.03 |
ENST00000286614.11
|
MMP16
|
matrix metallopeptidase 16 |
| chr18_+_56651335 | 0.03 |
ENST00000589935.1
ENST00000254442.8 ENST00000357574.7 |
WDR7
|
WD repeat domain 7 |
| chr12_+_55743110 | 0.03 |
ENST00000257868.10
|
GDF11
|
growth differentiation factor 11 |
| chr1_-_100249815 | 0.03 |
ENST00000370131.3
ENST00000681617.1 ENST00000681780.1 ENST00000370132.8 |
DBT
|
dihydrolipoamide branched chain transacylase E2 |
| chr3_-_160565560 | 0.03 |
ENST00000334256.9
ENST00000676866.1 ENST00000469804.1 |
KPNA4
|
karyopherin subunit alpha 4 |
| chr11_+_35662739 | 0.03 |
ENST00000299413.7
|
TRIM44
|
tripartite motif containing 44 |
| chr1_+_181088692 | 0.03 |
ENST00000367577.7
|
IER5
|
immediate early response 5 |
| chr3_-_42804451 | 0.02 |
ENST00000418900.6
ENST00000321331.12 ENST00000430190.5 ENST00000648550.1 |
HIGD1A
ENSG00000280571.2
|
HIG1 hypoxia inducible domain family member 1A novel protein |
| chr7_+_77798750 | 0.02 |
ENST00000416283.6
ENST00000422959.6 ENST00000307305.12 ENST00000424760.5 |
PHTF2
|
putative homeodomain transcription factor 2 |
| chr5_-_141618957 | 0.02 |
ENST00000389054.8
|
DIAPH1
|
diaphanous related formin 1 |
| chr15_-_50686768 | 0.02 |
ENST00000560955.5
ENST00000646667.1 |
TRPM7
|
transient receptor potential cation channel subfamily M member 7 |
| chr11_+_119206298 | 0.02 |
ENST00000634586.1
ENST00000634840.1 ENST00000264033.6 ENST00000637974.1 |
CBL
|
Cbl proto-oncogene |
| chr1_+_84078043 | 0.02 |
ENST00000370689.6
ENST00000370688.7 |
PRKACB
|
protein kinase cAMP-activated catalytic subunit beta |
| chr2_-_25878445 | 0.02 |
ENST00000336112.9
ENST00000435504.9 |
ASXL2
|
ASXL transcriptional regulator 2 |
| chr17_-_35089212 | 0.02 |
ENST00000584655.5
ENST00000447669.6 ENST00000315249.11 |
RFFL
|
ring finger and FYVE like domain containing E3 ubiquitin protein ligase |
| chr17_-_8376658 | 0.02 |
ENST00000643221.1
ENST00000647210.1 ENST00000649935.1 ENST00000396267.3 |
KRBA2
|
KRAB-A domain containing 2 |
| chr20_-_37527723 | 0.01 |
ENST00000397135.1
ENST00000397137.5 |
BLCAP
|
BLCAP apoptosis inducing factor |
| chr1_+_66752441 | 0.01 |
ENST00000282670.7
|
DYNLT5
|
dynein light chain Tctex-type family member 5 |
| chr16_-_73048104 | 0.01 |
ENST00000268489.10
|
ZFHX3
|
zinc finger homeobox 3 |
| chr12_+_85280199 | 0.01 |
ENST00000316824.4
|
ALX1
|
ALX homeobox 1 |
| chr16_+_69565958 | 0.01 |
ENST00000349945.7
ENST00000354436.6 |
NFAT5
|
nuclear factor of activated T cells 5 |
| chr4_-_158671843 | 0.01 |
ENST00000379205.5
ENST00000508457.1 |
C4orf46
|
chromosome 4 open reading frame 46 |
| chr12_+_108131740 | 0.01 |
ENST00000332082.8
|
WSCD2
|
WSC domain containing 2 |
| chr1_+_23743153 | 0.01 |
ENST00000418390.6
|
ELOA
|
elongin A |
| chrX_-_130268883 | 0.01 |
ENST00000447817.1
ENST00000370978.9 |
ZNF280C
|
zinc finger protein 280C |
| chr17_-_714709 | 0.00 |
ENST00000401468.7
ENST00000575100.2 ENST00000680069.1 ENST00000681902.1 ENST00000576019.6 ENST00000571456.2 ENST00000679361.1 ENST00000680241.1 ENST00000681917.1 ENST00000681133.1 ENST00000437048.7 ENST00000680128.1 ENST00000681154.1 ENST00000679961.1 ENST00000680970.1 ENST00000681295.1 ENST00000574029.6 ENST00000681317.1 ENST00000571805.6 ENST00000291074.10 |
VPS53
|
VPS53 subunit of GARP complex |
| chr20_-_59940289 | 0.00 |
ENST00000370996.5
|
PPP1R3D
|
protein phosphatase 1 regulatory subunit 3D |
| chr6_-_42451910 | 0.00 |
ENST00000372922.8
ENST00000541110.5 |
TRERF1
|
transcriptional regulating factor 1 |
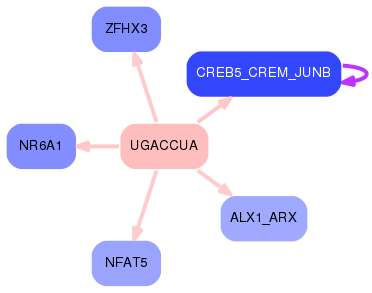
Network of associatons between targets according to the STRING database.

First level regulatory network of UGACCUA
Gene Ontology Analysis
Gene overrepresentation in biological process category:
| Log-likelihood per target | Total log-likelihood | Term | Description |
|---|---|---|---|
| 0.1 | 0.2 | GO:0043438 | acetoacetic acid metabolic process(GO:0043438) |
| 0.0 | 0.2 | GO:2001245 | regulation of phosphatidylcholine biosynthetic process(GO:2001245) |
| 0.0 | 0.1 | GO:0002528 | regulation of vascular permeability involved in acute inflammatory response(GO:0002528) |
| 0.0 | 0.1 | GO:0019858 | cytosine metabolic process(GO:0019858) |
| 0.0 | 0.1 | GO:0021965 | spinal cord ventral commissure morphogenesis(GO:0021965) |
| 0.0 | 0.1 | GO:0015742 | alpha-ketoglutarate transport(GO:0015742) |
| 0.0 | 0.1 | GO:0023016 | signal transduction by trans-phosphorylation(GO:0023016) |
| 0.0 | 0.0 | GO:1990709 | presynaptic active zone organization(GO:1990709) |
| 0.0 | 0.1 | GO:0030950 | establishment or maintenance of actin cytoskeleton polarity(GO:0030950) |
Gene overrepresentation in cellular component category:
| Log-likelihood per target | Total log-likelihood | Term | Description |
|---|---|---|---|
| 0.0 | 0.1 | GO:1902937 | inward rectifier potassium channel complex(GO:1902937) |
Gene overrepresentation in molecular function category:
| Log-likelihood per target | Total log-likelihood | Term | Description |
|---|---|---|---|
| 0.1 | 0.2 | GO:0070538 | oleic acid binding(GO:0070538) |
| 0.0 | 0.2 | GO:0016716 | oxidoreductase activity, acting on paired donors, with incorporation or reduction of molecular oxygen, another compound as one donor, and incorporation of one atom of oxygen(GO:0016716) |
| 0.0 | 0.1 | GO:0015140 | malate transmembrane transporter activity(GO:0015140) |
| 0.0 | 0.1 | GO:0005042 | netrin receptor activity(GO:0005042) |
| 0.0 | 0.1 | GO:0004967 | glucagon receptor activity(GO:0004967) |
| 0.0 | 0.2 | GO:0004865 | protein serine/threonine phosphatase inhibitor activity(GO:0004865) |