Project
Illumina Body Map 2 (GSE30611)
Navigation
Downloads
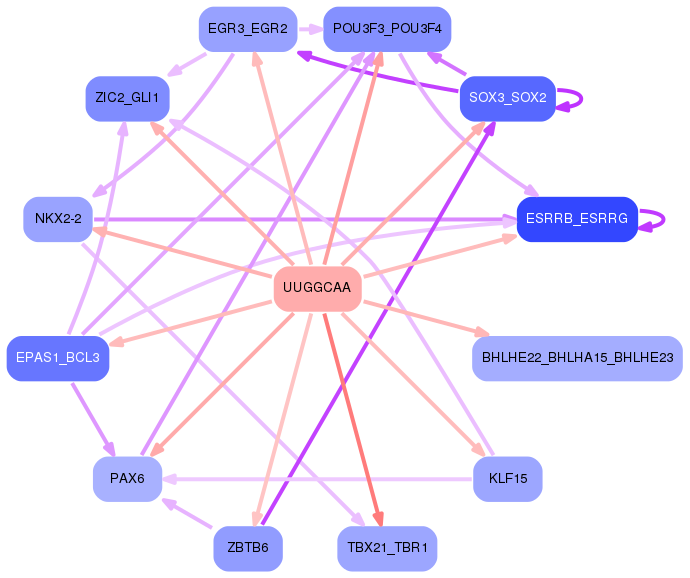
Results for UUGGCAA
Z-value: 0.71
Motif logo

miRNA associated with seed UUGGCAA
| Name | miRBASE accession |
|---|---|
|
hsa-miR-182-5p
|
MIMAT0000259 |
Activity profile of UUGGCAA motif
Sorted Z-values of UUGGCAA motif
Network of associatons between targets according to the STRING database.

First level regulatory network of UUGGCAA
Gene Ontology Analysis
Gene overrepresentation in biological process category:
| Log-likelihood per target | Total log-likelihood | Term | Description |
|---|---|---|---|
| 0.4 | 1.7 | GO:0098971 | anterograde dendritic transport of neurotransmitter receptor complex(GO:0098971) |
| 0.2 | 1.5 | GO:0021764 | amygdala development(GO:0021764) |
| 0.2 | 0.8 | GO:0031106 | septin ring assembly(GO:0000921) septin ring organization(GO:0031106) |
| 0.2 | 0.8 | GO:0072023 | thick ascending limb development(GO:0072023) metanephric thick ascending limb development(GO:0072233) |
| 0.2 | 0.6 | GO:0006173 | dADP biosynthetic process(GO:0006173) |
| 0.2 | 0.7 | GO:0090285 | negative regulation of protein glycosylation in Golgi(GO:0090285) |
| 0.2 | 2.6 | GO:0070777 | D-aspartate transport(GO:0070777) D-aspartate import(GO:0070779) |
| 0.2 | 0.5 | GO:0021529 | spinal cord oligodendrocyte cell differentiation(GO:0021529) spinal cord oligodendrocyte cell fate specification(GO:0021530) |
| 0.2 | 0.5 | GO:0001928 | regulation of exocyst assembly(GO:0001928) regulation of exocyst localization(GO:0060178) |
| 0.2 | 1.4 | GO:0048842 | positive regulation of axon extension involved in axon guidance(GO:0048842) |
| 0.2 | 0.5 | GO:1905053 | regulation of base-excision repair(GO:1905051) positive regulation of base-excision repair(GO:1905053) |
| 0.2 | 0.6 | GO:1990569 | UDP-N-acetylglucosamine transport(GO:0015788) UDP-N-acetylglucosamine transmembrane transport(GO:1990569) |
| 0.1 | 1.4 | GO:0099566 | regulation of postsynaptic cytosolic calcium ion concentration(GO:0099566) |
| 0.1 | 0.6 | GO:0019074 | viral genome packaging(GO:0019072) viral RNA genome packaging(GO:0019074) |
| 0.1 | 1.2 | GO:1902109 | negative regulation of mitochondrial membrane permeability involved in apoptotic process(GO:1902109) |
| 0.1 | 0.4 | GO:1902309 | negative regulation of peptidyl-serine dephosphorylation(GO:1902309) |
| 0.1 | 0.5 | GO:2000638 | regulation of SREBP signaling pathway(GO:2000638) negative regulation of SREBP signaling pathway(GO:2000639) |
| 0.1 | 0.4 | GO:0090365 | regulation of mRNA modification(GO:0090365) |
| 0.1 | 0.8 | GO:1904694 | negative regulation of vascular smooth muscle contraction(GO:1904694) |
| 0.1 | 0.8 | GO:0006540 | glutamate decarboxylation to succinate(GO:0006540) |
| 0.1 | 1.7 | GO:0060385 | axonogenesis involved in innervation(GO:0060385) |
| 0.1 | 0.3 | GO:0035668 | TRAM-dependent toll-like receptor signaling pathway(GO:0035668) TRAM-dependent toll-like receptor 4 signaling pathway(GO:0035669) |
| 0.1 | 1.0 | GO:0042760 | very long-chain fatty acid catabolic process(GO:0042760) |
| 0.1 | 0.3 | GO:0046041 | ITP metabolic process(GO:0046041) |
| 0.1 | 1.4 | GO:1901843 | positive regulation of high voltage-gated calcium channel activity(GO:1901843) |
| 0.1 | 0.8 | GO:1904220 | regulation of serine C-palmitoyltransferase activity(GO:1904220) |
| 0.1 | 0.6 | GO:0032377 | regulation of intracellular lipid transport(GO:0032377) regulation of intracellular sterol transport(GO:0032380) regulation of intracellular cholesterol transport(GO:0032383) |
| 0.1 | 0.3 | GO:1903031 | regulation of microtubule plus-end binding(GO:1903031) positive regulation of microtubule plus-end binding(GO:1903033) |
| 0.1 | 0.7 | GO:0019236 | response to pheromone(GO:0019236) |
| 0.1 | 1.0 | GO:0035507 | regulation of myosin-light-chain-phosphatase activity(GO:0035507) |
| 0.1 | 0.4 | GO:0044830 | modulation by host of viral RNA genome replication(GO:0044830) positive regulation of intracellular transport of viral material(GO:1901254) |
| 0.1 | 0.3 | GO:0018125 | peptidyl-cysteine methylation(GO:0018125) |
| 0.1 | 1.0 | GO:0098735 | positive regulation of the force of heart contraction(GO:0098735) |
| 0.1 | 0.5 | GO:0035426 | extracellular matrix-cell signaling(GO:0035426) |
| 0.1 | 0.6 | GO:0072658 | maintenance of protein location in membrane(GO:0072658) maintenance of protein location in plasma membrane(GO:0072660) positive regulation of membrane depolarization during cardiac muscle cell action potential(GO:1900827) |
| 0.1 | 0.2 | GO:0002581 | negative regulation of antigen processing and presentation of peptide or polysaccharide antigen via MHC class II(GO:0002581) |
| 0.1 | 0.4 | GO:0061091 | regulation of phospholipid translocation(GO:0061091) positive regulation of phospholipid translocation(GO:0061092) |
| 0.1 | 0.3 | GO:0019859 | pyrimidine nucleobase catabolic process(GO:0006208) thymine catabolic process(GO:0006210) thymine metabolic process(GO:0019859) |
| 0.1 | 0.5 | GO:2000782 | regulation of unidimensional cell growth(GO:0051510) negative regulation of unidimensional cell growth(GO:0051511) establishment of cell polarity regulating cell shape(GO:0071964) regulation of establishment or maintenance of cell polarity regulating cell shape(GO:2000769) positive regulation of establishment or maintenance of cell polarity regulating cell shape(GO:2000771) regulation of establishment of cell polarity regulating cell shape(GO:2000782) positive regulation of establishment of cell polarity regulating cell shape(GO:2000784) positive regulation of barbed-end actin filament capping(GO:2000814) |
| 0.1 | 0.2 | GO:1904862 | inhibitory synapse assembly(GO:1904862) |
| 0.1 | 0.2 | GO:0032707 | negative regulation of interleukin-23 production(GO:0032707) |
| 0.1 | 0.3 | GO:0006175 | adenosine salvage(GO:0006169) dATP biosynthetic process(GO:0006175) |
| 0.1 | 0.2 | GO:0021503 | neural fold bending(GO:0021503) |
| 0.1 | 0.5 | GO:0061709 | reticulophagy(GO:0061709) |
| 0.1 | 0.6 | GO:0034316 | negative regulation of Arp2/3 complex-mediated actin nucleation(GO:0034316) |
| 0.1 | 0.6 | GO:1900122 | positive regulation of receptor binding(GO:1900122) |
| 0.1 | 0.4 | GO:0033489 | cholesterol biosynthetic process via desmosterol(GO:0033489) cholesterol biosynthetic process via lathosterol(GO:0033490) |
| 0.1 | 0.2 | GO:1990751 | positive regulation of Schwann cell migration(GO:1900149) regulation of Schwann cell chemotaxis(GO:1904266) positive regulation of Schwann cell chemotaxis(GO:1904268) Schwann cell chemotaxis(GO:1990751) |
| 0.1 | 0.2 | GO:0071586 | prenylated protein catabolic process(GO:0030327) CAAX-box protein processing(GO:0071586) CAAX-box protein maturation(GO:0080120) |
| 0.1 | 1.1 | GO:0019227 | neuronal action potential propagation(GO:0019227) action potential propagation(GO:0098870) |
| 0.1 | 0.2 | GO:0036353 | histone H2A-K119 monoubiquitination(GO:0036353) |
| 0.1 | 0.7 | GO:0051005 | negative regulation of lipoprotein lipase activity(GO:0051005) |
| 0.1 | 0.5 | GO:0060455 | negative regulation of gastric acid secretion(GO:0060455) |
| 0.1 | 0.5 | GO:0033353 | S-adenosylmethionine cycle(GO:0033353) |
| 0.1 | 0.4 | GO:1901908 | diadenosine polyphosphate catabolic process(GO:0015961) diphosphoinositol polyphosphate metabolic process(GO:0071543) diadenosine pentaphosphate metabolic process(GO:1901906) diadenosine pentaphosphate catabolic process(GO:1901907) diadenosine hexaphosphate metabolic process(GO:1901908) diadenosine hexaphosphate catabolic process(GO:1901909) adenosine 5'-(hexahydrogen pentaphosphate) metabolic process(GO:1901910) adenosine 5'-(hexahydrogen pentaphosphate) catabolic process(GO:1901911) |
| 0.1 | 0.4 | GO:0099558 | maintenance of synapse structure(GO:0099558) |
| 0.1 | 0.2 | GO:0009436 | glyoxylate catabolic process(GO:0009436) |
| 0.1 | 0.9 | GO:0032927 | positive regulation of activin receptor signaling pathway(GO:0032927) |
| 0.1 | 0.2 | GO:1902630 | regulation of membrane hyperpolarization(GO:1902630) |
| 0.1 | 0.4 | GO:1903593 | regulation of histamine secretion by mast cell(GO:1903593) |
| 0.1 | 0.3 | GO:0061026 | cardiac muscle tissue regeneration(GO:0061026) |
| 0.1 | 0.6 | GO:0051549 | positive regulation of keratinocyte migration(GO:0051549) |
| 0.1 | 0.6 | GO:0001714 | endodermal cell fate specification(GO:0001714) |
| 0.1 | 0.6 | GO:0000160 | phosphorelay signal transduction system(GO:0000160) |
| 0.1 | 0.9 | GO:0008627 | intrinsic apoptotic signaling pathway in response to osmotic stress(GO:0008627) |
| 0.1 | 0.2 | GO:1903371 | regulation of endoplasmic reticulum tubular network organization(GO:1903371) |
| 0.0 | 0.6 | GO:0099525 | presynaptic dense core granule exocytosis(GO:0099525) |
| 0.0 | 0.8 | GO:0042355 | fucose catabolic process(GO:0019317) L-fucose metabolic process(GO:0042354) L-fucose catabolic process(GO:0042355) |
| 0.0 | 0.1 | GO:0097272 | ammonia homeostasis(GO:0097272) urea homeostasis(GO:0097274) |
| 0.0 | 0.2 | GO:0018008 | N-terminal peptidyl-glycine N-myristoylation(GO:0018008) |
| 0.0 | 0.7 | GO:0030050 | vesicle transport along actin filament(GO:0030050) |
| 0.0 | 0.5 | GO:0032534 | regulation of microvillus assembly(GO:0032534) |
| 0.0 | 1.3 | GO:0061162 | establishment of monopolar cell polarity(GO:0061162) |
| 0.0 | 0.2 | GO:0002188 | translation reinitiation(GO:0002188) |
| 0.0 | 0.1 | GO:0021526 | medial motor column neuron differentiation(GO:0021526) |
| 0.0 | 2.2 | GO:2000300 | regulation of synaptic vesicle exocytosis(GO:2000300) |
| 0.0 | 0.6 | GO:0048672 | positive regulation of collateral sprouting(GO:0048672) |
| 0.0 | 0.8 | GO:2001197 | regulation of basement membrane assembly involved in embryonic body morphogenesis(GO:1904259) positive regulation of basement membrane assembly involved in embryonic body morphogenesis(GO:1904261) basement membrane assembly involved in embryonic body morphogenesis(GO:2001197) |
| 0.0 | 0.4 | GO:0051694 | pointed-end actin filament capping(GO:0051694) |
| 0.0 | 1.4 | GO:0090331 | negative regulation of platelet aggregation(GO:0090331) |
| 0.0 | 0.2 | GO:0046167 | glycerol-3-phosphate biosynthetic process(GO:0046167) |
| 0.0 | 0.2 | GO:0003245 | cardiac muscle tissue growth involved in heart morphogenesis(GO:0003245) |
| 0.0 | 1.2 | GO:0071420 | cellular response to histamine(GO:0071420) |
| 0.0 | 0.2 | GO:0097210 | response to gonadotropin-releasing hormone(GO:0097210) cellular response to gonadotropin-releasing hormone(GO:0097211) |
| 0.0 | 0.2 | GO:1905205 | positive regulation of connective tissue replacement(GO:1905205) |
| 0.0 | 0.3 | GO:0045586 | regulation of gamma-delta T cell differentiation(GO:0045586) |
| 0.0 | 1.6 | GO:0048268 | clathrin coat assembly(GO:0048268) |
| 0.0 | 0.6 | GO:0003322 | pancreatic A cell development(GO:0003322) |
| 0.0 | 0.3 | GO:0006642 | triglyceride mobilization(GO:0006642) |
| 0.0 | 0.5 | GO:0046951 | ketone body biosynthetic process(GO:0046951) |
| 0.0 | 0.6 | GO:0090232 | positive regulation of spindle checkpoint(GO:0090232) |
| 0.0 | 0.1 | GO:1904381 | Golgi apparatus mannose trimming(GO:1904381) |
| 0.0 | 1.2 | GO:0006677 | glycosylceramide metabolic process(GO:0006677) |
| 0.0 | 0.4 | GO:0046512 | diol biosynthetic process(GO:0034312) sphingosine biosynthetic process(GO:0046512) |
| 0.0 | 0.3 | GO:0043129 | surfactant homeostasis(GO:0043129) |
| 0.0 | 1.4 | GO:0032012 | regulation of ARF protein signal transduction(GO:0032012) |
| 0.0 | 0.1 | GO:0020012 | evasion or tolerance of host immune response(GO:0020012) evasion or tolerance of host defense response(GO:0030682) evasion or tolerance by virus of host immune response(GO:0030683) evasion or tolerance of immune response of other organism involved in symbiotic interaction(GO:0051805) evasion or tolerance of defense response of other organism involved in symbiotic interaction(GO:0051807) |
| 0.0 | 0.2 | GO:1903566 | positive regulation of protein localization to cilium(GO:1903566) |
| 0.0 | 0.1 | GO:0061763 | multivesicular body-lysosome fusion(GO:0061763) |
| 0.0 | 0.5 | GO:0019532 | oxalate transport(GO:0019532) |
| 0.0 | 0.1 | GO:0034402 | recruitment of 3'-end processing factors to RNA polymerase II holoenzyme complex(GO:0034402) |
| 0.0 | 0.3 | GO:0097338 | response to clozapine(GO:0097338) |
| 0.0 | 0.2 | GO:0016344 | meiotic chromosome movement towards spindle pole(GO:0016344) |
| 0.0 | 0.1 | GO:0006045 | N-acetylglucosamine biosynthetic process(GO:0006045) glucosamine-containing compound biosynthetic process(GO:1901073) |
| 0.0 | 0.4 | GO:0015693 | magnesium ion transport(GO:0015693) |
| 0.0 | 0.1 | GO:0097477 | lateral motor column neuron migration(GO:0097477) |
| 0.0 | 0.9 | GO:0045332 | phospholipid translocation(GO:0045332) |
| 0.0 | 0.3 | GO:0006449 | regulation of translational termination(GO:0006449) |
| 0.0 | 2.3 | GO:0007157 | heterophilic cell-cell adhesion via plasma membrane cell adhesion molecules(GO:0007157) |
| 0.0 | 0.1 | GO:0061687 | detoxification of inorganic compound(GO:0061687) stress response to metal ion(GO:0097501) |
| 0.0 | 0.6 | GO:0097119 | postsynaptic density protein 95 clustering(GO:0097119) |
| 0.0 | 0.1 | GO:1904116 | negative regulation of urine volume(GO:0035811) response to vasopressin(GO:1904116) cellular response to vasopressin(GO:1904117) |
| 0.0 | 0.1 | GO:0090176 | microtubule cytoskeleton organization involved in establishment of planar polarity(GO:0090176) |
| 0.0 | 0.6 | GO:1904262 | negative regulation of TORC1 signaling(GO:1904262) |
| 0.0 | 0.5 | GO:0010510 | regulation of acetyl-CoA biosynthetic process from pyruvate(GO:0010510) |
| 0.0 | 0.4 | GO:0046007 | negative regulation of activated T cell proliferation(GO:0046007) |
| 0.0 | 0.1 | GO:0021691 | cerebellar Purkinje cell layer maturation(GO:0021691) |
| 0.0 | 0.3 | GO:0008635 | activation of cysteine-type endopeptidase activity involved in apoptotic process by cytochrome c(GO:0008635) |
| 0.0 | 0.2 | GO:0021633 | optic nerve structural organization(GO:0021633) |
| 0.0 | 0.2 | GO:0030643 | cellular phosphate ion homeostasis(GO:0030643) cellular divalent inorganic anion homeostasis(GO:0072501) cellular trivalent inorganic anion homeostasis(GO:0072502) |
| 0.0 | 0.1 | GO:0035627 | ceramide transport(GO:0035627) |
| 0.0 | 2.5 | GO:0042147 | retrograde transport, endosome to Golgi(GO:0042147) |
| 0.0 | 0.5 | GO:0090005 | negative regulation of establishment of protein localization to plasma membrane(GO:0090005) |
| 0.0 | 0.1 | GO:2000504 | positive regulation of blood vessel remodeling(GO:2000504) |
| 0.0 | 0.6 | GO:0001573 | ganglioside metabolic process(GO:0001573) |
| 0.0 | 0.4 | GO:0042759 | long-chain fatty acid biosynthetic process(GO:0042759) |
| 0.0 | 0.6 | GO:0042753 | positive regulation of circadian rhythm(GO:0042753) |
| 0.0 | 0.3 | GO:0006655 | phosphatidylglycerol biosynthetic process(GO:0006655) |
| 0.0 | 0.1 | GO:1901301 | regulation of cargo loading into COPII-coated vesicle(GO:1901301) |
| 0.0 | 0.5 | GO:0006646 | phosphatidylethanolamine biosynthetic process(GO:0006646) |
| 0.0 | 0.1 | GO:0097498 | endothelial tube lumen extension(GO:0097498) |
| 0.0 | 0.1 | GO:0006842 | tricarboxylic acid transport(GO:0006842) citrate transport(GO:0015746) |
| 0.0 | 0.4 | GO:0021794 | thalamus development(GO:0021794) |
| 0.0 | 0.2 | GO:0071787 | endoplasmic reticulum tubular network assembly(GO:0071787) |
| 0.0 | 0.8 | GO:0032292 | myelination in peripheral nervous system(GO:0022011) peripheral nervous system axon ensheathment(GO:0032292) |
| 0.0 | 0.3 | GO:0070070 | proton-transporting V-type ATPase complex assembly(GO:0070070) vacuolar proton-transporting V-type ATPase complex assembly(GO:0070072) |
| 0.0 | 1.1 | GO:0048791 | calcium ion-regulated exocytosis of neurotransmitter(GO:0048791) |
| 0.0 | 0.4 | GO:0010592 | positive regulation of lamellipodium assembly(GO:0010592) |
| 0.0 | 0.1 | GO:1900737 | regulation of proteinase activated receptor activity(GO:1900276) negative regulation of phospholipase C-activating G-protein coupled receptor signaling pathway(GO:1900737) |
| 0.0 | 0.1 | GO:0046619 | optic placode formation involved in camera-type eye formation(GO:0046619) |
| 0.0 | 0.3 | GO:0097062 | dendritic spine maintenance(GO:0097062) |
| 0.0 | 0.1 | GO:0003165 | Purkinje myocyte development(GO:0003165) |
| 0.0 | 0.1 | GO:0030200 | heparan sulfate proteoglycan catabolic process(GO:0030200) |
| 0.0 | 0.2 | GO:0042256 | mature ribosome assembly(GO:0042256) bone marrow development(GO:0048539) |
| 0.0 | 0.3 | GO:0048670 | regulation of collateral sprouting(GO:0048670) |
| 0.0 | 0.4 | GO:0007158 | neuron cell-cell adhesion(GO:0007158) |
| 0.0 | 0.2 | GO:0007196 | adenylate cyclase-inhibiting G-protein coupled glutamate receptor signaling pathway(GO:0007196) |
| 0.0 | 0.3 | GO:0006450 | regulation of translational fidelity(GO:0006450) |
| 0.0 | 0.1 | GO:0090166 | regulation of Schwann cell differentiation(GO:0014038) Golgi disassembly(GO:0090166) |
| 0.0 | 0.2 | GO:0030422 | production of siRNA involved in RNA interference(GO:0030422) |
| 0.0 | 1.8 | GO:0010923 | negative regulation of phosphatase activity(GO:0010923) |
| 0.0 | 0.1 | GO:0001731 | formation of translation preinitiation complex(GO:0001731) |
| 0.0 | 0.3 | GO:0048266 | behavioral response to pain(GO:0048266) |
| 0.0 | 0.3 | GO:0035988 | chondrocyte proliferation(GO:0035988) |
| 0.0 | 0.5 | GO:0035640 | exploration behavior(GO:0035640) |
| 0.0 | 0.5 | GO:0001893 | maternal placenta development(GO:0001893) |
| 0.0 | 0.2 | GO:0006268 | DNA unwinding involved in DNA replication(GO:0006268) |
| 0.0 | 0.1 | GO:0060355 | positive regulation of cell adhesion molecule production(GO:0060355) |
| 0.0 | 0.1 | GO:0018211 | protein C-linked glycosylation(GO:0018103) peptidyl-tryptophan modification(GO:0018211) protein C-linked glycosylation via tryptophan(GO:0018317) protein C-linked glycosylation via 2'-alpha-mannosyl-L-tryptophan(GO:0018406) |
| 0.0 | 0.2 | GO:0042262 | DNA protection(GO:0042262) |
| 0.0 | 0.6 | GO:0009303 | rRNA transcription(GO:0009303) |
| 0.0 | 0.2 | GO:0060363 | cranial suture morphogenesis(GO:0060363) |
| 0.0 | 0.3 | GO:0048265 | response to pain(GO:0048265) |
| 0.0 | 0.9 | GO:0045773 | positive regulation of axon extension(GO:0045773) |
| 0.0 | 0.7 | GO:0046839 | phospholipid dephosphorylation(GO:0046839) |
| 0.0 | 0.1 | GO:0035469 | determination of pancreatic left/right asymmetry(GO:0035469) |
| 0.0 | 0.1 | GO:0018095 | protein polyglutamylation(GO:0018095) |
| 0.0 | 0.1 | GO:1903385 | regulation of homophilic cell adhesion(GO:1903385) |
Gene overrepresentation in cellular component category:
| Log-likelihood per target | Total log-likelihood | Term | Description |
|---|---|---|---|
| 0.3 | 1.6 | GO:0044308 | axonal spine(GO:0044308) |
| 0.1 | 0.4 | GO:0034686 | integrin alphav-beta8 complex(GO:0034686) |
| 0.1 | 1.7 | GO:0035253 | ciliary rootlet(GO:0035253) |
| 0.1 | 0.8 | GO:0005826 | actomyosin contractile ring(GO:0005826) |
| 0.1 | 0.4 | GO:1902737 | dendritic filopodium(GO:1902737) |
| 0.1 | 0.4 | GO:0030906 | retromer, cargo-selective complex(GO:0030906) |
| 0.1 | 0.5 | GO:1990452 | Parkin-FBXW7-Cul1 ubiquitin ligase complex(GO:1990452) |
| 0.1 | 0.6 | GO:0044305 | calyx of Held(GO:0044305) |
| 0.1 | 0.8 | GO:0017059 | serine C-palmitoyltransferase complex(GO:0017059) endoplasmic reticulum palmitoyltransferase complex(GO:0031211) |
| 0.1 | 0.3 | GO:0043291 | RAVE complex(GO:0043291) |
| 0.1 | 0.6 | GO:0043190 | ATP-binding cassette (ABC) transporter complex(GO:0043190) |
| 0.1 | 0.3 | GO:0032937 | SREBP-SCAP-Insig complex(GO:0032937) |
| 0.0 | 0.8 | GO:0045180 | basal cortex(GO:0045180) |
| 0.0 | 1.7 | GO:0043194 | axon initial segment(GO:0043194) |
| 0.0 | 0.5 | GO:0005955 | calcineurin complex(GO:0005955) |
| 0.0 | 1.0 | GO:0060077 | inhibitory synapse(GO:0060077) |
| 0.0 | 0.3 | GO:0034363 | intermediate-density lipoprotein particle(GO:0034363) |
| 0.0 | 0.8 | GO:0001518 | voltage-gated sodium channel complex(GO:0001518) |
| 0.0 | 1.0 | GO:0000145 | exocyst(GO:0000145) |
| 0.0 | 1.0 | GO:0032585 | multivesicular body membrane(GO:0032585) |
| 0.0 | 0.9 | GO:0031307 | integral component of mitochondrial outer membrane(GO:0031307) |
| 0.0 | 0.4 | GO:0031209 | SCAR complex(GO:0031209) |
| 0.0 | 1.2 | GO:1902711 | GABA-A receptor complex(GO:1902711) |
| 0.0 | 0.1 | GO:0042584 | chromaffin granule membrane(GO:0042584) |
| 0.0 | 0.1 | GO:0034657 | GID complex(GO:0034657) |
| 0.0 | 0.6 | GO:1990454 | L-type voltage-gated calcium channel complex(GO:1990454) |
| 0.0 | 1.1 | GO:0044295 | axonal growth cone(GO:0044295) |
| 0.0 | 0.6 | GO:0005952 | cAMP-dependent protein kinase complex(GO:0005952) |
| 0.0 | 1.7 | GO:0030673 | axolemma(GO:0030673) |
| 0.0 | 0.3 | GO:0030981 | cortical microtubule cytoskeleton(GO:0030981) |
| 0.0 | 0.1 | GO:0097125 | cyclin B1-CDK1 complex(GO:0097125) |
| 0.0 | 0.4 | GO:0043083 | synaptic cleft(GO:0043083) |
| 0.0 | 0.9 | GO:0048786 | presynaptic active zone(GO:0048786) |
| 0.0 | 0.2 | GO:0005577 | fibrinogen complex(GO:0005577) |
| 0.0 | 0.1 | GO:0039713 | viral factory(GO:0039713) cytoplasmic viral factory(GO:0039714) host cell viral assembly compartment(GO:0072517) |
| 0.0 | 0.5 | GO:0031362 | anchored component of external side of plasma membrane(GO:0031362) |
| 0.0 | 0.5 | GO:0046658 | anchored component of plasma membrane(GO:0046658) |
| 0.0 | 0.4 | GO:0001931 | uropod(GO:0001931) cell trailing edge(GO:0031254) |
| 0.0 | 0.2 | GO:0036157 | outer dynein arm(GO:0036157) |
| 0.0 | 0.2 | GO:0030478 | actin cap(GO:0030478) |
| 0.0 | 0.2 | GO:0016461 | unconventional myosin complex(GO:0016461) |
| 0.0 | 1.6 | GO:0042734 | presynaptic membrane(GO:0042734) |
| 0.0 | 1.1 | GO:0030315 | T-tubule(GO:0030315) |
| 0.0 | 1.2 | GO:0032420 | stereocilium(GO:0032420) |
| 0.0 | 1.9 | GO:0030672 | synaptic vesicle membrane(GO:0030672) exocytic vesicle membrane(GO:0099501) |
| 0.0 | 0.7 | GO:0035869 | ciliary transition zone(GO:0035869) |
| 0.0 | 1.0 | GO:0019005 | SCF ubiquitin ligase complex(GO:0019005) |
| 0.0 | 0.1 | GO:1990578 | perinuclear endoplasmic reticulum membrane(GO:1990578) |
| 0.0 | 1.9 | GO:0008021 | synaptic vesicle(GO:0008021) |
| 0.0 | 2.9 | GO:0043197 | dendritic spine(GO:0043197) neuron spine(GO:0044309) |
| 0.0 | 0.3 | GO:0005868 | cytoplasmic dynein complex(GO:0005868) |
| 0.0 | 1.1 | GO:0030670 | phagocytic vesicle membrane(GO:0030670) |
| 0.0 | 0.6 | GO:0016460 | myosin II complex(GO:0016460) |
| 0.0 | 0.1 | GO:0042382 | paraspeckles(GO:0042382) |
| 0.0 | 2.0 | GO:0030426 | growth cone(GO:0030426) |
| 0.0 | 0.8 | GO:0030173 | integral component of Golgi membrane(GO:0030173) |
Gene overrepresentation in molecular function category:
| Log-likelihood per target | Total log-likelihood | Term | Description |
|---|---|---|---|
| 0.4 | 1.6 | GO:0008427 | calcium-dependent protein kinase inhibitor activity(GO:0008427) |
| 0.2 | 0.6 | GO:0086057 | voltage-gated calcium channel activity involved in bundle of His cell action potential(GO:0086057) |
| 0.2 | 0.7 | GO:0035373 | chondroitin sulfate proteoglycan binding(GO:0035373) |
| 0.2 | 0.7 | GO:0030379 | neurotensin receptor activity, non-G-protein coupled(GO:0030379) |
| 0.2 | 2.6 | GO:0015501 | glutamate:sodium symporter activity(GO:0015501) |
| 0.2 | 0.7 | GO:0008426 | protein kinase C inhibitor activity(GO:0008426) |
| 0.2 | 1.4 | GO:0099529 | neurotransmitter receptor activity involved in regulation of postsynaptic membrane potential(GO:0099529) transmitter-gated ion channel activity involved in regulation of postsynaptic membrane potential(GO:1904315) |
| 0.2 | 0.6 | GO:0005462 | UDP-N-acetylglucosamine transmembrane transporter activity(GO:0005462) |
| 0.1 | 1.0 | GO:0005324 | long-chain fatty acid transporter activity(GO:0005324) |
| 0.1 | 0.5 | GO:0032427 | GBD domain binding(GO:0032427) |
| 0.1 | 0.5 | GO:0004419 | hydroxymethylglutaryl-CoA lyase activity(GO:0004419) |
| 0.1 | 0.5 | GO:0004307 | ethanolaminephosphotransferase activity(GO:0004307) |
| 0.1 | 1.1 | GO:0017040 | ceramidase activity(GO:0017040) |
| 0.1 | 0.5 | GO:0005169 | neurotrophin TRKB receptor binding(GO:0005169) |
| 0.1 | 1.0 | GO:0099580 | ion antiporter activity involved in regulation of postsynaptic membrane potential(GO:0099580) |
| 0.1 | 0.8 | GO:0016454 | serine C-palmitoyltransferase activity(GO:0004758) C-palmitoyltransferase activity(GO:0016454) |
| 0.1 | 0.8 | GO:0004351 | glutamate decarboxylase activity(GO:0004351) |
| 0.1 | 0.2 | GO:0000822 | inositol hexakisphosphate binding(GO:0000822) |
| 0.1 | 1.7 | GO:0070679 | inositol 1,4,5 trisphosphate binding(GO:0070679) |
| 0.1 | 1.6 | GO:0032051 | clathrin light chain binding(GO:0032051) |
| 0.1 | 1.2 | GO:0022851 | GABA-gated chloride ion channel activity(GO:0022851) |
| 0.1 | 2.9 | GO:0031489 | myosin V binding(GO:0031489) |
| 0.1 | 0.9 | GO:0001665 | alpha-N-acetylgalactosaminide alpha-2,6-sialyltransferase activity(GO:0001665) |
| 0.1 | 0.4 | GO:0044378 | non-sequence-specific DNA binding, bending(GO:0044378) |
| 0.1 | 0.5 | GO:0045504 | dynein heavy chain binding(GO:0045504) |
| 0.1 | 0.5 | GO:0000248 | C-5 sterol desaturase activity(GO:0000248) sterol desaturase activity(GO:0070704) |
| 0.1 | 0.3 | GO:0050815 | phosphoserine binding(GO:0050815) |
| 0.1 | 0.5 | GO:0004740 | pyruvate dehydrogenase (acetyl-transferring) kinase activity(GO:0004740) |
| 0.1 | 0.4 | GO:1990430 | extracellular matrix protein binding(GO:1990430) |
| 0.1 | 0.3 | GO:0004605 | phosphatidate cytidylyltransferase activity(GO:0004605) |
| 0.1 | 0.2 | GO:0016833 | oxo-acid-lyase activity(GO:0016833) |
| 0.1 | 0.4 | GO:0016524 | latrotoxin receptor activity(GO:0016524) |
| 0.1 | 0.3 | GO:0052810 | 1-phosphatidylinositol-5-kinase activity(GO:0052810) |
| 0.1 | 0.3 | GO:0051499 | D-aminoacyl-tRNA deacylase activity(GO:0051499) D-tyrosyl-tRNA(Tyr) deacylase activity(GO:0051500) |
| 0.1 | 0.5 | GO:0004013 | adenosylhomocysteinase activity(GO:0004013) trialkylsulfonium hydrolase activity(GO:0016802) |
| 0.1 | 0.3 | GO:0004001 | adenosine kinase activity(GO:0004001) |
| 0.1 | 0.5 | GO:0050816 | phosphothreonine binding(GO:0050816) |
| 0.1 | 0.8 | GO:0046920 | alpha-(1->3)-fucosyltransferase activity(GO:0046920) |
| 0.1 | 2.2 | GO:0008574 | ATP-dependent microtubule motor activity, plus-end-directed(GO:0008574) |
| 0.1 | 0.4 | GO:0052843 | endopolyphosphatase activity(GO:0000298) diphosphoinositol-polyphosphate diphosphatase activity(GO:0008486) bis(5'-adenosyl)-hexaphosphatase activity(GO:0034431) bis(5'-adenosyl)-pentaphosphatase activity(GO:0034432) inositol diphosphate tetrakisphosphate diphosphatase activity(GO:0052840) inositol bisdiphosphate tetrakisphosphate diphosphatase activity(GO:0052841) inositol diphosphate pentakisphosphate diphosphatase activity(GO:0052842) inositol-1-diphosphate-2,3,4,5,6-pentakisphosphate diphosphatase activity(GO:0052843) inositol-3-diphosphate-1,2,4,5,6-pentakisphosphate diphosphatase activity(GO:0052844) inositol-5-diphosphate-1,2,3,4,6-pentakisphosphate diphosphatase activity(GO:0052845) inositol-1,5-bisdiphosphate-2,3,4,6-tetrakisphosphate 1-diphosphatase activity(GO:0052846) inositol-1,5-bisdiphosphate-2,3,4,6-tetrakisphosphate 5-diphosphatase activity(GO:0052847) inositol-3,5-bisdiphosphate-2,3,4,6-tetrakisphosphate 5-diphosphatase activity(GO:0052848) |
| 0.1 | 0.4 | GO:0030144 | alpha-1,6-mannosylglycoprotein 6-beta-N-acetylglucosaminyltransferase activity(GO:0030144) |
| 0.1 | 0.2 | GO:0003947 | (N-acetylneuraminyl)-galactosylglucosylceramide N-acetylgalactosaminyltransferase activity(GO:0003947) |
| 0.1 | 0.5 | GO:0043237 | laminin-1 binding(GO:0043237) |
| 0.1 | 0.3 | GO:0035276 | ethanol binding(GO:0035276) |
| 0.1 | 0.6 | GO:0000155 | phosphorelay sensor kinase activity(GO:0000155) |
| 0.1 | 0.3 | GO:0046899 | nucleoside triphosphate adenylate kinase activity(GO:0046899) |
| 0.0 | 0.5 | GO:0004957 | prostaglandin E receptor activity(GO:0004957) |
| 0.0 | 1.2 | GO:0086080 | protein binding involved in heterotypic cell-cell adhesion(GO:0086080) |
| 0.0 | 0.2 | GO:0004379 | glycylpeptide N-tetradecanoyltransferase activity(GO:0004379) myristoyltransferase activity(GO:0019107) |
| 0.0 | 1.8 | GO:0030742 | GTP-dependent protein binding(GO:0030742) |
| 0.0 | 0.2 | GO:0070051 | fibrinogen binding(GO:0070051) collagen V binding(GO:0070052) |
| 0.0 | 0.3 | GO:0035473 | lipase binding(GO:0035473) |
| 0.0 | 0.2 | GO:0004370 | glycerol kinase activity(GO:0004370) |
| 0.0 | 0.2 | GO:0051021 | GDP-dissociation inhibitor binding(GO:0051021) Rho GDP-dissociation inhibitor binding(GO:0051022) |
| 0.0 | 1.3 | GO:0004012 | phospholipid-translocating ATPase activity(GO:0004012) |
| 0.0 | 0.6 | GO:0004075 | biotin carboxylase activity(GO:0004075) |
| 0.0 | 0.6 | GO:1990825 | sequence-specific mRNA binding(GO:1990825) |
| 0.0 | 0.2 | GO:0050253 | retinyl-palmitate esterase activity(GO:0050253) |
| 0.0 | 0.3 | GO:0097108 | hedgehog family protein binding(GO:0097108) |
| 0.0 | 0.5 | GO:0070290 | N-acylphosphatidylethanolamine-specific phospholipase D activity(GO:0070290) |
| 0.0 | 0.1 | GO:0008761 | UDP-N-acetylglucosamine 2-epimerase activity(GO:0008761) N-acylmannosamine kinase activity(GO:0009384) |
| 0.0 | 0.6 | GO:0004017 | adenylate kinase activity(GO:0004017) |
| 0.0 | 0.7 | GO:0042577 | lipid phosphatase activity(GO:0042577) |
| 0.0 | 1.2 | GO:0070008 | serine-type exopeptidase activity(GO:0070008) |
| 0.0 | 0.2 | GO:0072590 | N-acetyl-L-aspartate-L-glutamate ligase activity(GO:0072590) |
| 0.0 | 1.6 | GO:0005086 | ARF guanyl-nucleotide exchange factor activity(GO:0005086) |
| 0.0 | 0.3 | GO:0097027 | ubiquitin-protein transferase activator activity(GO:0097027) |
| 0.0 | 0.3 | GO:0031849 | olfactory receptor binding(GO:0031849) |
| 0.0 | 0.6 | GO:0051011 | microtubule minus-end binding(GO:0051011) |
| 0.0 | 0.3 | GO:0050682 | AF-2 domain binding(GO:0050682) |
| 0.0 | 0.5 | GO:0019531 | oxalate transmembrane transporter activity(GO:0019531) |
| 0.0 | 0.5 | GO:0004723 | calcium-dependent protein serine/threonine phosphatase activity(GO:0004723) |
| 0.0 | 0.2 | GO:0032422 | purine-rich negative regulatory element binding(GO:0032422) |
| 0.0 | 0.3 | GO:0003988 | acetyl-CoA C-acyltransferase activity(GO:0003988) |
| 0.0 | 0.9 | GO:0005104 | fibroblast growth factor receptor binding(GO:0005104) |
| 0.0 | 0.6 | GO:0019992 | diacylglycerol binding(GO:0019992) |
| 0.0 | 0.1 | GO:0071074 | eukaryotic initiation factor eIF2 binding(GO:0071074) |
| 0.0 | 0.4 | GO:0071933 | Arp2/3 complex binding(GO:0071933) |
| 0.0 | 0.2 | GO:0001640 | adenylate cyclase inhibiting G-protein coupled glutamate receptor activity(GO:0001640) G-protein coupled glutamate receptor activity(GO:0098988) |
| 0.0 | 0.4 | GO:0015095 | magnesium ion transmembrane transporter activity(GO:0015095) |
| 0.0 | 0.8 | GO:1905030 | voltage-gated sodium channel activity(GO:0005248) voltage-gated ion channel activity involved in regulation of postsynaptic membrane potential(GO:1905030) |
| 0.0 | 0.2 | GO:0030613 | oxidoreductase activity, acting on phosphorus or arsenic in donors(GO:0030613) oxidoreductase activity, acting on phosphorus or arsenic in donors, disulfide as acceptor(GO:0030614) |
| 0.0 | 0.7 | GO:0008331 | high voltage-gated calcium channel activity(GO:0008331) |
| 0.0 | 0.1 | GO:0015142 | citrate transmembrane transporter activity(GO:0015137) tricarboxylic acid transmembrane transporter activity(GO:0015142) |
| 0.0 | 0.8 | GO:0071837 | HMG box domain binding(GO:0071837) |
| 0.0 | 0.2 | GO:0008046 | axon guidance receptor activity(GO:0008046) |
| 0.0 | 0.7 | GO:0019198 | transmembrane receptor protein tyrosine phosphatase activity(GO:0005001) transmembrane receptor protein phosphatase activity(GO:0019198) |
| 0.0 | 0.1 | GO:0050501 | hyaluronan synthase activity(GO:0050501) |
| 0.0 | 0.3 | GO:0005522 | profilin binding(GO:0005522) |
| 0.0 | 0.1 | GO:0004571 | mannosyl-oligosaccharide 1,2-alpha-mannosidase activity(GO:0004571) |
| 0.0 | 0.1 | GO:0017089 | glycolipid transporter activity(GO:0017089) |
| 0.0 | 0.0 | GO:0047025 | NAD(P)H dehydrogenase (quinone) activity(GO:0003955) 3-oxoacyl-[acyl-carrier-protein] reductase (NADH) activity(GO:0047025) |
| 0.0 | 0.3 | GO:0038036 | sphingosine-1-phosphate receptor activity(GO:0038036) |
| 0.0 | 0.3 | GO:0008603 | cAMP-dependent protein kinase regulator activity(GO:0008603) |
| 0.0 | 1.2 | GO:0019003 | GDP binding(GO:0019003) |
| 0.0 | 0.3 | GO:0004716 | receptor signaling protein tyrosine kinase activity(GO:0004716) |
| 0.0 | 0.2 | GO:0016413 | O-acetyltransferase activity(GO:0016413) |
| 0.0 | 0.7 | GO:0043015 | gamma-tubulin binding(GO:0043015) |
| 0.0 | 0.4 | GO:0005523 | tropomyosin binding(GO:0005523) |
| 0.0 | 0.3 | GO:0004691 | cAMP-dependent protein kinase activity(GO:0004691) |
| 0.0 | 0.1 | GO:0008321 | Ral guanyl-nucleotide exchange factor activity(GO:0008321) |
| 0.0 | 0.1 | GO:0030160 | GKAP/Homer scaffold activity(GO:0030160) |
| 0.0 | 0.1 | GO:0004694 | eukaryotic translation initiation factor 2alpha kinase activity(GO:0004694) |
| 0.0 | 0.4 | GO:0008510 | sodium:bicarbonate symporter activity(GO:0008510) |
| 0.0 | 0.1 | GO:0017161 | phosphatidylinositol-3,4-bisphosphate 4-phosphatase activity(GO:0016316) inositol-1,3,4-trisphosphate 4-phosphatase activity(GO:0017161) phosphatidylinositol-4,5-bisphosphate 4-phosphatase activity(GO:0034597) inositol-3,4-bisphosphate 4-phosphatase activity(GO:0052828) |
| 0.0 | 0.0 | GO:0050405 | [hydroxymethylglutaryl-CoA reductase (NADPH)] kinase activity(GO:0047322) [acetyl-CoA carboxylase] kinase activity(GO:0050405) |
| 0.0 | 0.1 | GO:0047179 | platelet-activating factor acetyltransferase activity(GO:0047179) |
| 0.0 | 0.2 | GO:0004865 | protein serine/threonine phosphatase inhibitor activity(GO:0004865) |
| 0.0 | 0.3 | GO:0000062 | fatty-acyl-CoA binding(GO:0000062) |
Gene overrepresentation in curated gene sets: canonical pathways category:
| Log-likelihood per target | Total log-likelihood | Term | Description |
|---|---|---|---|
| 0.0 | 1.8 | PID LIS1 PATHWAY | Lissencephaly gene (LIS1) in neuronal migration and development |
| 0.0 | 0.4 | PID INTEGRIN5 PATHWAY | Beta5 beta6 beta7 and beta8 integrin cell surface interactions |
| 0.0 | 1.2 | PID INSULIN GLUCOSE PATHWAY | Insulin-mediated glucose transport |
| 0.0 | 0.8 | PID IL8 CXCR1 PATHWAY | IL8- and CXCR1-mediated signaling events |
| 0.0 | 1.6 | PID EPHB FWD PATHWAY | EPHB forward signaling |
| 0.0 | 0.5 | SA G1 AND S PHASES | Cdk2, 4, and 6 bind cyclin D in G1, while cdk2/cyclin E promotes the G1/S transition. |
| 0.0 | 0.7 | PID ERBB NETWORK PATHWAY | ErbB receptor signaling network |
| 0.0 | 0.3 | PID SYNDECAN 3 PATHWAY | Syndecan-3-mediated signaling events |
| 0.0 | 0.8 | PID CDC42 REG PATHWAY | Regulation of CDC42 activity |
| 0.0 | 1.5 | PID P75 NTR PATHWAY | p75(NTR)-mediated signaling |
| 0.0 | 0.5 | PID MYC PATHWAY | C-MYC pathway |
Gene overrepresentation in curated gene sets: REACTOME pathways category:
| Log-likelihood per target | Total log-likelihood | Term | Description |
|---|---|---|---|
| 0.1 | 1.6 | REACTOME ABCA TRANSPORTERS IN LIPID HOMEOSTASIS | Genes involved in ABCA transporters in lipid homeostasis |
| 0.1 | 3.5 | REACTOME INTERACTION BETWEEN L1 AND ANKYRINS | Genes involved in Interaction between L1 and Ankyrins |
| 0.0 | 0.9 | REACTOME SIGNALING BY FGFR3 MUTANTS | Genes involved in Signaling by FGFR3 mutants |
| 0.0 | 1.7 | REACTOME KINESINS | Genes involved in Kinesins |
| 0.0 | 0.9 | REACTOME DSCAM INTERACTIONS | Genes involved in DSCAM interactions |
| 0.0 | 2.0 | REACTOME ADHERENS JUNCTIONS INTERACTIONS | Genes involved in Adherens junctions interactions |
| 0.0 | 1.4 | REACTOME TRAFFICKING OF GLUR2 CONTAINING AMPA RECEPTORS | Genes involved in Trafficking of GluR2-containing AMPA receptors |
| 0.0 | 0.5 | REACTOME P38MAPK EVENTS | Genes involved in p38MAPK events |
| 0.0 | 0.4 | REACTOME PROSTANOID LIGAND RECEPTORS | Genes involved in Prostanoid ligand receptors |
| 0.0 | 0.8 | REACTOME GABA SYNTHESIS RELEASE REUPTAKE AND DEGRADATION | Genes involved in GABA synthesis, release, reuptake and degradation |
| 0.0 | 1.2 | REACTOME GABA A RECEPTOR ACTIVATION | Genes involved in GABA A receptor activation |
| 0.0 | 1.0 | REACTOME PLATELET CALCIUM HOMEOSTASIS | Genes involved in Platelet calcium homeostasis |
| 0.0 | 0.0 | REACTOME VIF MEDIATED DEGRADATION OF APOBEC3G | Genes involved in Vif-mediated degradation of APOBEC3G |
| 0.0 | 1.3 | REACTOME ION TRANSPORT BY P TYPE ATPASES | Genes involved in Ion transport by P-type ATPases |
| 0.0 | 0.5 | REACTOME REGULATION OF PYRUVATE DEHYDROGENASE PDH COMPLEX | Genes involved in Regulation of pyruvate dehydrogenase (PDH) complex |
| 0.0 | 0.9 | REACTOME SIGNALING BY HIPPO | Genes involved in Signaling by Hippo |
| 0.0 | 0.7 | REACTOME OTHER SEMAPHORIN INTERACTIONS | Genes involved in Other semaphorin interactions |
| 0.0 | 1.0 | REACTOME SPHINGOLIPID DE NOVO BIOSYNTHESIS | Genes involved in Sphingolipid de novo biosynthesis |
| 0.0 | 1.1 | REACTOME RAP1 SIGNALLING | Genes involved in Rap1 signalling |
| 0.0 | 0.9 | REACTOME GLUTAMATE NEUROTRANSMITTER RELEASE CYCLE | Genes involved in Glutamate Neurotransmitter Release Cycle |
| 0.0 | 0.7 | REACTOME SHC1 EVENTS IN ERBB4 SIGNALING | Genes involved in SHC1 events in ERBB4 signaling |
| 0.0 | 0.6 | REACTOME SYNTHESIS SECRETION AND INACTIVATION OF GLP1 | Genes involved in Synthesis, Secretion, and Inactivation of Glucagon-like Peptide-1 (GLP-1) |
| 0.0 | 0.5 | REACTOME TERMINATION OF O GLYCAN BIOSYNTHESIS | Genes involved in Termination of O-glycan biosynthesis |
| 0.0 | 0.3 | REACTOME VITAMIN B5 PANTOTHENATE METABOLISM | Genes involved in Vitamin B5 (pantothenate) metabolism |
| 0.0 | 0.4 | REACTOME N GLYCAN ANTENNAE ELONGATION | Genes involved in N-Glycan antennae elongation |
| 0.0 | 0.6 | REACTOME SYNTHESIS AND INTERCONVERSION OF NUCLEOTIDE DI AND TRIPHOSPHATES | Genes involved in Synthesis and interconversion of nucleotide di- and triphosphates |
| 0.0 | 0.2 | REACTOME MEMBRANE BINDING AND TARGETTING OF GAG PROTEINS | Genes involved in Membrane binding and targetting of GAG proteins |
| 0.0 | 1.3 | REACTOME AMINO ACID AND OLIGOPEPTIDE SLC TRANSPORTERS | Genes involved in Amino acid and oligopeptide SLC transporters |
| 0.0 | 1.2 | REACTOME LOSS OF NLP FROM MITOTIC CENTROSOMES | Genes involved in Loss of Nlp from mitotic centrosomes |
| 0.0 | 0.5 | REACTOME SYNTHESIS OF PA | Genes involved in Synthesis of PA |
| 0.0 | 0.3 | REACTOME PLATELET SENSITIZATION BY LDL | Genes involved in Platelet sensitization by LDL |
| 0.0 | 0.8 | REACTOME VOLTAGE GATED POTASSIUM CHANNELS | Genes involved in Voltage gated Potassium channels |