Project
Illumina Body Map 2 (GSE30611)
Navigation
Downloads
Results for UUGGCAC
Z-value: 0.89
Motif logo

miRNA associated with seed UUGGCAC
| Name | miRBASE accession |
|---|---|
|
hsa-miR-1271-5p
|
MIMAT0005796 |
|
hsa-miR-96-5p
|
MIMAT0000095 |
Activity profile of UUGGCAC motif
Sorted Z-values of UUGGCAC motif
| Promoter | Log-likelihood | Transcript | Gene | Gene Info |
|---|---|---|---|---|
| chr4_-_176002332 | 5.04 |
ENST00000280187.11
ENST00000512509.5 |
GPM6A
|
glycoprotein M6A |
| chrX_-_13938618 | 4.43 |
ENST00000454189.6
|
GPM6B
|
glycoprotein M6B |
| chr3_+_115623502 | 4.40 |
ENST00000305124.11
ENST00000393780.3 |
GAP43
|
growth associated protein 43 |
| chr1_-_20486197 | 3.77 |
ENST00000375078.4
|
CAMK2N1
|
calcium/calmodulin dependent protein kinase II inhibitor 1 |
| chr5_+_174045673 | 3.76 |
ENST00000303177.8
ENST00000519867.5 |
NSG2
|
neuronal vesicle trafficking associated 2 |
| chr16_+_77788554 | 3.73 |
ENST00000302536.3
|
VAT1L
|
vesicle amine transport 1 like |
| chr12_+_57550027 | 3.62 |
ENST00000674619.1
ENST00000676359.1 ENST00000286452.5 ENST00000455537.7 ENST00000676457.1 |
KIF5A
|
kinesin family member 5A |
| chr9_+_4490388 | 3.45 |
ENST00000262352.8
|
SLC1A1
|
solute carrier family 1 member 1 |
| chr6_+_138161932 | 3.37 |
ENST00000251691.5
|
ARFGEF3
|
ARFGEF family member 3 |
| chr5_+_58583068 | 3.29 |
ENST00000282878.6
|
RAB3C
|
RAB3C, member RAS oncogene family |
| chr7_+_141074038 | 3.14 |
ENST00000565468.6
ENST00000610315.1 |
TMEM178B
|
transmembrane protein 178B |
| chr2_+_161416273 | 3.01 |
ENST00000389554.8
|
TBR1
|
T-box brain transcription factor 1 |
| chr3_+_84958963 | 2.86 |
ENST00000383699.8
|
CADM2
|
cell adhesion molecule 2 |
| chr5_+_72107453 | 2.85 |
ENST00000296755.12
ENST00000511641.2 |
MAP1B
|
microtubule associated protein 1B |
| chr5_+_153490655 | 2.79 |
ENST00000518142.5
ENST00000285900.10 |
GRIA1
|
glutamate ionotropic receptor AMPA type subunit 1 |
| chr17_-_80476597 | 2.69 |
ENST00000306773.5
|
NPTX1
|
neuronal pentraxin 1 |
| chr1_+_205504592 | 2.69 |
ENST00000506784.5
ENST00000360066.6 |
CDK18
|
cyclin dependent kinase 18 |
| chr2_-_101387453 | 2.68 |
ENST00000324768.6
|
CREG2
|
cellular repressor of E1A stimulated genes 2 |
| chr10_+_103277129 | 2.64 |
ENST00000369849.9
|
INA
|
internexin neuronal intermediate filament protein alpha |
| chr3_-_170586056 | 2.56 |
ENST00000231706.6
|
SLC7A14
|
solute carrier family 7 member 14 |
| chrX_+_102712438 | 2.50 |
ENST00000486814.2
ENST00000535209.6 ENST00000543253.6 ENST00000332262.10 ENST00000483720.6 |
GPRASP2
|
G protein-coupled receptor associated sorting protein 2 |
| chr2_+_218959635 | 2.50 |
ENST00000302625.6
|
CDK5R2
|
cyclin dependent kinase 5 regulatory subunit 2 |
| chr9_-_101487091 | 2.48 |
ENST00000374847.5
|
PGAP4
|
post-GPI attachment to proteins GalNAc transferase 4 |
| chr10_+_59176600 | 2.39 |
ENST00000373880.9
|
PHYHIPL
|
phytanoyl-CoA 2-hydroxylase interacting protein like |
| chr2_+_231037500 | 2.38 |
ENST00000373640.5
|
C2orf72
|
chromosome 2 open reading frame 72 |
| chr2_-_44361754 | 2.33 |
ENST00000409272.5
ENST00000410081.5 ENST00000541738.5 |
PREPL
|
prolyl endopeptidase like |
| chr3_-_133895867 | 2.25 |
ENST00000285208.9
|
RAB6B
|
RAB6B, member RAS oncogene family |
| chr10_-_59709842 | 2.23 |
ENST00000395348.8
|
SLC16A9
|
solute carrier family 16 member 9 |
| chr12_-_106138946 | 2.22 |
ENST00000261402.7
|
NUAK1
|
NUAK family kinase 1 |
| chr4_+_183905266 | 2.20 |
ENST00000308497.9
|
STOX2
|
storkhead box 2 |
| chr1_-_40665654 | 2.19 |
ENST00000372684.8
|
RIMS3
|
regulating synaptic membrane exocytosis 3 |
| chr14_-_74084393 | 2.17 |
ENST00000350259.8
ENST00000553458.6 |
ALDH6A1
|
aldehyde dehydrogenase 6 family member A1 |
| chrX_-_153886132 | 2.14 |
ENST00000370055.5
ENST00000370060.7 ENST00000420165.5 |
L1CAM
|
L1 cell adhesion molecule |
| chr14_+_32939243 | 2.10 |
ENST00000346562.6
ENST00000548645.5 ENST00000356141.8 ENST00000357798.9 |
NPAS3
|
neuronal PAS domain protein 3 |
| chr8_+_79611036 | 2.09 |
ENST00000220876.12
ENST00000518111.5 |
STMN2
|
stathmin 2 |
| chr20_-_51768327 | 2.08 |
ENST00000311637.9
ENST00000338821.6 |
ATP9A
|
ATPase phospholipid transporting 9A (putative) |
| chr6_-_6006878 | 2.03 |
ENST00000244766.7
|
NRN1
|
neuritin 1 |
| chr1_+_177170916 | 2.00 |
ENST00000361539.5
|
BRINP2
|
BMP/retinoic acid inducible neural specific 2 |
| chr8_+_64580357 | 1.99 |
ENST00000321870.3
|
BHLHE22
|
basic helix-loop-helix family member e22 |
| chr13_+_57631735 | 1.97 |
ENST00000377918.8
|
PCDH17
|
protocadherin 17 |
| chr7_+_98617275 | 1.92 |
ENST00000265634.4
|
NPTX2
|
neuronal pentraxin 2 |
| chr4_+_85475131 | 1.92 |
ENST00000395184.6
|
ARHGAP24
|
Rho GTPase activating protein 24 |
| chr22_+_20965108 | 1.91 |
ENST00000399167.6
ENST00000399163.6 |
AIFM3
|
apoptosis inducing factor mitochondria associated 3 |
| chr1_+_42380772 | 1.90 |
ENST00000431473.4
ENST00000410070.6 |
RIMKLA
|
ribosomal modification protein rimK like family member A |
| chr17_+_7407838 | 1.89 |
ENST00000302926.7
|
NLGN2
|
neuroligin 2 |
| chr16_+_8720706 | 1.86 |
ENST00000425191.6
ENST00000569156.5 |
ABAT
|
4-aminobutyrate aminotransferase |
| chr2_+_172735912 | 1.83 |
ENST00000409036.5
|
RAPGEF4
|
Rap guanine nucleotide exchange factor 4 |
| chr4_+_133149278 | 1.82 |
ENST00000264360.7
|
PCDH10
|
protocadherin 10 |
| chr2_+_206443496 | 1.82 |
ENST00000264377.8
|
ADAM23
|
ADAM metallopeptidase domain 23 |
| chr1_+_109249530 | 1.81 |
ENST00000271332.4
|
CELSR2
|
cadherin EGF LAG seven-pass G-type receptor 2 |
| chr10_-_15371225 | 1.80 |
ENST00000378116.9
|
FAM171A1
|
family with sequence similarity 171 member A1 |
| chr1_+_99264473 | 1.78 |
ENST00000370185.9
|
PLPPR4
|
phospholipid phosphatase related 4 |
| chr7_-_82443766 | 1.78 |
ENST00000356860.8
|
CACNA2D1
|
calcium voltage-gated channel auxiliary subunit alpha2delta 1 |
| chr11_-_45665578 | 1.78 |
ENST00000308064.7
|
CHST1
|
carbohydrate sulfotransferase 1 |
| chrX_+_111096136 | 1.77 |
ENST00000372007.10
|
PAK3
|
p21 (RAC1) activated kinase 3 |
| chr6_+_122996227 | 1.77 |
ENST00000275162.10
|
CLVS2
|
clavesin 2 |
| chr4_+_47031551 | 1.76 |
ENST00000295454.8
|
GABRB1
|
gamma-aminobutyric acid type A receptor subunit beta1 |
| chr2_+_165469647 | 1.75 |
ENST00000421875.5
ENST00000314499.11 ENST00000409664.5 ENST00000651982.1 |
CSRNP3
|
cysteine and serine rich nuclear protein 3 |
| chr13_-_102401599 | 1.75 |
ENST00000376131.8
|
FGF14
|
fibroblast growth factor 14 |
| chr18_+_23135452 | 1.72 |
ENST00000580153.5
ENST00000256925.12 |
CABLES1
|
Cdk5 and Abl enzyme substrate 1 |
| chr14_+_104865256 | 1.71 |
ENST00000414716.8
ENST00000556508.5 ENST00000453495.2 |
CEP170B
|
centrosomal protein 170B |
| chr7_-_112206380 | 1.69 |
ENST00000437633.6
ENST00000428084.6 |
DOCK4
|
dedicator of cytokinesis 4 |
| chr3_-_56468346 | 1.68 |
ENST00000288221.11
|
ERC2
|
ELKS/RAB6-interacting/CAST family member 2 |
| chr11_+_118606428 | 1.68 |
ENST00000361417.6
|
PHLDB1
|
pleckstrin homology like domain family B member 1 |
| chr1_-_205943449 | 1.68 |
ENST00000367135.8
ENST00000367134.2 |
SLC26A9
|
solute carrier family 26 member 9 |
| chr11_-_115504389 | 1.66 |
ENST00000545380.5
ENST00000452722.7 ENST00000331581.11 ENST00000537058.5 ENST00000536727.5 ENST00000542447.6 |
CADM1
|
cell adhesion molecule 1 |
| chr2_+_45651650 | 1.66 |
ENST00000306156.8
|
PRKCE
|
protein kinase C epsilon |
| chr7_-_158587773 | 1.65 |
ENST00000389413.7
ENST00000409483.5 ENST00000389418.9 |
PTPRN2
|
protein tyrosine phosphatase receptor type N2 |
| chr7_+_107470050 | 1.64 |
ENST00000304402.6
|
GPR22
|
G protein-coupled receptor 22 |
| chr10_-_131982006 | 1.64 |
ENST00000368636.8
|
BNIP3
|
BCL2 interacting protein 3 |
| chr3_-_119146014 | 1.62 |
ENST00000441144.6
ENST00000425327.6 |
IGSF11
|
immunoglobulin superfamily member 11 |
| chr19_-_33064872 | 1.61 |
ENST00000254260.8
|
RHPN2
|
rhophilin Rho GTPase binding protein 2 |
| chr11_+_121292757 | 1.61 |
ENST00000527762.5
ENST00000534230.5 ENST00000264027.9 ENST00000392789.2 |
SC5D
|
sterol-C5-desaturase |
| chr13_+_21671067 | 1.60 |
ENST00000382353.6
|
FGF9
|
fibroblast growth factor 9 |
| chr12_-_13981544 | 1.60 |
ENST00000609686.4
|
GRIN2B
|
glutamate ionotropic receptor NMDA type subunit 2B |
| chr10_+_102869442 | 1.60 |
ENST00000369880.8
ENST00000615257.1 |
AS3MT
|
arsenite methyltransferase |
| chr1_+_200739542 | 1.58 |
ENST00000358823.6
|
CAMSAP2
|
calmodulin regulated spectrin associated protein family member 2 |
| chr10_+_26216766 | 1.58 |
ENST00000376261.8
|
GAD2
|
glutamate decarboxylase 2 |
| chr5_-_79512794 | 1.57 |
ENST00000282260.10
ENST00000508576.5 ENST00000535690.1 |
HOMER1
|
homer scaffold protein 1 |
| chr12_-_95790755 | 1.57 |
ENST00000343702.9
ENST00000344911.8 |
NTN4
|
netrin 4 |
| chr10_-_86366784 | 1.56 |
ENST00000327946.12
|
GRID1
|
glutamate ionotropic receptor delta type subunit 1 |
| chr15_+_59438149 | 1.55 |
ENST00000288228.10
ENST00000559628.5 ENST00000557914.5 ENST00000560474.5 |
FAM81A
|
family with sequence similarity 81 member A |
| chr20_+_34704336 | 1.54 |
ENST00000374809.6
ENST00000374810.8 ENST00000451665.5 |
TP53INP2
|
tumor protein p53 inducible nuclear protein 2 |
| chr2_+_46297397 | 1.53 |
ENST00000263734.5
|
EPAS1
|
endothelial PAS domain protein 1 |
| chr8_-_80874771 | 1.52 |
ENST00000327835.7
|
ZNF704
|
zinc finger protein 704 |
| chr17_+_74326190 | 1.51 |
ENST00000551294.5
ENST00000389916.5 |
KIF19
|
kinesin family member 19 |
| chr4_-_16898619 | 1.50 |
ENST00000502640.5
ENST00000304523.10 ENST00000506732.1 |
LDB2
|
LIM domain binding 2 |
| chr10_+_126905409 | 1.50 |
ENST00000280333.9
ENST00000623213.2 |
DOCK1
|
dedicator of cytokinesis 1 |
| chr8_-_133297092 | 1.49 |
ENST00000522890.5
ENST00000675983.1 ENST00000518176.5 ENST00000323851.13 ENST00000522476.5 ENST00000518066.5 ENST00000521544.5 ENST00000674605.1 ENST00000518480.5 ENST00000523892.5 |
NDRG1
|
N-myc downstream regulated 1 |
| chr1_-_193186599 | 1.49 |
ENST00000367434.5
|
B3GALT2
|
beta-1,3-galactosyltransferase 2 |
| chr1_+_113390495 | 1.48 |
ENST00000307546.14
|
MAGI3
|
membrane associated guanylate kinase, WW and PDZ domain containing 3 |
| chr6_+_68635273 | 1.47 |
ENST00000370598.6
|
ADGRB3
|
adhesion G protein-coupled receptor B3 |
| chr1_+_77779618 | 1.47 |
ENST00000370791.7
ENST00000443751.3 ENST00000645756.1 ENST00000643390.1 ENST00000642959.1 |
MIGA1
|
mitoguardin 1 |
| chr1_+_4654601 | 1.46 |
ENST00000378191.5
|
AJAP1
|
adherens junctions associated protein 1 |
| chr3_+_61561561 | 1.46 |
ENST00000474889.6
|
PTPRG
|
protein tyrosine phosphatase receptor type G |
| chr4_+_41990496 | 1.46 |
ENST00000264451.12
|
SLC30A9
|
solute carrier family 30 member 9 |
| chr8_-_40897814 | 1.44 |
ENST00000297737.11
ENST00000315769.11 |
ZMAT4
|
zinc finger matrin-type 4 |
| chr13_+_98142552 | 1.43 |
ENST00000595437.5
|
FARP1
|
FERM, ARH/RhoGEF and pleckstrin domain protein 1 |
| chr3_+_138347648 | 1.43 |
ENST00000614350.4
ENST00000289104.8 |
MRAS
|
muscle RAS oncogene homolog |
| chr10_+_93758063 | 1.42 |
ENST00000627699.1
ENST00000371413.4 |
LGI1
|
leucine rich glioma inactivated 1 |
| chr2_+_26346086 | 1.41 |
ENST00000613142.4
ENST00000260585.12 ENST00000447170.1 |
SELENOI
|
selenoprotein I |
| chr12_-_57520480 | 1.41 |
ENST00000642841.1
ENST00000547303.5 ENST00000552740.5 ENST00000547526.1 ENST00000346473.8 ENST00000551116.5 |
ENSG00000285133.1
DDIT3
|
novel protein DNA damage inducible transcript 3 |
| chr19_-_45973863 | 1.40 |
ENST00000263257.6
|
NOVA2
|
NOVA alternative splicing regulator 2 |
| chr8_-_11466740 | 1.39 |
ENST00000284486.9
|
FAM167A
|
family with sequence similarity 167 member A |
| chr21_+_20998399 | 1.38 |
ENST00000400546.6
|
NCAM2
|
neural cell adhesion molecule 2 |
| chr9_-_109320949 | 1.38 |
ENST00000374557.4
|
EPB41L4B
|
erythrocyte membrane protein band 4.1 like 4B |
| chr1_+_76074698 | 1.36 |
ENST00000328299.4
|
ST6GALNAC3
|
ST6 N-acetylgalactosaminide alpha-2,6-sialyltransferase 3 |
| chr7_+_87934143 | 1.35 |
ENST00000398204.8
|
ADAM22
|
ADAM metallopeptidase domain 22 |
| chr15_+_22786610 | 1.35 |
ENST00000337435.9
|
NIPA1
|
NIPA magnesium transporter 1 |
| chr18_-_61892997 | 1.35 |
ENST00000312828.4
|
RNF152
|
ring finger protein 152 |
| chr9_-_137028223 | 1.34 |
ENST00000341511.11
|
ABCA2
|
ATP binding cassette subfamily A member 2 |
| chr3_+_39809602 | 1.34 |
ENST00000302541.11
ENST00000396217.7 |
MYRIP
|
myosin VIIA and Rab interacting protein |
| chr7_-_83162857 | 1.34 |
ENST00000333891.14
|
PCLO
|
piccolo presynaptic cytomatrix protein |
| chr16_-_19884828 | 1.33 |
ENST00000300571.7
ENST00000570142.5 ENST00000562469.5 |
GPRC5B
|
G protein-coupled receptor class C group 5 member B |
| chr8_+_28494190 | 1.32 |
ENST00000537916.2
ENST00000240093.8 ENST00000523546.1 |
FZD3
|
frizzled class receptor 3 |
| chrX_-_103832204 | 1.32 |
ENST00000674363.1
ENST00000674162.1 ENST00000674338.1 ENST00000674274.1 ENST00000674271.1 ENST00000674265.1 ENST00000674212.1 ENST00000674255.1 ENST00000674342.1 ENST00000674430.1 ENST00000243298.3 |
ENSG00000288597.1
RAB9B
|
novel transcript RAB9B, member RAS oncogene family |
| chr2_+_165239388 | 1.32 |
ENST00000424833.5
ENST00000375437.7 ENST00000631182.3 |
SCN2A
|
sodium voltage-gated channel alpha subunit 2 |
| chr12_-_57237090 | 1.31 |
ENST00000556732.1
|
NDUFA4L2
|
NDUFA4 mitochondrial complex associated like 2 |
| chr11_-_31811314 | 1.30 |
ENST00000640368.2
ENST00000379123.10 ENST00000379115.9 ENST00000419022.6 ENST00000643871.1 ENST00000640610.1 ENST00000639034.2 |
PAX6
|
paired box 6 |
| chr1_+_50108856 | 1.30 |
ENST00000650764.1
ENST00000494555.2 ENST00000371824.7 ENST00000371823.8 ENST00000652693.1 |
ELAVL4
|
ELAV like RNA binding protein 4 |
| chr1_-_54887161 | 1.29 |
ENST00000535035.6
ENST00000371269.9 ENST00000436604.2 |
DHCR24
|
24-dehydrocholesterol reductase |
| chr20_-_44810539 | 1.29 |
ENST00000372851.8
|
RIMS4
|
regulating synaptic membrane exocytosis 4 |
| chr6_-_57221402 | 1.27 |
ENST00000317483.4
|
RAB23
|
RAB23, member RAS oncogene family |
| chr2_-_183038405 | 1.25 |
ENST00000361354.9
|
NCKAP1
|
NCK associated protein 1 |
| chr2_+_85753984 | 1.23 |
ENST00000306279.4
|
ATOH8
|
atonal bHLH transcription factor 8 |
| chr3_-_134374439 | 1.23 |
ENST00000513145.1
ENST00000249883.10 ENST00000422605.6 |
AMOTL2
|
angiomotin like 2 |
| chr16_-_29899043 | 1.23 |
ENST00000346932.9
ENST00000350527.7 ENST00000568380.1 |
SEZ6L2
|
seizure related 6 homolog like 2 |
| chr12_+_112791933 | 1.21 |
ENST00000551052.5
ENST00000415485.7 |
RPH3A
|
rabphilin 3A |
| chr7_+_30134956 | 1.21 |
ENST00000324453.13
ENST00000409688.1 |
MTURN
|
maturin, neural progenitor differentiation regulator homolog |
| chr7_+_87628355 | 1.20 |
ENST00000338056.7
ENST00000493037.5 |
RUNDC3B
|
RUN domain containing 3B |
| chr1_+_109984756 | 1.19 |
ENST00000393614.8
ENST00000369799.10 |
AHCYL1
|
adenosylhomocysteinase like 1 |
| chr15_+_69298896 | 1.19 |
ENST00000395407.7
ENST00000558684.5 |
PAQR5
|
progestin and adipoQ receptor family member 5 |
| chr9_-_137221323 | 1.19 |
ENST00000391553.2
ENST00000392827.2 |
RNF208
|
ring finger protein 208 |
| chrX_-_115234088 | 1.18 |
ENST00000317135.13
|
LRCH2
|
leucine rich repeats and calponin homology domain containing 2 |
| chr16_-_77435006 | 1.17 |
ENST00000282849.10
|
ADAMTS18
|
ADAM metallopeptidase with thrombospondin type 1 motif 18 |
| chr4_+_144646145 | 1.17 |
ENST00000296575.8
ENST00000434550.2 |
HHIP
|
hedgehog interacting protein |
| chr20_+_11890723 | 1.17 |
ENST00000254977.7
|
BTBD3
|
BTB domain containing 3 |
| chr15_-_44194407 | 1.17 |
ENST00000484674.5
|
FRMD5
|
FERM domain containing 5 |
| chr12_-_103841210 | 1.17 |
ENST00000392876.8
|
NT5DC3
|
5'-nucleotidase domain containing 3 |
| chr7_-_66995576 | 1.16 |
ENST00000246868.7
ENST00000617799.1 |
SBDS
|
SBDS ribosome maturation factor |
| chr5_+_76083360 | 1.14 |
ENST00000502798.7
|
SV2C
|
synaptic vesicle glycoprotein 2C |
| chr17_-_6556447 | 1.14 |
ENST00000421306.7
|
PITPNM3
|
PITPNM family member 3 |
| chr5_+_173888335 | 1.13 |
ENST00000265085.10
|
CPEB4
|
cytoplasmic polyadenylation element binding protein 4 |
| chr5_-_140346596 | 1.12 |
ENST00000230990.7
|
HBEGF
|
heparin binding EGF like growth factor |
| chr17_+_43398984 | 1.11 |
ENST00000320033.5
|
ARL4D
|
ADP ribosylation factor like GTPase 4D |
| chr14_-_93788475 | 1.11 |
ENST00000393140.6
|
PRIMA1
|
proline rich membrane anchor 1 |
| chr6_+_52362088 | 1.09 |
ENST00000635984.1
ENST00000635760.1 ENST00000442253.3 |
EFHC1
PAQR8
|
EF-hand domain containing 1 progestin and adipoQ receptor family member 8 |
| chr13_+_99981775 | 1.07 |
ENST00000376335.8
|
ZIC2
|
Zic family member 2 |
| chr22_+_26169474 | 1.07 |
ENST00000404234.7
ENST00000529632.6 ENST00000360929.7 ENST00000629590.2 ENST00000343706.8 |
SEZ6L
|
seizure related 6 homolog like |
| chr2_-_86337654 | 1.06 |
ENST00000165698.9
|
REEP1
|
receptor accessory protein 1 |
| chr1_-_177164673 | 1.06 |
ENST00000424564.2
ENST00000361833.7 |
ASTN1
|
astrotactin 1 |
| chr3_-_171809770 | 1.05 |
ENST00000331659.2
|
PLD1
|
phospholipase D1 |
| chr5_-_172006817 | 1.05 |
ENST00000296933.10
|
FBXW11
|
F-box and WD repeat domain containing 11 |
| chr5_-_9546066 | 1.05 |
ENST00000382496.10
ENST00000652226.1 |
SEMA5A
|
semaphorin 5A |
| chr12_+_76764109 | 1.04 |
ENST00000426126.7
|
ZDHHC17
|
zinc finger DHHC-type palmitoyltransferase 17 |
| chr13_-_52848632 | 1.03 |
ENST00000377942.7
ENST00000338862.5 |
PCDH8
|
protocadherin 8 |
| chr19_+_42313298 | 1.03 |
ENST00000301204.8
ENST00000673205.1 |
TMEM145
|
transmembrane protein 145 |
| chr2_+_240435652 | 1.02 |
ENST00000264039.7
|
GPC1
|
glypican 1 |
| chr2_+_32277883 | 1.02 |
ENST00000238831.9
|
YIPF4
|
Yip1 domain family member 4 |
| chr12_-_57633136 | 1.02 |
ENST00000341156.9
ENST00000550764.5 ENST00000551220.1 |
B4GALNT1
|
beta-1,4-N-acetyl-galactosaminyltransferase 1 |
| chr22_-_36507022 | 1.02 |
ENST00000216187.10
ENST00000397224.9 ENST00000423980.1 |
FOXRED2
|
FAD dependent oxidoreductase domain containing 2 |
| chr19_+_3094348 | 1.02 |
ENST00000078429.9
|
GNA11
|
G protein subunit alpha 11 |
| chr1_-_44031446 | 1.02 |
ENST00000372310.8
ENST00000466926.1 |
SLC6A9
|
solute carrier family 6 member 9 |
| chr14_-_63045419 | 1.01 |
ENST00000322893.12
|
KCNH5
|
potassium voltage-gated channel subfamily H member 5 |
| chr8_+_57994455 | 1.01 |
ENST00000361488.7
|
FAM110B
|
family with sequence similarity 110 member B |
| chr20_-_56005466 | 1.01 |
ENST00000064571.3
|
CBLN4
|
cerebellin 4 precursor |
| chrX_+_73563190 | 0.99 |
ENST00000373504.10
ENST00000373502.9 |
CHIC1
|
cysteine rich hydrophobic domain 1 |
| chr2_+_167868948 | 0.99 |
ENST00000392690.3
|
B3GALT1
|
beta-1,3-galactosyltransferase 1 |
| chr5_+_144205250 | 0.99 |
ENST00000507359.3
|
KCTD16
|
potassium channel tetramerization domain containing 16 |
| chr1_+_56645299 | 0.98 |
ENST00000371244.9
ENST00000610361.1 |
PRKAA2
|
protein kinase AMP-activated catalytic subunit alpha 2 |
| chr9_+_35162000 | 0.98 |
ENST00000396787.5
ENST00000378495.7 ENST00000635942.1 ENST00000378496.8 |
UNC13B
|
unc-13 homolog B |
| chr3_-_161372821 | 0.97 |
ENST00000617024.1
ENST00000359175.8 |
SPTSSB
|
serine palmitoyltransferase small subunit B |
| chr1_-_154870264 | 0.96 |
ENST00000618040.4
ENST00000271915.9 |
KCNN3
|
potassium calcium-activated channel subfamily N member 3 |
| chr1_+_155127866 | 0.96 |
ENST00000368406.2
ENST00000368407.8 |
EFNA1
|
ephrin A1 |
| chr6_-_34392627 | 0.95 |
ENST00000607016.2
|
NUDT3
|
nudix hydrolase 3 |
| chr2_-_100417608 | 0.95 |
ENST00000264249.8
|
CHST10
|
carbohydrate sulfotransferase 10 |
| chr6_+_96015964 | 0.94 |
ENST00000302103.6
|
FUT9
|
fucosyltransferase 9 |
| chr14_-_103057509 | 0.94 |
ENST00000361246.7
|
CDC42BPB
|
CDC42 binding protein kinase beta |
| chrX_+_12138426 | 0.93 |
ENST00000380682.5
ENST00000675598.1 |
FRMPD4
|
FERM and PDZ domain containing 4 |
| chr14_-_51096029 | 0.93 |
ENST00000298355.7
|
TRIM9
|
tripartite motif containing 9 |
| chr11_-_79441016 | 0.93 |
ENST00000278550.12
|
TENM4
|
teneurin transmembrane protein 4 |
| chr1_-_220272415 | 0.92 |
ENST00000358951.7
|
RAB3GAP2
|
RAB3 GTPase activating non-catalytic protein subunit 2 |
| chr4_+_150582119 | 0.92 |
ENST00000317605.6
|
MAB21L2
|
mab-21 like 2 |
| chr2_+_219544002 | 0.92 |
ENST00000421791.1
ENST00000373883.4 ENST00000451952.1 |
TMEM198
|
transmembrane protein 198 |
| chr14_+_63204436 | 0.91 |
ENST00000316754.8
|
RHOJ
|
ras homolog family member J |
| chr8_+_119873710 | 0.91 |
ENST00000523492.5
ENST00000286234.6 |
DEPTOR
|
DEP domain containing MTOR interacting protein |
| chr8_+_96493803 | 0.91 |
ENST00000518385.5
ENST00000302190.9 |
SDC2
|
syndecan 2 |
| chr1_-_230868474 | 0.91 |
ENST00000366663.10
|
C1orf198
|
chromosome 1 open reading frame 198 |
| chr7_-_51316754 | 0.90 |
ENST00000632460.1
ENST00000441453.5 ENST00000648294.1 ENST00000265136.12 ENST00000395542.6 ENST00000395540.6 |
COBL
|
cordon-bleu WH2 repeat protein |
| chr1_-_116667668 | 0.89 |
ENST00000369486.8
ENST00000369483.5 |
IGSF3
|
immunoglobulin superfamily member 3 |
| chr8_-_80171496 | 0.88 |
ENST00000379096.9
ENST00000518937.6 |
TPD52
|
tumor protein D52 |
| chr5_-_116574802 | 0.87 |
ENST00000343348.11
|
SEMA6A
|
semaphorin 6A |
| chrX_+_23334841 | 0.86 |
ENST00000379361.5
|
PTCHD1
|
patched domain containing 1 |
| chr19_+_751104 | 0.86 |
ENST00000215582.8
|
MISP
|
mitotic spindle positioning |
| chr9_-_23821275 | 0.86 |
ENST00000380110.8
|
ELAVL2
|
ELAV like RNA binding protein 2 |
| chr9_-_71121596 | 0.85 |
ENST00000377110.9
ENST00000377111.8 ENST00000677713.2 |
TRPM3
|
transient receptor potential cation channel subfamily M member 3 |
| chr7_-_76358982 | 0.85 |
ENST00000307630.5
|
YWHAG
|
tyrosine 3-monooxygenase/tryptophan 5-monooxygenase activation protein gamma |
| chr15_-_72197772 | 0.85 |
ENST00000309731.12
|
GRAMD2A
|
GRAM domain containing 2A |
| chr4_+_127632926 | 0.84 |
ENST00000335251.11
|
INTU
|
inturned planar cell polarity protein |
| chr10_-_117375407 | 0.84 |
ENST00000334464.7
|
PDZD8
|
PDZ domain containing 8 |
Network of associatons between targets according to the STRING database.

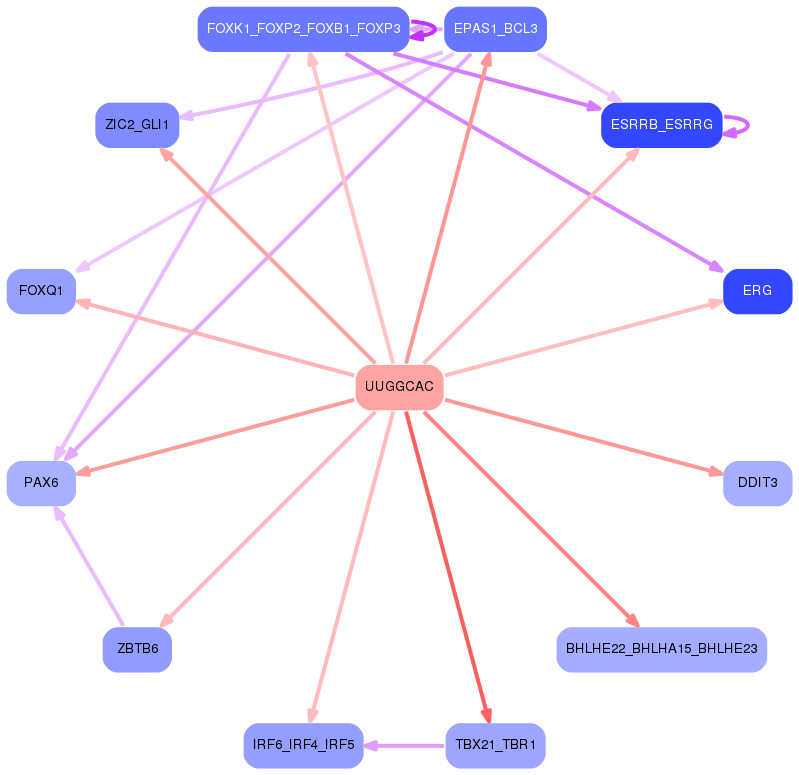
First level regulatory network of UUGGCAC
Gene Ontology Analysis
Gene overrepresentation in biological process category:
| Log-likelihood per target | Total log-likelihood | Term | Description |
|---|---|---|---|
| 0.9 | 3.6 | GO:0098971 | anterograde dendritic transport of neurotransmitter receptor complex(GO:0098971) |
| 0.8 | 2.5 | GO:0021722 | superior olivary nucleus development(GO:0021718) superior olivary nucleus maturation(GO:0021722) |
| 0.7 | 2.0 | GO:1990709 | presynaptic active zone organization(GO:1990709) |
| 0.6 | 1.7 | GO:0035669 | TRAM-dependent toll-like receptor signaling pathway(GO:0035668) TRAM-dependent toll-like receptor 4 signaling pathway(GO:0035669) |
| 0.5 | 2.2 | GO:0006210 | pyrimidine nucleobase catabolic process(GO:0006208) thymine catabolic process(GO:0006210) thymine metabolic process(GO:0019859) |
| 0.5 | 1.6 | GO:0036515 | serotonergic neuron axon guidance(GO:0036515) |
| 0.5 | 2.1 | GO:0031117 | positive regulation of microtubule depolymerization(GO:0031117) |
| 0.5 | 2.9 | GO:0033489 | cholesterol biosynthetic process via desmosterol(GO:0033489) cholesterol biosynthetic process via lathosterol(GO:0033490) |
| 0.4 | 1.3 | GO:0098928 | presynaptic signal transduction(GO:0098928) presynapse to nucleus signaling pathway(GO:0099526) |
| 0.4 | 3.1 | GO:0021764 | amygdala development(GO:0021764) |
| 0.4 | 2.8 | GO:0099566 | regulation of postsynaptic cytosolic calcium ion concentration(GO:0099566) |
| 0.3 | 4.4 | GO:0051611 | negative regulation of neurotransmitter uptake(GO:0051581) regulation of serotonin uptake(GO:0051611) negative regulation of serotonin uptake(GO:0051612) |
| 0.3 | 1.0 | GO:0061536 | glycine secretion(GO:0061536) glycine secretion, neurotransmission(GO:0061537) |
| 0.3 | 4.4 | GO:0016198 | axon choice point recognition(GO:0016198) |
| 0.3 | 1.0 | GO:0010808 | positive regulation of synaptic vesicle priming(GO:0010808) |
| 0.3 | 1.6 | GO:0007206 | phospholipase C-activating G-protein coupled glutamate receptor signaling pathway(GO:0007206) |
| 0.3 | 3.4 | GO:0000101 | sulfur amino acid transport(GO:0000101) |
| 0.3 | 0.9 | GO:0032289 | central nervous system myelin formation(GO:0032289) |
| 0.3 | 0.9 | GO:0048669 | collateral sprouting in absence of injury(GO:0048669) |
| 0.3 | 1.5 | GO:0099558 | maintenance of synapse structure(GO:0099558) |
| 0.3 | 1.9 | GO:1904862 | inhibitory synapse assembly(GO:1904862) |
| 0.3 | 1.9 | GO:1904450 | negative regulation of gamma-aminobutyric acid secretion(GO:0014053) aspartate secretion(GO:0061528) regulation of aspartate secretion(GO:1904448) positive regulation of aspartate secretion(GO:1904450) |
| 0.3 | 0.5 | GO:0002537 | nitric oxide production involved in inflammatory response(GO:0002537) |
| 0.3 | 1.8 | GO:0086048 | membrane depolarization during bundle of His cell action potential(GO:0086048) |
| 0.2 | 1.7 | GO:1904694 | negative regulation of vascular smooth muscle contraction(GO:1904694) |
| 0.2 | 1.0 | GO:0014028 | notochord formation(GO:0014028) |
| 0.2 | 0.9 | GO:1903371 | regulation of endoplasmic reticulum tubular network organization(GO:1903371) |
| 0.2 | 0.7 | GO:1902309 | regulation of heart rate by hormone(GO:0003064) negative regulation of peptidyl-serine dephosphorylation(GO:1902309) |
| 0.2 | 3.4 | GO:0060385 | axonogenesis involved in innervation(GO:0060385) |
| 0.2 | 1.6 | GO:0006540 | glutamate decarboxylation to succinate(GO:0006540) |
| 0.2 | 1.6 | GO:0035426 | extracellular matrix-cell signaling(GO:0035426) |
| 0.2 | 0.7 | GO:0061092 | regulation of phospholipid translocation(GO:0061091) positive regulation of phospholipid translocation(GO:0061092) |
| 0.2 | 1.5 | GO:0032380 | regulation of intracellular lipid transport(GO:0032377) regulation of intracellular sterol transport(GO:0032380) regulation of intracellular cholesterol transport(GO:0032383) |
| 0.2 | 1.5 | GO:1903385 | regulation of homophilic cell adhesion(GO:1903385) |
| 0.2 | 2.5 | GO:0019375 | galactosylceramide biosynthetic process(GO:0006682) galactolipid biosynthetic process(GO:0019375) |
| 0.2 | 0.6 | GO:0044335 | canonical Wnt signaling pathway involved in neural crest cell differentiation(GO:0044335) |
| 0.2 | 1.8 | GO:0048842 | positive regulation of axon extension involved in axon guidance(GO:0048842) |
| 0.2 | 1.7 | GO:0042271 | susceptibility to natural killer cell mediated cytotoxicity(GO:0042271) |
| 0.2 | 0.7 | GO:0032474 | otolith morphogenesis(GO:0032474) |
| 0.2 | 1.6 | GO:0008626 | granzyme-mediated apoptotic signaling pathway(GO:0008626) cellular response to cobalt ion(GO:0071279) negative regulation of mitochondrial membrane permeability involved in apoptotic process(GO:1902109) |
| 0.2 | 0.5 | GO:0046041 | ITP metabolic process(GO:0046041) |
| 0.2 | 1.4 | GO:1903026 | negative regulation of RNA polymerase II regulatory region sequence-specific DNA binding(GO:1903026) |
| 0.2 | 2.6 | GO:0060052 | neurofilament cytoskeleton organization(GO:0060052) |
| 0.2 | 1.0 | GO:0030200 | heparan sulfate proteoglycan catabolic process(GO:0030200) |
| 0.2 | 2.2 | GO:0035507 | regulation of myosin-light-chain-phosphatase activity(GO:0035507) |
| 0.2 | 0.7 | GO:1990569 | UDP-N-acetylglucosamine transport(GO:0015788) UDP-N-acetylglucosamine transmembrane transport(GO:1990569) |
| 0.2 | 0.5 | GO:0032707 | negative regulation of interleukin-23 production(GO:0032707) |
| 0.2 | 1.1 | GO:0051541 | elastin metabolic process(GO:0051541) |
| 0.2 | 1.0 | GO:1901907 | diadenosine polyphosphate catabolic process(GO:0015961) diphosphoinositol polyphosphate metabolic process(GO:0071543) diadenosine pentaphosphate metabolic process(GO:1901906) diadenosine pentaphosphate catabolic process(GO:1901907) diadenosine hexaphosphate metabolic process(GO:1901908) diadenosine hexaphosphate catabolic process(GO:1901909) adenosine 5'-(hexahydrogen pentaphosphate) metabolic process(GO:1901910) adenosine 5'-(hexahydrogen pentaphosphate) catabolic process(GO:1901911) |
| 0.2 | 1.5 | GO:0043129 | surfactant homeostasis(GO:0043129) |
| 0.2 | 0.9 | GO:0008218 | bioluminescence(GO:0008218) |
| 0.2 | 1.8 | GO:0021999 | neural plate anterior/posterior regionalization(GO:0021999) |
| 0.1 | 1.2 | GO:0033353 | S-adenosylmethionine cycle(GO:0033353) |
| 0.1 | 1.8 | GO:1901843 | positive regulation of high voltage-gated calcium channel activity(GO:1901843) |
| 0.1 | 0.7 | GO:0098904 | regulation of AV node cell action potential(GO:0098904) |
| 0.1 | 0.5 | GO:0006169 | adenosine salvage(GO:0006169) dATP biosynthetic process(GO:0006175) |
| 0.1 | 1.0 | GO:0019236 | response to pheromone(GO:0019236) |
| 0.1 | 0.6 | GO:1901254 | modulation by host of viral RNA genome replication(GO:0044830) positive regulation of intracellular transport of viral material(GO:1901254) |
| 0.1 | 0.5 | GO:0019074 | viral genome packaging(GO:0019072) viral RNA genome packaging(GO:0019074) |
| 0.1 | 0.4 | GO:1905053 | regulation of base-excision repair(GO:1905051) positive regulation of base-excision repair(GO:1905053) |
| 0.1 | 0.5 | GO:1904381 | Golgi apparatus mannose trimming(GO:1904381) |
| 0.1 | 0.6 | GO:0035544 | negative regulation of SNARE complex assembly(GO:0035544) |
| 0.1 | 0.5 | GO:0040040 | thermosensory behavior(GO:0040040) |
| 0.1 | 0.5 | GO:1905150 | regulation of voltage-gated sodium channel activity(GO:1905150) |
| 0.1 | 2.6 | GO:1903830 | magnesium ion transmembrane transport(GO:1903830) |
| 0.1 | 0.9 | GO:0061299 | retina vasculature morphogenesis in camera-type eye(GO:0061299) |
| 0.1 | 1.0 | GO:0000160 | phosphorelay signal transduction system(GO:0000160) |
| 0.1 | 1.0 | GO:1904220 | regulation of serine C-palmitoyltransferase activity(GO:1904220) |
| 0.1 | 1.2 | GO:0042256 | mature ribosome assembly(GO:0042256) bone marrow development(GO:0048539) |
| 0.1 | 1.3 | GO:2000601 | positive regulation of Arp2/3 complex-mediated actin nucleation(GO:2000601) |
| 0.1 | 5.8 | GO:2000300 | regulation of synaptic vesicle exocytosis(GO:2000300) |
| 0.1 | 0.5 | GO:0061026 | cardiac muscle tissue regeneration(GO:0061026) |
| 0.1 | 2.2 | GO:0046415 | urate metabolic process(GO:0046415) |
| 0.1 | 1.5 | GO:0090232 | positive regulation of spindle checkpoint(GO:0090232) |
| 0.1 | 0.8 | GO:0061709 | reticulophagy(GO:0061709) |
| 0.1 | 1.3 | GO:0030050 | vesicle transport along actin filament(GO:0030050) |
| 0.1 | 0.6 | GO:0097676 | histone H3-K36 dimethylation(GO:0097676) |
| 0.1 | 0.9 | GO:0051835 | positive regulation of synapse structural plasticity(GO:0051835) |
| 0.1 | 1.7 | GO:0019532 | oxalate transport(GO:0019532) |
| 0.1 | 1.5 | GO:0032927 | positive regulation of activin receptor signaling pathway(GO:0032927) |
| 0.1 | 0.3 | GO:0001928 | regulation of exocyst assembly(GO:0001928) regulation of exocyst localization(GO:0060178) |
| 0.1 | 2.6 | GO:0010172 | embryonic body morphogenesis(GO:0010172) |
| 0.1 | 3.8 | GO:0048268 | clathrin coat assembly(GO:0048268) |
| 0.1 | 0.3 | GO:0097477 | lateral motor column neuron migration(GO:0097477) |
| 0.1 | 0.3 | GO:0097119 | postsynaptic density protein 95 clustering(GO:0097119) |
| 0.1 | 0.7 | GO:0036324 | vascular endothelial growth factor receptor-2 signaling pathway(GO:0036324) |
| 0.1 | 1.0 | GO:0032534 | regulation of microvillus assembly(GO:0032534) |
| 0.1 | 4.5 | GO:0035235 | ionotropic glutamate receptor signaling pathway(GO:0035235) |
| 0.1 | 0.5 | GO:0014050 | negative regulation of glutamate secretion(GO:0014050) |
| 0.1 | 1.3 | GO:0008627 | intrinsic apoptotic signaling pathway in response to osmotic stress(GO:0008627) |
| 0.1 | 0.3 | GO:0061763 | multivesicular body-lysosome fusion(GO:0061763) |
| 0.1 | 3.4 | GO:0032012 | regulation of ARF protein signal transduction(GO:0032012) |
| 0.1 | 1.3 | GO:0003322 | pancreatic A cell development(GO:0003322) |
| 0.1 | 0.4 | GO:0098912 | membrane depolarization during atrial cardiac muscle cell action potential(GO:0098912) |
| 0.1 | 1.7 | GO:0061162 | establishment of monopolar cell polarity(GO:0061162) |
| 0.1 | 4.9 | GO:0051491 | positive regulation of filopodium assembly(GO:0051491) |
| 0.1 | 0.3 | GO:0036269 | swimming behavior(GO:0036269) |
| 0.1 | 0.2 | GO:0021758 | caudate nucleus development(GO:0021757) putamen development(GO:0021758) |
| 0.1 | 0.8 | GO:2000381 | negative regulation of mesoderm development(GO:2000381) |
| 0.1 | 0.3 | GO:1900737 | regulation of proteinase activated receptor activity(GO:1900276) negative regulation of phospholipase C-activating G-protein coupled receptor signaling pathway(GO:1900737) |
| 0.1 | 0.8 | GO:0051005 | negative regulation of lipoprotein lipase activity(GO:0051005) |
| 0.1 | 0.3 | GO:1903215 | negative regulation of protein targeting to mitochondrion(GO:1903215) |
| 0.1 | 0.7 | GO:0090129 | positive regulation of synapse maturation(GO:0090129) |
| 0.1 | 0.7 | GO:0016560 | protein import into peroxisome matrix, docking(GO:0016560) |
| 0.1 | 1.8 | GO:0006012 | galactose metabolic process(GO:0006012) |
| 0.1 | 0.3 | GO:0097156 | fasciculation of sensory neuron axon(GO:0097155) fasciculation of motor neuron axon(GO:0097156) |
| 0.1 | 0.5 | GO:0046952 | ketone body catabolic process(GO:0046952) |
| 0.1 | 1.0 | GO:0001574 | ganglioside biosynthetic process(GO:0001574) |
| 0.1 | 0.6 | GO:0018317 | protein C-linked glycosylation(GO:0018103) peptidyl-tryptophan modification(GO:0018211) protein C-linked glycosylation via tryptophan(GO:0018317) protein C-linked glycosylation via 2'-alpha-mannosyl-L-tryptophan(GO:0018406) |
| 0.1 | 2.0 | GO:0045332 | phospholipid translocation(GO:0045332) |
| 0.1 | 1.1 | GO:0060074 | synapse maturation(GO:0060074) |
| 0.1 | 1.4 | GO:0006677 | glycosylceramide metabolic process(GO:0006677) |
| 0.1 | 0.4 | GO:0015798 | myo-inositol transport(GO:0015798) |
| 0.1 | 1.8 | GO:0071420 | cellular response to histamine(GO:0071420) |
| 0.1 | 1.3 | GO:0060907 | positive regulation of macrophage cytokine production(GO:0060907) |
| 0.1 | 2.4 | GO:0007158 | neuron cell-cell adhesion(GO:0007158) |
| 0.1 | 0.2 | GO:0090176 | microtubule cytoskeleton organization involved in establishment of planar polarity(GO:0090176) |
| 0.1 | 1.0 | GO:0035404 | histone-serine phosphorylation(GO:0035404) |
| 0.1 | 0.3 | GO:0061364 | apoptotic process involved in luteolysis(GO:0061364) |
| 0.1 | 0.2 | GO:1903033 | regulation of microtubule plus-end binding(GO:1903031) positive regulation of microtubule plus-end binding(GO:1903033) |
| 0.1 | 1.4 | GO:1904262 | negative regulation of TORC1 signaling(GO:1904262) |
| 0.1 | 0.9 | GO:0019317 | fucose catabolic process(GO:0019317) L-fucose metabolic process(GO:0042354) L-fucose catabolic process(GO:0042355) |
| 0.1 | 1.2 | GO:0090331 | negative regulation of platelet aggregation(GO:0090331) |
| 0.1 | 0.5 | GO:0051694 | pointed-end actin filament capping(GO:0051694) |
| 0.1 | 0.4 | GO:0006620 | posttranslational protein targeting to membrane(GO:0006620) |
| 0.1 | 0.3 | GO:0033615 | mitochondrial proton-transporting ATP synthase complex assembly(GO:0033615) |
| 0.1 | 1.1 | GO:0042135 | neurotransmitter catabolic process(GO:0042135) |
| 0.0 | 0.1 | GO:0060730 | regulation of intestinal epithelial structure maintenance(GO:0060730) |
| 0.0 | 2.3 | GO:0001893 | maternal placenta development(GO:0001893) |
| 0.0 | 1.6 | GO:0009404 | toxin metabolic process(GO:0009404) |
| 0.0 | 0.4 | GO:0030860 | regulation of polarized epithelial cell differentiation(GO:0030860) |
| 0.0 | 0.4 | GO:0044557 | relaxation of smooth muscle(GO:0044557) |
| 0.0 | 0.5 | GO:0009048 | dosage compensation(GO:0007549) dosage compensation by inactivation of X chromosome(GO:0009048) |
| 0.0 | 0.8 | GO:0032780 | negative regulation of ATPase activity(GO:0032780) |
| 0.0 | 1.4 | GO:0006646 | phosphatidylethanolamine biosynthetic process(GO:0006646) |
| 0.0 | 1.8 | GO:0061003 | positive regulation of dendritic spine morphogenesis(GO:0061003) |
| 0.0 | 0.6 | GO:0006930 | substrate-dependent cell migration, cell extension(GO:0006930) |
| 0.0 | 0.6 | GO:0060431 | primary lung bud formation(GO:0060431) |
| 0.0 | 0.2 | GO:0035790 | platelet-derived growth factor receptor-alpha signaling pathway(GO:0035790) VEGF-activated platelet-derived growth factor receptor signaling pathway(GO:0038086) positive regulation of cell proliferation by VEGF-activated platelet derived growth factor receptor signaling pathway(GO:0038091) |
| 0.0 | 3.1 | GO:0007157 | heterophilic cell-cell adhesion via plasma membrane cell adhesion molecules(GO:0007157) |
| 0.0 | 1.2 | GO:0045603 | positive regulation of endothelial cell differentiation(GO:0045603) |
| 0.0 | 1.2 | GO:0010669 | epithelial structure maintenance(GO:0010669) |
| 0.0 | 0.2 | GO:1905098 | negative regulation of guanyl-nucleotide exchange factor activity(GO:1905098) |
| 0.0 | 0.1 | GO:0086045 | membrane depolarization during AV node cell action potential(GO:0086045) |
| 0.0 | 0.3 | GO:0032439 | endosome localization(GO:0032439) |
| 0.0 | 0.4 | GO:0002051 | osteoblast fate commitment(GO:0002051) |
| 0.0 | 5.7 | GO:0035308 | negative regulation of protein dephosphorylation(GO:0035308) |
| 0.0 | 0.7 | GO:0045792 | negative regulation of cell size(GO:0045792) |
| 0.0 | 0.4 | GO:2000504 | positive regulation of blood vessel remodeling(GO:2000504) |
| 0.0 | 0.5 | GO:0006449 | regulation of translational termination(GO:0006449) |
| 0.0 | 0.4 | GO:0045955 | negative regulation of calcium ion-dependent exocytosis(GO:0045955) |
| 0.0 | 0.5 | GO:0001731 | formation of translation preinitiation complex(GO:0001731) |
| 0.0 | 0.5 | GO:0002175 | protein localization to paranode region of axon(GO:0002175) |
| 0.0 | 0.4 | GO:0035860 | glial cell-derived neurotrophic factor receptor signaling pathway(GO:0035860) |
| 0.0 | 0.4 | GO:0051549 | positive regulation of keratinocyte migration(GO:0051549) |
| 0.0 | 0.2 | GO:0060455 | negative regulation of gastric acid secretion(GO:0060455) |
| 0.0 | 0.2 | GO:1902528 | regulation of protein linear polyubiquitination(GO:1902528) positive regulation of protein linear polyubiquitination(GO:1902530) |
| 0.0 | 0.9 | GO:2001224 | positive regulation of neuron migration(GO:2001224) |
| 0.0 | 0.2 | GO:1905205 | positive regulation of connective tissue replacement(GO:1905205) |
| 0.0 | 0.2 | GO:0009236 | cobalamin biosynthetic process(GO:0009236) |
| 0.0 | 0.3 | GO:0060355 | positive regulation of cell adhesion molecule production(GO:0060355) |
| 0.0 | 1.0 | GO:0042753 | positive regulation of circadian rhythm(GO:0042753) |
| 0.0 | 1.4 | GO:0032292 | myelination in peripheral nervous system(GO:0022011) peripheral nervous system axon ensheathment(GO:0032292) |
| 0.0 | 1.1 | GO:0071467 | cellular response to pH(GO:0071467) |
| 0.0 | 0.7 | GO:0036158 | outer dynein arm assembly(GO:0036158) |
| 0.0 | 1.2 | GO:0040036 | regulation of fibroblast growth factor receptor signaling pathway(GO:0040036) |
| 0.0 | 1.5 | GO:0007019 | microtubule depolymerization(GO:0007019) |
| 0.0 | 0.2 | GO:0039689 | negative stranded viral RNA replication(GO:0039689) multi-organism biosynthetic process(GO:0044034) |
| 0.0 | 0.1 | GO:0010983 | regulation of high-density lipoprotein particle clearance(GO:0010982) positive regulation of high-density lipoprotein particle clearance(GO:0010983) |
| 0.0 | 3.7 | GO:0042147 | retrograde transport, endosome to Golgi(GO:0042147) |
| 0.0 | 2.0 | GO:0045773 | positive regulation of axon extension(GO:0045773) |
| 0.0 | 0.9 | GO:0050951 | sensory perception of temperature stimulus(GO:0050951) |
| 0.0 | 0.1 | GO:0090285 | regulation of protein glycosylation in Golgi(GO:0090283) negative regulation of protein glycosylation in Golgi(GO:0090285) |
| 0.0 | 0.6 | GO:0071786 | endoplasmic reticulum tubular network organization(GO:0071786) |
| 0.0 | 0.6 | GO:0021794 | thalamus development(GO:0021794) |
| 0.0 | 0.1 | GO:0071321 | cellular response to cGMP(GO:0071321) |
| 0.0 | 1.2 | GO:0046710 | GDP metabolic process(GO:0046710) |
| 0.0 | 0.8 | GO:0044458 | motile cilium assembly(GO:0044458) |
| 0.0 | 2.3 | GO:0099643 | neurotransmitter secretion(GO:0007269) signal release from synapse(GO:0099643) |
| 0.0 | 0.1 | GO:0046167 | glycerol-3-phosphate biosynthetic process(GO:0046167) |
| 0.0 | 0.5 | GO:0007175 | negative regulation of epidermal growth factor-activated receptor activity(GO:0007175) |
| 0.0 | 0.3 | GO:0051045 | negative regulation of membrane protein ectodomain proteolysis(GO:0051045) |
| 0.0 | 0.1 | GO:0006045 | N-acetylglucosamine biosynthetic process(GO:0006045) glucosamine-containing compound biosynthetic process(GO:1901073) |
| 0.0 | 0.1 | GO:0003065 | positive regulation of heart rate by epinephrine(GO:0003065) |
| 0.0 | 0.5 | GO:0046838 | phosphorylated carbohydrate dephosphorylation(GO:0046838) inositol phosphate dephosphorylation(GO:0046855) |
| 0.0 | 0.2 | GO:0048672 | positive regulation of collateral sprouting(GO:0048672) |
| 0.0 | 1.3 | GO:0035329 | hippo signaling(GO:0035329) |
| 0.0 | 1.2 | GO:0048791 | calcium ion-regulated exocytosis of neurotransmitter(GO:0048791) |
| 0.0 | 0.7 | GO:0042474 | middle ear morphogenesis(GO:0042474) |
| 0.0 | 2.3 | GO:0017156 | calcium ion regulated exocytosis(GO:0017156) |
| 0.0 | 0.4 | GO:0050812 | regulation of acetyl-CoA biosynthetic process from pyruvate(GO:0010510) regulation of acyl-CoA biosynthetic process(GO:0050812) |
| 0.0 | 0.1 | GO:0006651 | diacylglycerol biosynthetic process(GO:0006651) |
| 0.0 | 0.1 | GO:0035674 | tricarboxylic acid transmembrane transport(GO:0035674) |
| 0.0 | 3.1 | GO:0007156 | homophilic cell adhesion via plasma membrane adhesion molecules(GO:0007156) |
| 0.0 | 0.1 | GO:0021526 | medial motor column neuron differentiation(GO:0021526) |
| 0.0 | 0.2 | GO:0086024 | adrenergic receptor signaling pathway involved in positive regulation of heart rate(GO:0086024) |
| 0.0 | 0.1 | GO:0045586 | regulation of gamma-delta T cell differentiation(GO:0045586) |
| 0.0 | 0.1 | GO:0070213 | protein auto-ADP-ribosylation(GO:0070213) |
| 0.0 | 0.1 | GO:0045218 | zonula adherens maintenance(GO:0045218) |
| 0.0 | 0.5 | GO:0043968 | histone H2A acetylation(GO:0043968) |
| 0.0 | 1.0 | GO:1901385 | regulation of voltage-gated calcium channel activity(GO:1901385) |
| 0.0 | 0.5 | GO:0007035 | vacuolar acidification(GO:0007035) |
| 0.0 | 0.8 | GO:0006198 | cAMP catabolic process(GO:0006198) |
| 0.0 | 0.3 | GO:0030322 | stabilization of membrane potential(GO:0030322) |
| 0.0 | 0.3 | GO:0042759 | long-chain fatty acid biosynthetic process(GO:0042759) |
| 0.0 | 0.6 | GO:0046839 | phospholipid dephosphorylation(GO:0046839) |
| 0.0 | 0.2 | GO:0018095 | protein polyglutamylation(GO:0018095) |
| 0.0 | 1.3 | GO:0006968 | cellular defense response(GO:0006968) |
| 0.0 | 0.1 | GO:0051791 | medium-chain fatty acid metabolic process(GO:0051791) |
| 0.0 | 1.3 | GO:1902600 | hydrogen ion transmembrane transport(GO:1902600) |
| 0.0 | 0.6 | GO:0009303 | rRNA transcription(GO:0009303) |
| 0.0 | 1.5 | GO:0006911 | phagocytosis, engulfment(GO:0006911) |
| 0.0 | 0.9 | GO:0006836 | neurotransmitter transport(GO:0006836) |
| 0.0 | 0.2 | GO:0043517 | positive regulation of DNA damage response, signal transduction by p53 class mediator(GO:0043517) |
Gene overrepresentation in cellular component category:
| Log-likelihood per target | Total log-likelihood | Term | Description |
|---|---|---|---|
| 0.5 | 4.6 | GO:0032584 | growth cone membrane(GO:0032584) |
| 0.5 | 2.5 | GO:0016533 | cyclin-dependent protein kinase 5 holoenzyme complex(GO:0016533) |
| 0.5 | 2.8 | GO:0044308 | axonal spine(GO:0044308) |
| 0.5 | 1.4 | GO:1990617 | CHOP-ATF4 complex(GO:1990617) CHOP-ATF3 complex(GO:1990622) |
| 0.4 | 1.3 | GO:0098831 | cytoskeleton of presynaptic active zone(GO:0048788) presynaptic active zone cytoplasmic component(GO:0098831) presynaptic cytoskeleton(GO:0099569) |
| 0.3 | 1.9 | GO:0032144 | 4-aminobutyrate transaminase complex(GO:0032144) |
| 0.2 | 1.5 | GO:0089717 | spanning component of plasma membrane(GO:0044214) spanning component of membrane(GO:0089717) |
| 0.2 | 4.1 | GO:0035253 | ciliary rootlet(GO:0035253) |
| 0.2 | 7.5 | GO:0044295 | axonal growth cone(GO:0044295) |
| 0.1 | 0.7 | GO:0032937 | SREBP-SCAP-Insig complex(GO:0032937) |
| 0.1 | 3.5 | GO:0060077 | inhibitory synapse(GO:0060077) |
| 0.1 | 0.6 | GO:1902737 | dendritic filopodium(GO:1902737) |
| 0.1 | 8.0 | GO:0048786 | presynaptic active zone(GO:0048786) |
| 0.1 | 0.6 | GO:1990851 | Wnt-Frizzled-LRP5/6 complex(GO:1990851) |
| 0.1 | 1.3 | GO:0043190 | ATP-binding cassette (ABC) transporter complex(GO:0043190) |
| 0.1 | 0.7 | GO:1990032 | parallel fiber(GO:1990032) |
| 0.1 | 0.3 | GO:0060187 | cell pole(GO:0060187) |
| 0.1 | 1.7 | GO:0045180 | basal cortex(GO:0045180) |
| 0.1 | 2.2 | GO:1990454 | L-type voltage-gated calcium channel complex(GO:1990454) |
| 0.1 | 1.2 | GO:0031209 | SCAR complex(GO:0031209) |
| 0.1 | 1.3 | GO:0005883 | neurofilament(GO:0005883) |
| 0.1 | 0.5 | GO:0043291 | RAVE complex(GO:0043291) |
| 0.1 | 1.0 | GO:0017059 | serine C-palmitoyltransferase complex(GO:0017059) endoplasmic reticulum palmitoyltransferase complex(GO:0031211) |
| 0.1 | 1.3 | GO:0005751 | mitochondrial respiratory chain complex IV(GO:0005751) |
| 0.1 | 1.6 | GO:0017146 | NMDA selective glutamate receptor complex(GO:0017146) |
| 0.1 | 0.4 | GO:0005967 | mitochondrial pyruvate dehydrogenase complex(GO:0005967) |
| 0.1 | 0.3 | GO:0039714 | viral factory(GO:0039713) cytoplasmic viral factory(GO:0039714) host cell viral assembly compartment(GO:0072517) |
| 0.1 | 1.5 | GO:0043083 | synaptic cleft(GO:0043083) |
| 0.1 | 0.3 | GO:0098592 | cytoplasmic side of apical plasma membrane(GO:0098592) |
| 0.1 | 2.3 | GO:0032585 | multivesicular body membrane(GO:0032585) |
| 0.1 | 0.2 | GO:0044207 | eukaryotic 48S preinitiation complex(GO:0033290) translation initiation ternary complex(GO:0044207) |
| 0.1 | 0.7 | GO:0036157 | outer dynein arm(GO:0036157) |
| 0.1 | 1.3 | GO:0031045 | dense core granule(GO:0031045) |
| 0.1 | 1.8 | GO:0033270 | paranode region of axon(GO:0033270) |
| 0.1 | 0.7 | GO:0030285 | integral component of synaptic vesicle membrane(GO:0030285) intrinsic component of synaptic vesicle membrane(GO:0098563) |
| 0.0 | 0.2 | GO:0030906 | retromer, cargo-selective complex(GO:0030906) |
| 0.0 | 1.6 | GO:0031307 | integral component of mitochondrial outer membrane(GO:0031307) |
| 0.0 | 0.7 | GO:0042584 | chromaffin granule membrane(GO:0042584) |
| 0.0 | 0.3 | GO:0070876 | SOSS complex(GO:0070876) |
| 0.0 | 1.2 | GO:0032045 | guanyl-nucleotide exchange factor complex(GO:0032045) |
| 0.0 | 1.8 | GO:1902711 | GABA-A receptor complex(GO:1902711) |
| 0.0 | 4.4 | GO:0042734 | presynaptic membrane(GO:0042734) |
| 0.0 | 4.1 | GO:0099501 | synaptic vesicle membrane(GO:0030672) exocytic vesicle membrane(GO:0099501) |
| 0.0 | 0.3 | GO:0005955 | calcineurin complex(GO:0005955) |
| 0.0 | 0.2 | GO:0017101 | aminoacyl-tRNA synthetase multienzyme complex(GO:0017101) |
| 0.0 | 0.8 | GO:0030140 | trans-Golgi network transport vesicle(GO:0030140) |
| 0.0 | 1.1 | GO:1990124 | messenger ribonucleoprotein complex(GO:1990124) |
| 0.0 | 2.7 | GO:0030670 | phagocytic vesicle membrane(GO:0030670) |
| 0.0 | 2.9 | GO:0030669 | clathrin-coated endocytic vesicle membrane(GO:0030669) |
| 0.0 | 2.6 | GO:0019005 | SCF ubiquitin ligase complex(GO:0019005) |
| 0.0 | 5.6 | GO:0005913 | cell-cell adherens junction(GO:0005913) |
| 0.0 | 2.4 | GO:0005871 | kinesin complex(GO:0005871) |
| 0.0 | 8.0 | GO:0045211 | postsynaptic membrane(GO:0045211) |
| 0.0 | 3.4 | GO:0030658 | transport vesicle membrane(GO:0030658) |
| 0.0 | 1.9 | GO:0005891 | voltage-gated calcium channel complex(GO:0005891) |
| 0.0 | 0.2 | GO:0031313 | extrinsic component of endosome membrane(GO:0031313) |
| 0.0 | 2.5 | GO:0008021 | synaptic vesicle(GO:0008021) |
| 0.0 | 5.6 | GO:0044309 | dendritic spine(GO:0043197) neuron spine(GO:0044309) |
| 0.0 | 0.2 | GO:0070847 | core mediator complex(GO:0070847) |
| 0.0 | 1.1 | GO:0046658 | anchored component of plasma membrane(GO:0046658) |
| 0.0 | 1.4 | GO:0032420 | stereocilium(GO:0032420) |
| 0.0 | 0.5 | GO:0016461 | unconventional myosin complex(GO:0016461) |
| 0.0 | 0.3 | GO:0030660 | Golgi-associated vesicle membrane(GO:0030660) |
| 0.0 | 0.6 | GO:0005868 | cytoplasmic dynein complex(GO:0005868) |
| 0.0 | 3.4 | GO:0031225 | anchored component of membrane(GO:0031225) |
| 0.0 | 2.7 | GO:0030426 | growth cone(GO:0030426) |
| 0.0 | 0.3 | GO:0000145 | exocyst(GO:0000145) |
| 0.0 | 0.5 | GO:0070822 | Sin3-type complex(GO:0070822) |
| 0.0 | 0.4 | GO:0031588 | nucleotide-activated protein kinase complex(GO:0031588) |
| 0.0 | 2.6 | GO:0005604 | basement membrane(GO:0005604) |
| 0.0 | 0.4 | GO:0097539 | ciliary transition fiber(GO:0097539) |
| 0.0 | 0.2 | GO:0030981 | cortical microtubule cytoskeleton(GO:0030981) |
| 0.0 | 0.3 | GO:0045179 | apical cortex(GO:0045179) |
| 0.0 | 0.1 | GO:1990745 | EARP complex(GO:1990745) |
| 0.0 | 1.7 | GO:0098793 | presynapse(GO:0098793) |
| 0.0 | 7.2 | GO:0043025 | neuronal cell body(GO:0043025) |
| 0.0 | 0.7 | GO:0035869 | ciliary transition zone(GO:0035869) |
| 0.0 | 2.3 | GO:0005923 | bicellular tight junction(GO:0005923) |
| 0.0 | 0.6 | GO:0005865 | striated muscle thin filament(GO:0005865) |
| 0.0 | 0.1 | GO:0098855 | HCN channel complex(GO:0098855) |
| 0.0 | 1.2 | GO:0060170 | ciliary membrane(GO:0060170) |
| 0.0 | 6.0 | GO:0016324 | apical plasma membrane(GO:0016324) |
| 0.0 | 0.2 | GO:0098576 | lumenal side of membrane(GO:0098576) |
| 0.0 | 0.5 | GO:0035267 | NuA4 histone acetyltransferase complex(GO:0035267) H4/H2A histone acetyltransferase complex(GO:0043189) H4 histone acetyltransferase complex(GO:1902562) |
| 0.0 | 0.9 | GO:0042641 | actomyosin(GO:0042641) |
| 0.0 | 1.4 | GO:0030133 | transport vesicle(GO:0030133) |
| 0.0 | 0.4 | GO:0071782 | endoplasmic reticulum tubular network(GO:0071782) |
| 0.0 | 0.2 | GO:0001673 | male germ cell nucleus(GO:0001673) |
Gene overrepresentation in molecular function category:
| Log-likelihood per target | Total log-likelihood | Term | Description |
|---|---|---|---|
| 0.9 | 3.8 | GO:0008427 | calcium-dependent protein kinase inhibitor activity(GO:0008427) |
| 0.8 | 2.5 | GO:0016534 | cyclin-dependent protein kinase 5 activator activity(GO:0016534) |
| 0.6 | 1.8 | GO:0086057 | voltage-gated calcium channel activity involved in bundle of His cell action potential(GO:0086057) |
| 0.5 | 4.4 | GO:0035727 | lysophosphatidic acid binding(GO:0035727) |
| 0.4 | 1.9 | GO:0072590 | N-acetyl-L-aspartate-L-glutamate ligase activity(GO:0072590) |
| 0.4 | 1.4 | GO:0004307 | ethanolaminephosphotransferase activity(GO:0004307) |
| 0.3 | 1.0 | GO:0050405 | [hydroxymethylglutaryl-CoA reductase (NADPH)] kinase activity(GO:0047322) [acetyl-CoA carboxylase] kinase activity(GO:0050405) |
| 0.3 | 2.8 | GO:0099529 | neurotransmitter receptor activity involved in regulation of postsynaptic membrane potential(GO:0099529) transmitter-gated ion channel activity involved in regulation of postsynaptic membrane potential(GO:1904315) |
| 0.3 | 3.4 | GO:0000099 | sulfur amino acid transmembrane transporter activity(GO:0000099) |
| 0.3 | 1.7 | GO:0035276 | ethanol binding(GO:0035276) |
| 0.3 | 1.6 | GO:0070704 | C-5 sterol desaturase activity(GO:0000248) sterol desaturase activity(GO:0070704) |
| 0.3 | 1.9 | GO:0003867 | 4-aminobutyrate transaminase activity(GO:0003867) succinate-semialdehyde dehydrogenase binding(GO:0032145) (S)-3-amino-2-methylpropionate transaminase activity(GO:0047298) |
| 0.3 | 1.3 | GO:0016524 | latrotoxin receptor activity(GO:0016524) |
| 0.3 | 1.0 | GO:0035373 | chondroitin sulfate proteoglycan binding(GO:0035373) |
| 0.3 | 1.0 | GO:0003947 | (N-acetylneuraminyl)-galactosylglucosylceramide N-acetylgalactosaminyltransferase activity(GO:0003947) |
| 0.3 | 1.0 | GO:0015375 | neutral L-amino acid secondary active transmembrane transporter activity(GO:0005294) glycine:sodium symporter activity(GO:0015375) |
| 0.2 | 3.8 | GO:0032051 | clathrin light chain binding(GO:0032051) |
| 0.2 | 0.9 | GO:0008426 | protein kinase C inhibitor activity(GO:0008426) |
| 0.2 | 0.8 | GO:0030379 | neurotensin receptor activity, non-G-protein coupled(GO:0030379) |
| 0.2 | 1.2 | GO:0045504 | dynein heavy chain binding(GO:0045504) |
| 0.2 | 0.6 | GO:1904928 | coreceptor activity involved in canonical Wnt signaling pathway(GO:1904928) |
| 0.2 | 1.8 | GO:0001517 | N-acetylglucosamine 6-O-sulfotransferase activity(GO:0001517) |
| 0.2 | 1.6 | GO:0004351 | glutamate decarboxylase activity(GO:0004351) |
| 0.2 | 1.6 | GO:0043237 | laminin-1 binding(GO:0043237) |
| 0.2 | 1.2 | GO:0004013 | adenosylhomocysteinase activity(GO:0004013) trialkylsulfonium hydrolase activity(GO:0016802) |
| 0.2 | 1.2 | GO:0097108 | hedgehog family protein binding(GO:0097108) |
| 0.2 | 0.7 | GO:0005462 | UDP-N-acetylglucosamine transmembrane transporter activity(GO:0005462) |
| 0.2 | 1.0 | GO:0052846 | endopolyphosphatase activity(GO:0000298) diphosphoinositol-polyphosphate diphosphatase activity(GO:0008486) bis(5'-adenosyl)-hexaphosphatase activity(GO:0034431) bis(5'-adenosyl)-pentaphosphatase activity(GO:0034432) inositol diphosphate tetrakisphosphate diphosphatase activity(GO:0052840) inositol bisdiphosphate tetrakisphosphate diphosphatase activity(GO:0052841) inositol diphosphate pentakisphosphate diphosphatase activity(GO:0052842) inositol-1-diphosphate-2,3,4,5,6-pentakisphosphate diphosphatase activity(GO:0052843) inositol-3-diphosphate-1,2,4,5,6-pentakisphosphate diphosphatase activity(GO:0052844) inositol-5-diphosphate-1,2,3,4,6-pentakisphosphate diphosphatase activity(GO:0052845) inositol-1,5-bisdiphosphate-2,3,4,6-tetrakisphosphate 1-diphosphatase activity(GO:0052846) inositol-1,5-bisdiphosphate-2,3,4,6-tetrakisphosphate 5-diphosphatase activity(GO:0052847) inositol-3,5-bisdiphosphate-2,3,4,6-tetrakisphosphate 5-diphosphatase activity(GO:0052848) |
| 0.2 | 5.6 | GO:0008574 | ATP-dependent microtubule motor activity, plus-end-directed(GO:0008574) |
| 0.1 | 0.6 | GO:0016418 | S-acetyltransferase activity(GO:0016418) |
| 0.1 | 0.6 | GO:0044378 | non-sequence-specific DNA binding, bending(GO:0044378) |
| 0.1 | 1.4 | GO:0001665 | alpha-N-acetylgalactosaminide alpha-2,6-sialyltransferase activity(GO:0001665) |
| 0.1 | 1.8 | GO:0022851 | GABA-gated chloride ion channel activity(GO:0022851) |
| 0.1 | 0.3 | GO:0032427 | GBD domain binding(GO:0032427) |
| 0.1 | 1.1 | GO:0031849 | olfactory receptor binding(GO:0031849) |
| 0.1 | 0.5 | GO:0005289 | high-affinity basic amino acid transmembrane transporter activity(GO:0005287) high-affinity arginine transmembrane transporter activity(GO:0005289) high-affinity lysine transmembrane transporter activity(GO:0005292) |
| 0.1 | 0.5 | GO:0004001 | adenosine kinase activity(GO:0004001) |
| 0.1 | 0.5 | GO:0003858 | 3-hydroxybutyrate dehydrogenase activity(GO:0003858) |
| 0.1 | 1.6 | GO:0004972 | NMDA glutamate receptor activity(GO:0004972) |
| 0.1 | 1.0 | GO:0016454 | serine C-palmitoyltransferase activity(GO:0004758) C-palmitoyltransferase activity(GO:0016454) |
| 0.1 | 5.8 | GO:0030742 | GTP-dependent protein binding(GO:0030742) |
| 0.1 | 2.6 | GO:0015095 | magnesium ion transmembrane transporter activity(GO:0015095) |
| 0.1 | 0.5 | GO:0070905 | serine binding(GO:0070905) |
| 0.1 | 1.0 | GO:0000155 | phosphorelay sensor kinase activity(GO:0000155) |
| 0.1 | 0.8 | GO:0003747 | translation release factor activity(GO:0003747) translation termination factor activity(GO:0008079) |
| 0.1 | 1.2 | GO:0030274 | LIM domain binding(GO:0030274) |
| 0.1 | 1.7 | GO:0019531 | oxalate transmembrane transporter activity(GO:0019531) |
| 0.1 | 0.5 | GO:0051021 | GDP-dissociation inhibitor binding(GO:0051021) Rho GDP-dissociation inhibitor binding(GO:0051022) |
| 0.1 | 1.9 | GO:0042577 | lipid phosphatase activity(GO:0042577) |
| 0.1 | 2.0 | GO:0005522 | profilin binding(GO:0005522) |
| 0.1 | 0.5 | GO:0046899 | nucleoside triphosphate adenylate kinase activity(GO:0046899) |
| 0.1 | 2.4 | GO:0004970 | ionotropic glutamate receptor activity(GO:0004970) |
| 0.1 | 1.0 | GO:0070290 | N-acylphosphatidylethanolamine-specific phospholipase D activity(GO:0070290) |
| 0.1 | 1.0 | GO:0016286 | small conductance calcium-activated potassium channel activity(GO:0016286) |
| 0.1 | 0.7 | GO:0050815 | phosphoserine binding(GO:0050815) |
| 0.1 | 2.5 | GO:0008499 | UDP-galactose:beta-N-acetylglucosamine beta-1,3-galactosyltransferase activity(GO:0008499) |
| 0.1 | 2.6 | GO:0004012 | phospholipid-translocating ATPase activity(GO:0004012) |
| 0.1 | 1.6 | GO:0051011 | microtubule minus-end binding(GO:0051011) |
| 0.1 | 1.1 | GO:0008526 | phosphatidylinositol transporter activity(GO:0008526) |
| 0.1 | 2.2 | GO:0000062 | fatty-acyl-CoA binding(GO:0000062) |
| 0.1 | 3.1 | GO:0005001 | transmembrane receptor protein tyrosine phosphatase activity(GO:0005001) transmembrane receptor protein phosphatase activity(GO:0019198) |
| 0.1 | 0.7 | GO:0005052 | peroxisome matrix targeting signal-1 binding(GO:0005052) |
| 0.1 | 0.7 | GO:0035662 | Toll-like receptor 4 binding(GO:0035662) |
| 0.1 | 0.9 | GO:0046920 | alpha-(1->3)-fucosyltransferase activity(GO:0046920) |
| 0.1 | 1.4 | GO:0042301 | phosphate ion binding(GO:0042301) |
| 0.1 | 1.4 | GO:0043522 | leucine zipper domain binding(GO:0043522) |
| 0.1 | 0.4 | GO:0071074 | eukaryotic initiation factor eIF2 binding(GO:0071074) |
| 0.1 | 2.3 | GO:0070008 | serine-type exopeptidase activity(GO:0070008) |
| 0.1 | 3.4 | GO:0005086 | ARF guanyl-nucleotide exchange factor activity(GO:0005086) |
| 0.1 | 0.7 | GO:0019534 | toxin transporter activity(GO:0019534) |
| 0.1 | 1.9 | GO:0042043 | neurexin family protein binding(GO:0042043) |
| 0.1 | 0.7 | GO:0071253 | connexin binding(GO:0071253) |
| 0.1 | 0.5 | GO:0004445 | inositol-polyphosphate 5-phosphatase activity(GO:0004445) |
| 0.1 | 0.2 | GO:0005169 | neurotrophin TRKB receptor binding(GO:0005169) |
| 0.1 | 1.9 | GO:0051537 | 2 iron, 2 sulfur cluster binding(GO:0051537) |
| 0.1 | 1.6 | GO:0035256 | G-protein coupled glutamate receptor binding(GO:0035256) |
| 0.1 | 1.3 | GO:0042813 | Wnt-activated receptor activity(GO:0042813) |
| 0.1 | 1.2 | GO:0008253 | 5'-nucleotidase activity(GO:0008253) |
| 0.1 | 2.0 | GO:0008331 | high voltage-gated calcium channel activity(GO:0008331) |
| 0.0 | 0.4 | GO:0099580 | ion antiporter activity involved in regulation of postsynaptic membrane potential(GO:0099580) |
| 0.0 | 0.3 | GO:0008321 | Ral guanyl-nucleotide exchange factor activity(GO:0008321) |
| 0.0 | 0.6 | GO:1990825 | sequence-specific mRNA binding(GO:1990825) |
| 0.0 | 0.4 | GO:0050682 | AF-2 domain binding(GO:0050682) |
| 0.0 | 0.6 | GO:0097027 | ubiquitin-protein transferase activator activity(GO:0097027) |
| 0.0 | 1.7 | GO:0080025 | phosphatidylinositol-3,5-bisphosphate binding(GO:0080025) |
| 0.0 | 1.6 | GO:0005104 | fibroblast growth factor receptor binding(GO:0005104) |
| 0.0 | 0.6 | GO:0046975 | histone methyltransferase activity (H3-K36 specific)(GO:0046975) |
| 0.0 | 0.3 | GO:0031871 | proteinase activated receptor binding(GO:0031871) |
| 0.0 | 0.1 | GO:0086007 | voltage-gated calcium channel activity involved in cardiac muscle cell action potential(GO:0086007) voltage-gated calcium channel activity involved in AV node cell action potential(GO:0086056) voltage-gated calcium channel activity involved SA node cell action potential(GO:0086059) |
| 0.0 | 1.3 | GO:0015002 | cytochrome-c oxidase activity(GO:0004129) heme-copper terminal oxidase activity(GO:0015002) oxidoreductase activity, acting on a heme group of donors, oxygen as acceptor(GO:0016676) |
| 0.0 | 0.8 | GO:0004115 | 3',5'-cyclic-AMP phosphodiesterase activity(GO:0004115) |
| 0.0 | 0.5 | GO:0004075 | biotin carboxylase activity(GO:0004075) |
| 0.0 | 0.4 | GO:0016167 | glial cell-derived neurotrophic factor receptor activity(GO:0016167) |
| 0.0 | 0.3 | GO:0048495 | Roundabout binding(GO:0048495) |
| 0.0 | 0.2 | GO:0005017 | platelet-derived growth factor-activated receptor activity(GO:0005017) |
| 0.0 | 0.6 | GO:0052650 | NADP-retinol dehydrogenase activity(GO:0052650) |
| 0.0 | 1.2 | GO:1905030 | voltage-gated sodium channel activity(GO:0005248) voltage-gated ion channel activity involved in regulation of postsynaptic membrane potential(GO:1905030) |
| 0.0 | 5.5 | GO:0005262 | calcium channel activity(GO:0005262) |
| 0.0 | 0.3 | GO:0004704 | NF-kappaB-inducing kinase activity(GO:0004704) |
| 0.0 | 1.3 | GO:0042605 | peptide antigen binding(GO:0042605) |
| 0.0 | 1.5 | GO:0043015 | gamma-tubulin binding(GO:0043015) |
| 0.0 | 0.1 | GO:0008761 | UDP-N-acetylglucosamine 2-epimerase activity(GO:0008761) N-acylmannosamine kinase activity(GO:0009384) |
| 0.0 | 0.1 | GO:0031826 | type 2A serotonin receptor binding(GO:0031826) |
| 0.0 | 1.1 | GO:0000900 | translation repressor activity, nucleic acid binding(GO:0000900) |
| 0.0 | 0.2 | GO:0030618 | transforming growth factor beta receptor, pathway-specific cytoplasmic mediator activity(GO:0030618) |
| 0.0 | 1.0 | GO:0017134 | fibroblast growth factor binding(GO:0017134) |
| 0.0 | 0.5 | GO:0004716 | receptor signaling protein tyrosine kinase activity(GO:0004716) |
| 0.0 | 0.1 | GO:0070097 | delta-catenin binding(GO:0070097) |
| 0.0 | 0.2 | GO:0004957 | prostaglandin E receptor activity(GO:0004957) |
| 0.0 | 0.1 | GO:0004370 | glycerol kinase activity(GO:0004370) |
| 0.0 | 1.3 | GO:0030676 | Rac guanyl-nucleotide exchange factor activity(GO:0030676) |
| 0.0 | 1.4 | GO:0030552 | cAMP binding(GO:0030552) |
| 0.0 | 2.3 | GO:0048365 | Rac GTPase binding(GO:0048365) |
| 0.0 | 0.2 | GO:0046790 | virion binding(GO:0046790) |
| 0.0 | 1.9 | GO:0001540 | beta-amyloid binding(GO:0001540) |
| 0.0 | 1.2 | GO:0004385 | guanylate kinase activity(GO:0004385) |
| 0.0 | 0.1 | GO:0015226 | amino-acid betaine transmembrane transporter activity(GO:0015199) carnitine transmembrane transporter activity(GO:0015226) |
| 0.0 | 0.3 | GO:0031435 | mitogen-activated protein kinase kinase kinase binding(GO:0031435) |
| 0.0 | 0.5 | GO:0005523 | tropomyosin binding(GO:0005523) |
| 0.0 | 0.6 | GO:0000030 | mannosyltransferase activity(GO:0000030) |
| 0.0 | 1.4 | GO:0051018 | protein kinase A binding(GO:0051018) |
| 0.0 | 3.6 | GO:0044325 | ion channel binding(GO:0044325) |
| 0.0 | 2.0 | GO:0002039 | p53 binding(GO:0002039) |
| 0.0 | 0.3 | GO:0005004 | GPI-linked ephrin receptor activity(GO:0005004) |
| 0.0 | 0.3 | GO:0016018 | cyclosporin A binding(GO:0016018) |
| 0.0 | 1.2 | GO:0030374 | ligand-dependent nuclear receptor transcription coactivator activity(GO:0030374) |
| 0.0 | 1.2 | GO:0019843 | rRNA binding(GO:0019843) |
| 0.0 | 3.1 | GO:0005200 | structural constituent of cytoskeleton(GO:0005200) |
| 0.0 | 0.6 | GO:0005326 | neurotransmitter transporter activity(GO:0005326) |
| 0.0 | 0.3 | GO:0022841 | potassium ion leak channel activity(GO:0022841) |
| 0.0 | 0.1 | GO:0017040 | ceramidase activity(GO:0017040) |
| 0.0 | 1.4 | GO:0015171 | amino acid transmembrane transporter activity(GO:0015171) |
| 0.0 | 1.0 | GO:0070412 | R-SMAD binding(GO:0070412) |
| 0.0 | 0.9 | GO:0008146 | sulfotransferase activity(GO:0008146) |
| 0.0 | 2.6 | GO:0008083 | growth factor activity(GO:0008083) |
Gene overrepresentation in curated gene sets: canonical pathways category:
| Log-likelihood per target | Total log-likelihood | Term | Description |
|---|---|---|---|
| 0.1 | 7.0 | PID LIS1 PATHWAY | Lissencephaly gene (LIS1) in neuronal migration and development |
| 0.1 | 5.0 | PID NCADHERIN PATHWAY | N-cadherin signaling events |
| 0.1 | 2.7 | PID IL8 CXCR1 PATHWAY | IL8- and CXCR1-mediated signaling events |
| 0.0 | 1.2 | PID EPHA FWDPATHWAY | EPHA forward signaling |
| 0.0 | 0.4 | PID RET PATHWAY | Signaling events regulated by Ret tyrosine kinase |
| 0.0 | 1.2 | PID HEDGEHOG 2PATHWAY | Signaling events mediated by the Hedgehog family |
| 0.0 | 1.6 | PID ERBB NETWORK PATHWAY | ErbB receptor signaling network |
| 0.0 | 1.5 | PID NETRIN PATHWAY | Netrin-mediated signaling events |
| 0.0 | 3.4 | PID MTOR 4PATHWAY | mTOR signaling pathway |
| 0.0 | 2.5 | PID FGF PATHWAY | FGF signaling pathway |
| 0.0 | 1.6 | NABA BASEMENT MEMBRANES | Genes encoding structural components of basement membranes |
| 0.0 | 0.3 | PID INSULIN PATHWAY | Insulin Pathway |
| 0.0 | 0.8 | PID REELIN PATHWAY | Reelin signaling pathway |
| 0.0 | 0.3 | PID CXCR4 PATHWAY | CXCR4-mediated signaling events |
| 0.0 | 1.6 | PID EPHB FWD PATHWAY | EPHB forward signaling |
| 0.0 | 0.6 | PID GLYPICAN 1PATHWAY | Glypican 1 network |
| 0.0 | 1.6 | PID INTEGRIN3 PATHWAY | Beta3 integrin cell surface interactions |
| 0.0 | 0.9 | PID RAS PATHWAY | Regulation of Ras family activation |
| 0.0 | 1.5 | ST T CELL SIGNAL TRANSDUCTION | T Cell Signal Transduction |
| 0.0 | 0.1 | PID THROMBIN PAR4 PATHWAY | PAR4-mediated thrombin signaling events |
| 0.0 | 0.6 | PID WNT CANONICAL PATHWAY | Canonical Wnt signaling pathway |
| 0.0 | 0.2 | PID PDGFRA PATHWAY | PDGFR-alpha signaling pathway |
| 0.0 | 0.6 | PID ALPHA SYNUCLEIN PATHWAY | Alpha-synuclein signaling |
| 0.0 | 0.7 | NABA COLLAGENS | Genes encoding collagen proteins |
| 0.0 | 1.4 | PID RHOA REG PATHWAY | Regulation of RhoA activity |
| 0.0 | 0.6 | PID ECADHERIN NASCENT AJ PATHWAY | E-cadherin signaling in the nascent adherens junction |
Gene overrepresentation in curated gene sets: REACTOME pathways category:
| Log-likelihood per target | Total log-likelihood | Term | Description |
|---|---|---|---|
| 0.1 | 3.4 | REACTOME GABA SYNTHESIS RELEASE REUPTAKE AND DEGRADATION | Genes involved in GABA synthesis, release, reuptake and degradation |
| 0.1 | 4.4 | REACTOME GLUTAMATE NEUROTRANSMITTER RELEASE CYCLE | Genes involved in Glutamate Neurotransmitter Release Cycle |
| 0.1 | 4.4 | REACTOME UNBLOCKING OF NMDA RECEPTOR GLUTAMATE BINDING AND ACTIVATION | Genes involved in Unblocking of NMDA receptor, glutamate binding and activation |
| 0.1 | 4.1 | REACTOME KINESINS | Genes involved in Kinesins |
| 0.1 | 5.1 | REACTOME ADHERENS JUNCTIONS INTERACTIONS | Genes involved in Adherens junctions interactions |
| 0.1 | 1.4 | REACTOME ACTIVATION OF CHAPERONE GENES BY ATF6 ALPHA | Genes involved in Activation of Chaperone Genes by ATF6-alpha |
| 0.1 | 1.6 | REACTOME SIGNALING BY FGFR3 MUTANTS | Genes involved in Signaling by FGFR3 mutants |
| 0.1 | 0.7 | REACTOME SIGNALING BY EGFR IN CANCER | Genes involved in Signaling by EGFR in Cancer |
| 0.1 | 1.8 | REACTOME BRANCHED CHAIN AMINO ACID CATABOLISM | Genes involved in Branched-chain amino acid catabolism |
| 0.1 | 3.5 | REACTOME INTERACTION BETWEEN L1 AND ANKYRINS | Genes involved in Interaction between L1 and Ankyrins |
| 0.1 | 1.9 | REACTOME HS GAG DEGRADATION | Genes involved in HS-GAG degradation |
| 0.1 | 1.9 | REACTOME OTHER SEMAPHORIN INTERACTIONS | Genes involved in Other semaphorin interactions |
| 0.0 | 1.3 | REACTOME ABCA TRANSPORTERS IN LIPID HOMEOSTASIS | Genes involved in ABCA transporters in lipid homeostasis |
| 0.0 | 2.0 | REACTOME SIGNALING BY HIPPO | Genes involved in Signaling by Hippo |
| 0.0 | 1.0 | REACTOME REGULATION OF RHEB GTPASE ACTIVITY BY AMPK | Genes involved in Regulation of Rheb GTPase activity by AMPK |
| 0.0 | 2.0 | REACTOME DCC MEDIATED ATTRACTIVE SIGNALING | Genes involved in DCC mediated attractive signaling |
| 0.0 | 2.8 | REACTOME ION TRANSPORT BY P TYPE ATPASES | Genes involved in Ion transport by P-type ATPases |
| 0.0 | 1.8 | REACTOME GABA A RECEPTOR ACTIVATION | Genes involved in GABA A receptor activation |
| 0.0 | 1.4 | REACTOME TERMINATION OF O GLYCAN BIOSYNTHESIS | Genes involved in Termination of O-glycan biosynthesis |
| 0.0 | 1.5 | REACTOME OXYGEN DEPENDENT PROLINE HYDROXYLATION OF HYPOXIA INDUCIBLE FACTOR ALPHA | Genes involved in Oxygen-dependent Proline Hydroxylation of Hypoxia-inducible Factor Alpha |
| 0.0 | 1.0 | REACTOME NA CL DEPENDENT NEUROTRANSMITTER TRANSPORTERS | Genes involved in Na+/Cl- dependent neurotransmitter transporters |
| 0.0 | 1.8 | REACTOME RAP1 SIGNALLING | Genes involved in Rap1 signalling |
| 0.0 | 1.3 | REACTOME SYNTHESIS SECRETION AND INACTIVATION OF GLP1 | Genes involved in Synthesis, Secretion, and Inactivation of Glucagon-like Peptide-1 (GLP-1) |
| 0.0 | 1.3 | REACTOME CHOLESTEROL BIOSYNTHESIS | Genes involved in Cholesterol biosynthesis |
| 0.0 | 1.2 | REACTOME EFFECTS OF PIP2 HYDROLYSIS | Genes involved in Effects of PIP2 hydrolysis |
| 0.0 | 1.4 | REACTOME NETRIN1 SIGNALING | Genes involved in Netrin-1 signaling |
| 0.0 | 0.6 | REACTOME DSCAM INTERACTIONS | Genes involved in DSCAM interactions |
| 0.0 | 0.4 | REACTOME PLATELET CALCIUM HOMEOSTASIS | Genes involved in Platelet calcium homeostasis |
| 0.0 | 0.2 | REACTOME CYTOSOLIC TRNA AMINOACYLATION | Genes involved in Cytosolic tRNA aminoacylation |
| 0.0 | 1.0 | REACTOME SYNTHESIS OF PA | Genes involved in Synthesis of PA |
| 0.0 | 0.4 | REACTOME REGULATION OF PYRUVATE DEHYDROGENASE PDH COMPLEX | Genes involved in Regulation of pyruvate dehydrogenase (PDH) complex |
| 0.0 | 0.5 | REACTOME CLASS C 3 METABOTROPIC GLUTAMATE PHEROMONE RECEPTORS | Genes involved in Class C/3 (Metabotropic glutamate/pheromone receptors) |
| 0.0 | 0.3 | REACTOME P38MAPK EVENTS | Genes involved in p38MAPK events |
| 0.0 | 0.5 | REACTOME PURINE SALVAGE | Genes involved in Purine salvage |
| 0.0 | 1.1 | REACTOME GRB2 EVENTS IN ERBB2 SIGNALING | Genes involved in GRB2 events in ERBB2 signaling |
| 0.0 | 0.2 | REACTOME PROSTANOID LIGAND RECEPTORS | Genes involved in Prostanoid ligand receptors |
| 0.0 | 0.6 | REACTOME IONOTROPIC ACTIVITY OF KAINATE RECEPTORS | Genes involved in Ionotropic activity of Kainate Receptors |
| 0.0 | 0.7 | REACTOME BASIGIN INTERACTIONS | Genes involved in Basigin interactions |
| 0.0 | 0.8 | REACTOME SIGNAL TRANSDUCTION BY L1 | Genes involved in Signal transduction by L1 |
| 0.0 | 0.6 | REACTOME SEMA4D INDUCED CELL MIGRATION AND GROWTH CONE COLLAPSE | Genes involved in Sema4D induced cell migration and growth-cone collapse |
| 0.0 | 1.0 | REACTOME VOLTAGE GATED POTASSIUM CHANNELS | Genes involved in Voltage gated Potassium channels |
| 0.0 | 0.1 | REACTOME ADP SIGNALLING THROUGH P2RY1 | Genes involved in ADP signalling through P2Y purinoceptor 1 |
| 0.0 | 1.3 | REACTOME GOLGI ASSOCIATED VESICLE BIOGENESIS | Genes involved in Golgi Associated Vesicle Biogenesis |
| 0.0 | 0.5 | REACTOME KERATAN SULFATE BIOSYNTHESIS | Genes involved in Keratan sulfate biosynthesis |
| 0.0 | 1.2 | REACTOME NCAM1 INTERACTIONS | Genes involved in NCAM1 interactions |
| 0.0 | 0.5 | REACTOME DARPP 32 EVENTS | Genes involved in DARPP-32 events |
| 0.0 | 1.2 | REACTOME LOSS OF NLP FROM MITOTIC CENTROSOMES | Genes involved in Loss of Nlp from mitotic centrosomes |
| 0.0 | 1.3 | REACTOME POTASSIUM CHANNELS | Genes involved in Potassium Channels |
| 0.0 | 1.3 | REACTOME CLASS B 2 SECRETIN FAMILY RECEPTORS | Genes involved in Class B/2 (Secretin family receptors) |
| 0.0 | 0.4 | REACTOME POST TRANSLATIONAL MODIFICATION SYNTHESIS OF GPI ANCHORED PROTEINS | Genes involved in Post-translational modification: synthesis of GPI-anchored proteins |