| 2.8 |
8.4 |
GO:1903280 |
negative regulation of calcium:sodium antiporter activity(GO:1903280) |
| 2.5 |
14.8 |
GO:0051622 |
negative regulation of dopamine uptake involved in synaptic transmission(GO:0051585) norepinephrine uptake(GO:0051620) regulation of norepinephrine uptake(GO:0051621) negative regulation of norepinephrine uptake(GO:0051622) negative regulation of catecholamine uptake involved in synaptic transmission(GO:0051945) regulation of glutathione peroxidase activity(GO:1903282) positive regulation of glutathione peroxidase activity(GO:1903284) positive regulation of hydrogen peroxide catabolic process(GO:1903285) positive regulation of peroxidase activity(GO:2000470) |
| 2.3 |
9.0 |
GO:0033693 |
neurofilament bundle assembly(GO:0033693) |
| 2.0 |
6.1 |
GO:1904692 |
positive regulation of type B pancreatic cell proliferation(GO:1904692) |
| 1.9 |
13.3 |
GO:0051611 |
negative regulation of neurotransmitter uptake(GO:0051581) regulation of serotonin uptake(GO:0051611) negative regulation of serotonin uptake(GO:0051612) |
| 1.7 |
6.7 |
GO:0031117 |
positive regulation of microtubule depolymerization(GO:0031117) |
| 1.6 |
4.7 |
GO:0050760 |
negative regulation of thymidylate synthase biosynthetic process(GO:0050760) |
| 1.5 |
6.1 |
GO:0040040 |
thermosensory behavior(GO:0040040) |
| 1.5 |
1.5 |
GO:0033602 |
negative regulation of dopamine secretion(GO:0033602) |
| 1.5 |
5.9 |
GO:0098971 |
anterograde dendritic transport of neurotransmitter receptor complex(GO:0098971) |
| 1.5 |
4.4 |
GO:0051939 |
gamma-aminobutyric acid import(GO:0051939) |
| 1.4 |
19.7 |
GO:1901731 |
positive regulation of platelet aggregation(GO:1901731) |
| 1.4 |
12.2 |
GO:0007197 |
adenylate cyclase-inhibiting G-protein coupled acetylcholine receptor signaling pathway(GO:0007197) |
| 1.3 |
1.3 |
GO:0014049 |
positive regulation of glutamate secretion(GO:0014049) |
| 1.3 |
4.0 |
GO:0003218 |
cardiac left ventricle formation(GO:0003218) |
| 1.3 |
3.9 |
GO:0021529 |
spinal cord oligodendrocyte cell differentiation(GO:0021529) spinal cord oligodendrocyte cell fate specification(GO:0021530) |
| 1.3 |
3.9 |
GO:0061713 |
neural crest cell migration involved in heart formation(GO:0003147) anterior neural tube closure(GO:0061713) |
| 1.2 |
3.7 |
GO:1901492 |
positive regulation of lymphangiogenesis(GO:1901492) |
| 1.2 |
12.4 |
GO:0099566 |
regulation of postsynaptic cytosolic calcium ion concentration(GO:0099566) |
| 1.2 |
8.6 |
GO:0015798 |
myo-inositol transport(GO:0015798) |
| 1.2 |
4.9 |
GO:0038060 |
nitric oxide-cGMP-mediated signaling pathway(GO:0038060) |
| 1.2 |
3.6 |
GO:0042137 |
sequestering of neurotransmitter(GO:0042137) |
| 1.2 |
9.4 |
GO:1990262 |
regulation of anti-Mullerian hormone signaling pathway(GO:1902612) negative regulation of anti-Mullerian hormone signaling pathway(GO:1902613) anti-Mullerian hormone signaling pathway(GO:1990262) |
| 1.2 |
4.7 |
GO:0030185 |
nitric oxide transport(GO:0030185) |
| 1.2 |
3.5 |
GO:1905204 |
regulation of connective tissue replacement involved in inflammatory response wound healing(GO:1904596) negative regulation of connective tissue replacement involved in inflammatory response wound healing(GO:1904597) regulation of advanced glycation end-product receptor activity(GO:1904603) negative regulation of advanced glycation end-product receptor activity(GO:1904604) negative regulation of connective tissue replacement(GO:1905204) |
| 1.2 |
10.5 |
GO:0031630 |
regulation of synaptic vesicle fusion to presynaptic membrane(GO:0031630) |
| 1.1 |
21.5 |
GO:0090361 |
platelet-derived growth factor production(GO:0090360) regulation of platelet-derived growth factor production(GO:0090361) |
| 1.1 |
5.6 |
GO:0035962 |
response to interleukin-13(GO:0035962) |
| 1.1 |
4.4 |
GO:1901624 |
negative regulation of lymphocyte chemotaxis(GO:1901624) |
| 1.1 |
4.4 |
GO:0045763 |
negative regulation of cellular amino acid metabolic process(GO:0045763) |
| 1.1 |
7.6 |
GO:0051012 |
microtubule sliding(GO:0051012) |
| 1.1 |
3.2 |
GO:1904397 |
negative regulation of neuromuscular junction development(GO:1904397) |
| 1.1 |
2.1 |
GO:0061394 |
regulation of transcription from RNA polymerase II promoter in response to arsenic-containing substance(GO:0061394) |
| 1.0 |
5.2 |
GO:1901202 |
negative regulation of extracellular matrix assembly(GO:1901202) |
| 1.0 |
1.0 |
GO:0046586 |
regulation of calcium-dependent cell-cell adhesion(GO:0046586) |
| 1.0 |
2.0 |
GO:1903281 |
positive regulation of calcium:sodium antiporter activity(GO:1903281) |
| 1.0 |
18.2 |
GO:0016188 |
synaptic vesicle maturation(GO:0016188) |
| 1.0 |
3.9 |
GO:0051410 |
detoxification of nitrogen compound(GO:0051410) cellular detoxification of nitrogen compound(GO:0070458) |
| 1.0 |
6.8 |
GO:0061364 |
apoptotic process involved in luteolysis(GO:0061364) |
| 1.0 |
1.0 |
GO:0060406 |
positive regulation of penile erection(GO:0060406) |
| 0.9 |
0.9 |
GO:0061110 |
dense core granule biogenesis(GO:0061110) regulation of dense core granule biogenesis(GO:2000705) |
| 0.9 |
2.8 |
GO:1905006 |
negative regulation of epithelial to mesenchymal transition involved in endocardial cushion formation(GO:1905006) |
| 0.9 |
2.8 |
GO:0071206 |
establishment of protein localization to juxtaparanode region of axon(GO:0071206) |
| 0.9 |
3.7 |
GO:1903892 |
negative regulation of ATF6-mediated unfolded protein response(GO:1903892) |
| 0.9 |
5.6 |
GO:0002543 |
activation of blood coagulation via clotting cascade(GO:0002543) |
| 0.9 |
2.7 |
GO:0021718 |
superior olivary nucleus development(GO:0021718) superior olivary nucleus maturation(GO:0021722) |
| 0.9 |
2.7 |
GO:1902938 |
regulation of intracellular calcium activated chloride channel activity(GO:1902938) |
| 0.9 |
53.7 |
GO:0007214 |
gamma-aminobutyric acid signaling pathway(GO:0007214) |
| 0.9 |
0.9 |
GO:0060435 |
bronchiole development(GO:0060435) |
| 0.9 |
20.8 |
GO:0007021 |
tubulin complex assembly(GO:0007021) |
| 0.9 |
4.5 |
GO:1903906 |
plasma membrane raft distribution(GO:0044855) plasma membrane raft localization(GO:0044856) plasma membrane raft polarization(GO:0044858) regulation of plasma membrane raft polarization(GO:1903906) |
| 0.9 |
5.3 |
GO:0099525 |
presynaptic dense core granule exocytosis(GO:0099525) |
| 0.9 |
2.6 |
GO:1903515 |
calcium ion transport from cytosol to endoplasmic reticulum(GO:1903515) |
| 0.9 |
2.6 |
GO:0097212 |
lysosomal membrane organization(GO:0097212) |
| 0.9 |
10.4 |
GO:0071787 |
endoplasmic reticulum tubular network assembly(GO:0071787) |
| 0.9 |
16.2 |
GO:0098870 |
neuronal action potential propagation(GO:0019227) action potential propagation(GO:0098870) |
| 0.9 |
2.6 |
GO:2000656 |
regulation of apolipoprotein binding(GO:2000656) negative regulation of apolipoprotein binding(GO:2000657) |
| 0.9 |
4.3 |
GO:0033058 |
directional locomotion(GO:0033058) |
| 0.8 |
2.5 |
GO:0072134 |
nephrogenic mesenchyme morphogenesis(GO:0072134) |
| 0.8 |
2.5 |
GO:0055095 |
lipoprotein particle mediated signaling(GO:0055095) low-density lipoprotein particle mediated signaling(GO:0055096) |
| 0.8 |
13.5 |
GO:0070779 |
D-aspartate transport(GO:0070777) D-aspartate import(GO:0070779) |
| 0.8 |
2.5 |
GO:1990172 |
G-protein coupled receptor catabolic process(GO:1990172) |
| 0.8 |
2.5 |
GO:0014052 |
regulation of gamma-aminobutyric acid secretion(GO:0014052) |
| 0.8 |
17.4 |
GO:0031115 |
negative regulation of microtubule polymerization(GO:0031115) |
| 0.8 |
3.3 |
GO:1904980 |
positive regulation of endosome organization(GO:1904980) |
| 0.8 |
1.6 |
GO:0007412 |
axon target recognition(GO:0007412) |
| 0.8 |
2.4 |
GO:0014876 |
response to injury involved in regulation of muscle adaptation(GO:0014876) |
| 0.8 |
15.2 |
GO:0048172 |
regulation of short-term neuronal synaptic plasticity(GO:0048172) |
| 0.8 |
4.0 |
GO:0018352 |
protein-pyridoxal-5-phosphate linkage(GO:0018352) |
| 0.8 |
7.2 |
GO:0001878 |
response to yeast(GO:0001878) |
| 0.8 |
2.4 |
GO:0051463 |
negative regulation of cortisol secretion(GO:0051463) |
| 0.8 |
4.0 |
GO:1905203 |
regulation of connective tissue replacement(GO:1905203) positive regulation of connective tissue replacement(GO:1905205) |
| 0.8 |
2.4 |
GO:0051041 |
positive regulation of calcium-independent cell-cell adhesion(GO:0051041) |
| 0.8 |
5.5 |
GO:0038195 |
urokinase plasminogen activator signaling pathway(GO:0038195) |
| 0.8 |
2.4 |
GO:1901388 |
regulation of transforming growth factor beta activation(GO:1901388) negative regulation of transforming growth factor beta activation(GO:1901389) |
| 0.8 |
0.8 |
GO:0070945 |
neutrophil mediated killing of gram-negative bacterium(GO:0070945) |
| 0.8 |
3.9 |
GO:0051866 |
general adaptation syndrome(GO:0051866) |
| 0.8 |
9.3 |
GO:1903275 |
regulation of sodium ion export(GO:1903273) positive regulation of sodium ion export(GO:1903275) regulation of sodium ion export from cell(GO:1903276) positive regulation of sodium ion export from cell(GO:1903278) |
| 0.8 |
4.7 |
GO:0071874 |
cellular response to norepinephrine stimulus(GO:0071874) |
| 0.8 |
2.3 |
GO:0050717 |
positive regulation of interleukin-1 alpha secretion(GO:0050717) |
| 0.8 |
1.5 |
GO:0048371 |
lateral mesodermal cell differentiation(GO:0048371) |
| 0.8 |
3.8 |
GO:0070352 |
positive regulation of white fat cell proliferation(GO:0070352) |
| 0.7 |
3.0 |
GO:1905150 |
regulation of voltage-gated sodium channel activity(GO:1905150) |
| 0.7 |
10.5 |
GO:0046958 |
nonassociative learning(GO:0046958) |
| 0.7 |
3.0 |
GO:0035498 |
carnosine metabolic process(GO:0035498) |
| 0.7 |
3.7 |
GO:0035544 |
negative regulation of SNARE complex assembly(GO:0035544) |
| 0.7 |
2.2 |
GO:0060466 |
CD24 biosynthetic process(GO:0035724) activation of meiosis involved in egg activation(GO:0060466) negative regulation of monocyte extravasation(GO:2000438) regulation of CD24 biosynthetic process(GO:2000559) positive regulation of CD24 biosynthetic process(GO:2000560) |
| 0.7 |
9.6 |
GO:0098887 |
neurotransmitter receptor transport, endosome to postsynaptic membrane(GO:0098887) |
| 0.7 |
1.5 |
GO:0032053 |
ciliary basal body organization(GO:0032053) |
| 0.7 |
1.5 |
GO:1990504 |
dense core granule exocytosis(GO:1990504) |
| 0.7 |
2.1 |
GO:0032849 |
positive regulation of cellular pH reduction(GO:0032849) |
| 0.7 |
3.6 |
GO:0099558 |
maintenance of synapse structure(GO:0099558) |
| 0.7 |
4.3 |
GO:0010387 |
COP9 signalosome assembly(GO:0010387) |
| 0.7 |
3.6 |
GO:0006500 |
N-terminal protein palmitoylation(GO:0006500) |
| 0.7 |
1.4 |
GO:0042660 |
positive regulation of cell fate specification(GO:0042660) |
| 0.7 |
2.8 |
GO:0010807 |
regulation of synaptic vesicle priming(GO:0010807) |
| 0.7 |
3.5 |
GO:0070982 |
L-asparagine biosynthetic process(GO:0070981) L-asparagine metabolic process(GO:0070982) |
| 0.7 |
2.1 |
GO:0001928 |
regulation of exocyst assembly(GO:0001928) regulation of exocyst localization(GO:0060178) |
| 0.7 |
23.5 |
GO:0061577 |
calcium ion transmembrane transport via high voltage-gated calcium channel(GO:0061577) |
| 0.7 |
4.1 |
GO:1904209 |
regulation of chemokine (C-C motif) ligand 2 secretion(GO:1904207) positive regulation of chemokine (C-C motif) ligand 2 secretion(GO:1904209) |
| 0.7 |
2.7 |
GO:0010645 |
regulation of cell communication by chemical coupling(GO:0010645) positive regulation of cell communication by chemical coupling(GO:0010652) |
| 0.7 |
8.1 |
GO:0003190 |
atrioventricular valve formation(GO:0003190) |
| 0.7 |
13.5 |
GO:0061302 |
smooth muscle cell-matrix adhesion(GO:0061302) |
| 0.7 |
4.0 |
GO:0006127 |
glycerophosphate shuttle(GO:0006127) |
| 0.7 |
2.6 |
GO:1902683 |
regulation of receptor localization to synapse(GO:1902683) |
| 0.7 |
2.6 |
GO:0070434 |
positive regulation of nucleotide-binding oligomerization domain containing signaling pathway(GO:0070426) positive regulation of nucleotide-binding oligomerization domain containing 2 signaling pathway(GO:0070434) |
| 0.7 |
19.7 |
GO:0032291 |
central nervous system myelination(GO:0022010) axon ensheathment in central nervous system(GO:0032291) |
| 0.7 |
3.3 |
GO:1900738 |
positive regulation of phospholipase C-activating G-protein coupled receptor signaling pathway(GO:1900738) |
| 0.6 |
3.2 |
GO:0097105 |
presynaptic membrane assembly(GO:0097105) |
| 0.6 |
9.1 |
GO:0007621 |
negative regulation of female receptivity(GO:0007621) |
| 0.6 |
3.2 |
GO:1904566 |
response to 1-oleoyl-sn-glycerol 3-phosphate(GO:1904565) cellular response to 1-oleoyl-sn-glycerol 3-phosphate(GO:1904566) |
| 0.6 |
3.2 |
GO:0072144 |
glomerular mesangial cell development(GO:0072144) |
| 0.6 |
29.8 |
GO:0007158 |
neuron cell-cell adhesion(GO:0007158) |
| 0.6 |
2.5 |
GO:0061573 |
endoplasmic reticulum polarization(GO:0061163) actin filament bundle retrograde transport(GO:0061573) actin filament bundle distribution(GO:0070650) |
| 0.6 |
1.9 |
GO:0003099 |
positive regulation of the force of heart contraction by chemical signal(GO:0003099) |
| 0.6 |
1.9 |
GO:1902988 |
neurofibrillary tangle assembly(GO:1902988) |
| 0.6 |
1.9 |
GO:1901069 |
guanosine-containing compound catabolic process(GO:1901069) |
| 0.6 |
10.6 |
GO:0070445 |
oligodendrocyte progenitor proliferation(GO:0070444) regulation of oligodendrocyte progenitor proliferation(GO:0070445) |
| 0.6 |
3.7 |
GO:0093001 |
glycolysis from storage polysaccharide through glucose-1-phosphate(GO:0093001) |
| 0.6 |
6.8 |
GO:0060025 |
primary heart field specification(GO:0003138) sinoatrial valve development(GO:0003172) sinoatrial valve morphogenesis(GO:0003185) regulation of synaptic activity(GO:0060025) |
| 0.6 |
4.3 |
GO:2000821 |
regulation of grooming behavior(GO:2000821) |
| 0.6 |
10.3 |
GO:0071205 |
protein localization to juxtaparanode region of axon(GO:0071205) |
| 0.6 |
5.4 |
GO:0043314 |
negative regulation of neutrophil degranulation(GO:0043314) |
| 0.6 |
1.8 |
GO:0099624 |
membrane repolarization during atrial cardiac muscle cell action potential(GO:0098914) atrial cardiac muscle cell membrane repolarization(GO:0099624) |
| 0.6 |
1.2 |
GO:1903937 |
response to acrylamide(GO:1903937) |
| 0.6 |
7.8 |
GO:0042985 |
negative regulation of amyloid precursor protein biosynthetic process(GO:0042985) |
| 0.6 |
3.0 |
GO:0015688 |
iron chelate transport(GO:0015688) siderophore transport(GO:0015891) |
| 0.6 |
11.3 |
GO:0016540 |
protein autoprocessing(GO:0016540) |
| 0.6 |
2.4 |
GO:1902310 |
positive regulation of peptidyl-serine dephosphorylation(GO:1902310) |
| 0.6 |
1.8 |
GO:0006173 |
dADP biosynthetic process(GO:0006173) |
| 0.6 |
4.7 |
GO:0071802 |
negative regulation of podosome assembly(GO:0071802) |
| 0.6 |
2.3 |
GO:0032499 |
detection of peptidoglycan(GO:0032499) |
| 0.6 |
4.1 |
GO:0060373 |
regulation of ventricular cardiac muscle cell membrane depolarization(GO:0060373) |
| 0.6 |
0.6 |
GO:0048677 |
axon extension involved in regeneration(GO:0048677) sprouting of injured axon(GO:0048682) |
| 0.6 |
4.1 |
GO:0016198 |
axon choice point recognition(GO:0016198) |
| 0.6 |
4.6 |
GO:0071918 |
urea transmembrane transport(GO:0071918) |
| 0.6 |
12.7 |
GO:0032060 |
bleb assembly(GO:0032060) |
| 0.6 |
2.9 |
GO:0009099 |
branched-chain amino acid biosynthetic process(GO:0009082) leucine biosynthetic process(GO:0009098) valine biosynthetic process(GO:0009099) |
| 0.6 |
8.0 |
GO:0090394 |
negative regulation of excitatory postsynaptic potential(GO:0090394) |
| 0.6 |
12.5 |
GO:2000480 |
negative regulation of cAMP-dependent protein kinase activity(GO:2000480) |
| 0.6 |
15.9 |
GO:2001135 |
regulation of endocytic recycling(GO:2001135) |
| 0.6 |
2.3 |
GO:0030644 |
cellular chloride ion homeostasis(GO:0030644) |
| 0.6 |
1.1 |
GO:0045113 |
regulation of integrin biosynthetic process(GO:0045113) |
| 0.6 |
0.6 |
GO:0003214 |
cardiac left ventricle morphogenesis(GO:0003214) |
| 0.6 |
3.3 |
GO:0090272 |
negative regulation of fibroblast growth factor production(GO:0090272) |
| 0.5 |
2.7 |
GO:0007497 |
posterior midgut development(GO:0007497) enteric smooth muscle cell differentiation(GO:0035645) |
| 0.5 |
10.3 |
GO:0030208 |
dermatan sulfate biosynthetic process(GO:0030208) |
| 0.5 |
1.1 |
GO:2000302 |
positive regulation of synaptic vesicle exocytosis(GO:2000302) |
| 0.5 |
0.5 |
GO:0030311 |
poly-N-acetyllactosamine biosynthetic process(GO:0030311) |
| 0.5 |
3.2 |
GO:1904978 |
regulation of endosome organization(GO:1904978) |
| 0.5 |
1.6 |
GO:1904579 |
response to thapsigargin(GO:1904578) cellular response to thapsigargin(GO:1904579) |
| 0.5 |
1.6 |
GO:0098886 |
modification of dendritic spine(GO:0098886) |
| 0.5 |
2.7 |
GO:0021957 |
corticospinal tract morphogenesis(GO:0021957) |
| 0.5 |
0.5 |
GO:0031987 |
locomotion involved in locomotory behavior(GO:0031987) |
| 0.5 |
1.1 |
GO:0010578 |
regulation of adenylate cyclase activity involved in G-protein coupled receptor signaling pathway(GO:0010578) positive regulation of adenylate cyclase activity involved in G-protein coupled receptor signaling pathway(GO:0010579) |
| 0.5 |
13.8 |
GO:0031915 |
positive regulation of synaptic plasticity(GO:0031915) |
| 0.5 |
1.1 |
GO:0019065 |
receptor-mediated endocytosis of virus by host cell(GO:0019065) endocytosis involved in viral entry into host cell(GO:0075509) |
| 0.5 |
2.1 |
GO:0006781 |
succinyl-CoA pathway(GO:0006781) |
| 0.5 |
2.6 |
GO:0051643 |
endoplasmic reticulum localization(GO:0051643) |
| 0.5 |
2.6 |
GO:0086029 |
Purkinje myocyte to ventricular cardiac muscle cell signaling(GO:0086029) Purkinje myocyte to ventricular cardiac muscle cell communication(GO:0086068) |
| 0.5 |
3.1 |
GO:0016185 |
synaptic vesicle budding from presynaptic endocytic zone membrane(GO:0016185) |
| 0.5 |
3.6 |
GO:0035494 |
SNARE complex disassembly(GO:0035494) |
| 0.5 |
1.6 |
GO:0046878 |
positive regulation of saliva secretion(GO:0046878) |
| 0.5 |
1.0 |
GO:0001692 |
histamine metabolic process(GO:0001692) |
| 0.5 |
3.1 |
GO:0090027 |
negative regulation of monocyte chemotaxis(GO:0090027) |
| 0.5 |
2.6 |
GO:0060480 |
lung goblet cell differentiation(GO:0060480) |
| 0.5 |
1.0 |
GO:0045715 |
negative regulation of low-density lipoprotein particle receptor biosynthetic process(GO:0045715) |
| 0.5 |
2.0 |
GO:0090285 |
negative regulation of protein glycosylation in Golgi(GO:0090285) |
| 0.5 |
1.5 |
GO:0001188 |
RNA polymerase I transcriptional preinitiation complex assembly(GO:0001188) RNA polymerase I transcriptional preinitiation complex assembly at the promoter for the nuclear large rRNA transcript(GO:0001189) |
| 0.5 |
1.5 |
GO:0072720 |
response to dithiothreitol(GO:0072720) |
| 0.5 |
1.5 |
GO:0060981 |
cell migration involved in coronary angiogenesis(GO:0060981) |
| 0.5 |
1.0 |
GO:0070093 |
negative regulation of glucagon secretion(GO:0070093) |
| 0.5 |
0.5 |
GO:1903984 |
positive regulation of TRAIL-activated apoptotic signaling pathway(GO:1903984) |
| 0.5 |
5.5 |
GO:0097646 |
dimeric G-protein coupled receptor signaling pathway(GO:0038042) calcitonin family receptor signaling pathway(GO:0097646) amylin receptor signaling pathway(GO:0097647) |
| 0.5 |
2.5 |
GO:2000312 |
regulation of kainate selective glutamate receptor activity(GO:2000312) |
| 0.5 |
2.0 |
GO:0018125 |
peptidyl-cysteine methylation(GO:0018125) |
| 0.5 |
5.5 |
GO:2000324 |
positive regulation of glucocorticoid receptor signaling pathway(GO:2000324) |
| 0.5 |
1.5 |
GO:1904956 |
regulation of midbrain dopaminergic neuron differentiation(GO:1904956) |
| 0.5 |
6.9 |
GO:0060081 |
membrane hyperpolarization(GO:0060081) |
| 0.5 |
3.5 |
GO:1904020 |
regulation of G-protein coupled receptor internalization(GO:1904020) |
| 0.5 |
4.9 |
GO:0060075 |
regulation of resting membrane potential(GO:0060075) |
| 0.5 |
2.5 |
GO:0051758 |
homologous chromosome movement towards spindle pole involved in homologous chromosome segregation(GO:0051758) |
| 0.5 |
2.4 |
GO:0032425 |
positive regulation of mismatch repair(GO:0032425) |
| 0.5 |
1.9 |
GO:0045964 |
positive regulation of catecholamine metabolic process(GO:0045915) positive regulation of dopamine metabolic process(GO:0045964) |
| 0.5 |
3.4 |
GO:0033029 |
regulation of neutrophil apoptotic process(GO:0033029) |
| 0.5 |
1.4 |
GO:0036323 |
vascular endothelial growth factor receptor-1 signaling pathway(GO:0036323) |
| 0.5 |
1.4 |
GO:0050976 |
detection of mechanical stimulus involved in sensory perception of touch(GO:0050976) |
| 0.5 |
19.6 |
GO:0035640 |
exploration behavior(GO:0035640) |
| 0.5 |
3.8 |
GO:1900827 |
maintenance of protein location in membrane(GO:0072658) maintenance of protein location in plasma membrane(GO:0072660) positive regulation of membrane depolarization during cardiac muscle cell action potential(GO:1900827) |
| 0.5 |
1.0 |
GO:0042998 |
positive regulation of Golgi to plasma membrane protein transport(GO:0042998) |
| 0.5 |
6.7 |
GO:0070327 |
thyroid hormone transport(GO:0070327) |
| 0.5 |
0.5 |
GO:1904349 |
regulation of small intestine smooth muscle contraction(GO:1904347) positive regulation of small intestine smooth muscle contraction(GO:1904349) small intestine smooth muscle contraction(GO:1990770) |
| 0.5 |
1.4 |
GO:0017186 |
peptidyl-pyroglutamic acid biosynthetic process, using glutaminyl-peptide cyclotransferase(GO:0017186) |
| 0.5 |
1.9 |
GO:0042414 |
epinephrine metabolic process(GO:0042414) |
| 0.5 |
1.9 |
GO:1902513 |
regulation of organelle transport along microtubule(GO:1902513) |
| 0.5 |
1.4 |
GO:1902309 |
negative regulation of peptidyl-serine dephosphorylation(GO:1902309) |
| 0.5 |
8.4 |
GO:0021702 |
cerebellar Purkinje cell layer formation(GO:0021694) cerebellar Purkinje cell differentiation(GO:0021702) |
| 0.5 |
2.3 |
GO:0001971 |
negative regulation of activation of membrane attack complex(GO:0001971) |
| 0.5 |
5.6 |
GO:2001288 |
positive regulation of caveolin-mediated endocytosis(GO:2001288) |
| 0.5 |
10.3 |
GO:0019800 |
peptide cross-linking via chondroitin 4-sulfate glycosaminoglycan(GO:0019800) |
| 0.5 |
3.3 |
GO:0018032 |
protein amidation(GO:0018032) |
| 0.5 |
1.4 |
GO:1902598 |
creatine transport(GO:0015881) creatine transmembrane transport(GO:1902598) |
| 0.5 |
4.6 |
GO:0030043 |
actin filament fragmentation(GO:0030043) |
| 0.5 |
0.5 |
GO:0035026 |
leading edge cell differentiation(GO:0035026) |
| 0.5 |
6.9 |
GO:0007258 |
JUN phosphorylation(GO:0007258) |
| 0.5 |
7.3 |
GO:0031584 |
activation of phospholipase D activity(GO:0031584) |
| 0.5 |
1.8 |
GO:0061357 |
positive regulation of Wnt protein secretion(GO:0061357) |
| 0.5 |
0.9 |
GO:0008065 |
establishment of blood-nerve barrier(GO:0008065) |
| 0.5 |
1.4 |
GO:0006683 |
galactosylceramide catabolic process(GO:0006683) |
| 0.4 |
4.0 |
GO:0061052 |
negative regulation of cell growth involved in cardiac muscle cell development(GO:0061052) |
| 0.4 |
0.9 |
GO:0099590 |
neurotransmitter receptor internalization(GO:0099590) |
| 0.4 |
1.8 |
GO:0098957 |
anterograde axonal transport of mitochondrion(GO:0098957) |
| 0.4 |
1.8 |
GO:0045163 |
clustering of voltage-gated potassium channels(GO:0045163) |
| 0.4 |
2.2 |
GO:0060574 |
intestinal epithelial cell maturation(GO:0060574) |
| 0.4 |
1.8 |
GO:0001732 |
formation of cytoplasmic translation initiation complex(GO:0001732) |
| 0.4 |
0.9 |
GO:2000744 |
anterior head development(GO:0097065) regulation of anterior head development(GO:2000742) positive regulation of anterior head development(GO:2000744) |
| 0.4 |
6.2 |
GO:1902902 |
negative regulation of autophagosome assembly(GO:1902902) |
| 0.4 |
0.9 |
GO:0021586 |
pons maturation(GO:0021586) |
| 0.4 |
3.9 |
GO:0010739 |
positive regulation of protein kinase A signaling(GO:0010739) |
| 0.4 |
1.7 |
GO:0050823 |
peptide stabilization(GO:0050822) peptide antigen stabilization(GO:0050823) |
| 0.4 |
4.8 |
GO:0035694 |
mitochondrial protein catabolic process(GO:0035694) |
| 0.4 |
1.3 |
GO:0006667 |
sphinganine metabolic process(GO:0006667) |
| 0.4 |
1.3 |
GO:0071257 |
cellular response to electrical stimulus(GO:0071257) |
| 0.4 |
0.9 |
GO:0014051 |
gamma-aminobutyric acid secretion(GO:0014051) |
| 0.4 |
2.1 |
GO:0038016 |
insulin receptor internalization(GO:0038016) |
| 0.4 |
0.4 |
GO:1900376 |
regulation of melanin biosynthetic process(GO:0048021) regulation of secondary metabolite biosynthetic process(GO:1900376) |
| 0.4 |
1.7 |
GO:0061763 |
multivesicular body-lysosome fusion(GO:0061763) |
| 0.4 |
1.3 |
GO:0099551 |
synaptic signaling via neuropeptide(GO:0099538) trans-synaptic signaling by neuropeptide(GO:0099540) trans-synaptic signaling by neuropeptide, modulating synaptic transmission(GO:0099551) |
| 0.4 |
0.9 |
GO:0033634 |
positive regulation of cell-cell adhesion mediated by integrin(GO:0033634) |
| 0.4 |
3.8 |
GO:2000311 |
regulation of alpha-amino-3-hydroxy-5-methyl-4-isoxazole propionate selective glutamate receptor activity(GO:2000311) |
| 0.4 |
5.5 |
GO:0007196 |
adenylate cyclase-inhibiting G-protein coupled glutamate receptor signaling pathway(GO:0007196) |
| 0.4 |
0.4 |
GO:0002175 |
protein localization to paranode region of axon(GO:0002175) |
| 0.4 |
0.8 |
GO:0090427 |
activation of meiosis(GO:0090427) |
| 0.4 |
0.8 |
GO:0010643 |
cell communication by chemical coupling(GO:0010643) |
| 0.4 |
11.7 |
GO:0051823 |
regulation of synapse structural plasticity(GO:0051823) |
| 0.4 |
1.3 |
GO:0061182 |
negative regulation of chondrocyte development(GO:0061182) |
| 0.4 |
1.3 |
GO:1903371 |
regulation of endoplasmic reticulum tubular network organization(GO:1903371) |
| 0.4 |
0.4 |
GO:0070837 |
dehydroascorbic acid transport(GO:0070837) |
| 0.4 |
5.4 |
GO:0015820 |
leucine transport(GO:0015820) |
| 0.4 |
1.2 |
GO:1901383 |
negative regulation of chorionic trophoblast cell proliferation(GO:1901383) |
| 0.4 |
2.5 |
GO:0097461 |
ferric iron import into cell(GO:0097461) ferric iron import across plasma membrane(GO:0098706) |
| 0.4 |
1.2 |
GO:0097010 |
eukaryotic translation initiation factor 4F complex assembly(GO:0097010) |
| 0.4 |
1.2 |
GO:0014028 |
notochord formation(GO:0014028) |
| 0.4 |
0.8 |
GO:0032915 |
positive regulation of transforming growth factor beta2 production(GO:0032915) |
| 0.4 |
3.3 |
GO:1900383 |
regulation of synaptic plasticity by receptor localization to synapse(GO:1900383) |
| 0.4 |
15.5 |
GO:2000300 |
regulation of synaptic vesicle exocytosis(GO:2000300) |
| 0.4 |
4.5 |
GO:0032482 |
Rab protein signal transduction(GO:0032482) |
| 0.4 |
2.4 |
GO:2000825 |
positive regulation of androgen receptor activity(GO:2000825) |
| 0.4 |
4.9 |
GO:0008343 |
adult feeding behavior(GO:0008343) |
| 0.4 |
6.9 |
GO:0030913 |
paranodal junction assembly(GO:0030913) |
| 0.4 |
1.2 |
GO:0060164 |
regulation of timing of neuron differentiation(GO:0060164) |
| 0.4 |
2.4 |
GO:0023016 |
signal transduction by trans-phosphorylation(GO:0023016) |
| 0.4 |
2.0 |
GO:0072365 |
regulation of cellular ketone metabolic process by negative regulation of transcription from RNA polymerase II promoter(GO:0072365) |
| 0.4 |
6.0 |
GO:0015871 |
choline transport(GO:0015871) |
| 0.4 |
8.3 |
GO:0070262 |
peptidyl-serine dephosphorylation(GO:0070262) |
| 0.4 |
4.4 |
GO:0000160 |
phosphorelay signal transduction system(GO:0000160) |
| 0.4 |
3.6 |
GO:0001705 |
ectoderm formation(GO:0001705) |
| 0.4 |
2.4 |
GO:0071543 |
diadenosine polyphosphate catabolic process(GO:0015961) diphosphoinositol polyphosphate metabolic process(GO:0071543) diadenosine pentaphosphate metabolic process(GO:1901906) diadenosine pentaphosphate catabolic process(GO:1901907) diadenosine hexaphosphate metabolic process(GO:1901908) diadenosine hexaphosphate catabolic process(GO:1901909) adenosine 5'-(hexahydrogen pentaphosphate) metabolic process(GO:1901910) adenosine 5'-(hexahydrogen pentaphosphate) catabolic process(GO:1901911) |
| 0.4 |
0.4 |
GO:0010615 |
positive regulation of cardiac muscle adaptation(GO:0010615) positive regulation of cardiac muscle hypertrophy in response to stress(GO:1903244) |
| 0.4 |
1.6 |
GO:1904529 |
regulation of actin filament binding(GO:1904529) regulation of actin binding(GO:1904616) |
| 0.4 |
2.7 |
GO:0060648 |
mammary gland bud morphogenesis(GO:0060648) |
| 0.4 |
2.0 |
GO:0055099 |
response to high density lipoprotein particle(GO:0055099) |
| 0.4 |
19.5 |
GO:0048488 |
synaptic vesicle endocytosis(GO:0048488) |
| 0.4 |
1.2 |
GO:0003219 |
cardiac right ventricle formation(GO:0003219) |
| 0.4 |
1.2 |
GO:0033591 |
response to L-ascorbic acid(GO:0033591) |
| 0.4 |
1.5 |
GO:0006542 |
glutamine biosynthetic process(GO:0006542) |
| 0.4 |
0.4 |
GO:1990709 |
presynaptic active zone organization(GO:1990709) |
| 0.4 |
1.9 |
GO:0061002 |
negative regulation of dendritic spine morphogenesis(GO:0061002) |
| 0.4 |
0.4 |
GO:0001992 |
regulation of systemic arterial blood pressure by vasopressin(GO:0001992) |
| 0.4 |
2.7 |
GO:0007217 |
tachykinin receptor signaling pathway(GO:0007217) |
| 0.4 |
0.4 |
GO:0051610 |
serotonin uptake(GO:0051610) |
| 0.4 |
1.1 |
GO:0032764 |
negative regulation of mast cell cytokine production(GO:0032764) |
| 0.4 |
3.4 |
GO:0097577 |
intracellular sequestering of iron ion(GO:0006880) sequestering of iron ion(GO:0097577) |
| 0.4 |
0.4 |
GO:0032971 |
regulation of muscle filament sliding(GO:0032971) |
| 0.4 |
2.7 |
GO:0071321 |
cellular response to cGMP(GO:0071321) |
| 0.4 |
4.9 |
GO:1904322 |
response to forskolin(GO:1904321) cellular response to forskolin(GO:1904322) |
| 0.4 |
3.0 |
GO:1901387 |
positive regulation of voltage-gated calcium channel activity(GO:1901387) |
| 0.4 |
1.1 |
GO:2000342 |
negative regulation of chemokine (C-X-C motif) ligand 2 production(GO:2000342) |
| 0.4 |
4.5 |
GO:0031547 |
brain-derived neurotrophic factor receptor signaling pathway(GO:0031547) |
| 0.4 |
0.8 |
GO:2000823 |
regulation of androgen receptor activity(GO:2000823) |
| 0.4 |
1.5 |
GO:0046833 |
positive regulation of RNA export from nucleus(GO:0046833) |
| 0.4 |
0.8 |
GO:0051344 |
negative regulation of cyclic-nucleotide phosphodiesterase activity(GO:0051344) |
| 0.4 |
0.4 |
GO:0002025 |
vasodilation by norepinephrine-epinephrine involved in regulation of systemic arterial blood pressure(GO:0002025) |
| 0.4 |
1.1 |
GO:0072308 |
negative regulation by virus of viral protein levels in host cell(GO:0046725) negative regulation of metanephric nephron tubule epithelial cell differentiation(GO:0072308) |
| 0.4 |
4.5 |
GO:0032364 |
oxygen homeostasis(GO:0032364) |
| 0.4 |
3.0 |
GO:0061000 |
negative regulation of dendritic spine development(GO:0061000) |
| 0.4 |
1.1 |
GO:0090340 |
positive regulation of high-density lipoprotein particle assembly(GO:0090108) positive regulation of secretion of lysosomal enzymes(GO:0090340) |
| 0.4 |
3.0 |
GO:0038172 |
interleukin-33-mediated signaling pathway(GO:0038172) |
| 0.4 |
1.1 |
GO:0090365 |
regulation of mRNA modification(GO:0090365) |
| 0.4 |
4.8 |
GO:0051388 |
positive regulation of neurotrophin TRK receptor signaling pathway(GO:0051388) |
| 0.4 |
1.5 |
GO:0034628 |
nicotinamide nucleotide biosynthetic process from aspartate(GO:0019355) 'de novo' NAD biosynthetic process from aspartate(GO:0034628) |
| 0.4 |
1.1 |
GO:1904106 |
protein localization to microvillus(GO:1904106) |
| 0.4 |
11.4 |
GO:0010669 |
epithelial structure maintenance(GO:0010669) |
| 0.4 |
3.3 |
GO:0002775 |
antimicrobial peptide production(GO:0002775) antibacterial peptide production(GO:0002778) |
| 0.4 |
0.7 |
GO:0070317 |
negative regulation of G0 to G1 transition(GO:0070317) |
| 0.4 |
1.1 |
GO:1901253 |
regulation of intracellular transport of viral material(GO:1901252) negative regulation of intracellular transport of viral material(GO:1901253) |
| 0.4 |
2.9 |
GO:0045906 |
negative regulation of vasoconstriction(GO:0045906) |
| 0.4 |
1.1 |
GO:0046967 |
cytosol to ER transport(GO:0046967) |
| 0.4 |
0.7 |
GO:0061734 |
parkin-mediated mitophagy in response to mitochondrial depolarization(GO:0061734) |
| 0.4 |
0.4 |
GO:1900126 |
negative regulation of hyaluronan biosynthetic process(GO:1900126) |
| 0.4 |
1.4 |
GO:0046603 |
negative regulation of mitotic centrosome separation(GO:0046603) |
| 0.4 |
2.5 |
GO:0045759 |
negative regulation of action potential(GO:0045759) |
| 0.4 |
7.4 |
GO:1904714 |
regulation of chaperone-mediated autophagy(GO:1904714) |
| 0.4 |
2.5 |
GO:0021869 |
forebrain ventricular zone progenitor cell division(GO:0021869) |
| 0.4 |
0.4 |
GO:0071603 |
endothelial cell-cell adhesion(GO:0071603) |
| 0.4 |
1.1 |
GO:0072138 |
mesenchymal cell proliferation involved in ureteric bud development(GO:0072138) |
| 0.3 |
3.1 |
GO:0035766 |
cell chemotaxis to fibroblast growth factor(GO:0035766) endothelial cell chemotaxis to fibroblast growth factor(GO:0035768) regulation of cell chemotaxis to fibroblast growth factor(GO:1904847) regulation of endothelial cell chemotaxis to fibroblast growth factor(GO:2000544) |
| 0.3 |
1.0 |
GO:0018879 |
biphenyl metabolic process(GO:0018879) |
| 0.3 |
2.1 |
GO:1902530 |
regulation of protein linear polyubiquitination(GO:1902528) positive regulation of protein linear polyubiquitination(GO:1902530) |
| 0.3 |
1.0 |
GO:0071503 |
response to heparin(GO:0071503) |
| 0.3 |
0.7 |
GO:0048170 |
positive regulation of long-term neuronal synaptic plasticity(GO:0048170) |
| 0.3 |
2.4 |
GO:0090063 |
positive regulation of microtubule nucleation(GO:0090063) |
| 0.3 |
1.0 |
GO:0061589 |
calcium activated phosphatidylserine scrambling(GO:0061589) |
| 0.3 |
1.4 |
GO:0021831 |
embryonic olfactory bulb interneuron precursor migration(GO:0021831) |
| 0.3 |
1.7 |
GO:0051386 |
regulation of neurotrophin TRK receptor signaling pathway(GO:0051386) |
| 0.3 |
1.0 |
GO:0033341 |
regulation of collagen binding(GO:0033341) |
| 0.3 |
0.7 |
GO:2001027 |
negative regulation of endothelial cell chemotaxis(GO:2001027) |
| 0.3 |
1.0 |
GO:1903526 |
negative regulation of membrane tubulation(GO:1903526) |
| 0.3 |
0.3 |
GO:0051795 |
positive regulation of catagen(GO:0051795) |
| 0.3 |
1.4 |
GO:0072384 |
organelle transport along microtubule(GO:0072384) |
| 0.3 |
0.3 |
GO:0033605 |
positive regulation of catecholamine secretion(GO:0033605) |
| 0.3 |
2.4 |
GO:0030421 |
defecation(GO:0030421) |
| 0.3 |
0.7 |
GO:1903033 |
regulation of microtubule plus-end binding(GO:1903031) positive regulation of microtubule plus-end binding(GO:1903033) |
| 0.3 |
5.1 |
GO:0010499 |
proteasomal ubiquitin-independent protein catabolic process(GO:0010499) |
| 0.3 |
1.3 |
GO:0019520 |
aldonic acid metabolic process(GO:0019520) D-gluconate metabolic process(GO:0019521) |
| 0.3 |
2.4 |
GO:1902966 |
regulation of protein localization to early endosome(GO:1902965) positive regulation of protein localization to early endosome(GO:1902966) |
| 0.3 |
1.0 |
GO:0070079 |
peptidyl-lysine hydroxylation to 5-hydroxy-L-lysine(GO:0018395) histone arginine demethylation(GO:0070077) histone H3-R2 demethylation(GO:0070078) histone H4-R3 demethylation(GO:0070079) |
| 0.3 |
0.7 |
GO:1904924 |
negative regulation of mitophagy in response to mitochondrial depolarization(GO:1904924) |
| 0.3 |
1.0 |
GO:0061537 |
glycine secretion(GO:0061536) glycine secretion, neurotransmission(GO:0061537) |
| 0.3 |
6.0 |
GO:0045636 |
positive regulation of melanocyte differentiation(GO:0045636) |
| 0.3 |
1.0 |
GO:0016344 |
meiotic chromosome movement towards spindle pole(GO:0016344) |
| 0.3 |
1.3 |
GO:0071963 |
establishment or maintenance of cell polarity regulating cell shape(GO:0071963) |
| 0.3 |
1.3 |
GO:1905075 |
occluding junction disassembly(GO:1905071) regulation of occluding junction disassembly(GO:1905073) positive regulation of occluding junction disassembly(GO:1905075) |
| 0.3 |
2.0 |
GO:0099563 |
modification of synaptic structure(GO:0099563) |
| 0.3 |
1.3 |
GO:0097112 |
gamma-aminobutyric acid receptor clustering(GO:0097112) |
| 0.3 |
1.0 |
GO:0000412 |
histone peptidyl-prolyl isomerization(GO:0000412) |
| 0.3 |
9.2 |
GO:0060074 |
synapse maturation(GO:0060074) |
| 0.3 |
0.3 |
GO:0051877 |
pigment granule aggregation in cell center(GO:0051877) |
| 0.3 |
0.3 |
GO:0100012 |
regulation of heart induction(GO:0090381) regulation of heart induction by canonical Wnt signaling pathway(GO:0100012) |
| 0.3 |
3.2 |
GO:0016560 |
protein import into peroxisome matrix, docking(GO:0016560) |
| 0.3 |
10.0 |
GO:0048268 |
clathrin coat assembly(GO:0048268) |
| 0.3 |
0.3 |
GO:0032792 |
negative regulation of CREB transcription factor activity(GO:0032792) |
| 0.3 |
1.9 |
GO:1902951 |
negative regulation of dendritic spine maintenance(GO:1902951) |
| 0.3 |
2.2 |
GO:1900452 |
regulation of long term synaptic depression(GO:1900452) |
| 0.3 |
1.0 |
GO:1902766 |
skeletal muscle satellite cell migration(GO:1902766) |
| 0.3 |
5.4 |
GO:0031284 |
positive regulation of guanylate cyclase activity(GO:0031284) |
| 0.3 |
6.4 |
GO:0001574 |
ganglioside biosynthetic process(GO:0001574) |
| 0.3 |
1.6 |
GO:1904141 |
mammary gland fat development(GO:0060611) positive regulation of macrophage colony-stimulating factor signaling pathway(GO:1902228) positive regulation of response to macrophage colony-stimulating factor(GO:1903971) positive regulation of cellular response to macrophage colony-stimulating factor stimulus(GO:1903974) positive regulation of microglial cell migration(GO:1904141) |
| 0.3 |
1.3 |
GO:1902669 |
positive regulation of axon guidance(GO:1902669) |
| 0.3 |
2.2 |
GO:0048549 |
positive regulation of pinocytosis(GO:0048549) |
| 0.3 |
3.5 |
GO:0072592 |
oxygen metabolic process(GO:0072592) |
| 0.3 |
4.4 |
GO:0015693 |
magnesium ion transport(GO:0015693) |
| 0.3 |
0.9 |
GO:0010593 |
negative regulation of lamellipodium assembly(GO:0010593) |
| 0.3 |
6.3 |
GO:2001197 |
regulation of basement membrane assembly involved in embryonic body morphogenesis(GO:1904259) positive regulation of basement membrane assembly involved in embryonic body morphogenesis(GO:1904261) basement membrane assembly involved in embryonic body morphogenesis(GO:2001197) |
| 0.3 |
3.5 |
GO:1901660 |
calcium ion export(GO:1901660) calcium ion export from cell(GO:1990034) |
| 0.3 |
2.5 |
GO:0050703 |
interleukin-1 alpha secretion(GO:0050703) |
| 0.3 |
0.6 |
GO:0060434 |
bronchus morphogenesis(GO:0060434) |
| 0.3 |
1.2 |
GO:0048817 |
negative regulation of hair follicle maturation(GO:0048817) |
| 0.3 |
5.3 |
GO:0050884 |
neuromuscular process controlling posture(GO:0050884) |
| 0.3 |
0.6 |
GO:0051066 |
dihydrobiopterin metabolic process(GO:0051066) |
| 0.3 |
1.2 |
GO:0036058 |
filtration diaphragm assembly(GO:0036058) slit diaphragm assembly(GO:0036060) |
| 0.3 |
1.5 |
GO:1900449 |
regulation of glutamate receptor signaling pathway(GO:1900449) |
| 0.3 |
2.7 |
GO:0060355 |
positive regulation of cell adhesion molecule production(GO:0060355) |
| 0.3 |
0.9 |
GO:0010766 |
negative regulation of sodium ion transport(GO:0010766) |
| 0.3 |
0.9 |
GO:0060739 |
mesenchymal-epithelial cell signaling involved in prostate gland development(GO:0060739) |
| 0.3 |
3.6 |
GO:0048251 |
elastic fiber assembly(GO:0048251) |
| 0.3 |
0.9 |
GO:1902774 |
late endosome to lysosome transport(GO:1902774) |
| 0.3 |
0.9 |
GO:0003365 |
establishment of cell polarity involved in ameboidal cell migration(GO:0003365) |
| 0.3 |
1.8 |
GO:1903385 |
regulation of homophilic cell adhesion(GO:1903385) |
| 0.3 |
7.2 |
GO:1903392 |
negative regulation of adherens junction organization(GO:1903392) |
| 0.3 |
1.5 |
GO:1903575 |
cornified envelope assembly(GO:1903575) |
| 0.3 |
2.4 |
GO:0010166 |
wax biosynthetic process(GO:0010025) wax metabolic process(GO:0010166) |
| 0.3 |
2.4 |
GO:0042428 |
serotonin metabolic process(GO:0042428) |
| 0.3 |
14.6 |
GO:0048791 |
calcium ion-regulated exocytosis of neurotransmitter(GO:0048791) |
| 0.3 |
2.1 |
GO:2000786 |
positive regulation of autophagosome assembly(GO:2000786) |
| 0.3 |
0.3 |
GO:0019376 |
galactolipid catabolic process(GO:0019376) |
| 0.3 |
1.2 |
GO:0044565 |
dendritic cell proliferation(GO:0044565) |
| 0.3 |
0.3 |
GO:1900227 |
positive regulation of NLRP3 inflammasome complex assembly(GO:1900227) |
| 0.3 |
0.3 |
GO:0003275 |
apoptotic process involved in outflow tract morphogenesis(GO:0003275) regulation of apoptotic process involved in outflow tract morphogenesis(GO:1902256) |
| 0.3 |
2.0 |
GO:0043615 |
astrocyte cell migration(GO:0043615) |
| 0.3 |
0.3 |
GO:0014004 |
microglia differentiation(GO:0014004) microglia development(GO:0014005) |
| 0.3 |
5.2 |
GO:0008090 |
retrograde axonal transport(GO:0008090) |
| 0.3 |
12.4 |
GO:0035235 |
ionotropic glutamate receptor signaling pathway(GO:0035235) |
| 0.3 |
0.3 |
GO:0060221 |
retinal rod cell differentiation(GO:0060221) |
| 0.3 |
0.6 |
GO:1901668 |
regulation of superoxide dismutase activity(GO:1901668) |
| 0.3 |
1.1 |
GO:0060743 |
epithelial cell maturation involved in prostate gland development(GO:0060743) |
| 0.3 |
0.9 |
GO:0042727 |
flavin-containing compound biosynthetic process(GO:0042727) |
| 0.3 |
1.4 |
GO:1903070 |
negative regulation of ER-associated ubiquitin-dependent protein catabolic process(GO:1903070) |
| 0.3 |
1.1 |
GO:0021882 |
regulation of transcription from RNA polymerase II promoter involved in forebrain neuron fate commitment(GO:0021882) cerebral cortex GABAergic interneuron fate commitment(GO:0021893) positive regulation of neural retina development(GO:0061075) positive regulation of retina development in camera-type eye(GO:1902868) positive regulation of amacrine cell differentiation(GO:1902871) |
| 0.3 |
1.1 |
GO:0034238 |
macrophage fusion(GO:0034238) regulation of macrophage fusion(GO:0034239) positive regulation of macrophage fusion(GO:0034241) |
| 0.3 |
6.8 |
GO:2001256 |
regulation of store-operated calcium entry(GO:2001256) |
| 0.3 |
0.3 |
GO:0051462 |
cortisol secretion(GO:0043400) regulation of cortisol secretion(GO:0051462) |
| 0.3 |
1.4 |
GO:0072675 |
osteoclast fusion(GO:0072675) |
| 0.3 |
2.8 |
GO:2000580 |
regulation of ATP-dependent microtubule motor activity, plus-end-directed(GO:2000580) positive regulation of ATP-dependent microtubule motor activity, plus-end-directed(GO:2000582) |
| 0.3 |
1.1 |
GO:0045362 |
regulation of interleukin-1 biosynthetic process(GO:0045360) positive regulation of interleukin-1 biosynthetic process(GO:0045362) |
| 0.3 |
0.6 |
GO:0098937 |
dendritic transport(GO:0098935) anterograde dendritic transport(GO:0098937) |
| 0.3 |
0.6 |
GO:0001575 |
globoside metabolic process(GO:0001575) |
| 0.3 |
1.1 |
GO:0032487 |
regulation of Rap protein signal transduction(GO:0032487) |
| 0.3 |
0.8 |
GO:0018194 |
N-terminal peptidyl-alanine methylation(GO:0018011) N-terminal peptidyl-alanine trimethylation(GO:0018012) N-terminal peptidyl-glycine methylation(GO:0018013) N-terminal peptidyl-proline dimethylation(GO:0018016) peptidyl-alanine modification(GO:0018194) N-terminal peptidyl-proline methylation(GO:0035568) N-terminal peptidyl-serine methylation(GO:0035570) N-terminal peptidyl-serine dimethylation(GO:0035572) N-terminal peptidyl-serine trimethylation(GO:0035573) |
| 0.3 |
0.8 |
GO:0061762 |
CAMKK-AMPK signaling cascade(GO:0061762) |
| 0.3 |
0.6 |
GO:2000576 |
positive regulation of microtubule motor activity(GO:2000576) |
| 0.3 |
14.7 |
GO:0042551 |
neuron maturation(GO:0042551) |
| 0.3 |
8.9 |
GO:0008038 |
neuron recognition(GO:0008038) |
| 0.3 |
0.6 |
GO:0097623 |
potassium ion export across plasma membrane(GO:0097623) |
| 0.3 |
15.4 |
GO:0046710 |
GDP metabolic process(GO:0046710) |
| 0.3 |
0.3 |
GO:1905247 |
positive regulation of aspartic-type endopeptidase activity involved in amyloid precursor protein catabolic process(GO:1902961) positive regulation of aspartic-type peptidase activity(GO:1905247) |
| 0.3 |
6.0 |
GO:0043562 |
cellular response to nitrogen starvation(GO:0006995) cellular response to nitrogen levels(GO:0043562) |
| 0.3 |
0.8 |
GO:0042732 |
D-xylose metabolic process(GO:0042732) |
| 0.3 |
0.8 |
GO:1905051 |
regulation of base-excision repair(GO:1905051) positive regulation of base-excision repair(GO:1905053) |
| 0.3 |
7.1 |
GO:0048168 |
regulation of neuronal synaptic plasticity(GO:0048168) |
| 0.3 |
1.1 |
GO:0038165 |
oncostatin-M-mediated signaling pathway(GO:0038165) |
| 0.3 |
0.8 |
GO:0007174 |
epidermal growth factor catabolic process(GO:0007174) |
| 0.3 |
1.1 |
GO:0021849 |
neuroblast division in subventricular zone(GO:0021849) |
| 0.3 |
3.0 |
GO:0010839 |
negative regulation of keratinocyte proliferation(GO:0010839) |
| 0.3 |
5.7 |
GO:0019371 |
cyclooxygenase pathway(GO:0019371) |
| 0.3 |
3.2 |
GO:2000253 |
positive regulation of feeding behavior(GO:2000253) |
| 0.3 |
3.0 |
GO:0070389 |
chaperone cofactor-dependent protein refolding(GO:0070389) |
| 0.3 |
1.1 |
GO:0050915 |
sensory perception of sour taste(GO:0050915) |
| 0.3 |
1.6 |
GO:0072385 |
minus-end-directed organelle transport along microtubule(GO:0072385) |
| 0.3 |
0.8 |
GO:0071464 |
cellular response to hydrostatic pressure(GO:0071464) |
| 0.3 |
3.5 |
GO:0070886 |
positive regulation of calcineurin-NFAT signaling cascade(GO:0070886) |
| 0.3 |
1.6 |
GO:0021781 |
glial cell fate commitment(GO:0021781) |
| 0.3 |
4.2 |
GO:0090168 |
Golgi reassembly(GO:0090168) |
| 0.3 |
9.0 |
GO:1901385 |
regulation of voltage-gated calcium channel activity(GO:1901385) |
| 0.3 |
1.3 |
GO:0009257 |
10-formyltetrahydrofolate biosynthetic process(GO:0009257) |
| 0.3 |
0.5 |
GO:0061740 |
protein targeting to lysosome involved in chaperone-mediated autophagy(GO:0061740) |
| 0.3 |
1.8 |
GO:0060385 |
axonogenesis involved in innervation(GO:0060385) |
| 0.3 |
0.5 |
GO:0090261 |
positive regulation of inclusion body assembly(GO:0090261) |
| 0.3 |
2.4 |
GO:0014807 |
regulation of somitogenesis(GO:0014807) |
| 0.3 |
0.3 |
GO:0007207 |
phospholipase C-activating G-protein coupled acetylcholine receptor signaling pathway(GO:0007207) |
| 0.3 |
2.3 |
GO:0070995 |
NADPH oxidation(GO:0070995) |
| 0.3 |
1.0 |
GO:2000298 |
regulation of Rho-dependent protein serine/threonine kinase activity(GO:2000298) |
| 0.3 |
0.3 |
GO:1904933 |
regulation of cell proliferation in midbrain(GO:1904933) |
| 0.3 |
1.0 |
GO:0044861 |
protein transport into plasma membrane raft(GO:0044861) |
| 0.3 |
10.5 |
GO:0090383 |
phagosome acidification(GO:0090383) |
| 0.3 |
0.8 |
GO:0001544 |
initiation of primordial ovarian follicle growth(GO:0001544) |
| 0.3 |
0.3 |
GO:0099612 |
protein localization to axon(GO:0099612) |
| 0.3 |
0.8 |
GO:0035508 |
positive regulation of myosin-light-chain-phosphatase activity(GO:0035508) |
| 0.3 |
0.8 |
GO:0070316 |
regulation of G0 to G1 transition(GO:0070316) positive regulation of G0 to G1 transition(GO:0070318) |
| 0.3 |
3.1 |
GO:0045176 |
apical protein localization(GO:0045176) |
| 0.3 |
1.0 |
GO:0061744 |
psychomotor behavior(GO:0036343) motor behavior(GO:0061744) |
| 0.3 |
1.3 |
GO:0002386 |
immune response in mucosal-associated lymphoid tissue(GO:0002386) |
| 0.3 |
18.3 |
GO:0051965 |
positive regulation of synapse assembly(GO:0051965) |
| 0.3 |
4.3 |
GO:0001955 |
blood vessel maturation(GO:0001955) |
| 0.3 |
0.5 |
GO:0015959 |
diadenosine polyphosphate metabolic process(GO:0015959) |
| 0.3 |
1.8 |
GO:0035609 |
C-terminal protein deglutamylation(GO:0035609) |
| 0.3 |
0.8 |
GO:1901097 |
negative regulation of autophagosome maturation(GO:1901097) |
| 0.3 |
2.5 |
GO:1904417 |
regulation of xenophagy(GO:1904415) positive regulation of xenophagy(GO:1904417) |
| 0.3 |
2.0 |
GO:0014059 |
dopamine secretion(GO:0014046) regulation of dopamine secretion(GO:0014059) |
| 0.3 |
0.5 |
GO:0042048 |
olfactory behavior(GO:0042048) |
| 0.3 |
0.5 |
GO:0035425 |
autocrine signaling(GO:0035425) |
| 0.3 |
5.5 |
GO:0006688 |
glycosphingolipid biosynthetic process(GO:0006688) |
| 0.2 |
3.0 |
GO:0032534 |
regulation of microvillus assembly(GO:0032534) |
| 0.2 |
0.7 |
GO:0019417 |
sulfur oxidation(GO:0019417) |
| 0.2 |
10.7 |
GO:0046676 |
negative regulation of insulin secretion(GO:0046676) |
| 0.2 |
0.2 |
GO:0030497 |
fatty acid elongation(GO:0030497) |
| 0.2 |
2.0 |
GO:0018231 |
peptidyl-L-cysteine S-palmitoylation(GO:0018230) peptidyl-S-diacylglycerol-L-cysteine biosynthetic process from peptidyl-cysteine(GO:0018231) |
| 0.2 |
0.7 |
GO:0006043 |
glucosamine catabolic process(GO:0006043) |
| 0.2 |
1.5 |
GO:0086016 |
AV node cell action potential(GO:0086016) AV node cell to bundle of His cell signaling(GO:0086027) |
| 0.2 |
0.7 |
GO:0046338 |
phosphatidylethanolamine catabolic process(GO:0046338) |
| 0.2 |
0.2 |
GO:1901094 |
regulation of protein tetramerization(GO:1901090) negative regulation of protein tetramerization(GO:1901091) regulation of protein homotetramerization(GO:1901093) negative regulation of protein homotetramerization(GO:1901094) |
| 0.2 |
0.7 |
GO:0098828 |
positive regulation of inhibitory postsynaptic potential(GO:0097151) modulation of inhibitory postsynaptic potential(GO:0098828) |
| 0.2 |
2.4 |
GO:1902365 |
regulation of spindle elongation(GO:0032887) regulation of mitotic spindle elongation(GO:0032888) anastral spindle assembly(GO:0055048) protein localization to spindle pole body(GO:0071988) regulation of protein localization to spindle pole body(GO:1902363) positive regulation of protein localization to spindle pole body(GO:1902365) positive regulation of mitotic spindle elongation(GO:1902846) |
| 0.2 |
0.2 |
GO:0000294 |
nuclear-transcribed mRNA catabolic process, endonucleolytic cleavage-dependent decay(GO:0000294) |
| 0.2 |
0.7 |
GO:0075044 |
autophagy of host cells involved in interaction with symbiont(GO:0075044) autophagy involved in symbiotic interaction(GO:0075071) |
| 0.2 |
1.5 |
GO:0045743 |
positive regulation of fibroblast growth factor receptor signaling pathway(GO:0045743) |
| 0.2 |
1.7 |
GO:0060134 |
prepulse inhibition(GO:0060134) |
| 0.2 |
0.7 |
GO:0021503 |
neural fold bending(GO:0021503) |
| 0.2 |
2.2 |
GO:0018103 |
protein C-linked glycosylation(GO:0018103) peptidyl-tryptophan modification(GO:0018211) protein C-linked glycosylation via tryptophan(GO:0018317) protein C-linked glycosylation via 2'-alpha-mannosyl-L-tryptophan(GO:0018406) |
| 0.2 |
2.4 |
GO:0051694 |
pointed-end actin filament capping(GO:0051694) |
| 0.2 |
0.2 |
GO:0044335 |
canonical Wnt signaling pathway involved in neural crest cell differentiation(GO:0044335) |
| 0.2 |
1.0 |
GO:0097252 |
oligodendrocyte apoptotic process(GO:0097252) |
| 0.2 |
1.4 |
GO:0072011 |
glomerular endothelium development(GO:0072011) |
| 0.2 |
0.7 |
GO:0085029 |
extracellular matrix assembly(GO:0085029) |
| 0.2 |
2.1 |
GO:1903830 |
magnesium ion transmembrane transport(GO:1903830) |
| 0.2 |
0.2 |
GO:2001184 |
positive regulation of interleukin-12 secretion(GO:2001184) |
| 0.2 |
2.6 |
GO:0042182 |
ketone catabolic process(GO:0042182) |
| 0.2 |
0.2 |
GO:0032661 |
regulation of interleukin-18 production(GO:0032661) |
| 0.2 |
0.7 |
GO:0015910 |
peroxisomal long-chain fatty acid import(GO:0015910) |
| 0.2 |
3.1 |
GO:0001542 |
ovulation from ovarian follicle(GO:0001542) |
| 0.2 |
0.2 |
GO:0060029 |
convergent extension involved in organogenesis(GO:0060029) |
| 0.2 |
1.2 |
GO:0060666 |
dichotomous subdivision of terminal units involved in salivary gland branching(GO:0060666) |
| 0.2 |
1.4 |
GO:0048861 |
leukemia inhibitory factor signaling pathway(GO:0048861) |
| 0.2 |
2.1 |
GO:0045188 |
circadian sleep/wake cycle, non-REM sleep(GO:0042748) regulation of circadian sleep/wake cycle, non-REM sleep(GO:0045188) |
| 0.2 |
4.7 |
GO:1904706 |
negative regulation of vascular smooth muscle cell proliferation(GO:1904706) |
| 0.2 |
0.7 |
GO:0030221 |
basophil differentiation(GO:0030221) |
| 0.2 |
0.9 |
GO:0046985 |
positive regulation of hemoglobin biosynthetic process(GO:0046985) |
| 0.2 |
0.5 |
GO:0032224 |
positive regulation of synaptic transmission, cholinergic(GO:0032224) |
| 0.2 |
2.5 |
GO:1903608 |
protein localization to cytoplasmic stress granule(GO:1903608) |
| 0.2 |
3.4 |
GO:1902259 |
regulation of delayed rectifier potassium channel activity(GO:1902259) |
| 0.2 |
1.1 |
GO:0042494 |
detection of bacterial lipoprotein(GO:0042494) |
| 0.2 |
2.3 |
GO:0051683 |
establishment of Golgi localization(GO:0051683) |
| 0.2 |
1.1 |
GO:2000574 |
regulation of microtubule motor activity(GO:2000574) |
| 0.2 |
1.6 |
GO:0098703 |
calcium ion import across plasma membrane(GO:0098703) calcium ion import into cell(GO:1990035) |
| 0.2 |
0.7 |
GO:0002906 |
mature B cell apoptotic process(GO:0002901) regulation of mature B cell apoptotic process(GO:0002905) negative regulation of mature B cell apoptotic process(GO:0002906) |
| 0.2 |
3.6 |
GO:1901898 |
negative regulation of relaxation of cardiac muscle(GO:1901898) |
| 0.2 |
1.1 |
GO:0035021 |
negative regulation of Rac protein signal transduction(GO:0035021) |
| 0.2 |
4.5 |
GO:0090084 |
negative regulation of inclusion body assembly(GO:0090084) |
| 0.2 |
0.9 |
GO:1902283 |
negative regulation of primary amine oxidase activity(GO:1902283) |
| 0.2 |
3.4 |
GO:1903861 |
positive regulation of dendrite extension(GO:1903861) |
| 0.2 |
0.7 |
GO:0036484 |
trunk segmentation(GO:0035290) trunk neural crest cell migration(GO:0036484) ventral trunk neural crest cell migration(GO:0036486) |
| 0.2 |
2.7 |
GO:1904885 |
beta-catenin destruction complex assembly(GO:1904885) |
| 0.2 |
8.3 |
GO:0031581 |
hemidesmosome assembly(GO:0031581) |
| 0.2 |
0.9 |
GO:0015691 |
cadmium ion transport(GO:0015691) cadmium ion transmembrane transport(GO:0070574) |
| 0.2 |
0.9 |
GO:0032972 |
regulation of muscle filament sliding speed(GO:0032972) |
| 0.2 |
0.2 |
GO:0051097 |
negative regulation of helicase activity(GO:0051097) |
| 0.2 |
1.3 |
GO:1902164 |
regulation of DNA damage response, signal transduction by p53 class mediator resulting in transcription of p21 class mediator(GO:1902162) positive regulation of DNA damage response, signal transduction by p53 class mediator resulting in transcription of p21 class mediator(GO:1902164) |
| 0.2 |
0.2 |
GO:0014827 |
intestine smooth muscle contraction(GO:0014827) |
| 0.2 |
1.6 |
GO:0032380 |
regulation of intracellular lipid transport(GO:0032377) regulation of intracellular sterol transport(GO:0032380) regulation of intracellular cholesterol transport(GO:0032383) |
| 0.2 |
9.5 |
GO:0060997 |
dendritic spine morphogenesis(GO:0060997) |
| 0.2 |
0.7 |
GO:0000494 |
box C/D snoRNA 3'-end processing(GO:0000494) box C/D snoRNA metabolic process(GO:0033967) box C/D snoRNA processing(GO:0034963) histone glutamine methylation(GO:1990258) |
| 0.2 |
0.2 |
GO:0010847 |
regulation of chromatin assembly(GO:0010847) |
| 0.2 |
2.6 |
GO:0014820 |
tonic smooth muscle contraction(GO:0014820) artery smooth muscle contraction(GO:0014824) |
| 0.2 |
1.1 |
GO:0033629 |
negative regulation of cell adhesion mediated by integrin(GO:0033629) |
| 0.2 |
3.3 |
GO:0019934 |
cGMP-mediated signaling(GO:0019934) |
| 0.2 |
0.2 |
GO:0051533 |
positive regulation of NFAT protein import into nucleus(GO:0051533) |
| 0.2 |
2.6 |
GO:0048671 |
negative regulation of collateral sprouting(GO:0048671) |
| 0.2 |
0.2 |
GO:0032213 |
regulation of telomere maintenance via semi-conservative replication(GO:0032213) negative regulation of telomere maintenance via semi-conservative replication(GO:0032214) |
| 0.2 |
8.2 |
GO:0016079 |
synaptic vesicle exocytosis(GO:0016079) |
| 0.2 |
0.4 |
GO:0002428 |
antigen processing and presentation of peptide antigen via MHC class Ib(GO:0002428) |
| 0.2 |
1.7 |
GO:0061709 |
reticulophagy(GO:0061709) |
| 0.2 |
0.9 |
GO:0019747 |
regulation of isoprenoid metabolic process(GO:0019747) |
| 0.2 |
1.7 |
GO:0060988 |
lipid tube assembly(GO:0060988) |
| 0.2 |
1.3 |
GO:0030949 |
positive regulation of vascular endothelial growth factor receptor signaling pathway(GO:0030949) |
| 0.2 |
1.1 |
GO:0051562 |
negative regulation of mitochondrial calcium ion concentration(GO:0051562) |
| 0.2 |
1.1 |
GO:0060087 |
relaxation of vascular smooth muscle(GO:0060087) |
| 0.2 |
10.1 |
GO:0099643 |
neurotransmitter secretion(GO:0007269) signal release from synapse(GO:0099643) |
| 0.2 |
0.6 |
GO:0051807 |
evasion or tolerance of host immune response(GO:0020012) evasion or tolerance of host defense response(GO:0030682) evasion or tolerance by virus of host immune response(GO:0030683) evasion or tolerance of immune response of other organism involved in symbiotic interaction(GO:0051805) evasion or tolerance of defense response of other organism involved in symbiotic interaction(GO:0051807) |
| 0.2 |
6.2 |
GO:0006884 |
cell volume homeostasis(GO:0006884) |
| 0.2 |
2.8 |
GO:1903054 |
negative regulation of extracellular matrix organization(GO:1903054) |
| 0.2 |
9.6 |
GO:0032012 |
regulation of ARF protein signal transduction(GO:0032012) |
| 0.2 |
1.3 |
GO:0045602 |
negative regulation of endothelial cell differentiation(GO:0045602) |
| 0.2 |
1.1 |
GO:0032417 |
positive regulation of sodium:proton antiporter activity(GO:0032417) |
| 0.2 |
4.9 |
GO:1902083 |
negative regulation of peptidyl-cysteine S-nitrosylation(GO:1902083) |
| 0.2 |
0.8 |
GO:0016119 |
carotene metabolic process(GO:0016119) terpene metabolic process(GO:0042214) |
| 0.2 |
5.1 |
GO:0046716 |
muscle cell cellular homeostasis(GO:0046716) |
| 0.2 |
13.4 |
GO:0019933 |
cAMP-mediated signaling(GO:0019933) |
| 0.2 |
0.6 |
GO:0051714 |
positive regulation of cytolysis in other organism(GO:0051714) |
| 0.2 |
1.5 |
GO:0097167 |
circadian regulation of translation(GO:0097167) |
| 0.2 |
1.2 |
GO:1901525 |
negative regulation of macromitophagy(GO:1901525) |
| 0.2 |
3.1 |
GO:0038007 |
netrin-activated signaling pathway(GO:0038007) |
| 0.2 |
3.3 |
GO:2000811 |
negative regulation of anoikis(GO:2000811) |
| 0.2 |
1.2 |
GO:1904580 |
regulation of intracellular mRNA localization(GO:1904580) positive regulation of intracellular mRNA localization(GO:1904582) |
| 0.2 |
17.9 |
GO:0000381 |
regulation of alternative mRNA splicing, via spliceosome(GO:0000381) |
| 0.2 |
0.4 |
GO:0019075 |
virus maturation(GO:0019075) |
| 0.2 |
0.8 |
GO:0002525 |
acute inflammatory response to non-antigenic stimulus(GO:0002525) regulation of acute inflammatory response to non-antigenic stimulus(GO:0002877) |
| 0.2 |
1.4 |
GO:0021816 |
extension of a leading process involved in cell motility in cerebral cortex radial glia guided migration(GO:0021816) |
| 0.2 |
1.2 |
GO:0015853 |
adenine transport(GO:0015853) |
| 0.2 |
1.0 |
GO:2001245 |
regulation of phosphatidylcholine biosynthetic process(GO:2001245) |
| 0.2 |
1.6 |
GO:2000490 |
negative regulation of hepatic stellate cell activation(GO:2000490) |
| 0.2 |
3.3 |
GO:0090026 |
positive regulation of monocyte chemotaxis(GO:0090026) |
| 0.2 |
2.2 |
GO:0047484 |
regulation of response to osmotic stress(GO:0047484) |
| 0.2 |
1.0 |
GO:0014886 |
transition between slow and fast fiber(GO:0014886) |
| 0.2 |
1.4 |
GO:0021859 |
pyramidal neuron differentiation(GO:0021859) |
| 0.2 |
1.4 |
GO:2000561 |
CD4-positive, alpha-beta T cell proliferation(GO:0035739) regulation of CD4-positive, alpha-beta T cell proliferation(GO:2000561) |
| 0.2 |
1.6 |
GO:0019236 |
response to pheromone(GO:0019236) |
| 0.2 |
4.2 |
GO:0035414 |
negative regulation of catenin import into nucleus(GO:0035414) |
| 0.2 |
0.6 |
GO:0061570 |
dADP phosphorylation(GO:0006174) dGDP phosphorylation(GO:0006186) AMP phosphorylation(GO:0006756) dGDP metabolic process(GO:0046066) CDP phosphorylation(GO:0061508) dAMP phosphorylation(GO:0061565) CMP phosphorylation(GO:0061566) dCMP phosphorylation(GO:0061567) GDP phosphorylation(GO:0061568) UDP phosphorylation(GO:0061569) dCDP phosphorylation(GO:0061570) TDP phosphorylation(GO:0061571) |
| 0.2 |
0.6 |
GO:0051106 |
regulation of DNA ligation(GO:0051105) positive regulation of DNA ligation(GO:0051106) |
| 0.2 |
5.8 |
GO:0007019 |
microtubule depolymerization(GO:0007019) |
| 0.2 |
1.8 |
GO:0042045 |
epithelial fluid transport(GO:0042045) |
| 0.2 |
0.4 |
GO:0010877 |
lipid transport involved in lipid storage(GO:0010877) |
| 0.2 |
0.2 |
GO:0010636 |
positive regulation of mitochondrial fusion(GO:0010636) |
| 0.2 |
0.8 |
GO:0048105 |
establishment of body hair or bristle planar orientation(GO:0048104) establishment of body hair planar orientation(GO:0048105) |
| 0.2 |
1.0 |
GO:1903613 |
regulation of protein tyrosine phosphatase activity(GO:1903613) positive regulation of protein tyrosine phosphatase activity(GO:1903615) |
| 0.2 |
2.6 |
GO:0090051 |
negative regulation of cell migration involved in sprouting angiogenesis(GO:0090051) |
| 0.2 |
0.6 |
GO:1904875 |
regulation of DNA ligase activity(GO:1904875) |
| 0.2 |
0.4 |
GO:0048669 |
collateral sprouting in absence of injury(GO:0048669) |
| 0.2 |
8.5 |
GO:0008089 |
anterograde axonal transport(GO:0008089) |
| 0.2 |
0.6 |
GO:0055075 |
potassium ion homeostasis(GO:0055075) |
| 0.2 |
1.0 |
GO:0034334 |
adherens junction maintenance(GO:0034334) |
| 0.2 |
3.3 |
GO:0033689 |
negative regulation of osteoblast proliferation(GO:0033689) |
| 0.2 |
0.4 |
GO:0046512 |
diol biosynthetic process(GO:0034312) sphingosine biosynthetic process(GO:0046512) |
| 0.2 |
0.6 |
GO:2000170 |
negative regulation of gap junction assembly(GO:1903597) positive regulation of peptidyl-cysteine S-nitrosylation(GO:2000170) |
| 0.2 |
0.6 |
GO:0002818 |
intracellular defense response(GO:0002818) |
| 0.2 |
7.4 |
GO:2000649 |
regulation of sodium ion transmembrane transporter activity(GO:2000649) |
| 0.2 |
1.2 |
GO:2000535 |
regulation of entry of bacterium into host cell(GO:2000535) |
| 0.2 |
2.9 |
GO:1900118 |
negative regulation of execution phase of apoptosis(GO:1900118) |
| 0.2 |
2.1 |
GO:0035493 |
SNARE complex assembly(GO:0035493) |
| 0.2 |
0.6 |
GO:0000103 |
sulfate assimilation(GO:0000103) |
| 0.2 |
1.0 |
GO:0034144 |
negative regulation of toll-like receptor 4 signaling pathway(GO:0034144) |
| 0.2 |
0.2 |
GO:0002317 |
plasma cell differentiation(GO:0002317) |
| 0.2 |
0.6 |
GO:1902075 |
cellular response to salt(GO:1902075) |
| 0.2 |
1.7 |
GO:0046726 |
positive regulation by virus of viral protein levels in host cell(GO:0046726) |
| 0.2 |
0.2 |
GO:0006529 |
asparagine biosynthetic process(GO:0006529) |
| 0.2 |
0.8 |
GO:0002215 |
defense response to nematode(GO:0002215) |
| 0.2 |
12.9 |
GO:1901379 |
regulation of potassium ion transmembrane transport(GO:1901379) |
| 0.2 |
3.8 |
GO:0032785 |
negative regulation of DNA-templated transcription, elongation(GO:0032785) |
| 0.2 |
0.6 |
GO:1904235 |
regulation of substrate-dependent cell migration, cell attachment to substrate(GO:1904235) positive regulation of substrate-dependent cell migration, cell attachment to substrate(GO:1904237) |
| 0.2 |
0.2 |
GO:0045347 |
negative regulation of MHC class II biosynthetic process(GO:0045347) |
| 0.2 |
3.8 |
GO:0042417 |
dopamine metabolic process(GO:0042417) |
| 0.2 |
0.7 |
GO:0048073 |
regulation of eye pigmentation(GO:0048073) |
| 0.2 |
0.6 |
GO:1904732 |
regulation of electron carrier activity(GO:1904732) |
| 0.2 |
1.1 |
GO:0006565 |
L-serine catabolic process(GO:0006565) |
| 0.2 |
19.1 |
GO:0048813 |
dendrite morphogenesis(GO:0048813) |
| 0.2 |
1.1 |
GO:0050653 |
chondroitin sulfate proteoglycan biosynthetic process, polysaccharide chain biosynthetic process(GO:0050653) |
| 0.2 |
0.2 |
GO:0051461 |
positive regulation of corticotropin secretion(GO:0051461) |
| 0.2 |
1.5 |
GO:0035973 |
aggrephagy(GO:0035973) |
| 0.2 |
1.6 |
GO:0045040 |
protein import into mitochondrial outer membrane(GO:0045040) |
| 0.2 |
5.5 |
GO:0034063 |
stress granule assembly(GO:0034063) |
| 0.2 |
0.7 |
GO:0015811 |
L-cystine transport(GO:0015811) |
| 0.2 |
2.6 |
GO:0000338 |
protein deneddylation(GO:0000338) |
| 0.2 |
0.7 |
GO:0071072 |
negative regulation of phospholipid biosynthetic process(GO:0071072) |
| 0.2 |
1.3 |
GO:0032468 |
Golgi calcium ion homeostasis(GO:0032468) |
| 0.2 |
1.1 |
GO:0030953 |
astral microtubule organization(GO:0030953) |
| 0.2 |
4.0 |
GO:0014003 |
oligodendrocyte development(GO:0014003) |
| 0.2 |
0.9 |
GO:0001696 |
gastric acid secretion(GO:0001696) |
| 0.2 |
0.2 |
GO:0036465 |
synaptic vesicle recycling(GO:0036465) |
| 0.2 |
1.6 |
GO:0035507 |
regulation of myosin-light-chain-phosphatase activity(GO:0035507) |
| 0.2 |
0.7 |
GO:0036071 |
N-glycan fucosylation(GO:0036071) |
| 0.2 |
1.1 |
GO:0044557 |
relaxation of smooth muscle(GO:0044557) |
| 0.2 |
0.5 |
GO:0045175 |
basal protein localization(GO:0045175) |
| 0.2 |
0.9 |
GO:0007193 |
adenylate cyclase-inhibiting G-protein coupled receptor signaling pathway(GO:0007193) |
| 0.2 |
0.9 |
GO:0051892 |
negative regulation of cardioblast differentiation(GO:0051892) regulation of cardiac muscle cell myoblast differentiation(GO:2000690) negative regulation of cardiac muscle cell myoblast differentiation(GO:2000691) |
| 0.2 |
2.1 |
GO:0070050 |
neuron cellular homeostasis(GO:0070050) |
| 0.2 |
0.9 |
GO:0060399 |
positive regulation of growth hormone receptor signaling pathway(GO:0060399) |
| 0.2 |
1.4 |
GO:0007296 |
vitellogenesis(GO:0007296) |
| 0.2 |
0.5 |
GO:2000503 |
positive regulation of natural killer cell chemotaxis(GO:2000503) |
| 0.2 |
3.0 |
GO:0003322 |
pancreatic A cell development(GO:0003322) |
| 0.2 |
1.1 |
GO:0019509 |
L-methionine biosynthetic process from methylthioadenosine(GO:0019509) |
| 0.2 |
0.2 |
GO:0018343 |
protein farnesylation(GO:0018343) |
| 0.2 |
0.2 |
GO:0051595 |
response to methylglyoxal(GO:0051595) |
| 0.2 |
1.4 |
GO:0061299 |
retina vasculature morphogenesis in camera-type eye(GO:0061299) |
| 0.2 |
1.2 |
GO:0043126 |
regulation of 1-phosphatidylinositol 4-kinase activity(GO:0043126) positive regulation of 1-phosphatidylinositol 4-kinase activity(GO:0043128) |
| 0.2 |
0.2 |
GO:1903860 |
negative regulation of dendrite extension(GO:1903860) |
| 0.2 |
2.6 |
GO:1904776 |
regulation of protein localization to cell cortex(GO:1904776) positive regulation of protein localization to cell cortex(GO:1904778) |
| 0.2 |
5.5 |
GO:0021819 |
layer formation in cerebral cortex(GO:0021819) |
| 0.2 |
1.2 |
GO:0015888 |
thiamine transport(GO:0015888) |
| 0.2 |
1.0 |
GO:0090038 |
negative regulation of protein kinase C signaling(GO:0090038) |
| 0.2 |
1.2 |
GO:0072719 |
cellular response to cisplatin(GO:0072719) |
| 0.2 |
1.7 |
GO:0060219 |
camera-type eye photoreceptor cell differentiation(GO:0060219) |
| 0.2 |
2.0 |
GO:0048227 |
plasma membrane to endosome transport(GO:0048227) |
| 0.2 |
0.3 |
GO:0097360 |
chorionic trophoblast cell proliferation(GO:0097360) regulation of chorionic trophoblast cell proliferation(GO:1901382) |
| 0.2 |
0.5 |
GO:0010459 |
negative regulation of heart rate(GO:0010459) |
| 0.2 |
1.0 |
GO:0033353 |
S-adenosylmethionine cycle(GO:0033353) |
| 0.2 |
1.0 |
GO:1902045 |
negative regulation of Fas signaling pathway(GO:1902045) |
| 0.2 |
0.7 |
GO:0034316 |
negative regulation of Arp2/3 complex-mediated actin nucleation(GO:0034316) |
| 0.2 |
0.5 |
GO:2000171 |
negative regulation of dendrite development(GO:2000171) |
| 0.2 |
0.8 |
GO:0035617 |
stress granule disassembly(GO:0035617) |
| 0.2 |
0.5 |
GO:0050882 |
voluntary musculoskeletal movement(GO:0050882) |
| 0.2 |
8.8 |
GO:0045773 |
positive regulation of axon extension(GO:0045773) |
| 0.2 |
6.8 |
GO:0045762 |
positive regulation of adenylate cyclase activity(GO:0045762) |
| 0.2 |
0.2 |
GO:2001015 |
negative regulation of skeletal muscle cell differentiation(GO:2001015) |
| 0.2 |
1.5 |
GO:0090385 |
phagosome-lysosome fusion(GO:0090385) |
| 0.2 |
1.6 |
GO:0061635 |
regulation of protein complex stability(GO:0061635) |
| 0.2 |
0.5 |
GO:0048023 |
positive regulation of melanin biosynthetic process(GO:0048023) positive regulation of secondary metabolite biosynthetic process(GO:1900378) |
| 0.2 |
2.0 |
GO:0006089 |
lactate metabolic process(GO:0006089) |
| 0.2 |
0.7 |
GO:0035900 |
response to isolation stress(GO:0035900) |
| 0.2 |
0.7 |
GO:1902269 |
positive regulation of polyamine transmembrane transport(GO:1902269) |
| 0.2 |
1.6 |
GO:0009134 |
nucleoside diphosphate catabolic process(GO:0009134) |
| 0.2 |
1.1 |
GO:0007016 |
cytoskeletal anchoring at plasma membrane(GO:0007016) |
| 0.2 |
0.6 |
GO:0072383 |
plus-end-directed vesicle transport along microtubule(GO:0072383) plus-end-directed organelle transport along microtubule(GO:0072386) |
| 0.2 |
0.5 |
GO:0003050 |
regulation of systemic arterial blood pressure by atrial natriuretic peptide(GO:0003050) |
| 0.2 |
2.2 |
GO:0019368 |
fatty acid elongation, saturated fatty acid(GO:0019367) fatty acid elongation, unsaturated fatty acid(GO:0019368) fatty acid elongation, monounsaturated fatty acid(GO:0034625) fatty acid elongation, polyunsaturated fatty acid(GO:0034626) |
| 0.2 |
0.5 |
GO:0098974 |
postsynaptic actin cytoskeleton organization(GO:0098974) |
| 0.2 |
2.1 |
GO:0070884 |
regulation of calcineurin-NFAT signaling cascade(GO:0070884) |
| 0.2 |
0.3 |
GO:0071393 |
cellular response to progesterone stimulus(GO:0071393) |
| 0.2 |
1.4 |
GO:0070970 |
interleukin-2 secretion(GO:0070970) |
| 0.2 |
0.5 |
GO:0071351 |
interleukin-18-mediated signaling pathway(GO:0035655) cellular response to interleukin-18(GO:0071351) |
| 0.2 |
1.9 |
GO:2001300 |
lipoxin metabolic process(GO:2001300) |
| 0.2 |
0.6 |
GO:0021785 |
branchiomotor neuron axon guidance(GO:0021785) |
| 0.2 |
0.2 |
GO:0070676 |
intralumenal vesicle formation(GO:0070676) |
| 0.2 |
0.6 |
GO:2000111 |
positive regulation of macrophage apoptotic process(GO:2000111) |
| 0.2 |
2.8 |
GO:0071985 |
multivesicular body sorting pathway(GO:0071985) |
| 0.2 |
0.6 |
GO:2000196 |
positive regulation of female gonad development(GO:2000196) |
| 0.2 |
1.1 |
GO:2000785 |
regulation of autophagosome assembly(GO:2000785) |
| 0.2 |
0.8 |
GO:0071798 |
response to prostaglandin D(GO:0071798) cellular response to prostaglandin D stimulus(GO:0071799) |
| 0.2 |
0.6 |
GO:0060159 |
regulation of dopamine receptor signaling pathway(GO:0060159) |
| 0.2 |
1.9 |
GO:0006002 |
fructose 6-phosphate metabolic process(GO:0006002) |
| 0.2 |
0.6 |
GO:0045925 |
positive regulation of female receptivity(GO:0045925) |
| 0.2 |
3.1 |
GO:0001953 |
negative regulation of cell-matrix adhesion(GO:0001953) |
| 0.2 |
1.4 |
GO:0051725 |
protein de-ADP-ribosylation(GO:0051725) |
| 0.2 |
2.0 |
GO:0042759 |
long-chain fatty acid biosynthetic process(GO:0042759) |
| 0.2 |
0.8 |
GO:1904491 |
protein localization to ciliary transition zone(GO:1904491) |
| 0.2 |
0.8 |
GO:2001013 |
epithelial cell proliferation involved in renal tubule morphogenesis(GO:2001013) |
| 0.2 |
0.9 |
GO:0043435 |
response to corticotropin-releasing hormone(GO:0043435) cellular response to corticotropin-releasing hormone stimulus(GO:0071376) |
| 0.2 |
0.3 |
GO:0010666 |
positive regulation of striated muscle cell apoptotic process(GO:0010663) positive regulation of cardiac muscle cell apoptotic process(GO:0010666) |
| 0.2 |
2.3 |
GO:0006655 |
phosphatidylglycerol biosynthetic process(GO:0006655) |
| 0.2 |
0.5 |
GO:0036216 |
response to stem cell factor(GO:0036215) cellular response to stem cell factor stimulus(GO:0036216) Kit signaling pathway(GO:0038109) |
| 0.2 |
7.0 |
GO:0007602 |
phototransduction(GO:0007602) |
| 0.2 |
0.5 |
GO:0006481 |
C-terminal protein methylation(GO:0006481) |
| 0.2 |
4.2 |
GO:0035728 |
response to hepatocyte growth factor(GO:0035728) |
| 0.1 |
0.4 |
GO:1990928 |
response to amino acid starvation(GO:1990928) |
| 0.1 |
2.8 |
GO:0031290 |
retinal ganglion cell axon guidance(GO:0031290) |
| 0.1 |
0.1 |
GO:0033564 |
anterior/posterior axon guidance(GO:0033564) |
| 0.1 |
1.2 |
GO:0071763 |
nuclear membrane organization(GO:0071763) |
| 0.1 |
0.6 |
GO:0090299 |
fibroblast growth factor receptor signaling pathway involved in neural plate anterior/posterior pattern formation(GO:0060825) regulation of neural crest formation(GO:0090299) negative regulation of neural crest formation(GO:0090301) regulation of fibroblast growth factor receptor signaling pathway involved in neural plate anterior/posterior pattern formation(GO:2000313) negative regulation of fibroblast growth factor receptor signaling pathway involved in neural plate anterior/posterior pattern formation(GO:2000314) |
| 0.1 |
3.4 |
GO:0007175 |
negative regulation of epidermal growth factor-activated receptor activity(GO:0007175) |
| 0.1 |
0.9 |
GO:0043117 |
positive regulation of vascular permeability(GO:0043117) |
| 0.1 |
1.9 |
GO:0030091 |
protein repair(GO:0030091) |
| 0.1 |
0.4 |
GO:1902173 |
negative regulation of keratinocyte apoptotic process(GO:1902173) |
| 0.1 |
0.3 |
GO:0098779 |
mitophagy in response to mitochondrial depolarization(GO:0098779) |
| 0.1 |
0.7 |
GO:0032960 |
regulation of inositol trisphosphate biosynthetic process(GO:0032960) positive regulation of inositol trisphosphate biosynthetic process(GO:0032962) |
| 0.1 |
1.3 |
GO:0030050 |
vesicle transport along actin filament(GO:0030050) |
| 0.1 |
0.4 |
GO:0043328 |
protein targeting to vacuole involved in ubiquitin-dependent protein catabolic process via the multivesicular body sorting pathway(GO:0043328) |
| 0.1 |
0.3 |
GO:0001964 |
startle response(GO:0001964) |
| 0.1 |
0.9 |
GO:0032463 |
negative regulation of protein homooligomerization(GO:0032463) |
| 0.1 |
0.6 |
GO:0045409 |
negative regulation of interleukin-6 biosynthetic process(GO:0045409) |
| 0.1 |
0.3 |
GO:2001226 |
negative regulation of chloride transport(GO:2001226) |
| 0.1 |
0.1 |
GO:0060748 |
tertiary branching involved in mammary gland duct morphogenesis(GO:0060748) renal vesicle induction(GO:0072034) |
| 0.1 |
2.0 |
GO:0006122 |
mitochondrial electron transport, ubiquinol to cytochrome c(GO:0006122) |
| 0.1 |
0.7 |
GO:0055014 |
atrial cardiac muscle cell differentiation(GO:0055011) atrial cardiac muscle cell development(GO:0055014) |
| 0.1 |
1.7 |
GO:0042754 |
negative regulation of circadian rhythm(GO:0042754) |
| 0.1 |
1.9 |
GO:0045329 |
carnitine biosynthetic process(GO:0045329) |
| 0.1 |
0.3 |
GO:0060158 |
phospholipase C-activating dopamine receptor signaling pathway(GO:0060158) |
| 0.1 |
0.3 |
GO:0022614 |
membrane to membrane docking(GO:0022614) |
| 0.1 |
0.9 |
GO:0014742 |
positive regulation of cardiac muscle hypertrophy(GO:0010613) positive regulation of muscle hypertrophy(GO:0014742) |
| 0.1 |
0.1 |
GO:0016479 |
negative regulation of transcription from RNA polymerase I promoter(GO:0016479) |
| 0.1 |
0.1 |
GO:0046886 |
positive regulation of hormone biosynthetic process(GO:0046886) |
| 0.1 |
1.4 |
GO:0036010 |
protein localization to endosome(GO:0036010) |
| 0.1 |
0.4 |
GO:0060746 |
maternal behavior(GO:0042711) parental behavior(GO:0060746) |
| 0.1 |
0.4 |
GO:0019614 |
catechol-containing compound catabolic process(GO:0019614) catecholamine catabolic process(GO:0042424) |
| 0.1 |
0.6 |
GO:1903751 |
intrinsic apoptotic signaling pathway in response to hydrogen peroxide(GO:0036481) regulation of intrinsic apoptotic signaling pathway in response to hydrogen peroxide(GO:1903750) negative regulation of intrinsic apoptotic signaling pathway in response to hydrogen peroxide(GO:1903751) |
| 0.1 |
0.3 |
GO:0018312 |
peptidyl-serine ADP-ribosylation(GO:0018312) |
| 0.1 |
0.1 |
GO:0007386 |
compartment pattern specification(GO:0007386) |
| 0.1 |
1.3 |
GO:0046325 |
negative regulation of glucose import(GO:0046325) |
| 0.1 |
1.0 |
GO:0043116 |
negative regulation of vascular permeability(GO:0043116) |
| 0.1 |
0.3 |
GO:0061300 |
cerebellum vasculature development(GO:0061300) |
| 0.1 |
0.8 |
GO:0048254 |
snoRNA localization(GO:0048254) |
| 0.1 |
0.7 |
GO:1903566 |
positive regulation of protein localization to cilium(GO:1903566) |
| 0.1 |
0.7 |
GO:0016480 |
negative regulation of transcription from RNA polymerase III promoter(GO:0016480) |
| 0.1 |
6.3 |
GO:0071377 |
cellular response to glucagon stimulus(GO:0071377) |
| 0.1 |
1.8 |
GO:0035249 |
synaptic transmission, glutamatergic(GO:0035249) |
| 0.1 |
0.3 |
GO:0006533 |
aspartate catabolic process(GO:0006533) |
| 0.1 |
2.3 |
GO:0031065 |
positive regulation of histone deacetylation(GO:0031065) |
| 0.1 |
0.3 |
GO:0070682 |
proteasome regulatory particle assembly(GO:0070682) |
| 0.1 |
0.1 |
GO:0043553 |
negative regulation of phosphatidylinositol 3-kinase activity(GO:0043553) |
| 0.1 |
0.9 |
GO:0060536 |
cartilage morphogenesis(GO:0060536) |
| 0.1 |
1.9 |
GO:0048266 |
behavioral response to pain(GO:0048266) |
| 0.1 |
4.0 |
GO:0042982 |
amyloid precursor protein metabolic process(GO:0042982) |
| 0.1 |
0.1 |
GO:0042700 |
luteinizing hormone signaling pathway(GO:0042700) |
| 0.1 |
0.1 |
GO:2000053 |
regulation of Wnt signaling pathway involved in dorsal/ventral axis specification(GO:2000053) |
| 0.1 |
2.5 |
GO:0003334 |
keratinocyte development(GO:0003334) |
| 0.1 |
0.5 |
GO:1903722 |
regulation of centriole elongation(GO:1903722) |
| 0.1 |
1.0 |
GO:0072502 |
cellular phosphate ion homeostasis(GO:0030643) cellular trivalent inorganic anion homeostasis(GO:0072502) |
| 0.1 |
0.8 |
GO:0017014 |
protein nitrosylation(GO:0017014) peptidyl-cysteine S-nitrosylation(GO:0018119) |
| 0.1 |
0.5 |
GO:0008628 |
hormone-mediated apoptotic signaling pathway(GO:0008628) |
| 0.1 |
0.3 |
GO:1903721 |
regulation of I-kappaB phosphorylation(GO:1903719) positive regulation of I-kappaB phosphorylation(GO:1903721) |
| 0.1 |
1.2 |
GO:1904263 |
positive regulation of TORC1 signaling(GO:1904263) |
| 0.1 |
0.4 |
GO:0010520 |
regulation of reciprocal meiotic recombination(GO:0010520) |
| 0.1 |
0.9 |
GO:0015015 |
heparan sulfate proteoglycan biosynthetic process, enzymatic modification(GO:0015015) |
| 0.1 |
0.1 |
GO:0050966 |
detection of mechanical stimulus involved in sensory perception of pain(GO:0050966) |
| 0.1 |
0.5 |
GO:1903565 |
negative regulation of protein localization to cilium(GO:1903565) regulation of protein localization to ciliary membrane(GO:1903567) negative regulation of protein localization to ciliary membrane(GO:1903568) |
| 0.1 |
1.2 |
GO:0043129 |
surfactant homeostasis(GO:0043129) |
| 0.1 |
0.3 |
GO:0099518 |
vesicle cytoskeletal trafficking(GO:0099518) |
| 0.1 |
0.9 |
GO:0072656 |
maintenance of protein location in mitochondrion(GO:0072656) |
| 0.1 |
0.4 |
GO:0060600 |
dichotomous subdivision of an epithelial terminal unit(GO:0060600) |
| 0.1 |
0.1 |
GO:0001834 |
trophectodermal cell proliferation(GO:0001834) |
| 0.1 |
1.1 |
GO:0071372 |
cellular response to follicle-stimulating hormone stimulus(GO:0071372) |
| 0.1 |
1.0 |
GO:0048308 |
organelle inheritance(GO:0048308) |
| 0.1 |
1.3 |
GO:0002087 |
regulation of respiratory gaseous exchange by neurological system process(GO:0002087) |
| 0.1 |
0.9 |
GO:0034959 |
regulation of systemic arterial blood pressure by endothelin(GO:0003100) neuropeptide catabolic process(GO:0010813) substance P catabolic process(GO:0010814) calcitonin catabolic process(GO:0010816) endothelin maturation(GO:0034959) |
| 0.1 |
0.6 |
GO:0022410 |
circadian sleep/wake cycle process(GO:0022410) circadian sleep/wake cycle(GO:0042745) circadian sleep/wake cycle, sleep(GO:0050802) |
| 0.1 |
0.6 |
GO:2000671 |
regulation of motor neuron apoptotic process(GO:2000671) |
| 0.1 |
2.5 |
GO:0002028 |
regulation of sodium ion transport(GO:0002028) |
| 0.1 |
0.2 |
GO:1902896 |
terminal web assembly(GO:1902896) |
| 0.1 |
3.2 |
GO:0007212 |
dopamine receptor signaling pathway(GO:0007212) |
| 0.1 |
1.2 |
GO:0006108 |
malate metabolic process(GO:0006108) |
| 0.1 |
0.1 |
GO:0060664 |
epithelial cell proliferation involved in salivary gland morphogenesis(GO:0060664) |
| 0.1 |
2.0 |
GO:1900271 |
regulation of long-term synaptic potentiation(GO:1900271) |
| 0.1 |
0.7 |
GO:0046826 |
negative regulation of protein export from nucleus(GO:0046826) |
| 0.1 |
1.0 |
GO:0071947 |
protein deubiquitination involved in ubiquitin-dependent protein catabolic process(GO:0071947) |
| 0.1 |
0.5 |
GO:0010936 |
negative regulation of macrophage cytokine production(GO:0010936) |
| 0.1 |
1.2 |
GO:0071786 |
endoplasmic reticulum tubular network organization(GO:0071786) |
| 0.1 |
1.0 |
GO:0036337 |
Fas signaling pathway(GO:0036337) |
| 0.1 |
4.1 |
GO:0072583 |
clathrin-mediated endocytosis(GO:0072583) |
| 0.1 |
0.4 |
GO:0097210 |
response to gonadotropin-releasing hormone(GO:0097210) cellular response to gonadotropin-releasing hormone(GO:0097211) |
| 0.1 |
0.1 |
GO:0097198 |
histone H3-K36 trimethylation(GO:0097198) |
| 0.1 |
0.4 |
GO:1990519 |
pyrimidine nucleotide transport(GO:0006864) mitochondrial pyrimidine nucleotide import(GO:1990519) |
| 0.1 |
0.6 |
GO:2000364 |
cardiac muscle tissue regeneration(GO:0061026) regulation of STAT protein import into nucleus(GO:2000364) positive regulation of STAT protein import into nucleus(GO:2000366) |
| 0.1 |
2.9 |
GO:0008542 |
visual learning(GO:0008542) |
| 0.1 |
0.5 |
GO:0018101 |
protein citrullination(GO:0018101) histone citrullination(GO:0036414) |
| 0.1 |
1.2 |
GO:0098926 |
acetylcholine receptor signaling pathway(GO:0095500) postsynaptic signal transduction(GO:0098926) signal transduction involved in cellular response to ammonium ion(GO:1903831) response to acetylcholine(GO:1905144) cellular response to acetylcholine(GO:1905145) |
| 0.1 |
2.5 |
GO:0010971 |
positive regulation of G2/M transition of mitotic cell cycle(GO:0010971) |
| 0.1 |
0.6 |
GO:0036363 |
transforming growth factor beta activation(GO:0036363) |
| 0.1 |
0.6 |
GO:0061051 |
positive regulation of cell growth involved in cardiac muscle cell development(GO:0061051) |
| 0.1 |
1.2 |
GO:0046007 |
negative regulation of activated T cell proliferation(GO:0046007) |
| 0.1 |
0.4 |
GO:0035638 |
patched ligand maturation(GO:0007225) signal maturation(GO:0035638) |
| 0.1 |
1.4 |
GO:0008612 |
peptidyl-lysine modification to peptidyl-hypusine(GO:0008612) |
| 0.1 |
0.2 |
GO:0006670 |
sphingosine metabolic process(GO:0006670) diol metabolic process(GO:0034311) |
| 0.1 |
0.4 |
GO:0009085 |
lysine biosynthetic process(GO:0009085) lysine biosynthetic process via aminoadipic acid(GO:0019878) |
| 0.1 |
0.2 |
GO:0007161 |
calcium-independent cell-matrix adhesion(GO:0007161) |
| 0.1 |
0.4 |
GO:0006597 |
spermine biosynthetic process(GO:0006597) |
| 0.1 |
0.1 |
GO:0060526 |
prostate glandular acinus morphogenesis(GO:0060526) prostate epithelial cord arborization involved in prostate glandular acinus morphogenesis(GO:0060527) |
| 0.1 |
0.2 |
GO:0071284 |
cellular response to lead ion(GO:0071284) |
| 0.1 |
0.3 |
GO:0070898 |
RNA polymerase III transcriptional preinitiation complex assembly(GO:0070898) |
| 0.1 |
0.1 |
GO:0070889 |
platelet alpha granule organization(GO:0070889) |
| 0.1 |
0.1 |
GO:0060392 |
negative regulation of SMAD protein import into nucleus(GO:0060392) |
| 0.1 |
0.8 |
GO:0014850 |
response to muscle activity(GO:0014850) |
| 0.1 |
0.6 |
GO:0009256 |
10-formyltetrahydrofolate metabolic process(GO:0009256) |
| 0.1 |
1.0 |
GO:0045345 |
positive regulation of MHC class I biosynthetic process(GO:0045345) |
| 0.1 |
4.1 |
GO:0016601 |
Rac protein signal transduction(GO:0016601) |
| 0.1 |
14.1 |
GO:0008277 |
regulation of G-protein coupled receptor protein signaling pathway(GO:0008277) |
| 0.1 |
1.6 |
GO:0045793 |
positive regulation of cell size(GO:0045793) |
| 0.1 |
0.5 |
GO:0000738 |
DNA catabolic process, exonucleolytic(GO:0000738) |
| 0.1 |
0.8 |
GO:2000676 |
positive regulation of type B pancreatic cell apoptotic process(GO:2000676) |
| 0.1 |
0.5 |
GO:0019859 |
pyrimidine nucleobase catabolic process(GO:0006208) thymine catabolic process(GO:0006210) thymine metabolic process(GO:0019859) |
| 0.1 |
7.9 |
GO:1900181 |
negative regulation of protein localization to nucleus(GO:1900181) |
| 0.1 |
1.5 |
GO:0042355 |
fucose catabolic process(GO:0019317) L-fucose metabolic process(GO:0042354) L-fucose catabolic process(GO:0042355) |
| 0.1 |
0.2 |
GO:0071639 |
positive regulation of monocyte chemotactic protein-1 production(GO:0071639) |
| 0.1 |
1.0 |
GO:0035965 |
cardiolipin acyl-chain remodeling(GO:0035965) |
| 0.1 |
0.6 |
GO:1902254 |
negative regulation of intrinsic apoptotic signaling pathway by p53 class mediator(GO:1902254) |
| 0.1 |
3.6 |
GO:0019228 |
neuronal action potential(GO:0019228) |
| 0.1 |
1.1 |
GO:0048194 |
Golgi vesicle budding(GO:0048194) |
| 0.1 |
2.3 |
GO:0032515 |
negative regulation of phosphoprotein phosphatase activity(GO:0032515) |
| 0.1 |
0.3 |
GO:0038178 |
complement component C5a signaling pathway(GO:0038178) |
| 0.1 |
0.5 |
GO:0060155 |
platelet dense granule organization(GO:0060155) |
| 0.1 |
0.4 |
GO:0032621 |
interleukin-18 production(GO:0032621) |
| 0.1 |
0.8 |
GO:0070940 |
dephosphorylation of RNA polymerase II C-terminal domain(GO:0070940) |
| 0.1 |
0.4 |
GO:0015788 |
UDP-N-acetylglucosamine transport(GO:0015788) UDP-N-acetylglucosamine transmembrane transport(GO:1990569) |
| 0.1 |
0.2 |
GO:2000583 |
regulation of platelet-derived growth factor receptor-alpha signaling pathway(GO:2000583) negative regulation of platelet-derived growth factor receptor-alpha signaling pathway(GO:2000584) |
| 0.1 |
0.3 |
GO:0051138 |
positive regulation of NK T cell differentiation(GO:0051138) |
| 0.1 |
0.5 |
GO:1902037 |
negative regulation of hematopoietic stem cell differentiation(GO:1902037) |
| 0.1 |
2.7 |
GO:0034243 |
regulation of transcription elongation from RNA polymerase II promoter(GO:0034243) |
| 0.1 |
0.6 |
GO:0009438 |
methylglyoxal metabolic process(GO:0009438) |
| 0.1 |
0.6 |
GO:0017185 |
peptidyl-lysine hydroxylation(GO:0017185) |
| 0.1 |
1.0 |
GO:0010265 |
SCF complex assembly(GO:0010265) |
| 0.1 |
0.7 |
GO:0033523 |
histone H2B ubiquitination(GO:0033523) |
| 0.1 |
0.3 |
GO:1900119 |
positive regulation of execution phase of apoptosis(GO:1900119) |
| 0.1 |
0.1 |
GO:1990108 |
protein linear deubiquitination(GO:1990108) |
| 0.1 |
0.4 |
GO:0000961 |
negative regulation of mitochondrial RNA catabolic process(GO:0000961) |
| 0.1 |
0.4 |
GO:0097368 |
establishment of Sertoli cell barrier(GO:0097368) |
| 0.1 |
1.7 |
GO:0032876 |
negative regulation of DNA endoreduplication(GO:0032876) |
| 0.1 |
0.6 |
GO:0042796 |
snRNA transcription from RNA polymerase III promoter(GO:0042796) |
| 0.1 |
3.4 |
GO:0035338 |
long-chain fatty-acyl-CoA biosynthetic process(GO:0035338) |
| 0.1 |
0.5 |
GO:0097052 |
L-kynurenine metabolic process(GO:0097052) |
| 0.1 |
3.2 |
GO:0021762 |
substantia nigra development(GO:0021762) |
| 0.1 |
1.8 |
GO:0007398 |
ectoderm development(GO:0007398) |
| 0.1 |
0.4 |
GO:0033211 |
adiponectin-activated signaling pathway(GO:0033211) |
| 0.1 |
0.3 |
GO:0014810 |
positive regulation of skeletal muscle contraction by regulation of release of sequestered calcium ion(GO:0014810) |
| 0.1 |
0.3 |
GO:0071285 |
cellular response to lithium ion(GO:0071285) |
| 0.1 |
0.7 |
GO:1990564 |
protein polyufmylation(GO:1990564) protein K69-linked ufmylation(GO:1990592) |
| 0.1 |
0.6 |
GO:0097680 |
double-strand break repair via classical nonhomologous end joining(GO:0097680) |
| 0.1 |
0.5 |
GO:0033184 |
positive regulation of histone ubiquitination(GO:0033184) regulation of histone H2B ubiquitination(GO:2001166) positive regulation of histone H2B ubiquitination(GO:2001168) |
| 0.1 |
0.8 |
GO:0006182 |
cGMP biosynthetic process(GO:0006182) |
| 0.1 |
0.9 |
GO:0046604 |
positive regulation of mitotic centrosome separation(GO:0046604) |
| 0.1 |
17.5 |
GO:0007156 |
homophilic cell adhesion via plasma membrane adhesion molecules(GO:0007156) |
| 0.1 |
0.4 |
GO:0071418 |
cellular response to amine stimulus(GO:0071418) |
| 0.1 |
0.2 |
GO:1901376 |
mycotoxin metabolic process(GO:0043385) aflatoxin metabolic process(GO:0046222) organic heteropentacyclic compound metabolic process(GO:1901376) |
| 0.1 |
0.6 |
GO:1904742 |
regulation of telomeric DNA binding(GO:1904742) |
| 0.1 |
0.2 |
GO:1902908 |
regulation of melanosome transport(GO:1902908) |
| 0.1 |
0.7 |
GO:0072393 |
microtubule anchoring at microtubule organizing center(GO:0072393) |
| 0.1 |
1.5 |
GO:0030516 |
regulation of axon extension(GO:0030516) |
| 0.1 |
0.7 |
GO:0006003 |
fructose 2,6-bisphosphate metabolic process(GO:0006003) |
| 0.1 |
0.4 |
GO:1990022 |
RNA polymerase II complex import to nucleus(GO:0044376) RNA polymerase III complex localization to nucleus(GO:1990022) |
| 0.1 |
1.4 |
GO:0006600 |
creatine metabolic process(GO:0006600) |
| 0.1 |
0.3 |
GO:0061590 |
calcium activated phospholipid scrambling(GO:0061588) calcium activated phosphatidylcholine scrambling(GO:0061590) calcium activated galactosylceramide scrambling(GO:0061591) |
| 0.1 |
1.0 |
GO:0032402 |
melanosome transport(GO:0032402) |
| 0.1 |
0.1 |
GO:2000157 |
regulation of protein K48-linked deubiquitination(GO:1903093) negative regulation of protein K48-linked deubiquitination(GO:1903094) negative regulation of ubiquitin-specific protease activity(GO:2000157) |
| 0.1 |
0.3 |
GO:0090080 |
positive regulation of MAPKKK cascade by fibroblast growth factor receptor signaling pathway(GO:0090080) |
| 0.1 |
0.4 |
GO:0097503 |
sialylation(GO:0097503) |
| 0.1 |
0.5 |
GO:1902415 |
regulation of mRNA binding(GO:1902415) |
| 0.1 |
0.4 |
GO:0003025 |
regulation of systemic arterial blood pressure by baroreceptor feedback(GO:0003025) |
| 0.1 |
0.6 |
GO:0090091 |
positive regulation of extracellular matrix disassembly(GO:0090091) |
| 0.1 |
4.5 |
GO:0046839 |
phospholipid dephosphorylation(GO:0046839) |
| 0.1 |
0.1 |
GO:0006408 |
snRNA export from nucleus(GO:0006408) |
| 0.1 |
1.6 |
GO:2000052 |
positive regulation of non-canonical Wnt signaling pathway(GO:2000052) |
| 0.1 |
0.2 |
GO:0090149 |
mitochondrial membrane fission(GO:0090149) |
| 0.1 |
0.4 |
GO:0006528 |
asparagine metabolic process(GO:0006528) |
| 0.1 |
1.3 |
GO:0045945 |
positive regulation of transcription from RNA polymerase III promoter(GO:0045945) |
| 0.1 |
0.6 |
GO:0061042 |
vascular wound healing(GO:0061042) |
| 0.1 |
2.2 |
GO:0035635 |
entry of bacterium into host cell(GO:0035635) |
| 0.1 |
1.4 |
GO:0090232 |
positive regulation of spindle checkpoint(GO:0090232) |
| 0.1 |
0.8 |
GO:0097119 |
postsynaptic density protein 95 clustering(GO:0097119) |
| 0.1 |
0.3 |
GO:0009838 |
abscission(GO:0009838) |
| 0.1 |
1.0 |
GO:0002051 |
osteoblast fate commitment(GO:0002051) |
| 0.1 |
0.6 |
GO:0006824 |
cobalt ion transport(GO:0006824) |
| 0.1 |
0.9 |
GO:0030321 |
transepithelial chloride transport(GO:0030321) |
| 0.1 |
0.1 |
GO:0071386 |
cellular response to corticosterone stimulus(GO:0071386) |
| 0.1 |
1.6 |
GO:0043518 |
negative regulation of DNA damage response, signal transduction by p53 class mediator(GO:0043518) |
| 0.1 |
0.5 |
GO:1901621 |
negative regulation of smoothened signaling pathway involved in dorsal/ventral neural tube patterning(GO:1901621) |
| 0.1 |
0.2 |
GO:0018916 |
nitrobenzene metabolic process(GO:0018916) |
| 0.1 |
0.7 |
GO:0042635 |
positive regulation of hair cycle(GO:0042635) |
| 0.1 |
0.5 |
GO:0015862 |
uridine transport(GO:0015862) |
| 0.1 |
0.1 |
GO:1903774 |
positive regulation of viral budding via host ESCRT complex(GO:1903774) |
| 0.1 |
0.4 |
GO:0007097 |
nuclear migration(GO:0007097) establishment of nucleus localization(GO:0040023) |
| 0.1 |
2.4 |
GO:0036152 |
phosphatidylethanolamine acyl-chain remodeling(GO:0036152) |
| 0.1 |
0.7 |
GO:0019255 |
glucose 1-phosphate metabolic process(GO:0019255) |
| 0.1 |
9.8 |
GO:0042147 |
retrograde transport, endosome to Golgi(GO:0042147) |
| 0.1 |
0.2 |
GO:0098532 |
histone H3-K27 trimethylation(GO:0098532) |
| 0.1 |
0.3 |
GO:0036353 |
histone H2A-K119 monoubiquitination(GO:0036353) |
| 0.1 |
2.8 |
GO:0050650 |
chondroitin sulfate proteoglycan biosynthetic process(GO:0050650) |
| 0.1 |
0.3 |
GO:0030327 |
prenylated protein catabolic process(GO:0030327) |
| 0.1 |
0.2 |
GO:0044340 |
canonical Wnt signaling pathway involved in regulation of cell proliferation(GO:0044340) |
| 0.1 |
0.9 |
GO:2000680 |
rubidium ion transport(GO:0035826) regulation of rubidium ion transport(GO:2000680) |
| 0.1 |
0.1 |
GO:1901096 |
regulation of autophagosome maturation(GO:1901096) |
| 0.1 |
0.3 |
GO:0072560 |
type B pancreatic cell maturation(GO:0072560) |
| 0.1 |
0.1 |
GO:0007113 |
endomitotic cell cycle(GO:0007113) |
| 0.1 |
0.1 |
GO:0045653 |
negative regulation of megakaryocyte differentiation(GO:0045653) |
| 0.1 |
0.3 |
GO:0046098 |
guanine catabolic process(GO:0006147) guanine metabolic process(GO:0046098) |
| 0.1 |
0.1 |
GO:0031914 |
negative regulation of synaptic plasticity(GO:0031914) |
| 0.1 |
0.4 |
GO:2000074 |
regulation of type B pancreatic cell development(GO:2000074) |
| 0.1 |
0.4 |
GO:0010760 |
negative regulation of macrophage chemotaxis(GO:0010760) |
| 0.1 |
1.7 |
GO:0010990 |
regulation of SMAD protein complex assembly(GO:0010990) negative regulation of SMAD protein complex assembly(GO:0010991) |
| 0.1 |
0.3 |
GO:1904828 |
phenotypic switching(GO:0036166) regulation of phenotypic switching by transcription from RNA polymerase II promoter(GO:0100057) regulation of phenotypic switching(GO:1900239) regulation of hydrogen sulfide biosynthetic process(GO:1904826) positive regulation of hydrogen sulfide biosynthetic process(GO:1904828) |
| 0.1 |
0.6 |
GO:2001224 |
positive regulation of neuron migration(GO:2001224) |
| 0.1 |
0.5 |
GO:0006696 |
ergosterol biosynthetic process(GO:0006696) ergosterol metabolic process(GO:0008204) |
| 0.1 |
0.2 |
GO:0019343 |
cysteine biosynthetic process from serine(GO:0006535) cysteine biosynthetic process via cystathionine(GO:0019343) |
| 0.1 |
5.2 |
GO:0034219 |
carbohydrate transmembrane transport(GO:0034219) |
| 0.1 |
1.5 |
GO:0089711 |
L-glutamate transmembrane transport(GO:0089711) |
| 0.1 |
0.7 |
GO:0070120 |
ciliary neurotrophic factor-mediated signaling pathway(GO:0070120) |
| 0.1 |
1.3 |
GO:2000251 |
positive regulation of actin cytoskeleton reorganization(GO:2000251) |
| 0.1 |
0.6 |
GO:0075525 |
viral translational termination-reinitiation(GO:0075525) |
| 0.1 |
0.3 |
GO:0010044 |
response to aluminum ion(GO:0010044) |
| 0.1 |
1.8 |
GO:0010762 |
regulation of fibroblast migration(GO:0010762) |
| 0.1 |
1.0 |
GO:1900745 |
positive regulation of p38MAPK cascade(GO:1900745) |
| 0.1 |
0.4 |
GO:0045359 |
positive regulation of interferon-beta biosynthetic process(GO:0045359) |
| 0.1 |
0.3 |
GO:0009298 |
GDP-mannose biosynthetic process(GO:0009298) |
| 0.1 |
0.3 |
GO:0018277 |
protein deamination(GO:0018277) |
| 0.1 |
1.2 |
GO:0061099 |
negative regulation of protein tyrosine kinase activity(GO:0061099) |
| 0.1 |
2.4 |
GO:0043101 |
purine-containing compound salvage(GO:0043101) |
| 0.1 |
0.2 |
GO:0097698 |
telomere maintenance via base-excision repair(GO:0097698) |
| 0.1 |
0.5 |
GO:0070973 |
protein localization to endoplasmic reticulum exit site(GO:0070973) |
| 0.1 |
0.7 |
GO:0061087 |
positive regulation of histone H3-K27 methylation(GO:0061087) |
| 0.1 |
2.2 |
GO:0045662 |
negative regulation of myoblast differentiation(GO:0045662) |
| 0.1 |
0.7 |
GO:0090336 |
positive regulation of brown fat cell differentiation(GO:0090336) |
| 0.1 |
0.6 |
GO:0060005 |
vestibular reflex(GO:0060005) |
| 0.1 |
0.3 |
GO:0060449 |
bud elongation involved in lung branching(GO:0060449) |
| 0.1 |
0.2 |
GO:0048250 |
mitochondrial iron ion transport(GO:0048250) |
| 0.1 |
0.5 |
GO:0015742 |
alpha-ketoglutarate transport(GO:0015742) |
| 0.1 |
0.1 |
GO:1903351 |
response to dopamine(GO:1903350) cellular response to dopamine(GO:1903351) |
| 0.1 |
0.9 |
GO:0031112 |
positive regulation of microtubule polymerization or depolymerization(GO:0031112) positive regulation of microtubule polymerization(GO:0031116) |
| 0.1 |
0.4 |
GO:2001212 |
regulation of vasculogenesis(GO:2001212) |
| 0.1 |
0.5 |
GO:0072695 |
negative regulation of DNA recombination at telomere(GO:0048239) regulation of DNA recombination at telomere(GO:0072695) |
| 0.1 |
0.3 |
GO:0047497 |
establishment of mitochondrion localization, microtubule-mediated(GO:0034643) mitochondrion transport along microtubule(GO:0047497) |
| 0.1 |
0.5 |
GO:0035810 |
positive regulation of urine volume(GO:0035810) |
| 0.1 |
0.2 |
GO:0060979 |
vasculogenesis involved in coronary vascular morphogenesis(GO:0060979) |
| 0.1 |
0.6 |
GO:0000395 |
mRNA 5'-splice site recognition(GO:0000395) |
| 0.1 |
0.2 |
GO:0097274 |
urea homeostasis(GO:0097274) |
| 0.1 |
2.1 |
GO:0016338 |
calcium-independent cell-cell adhesion via plasma membrane cell-adhesion molecules(GO:0016338) |
| 0.1 |
0.2 |
GO:0002759 |
regulation of antimicrobial humoral response(GO:0002759) |
| 0.1 |
0.3 |
GO:0042369 |
vitamin D catabolic process(GO:0042369) |
| 0.1 |
0.4 |
GO:0070649 |
formin-nucleated actin cable assembly(GO:0070649) |
| 0.1 |
0.5 |
GO:0010172 |
embryonic body morphogenesis(GO:0010172) |
| 0.1 |
0.1 |
GO:0042309 |
homoiothermy(GO:0042309) |
| 0.1 |
1.0 |
GO:0014854 |
response to inactivity(GO:0014854) |
| 0.1 |
0.4 |
GO:0044314 |
protein K27-linked ubiquitination(GO:0044314) |
| 0.1 |
0.4 |
GO:0019919 |
peptidyl-arginine methylation, to asymmetrical-dimethyl arginine(GO:0019919) |
| 0.1 |
0.3 |
GO:0019323 |
pentose catabolic process(GO:0019323) |
| 0.1 |
0.4 |
GO:0043988 |
histone H3-S28 phosphorylation(GO:0043988) |
| 0.1 |
1.5 |
GO:0009235 |
cobalamin metabolic process(GO:0009235) |
| 0.1 |
0.4 |
GO:0045229 |
cell envelope organization(GO:0043163) external encapsulating structure organization(GO:0045229) |
| 0.1 |
0.2 |
GO:0061428 |
negative regulation of transcription from RNA polymerase II promoter in response to hypoxia(GO:0061428) |
| 0.1 |
1.9 |
GO:0051898 |
negative regulation of protein kinase B signaling(GO:0051898) |
| 0.1 |
0.7 |
GO:0000492 |
box C/D snoRNP assembly(GO:0000492) |
| 0.1 |
0.7 |
GO:0090004 |
positive regulation of establishment of protein localization to plasma membrane(GO:0090004) |
| 0.1 |
0.3 |
GO:0071348 |
cellular response to interleukin-11(GO:0071348) |
| 0.1 |
0.6 |
GO:1904181 |
positive regulation of membrane depolarization(GO:1904181) |
| 0.1 |
1.4 |
GO:0010761 |
fibroblast migration(GO:0010761) |
| 0.1 |
0.4 |
GO:0016242 |
negative regulation of macroautophagy(GO:0016242) |
| 0.1 |
0.6 |
GO:0006857 |
oligopeptide transport(GO:0006857) |
| 0.1 |
0.3 |
GO:0038170 |
somatostatin receptor signaling pathway(GO:0038169) somatostatin signaling pathway(GO:0038170) |
| 0.1 |
1.3 |
GO:0043578 |
nuclear matrix organization(GO:0043578) nuclear matrix anchoring at nuclear membrane(GO:0090292) |
| 0.1 |
2.4 |
GO:0016239 |
positive regulation of macroautophagy(GO:0016239) |
| 0.1 |
6.7 |
GO:0016266 |
O-glycan processing(GO:0016266) |
| 0.1 |
0.4 |
GO:0038112 |
interleukin-8-mediated signaling pathway(GO:0038112) response to interleukin-8(GO:0098758) cellular response to interleukin-8(GO:0098759) |
| 0.1 |
0.3 |
GO:0006566 |
threonine metabolic process(GO:0006566) |
| 0.1 |
1.1 |
GO:0051894 |
positive regulation of focal adhesion assembly(GO:0051894) positive regulation of adherens junction organization(GO:1903393) |
| 0.1 |
0.4 |
GO:0010836 |
negative regulation of protein ADP-ribosylation(GO:0010836) |
| 0.1 |
0.4 |
GO:0090659 |
walking behavior(GO:0090659) |
| 0.1 |
0.2 |
GO:0046041 |
ITP metabolic process(GO:0046041) |
| 0.1 |
0.1 |
GO:0018171 |
peptidyl-cysteine oxidation(GO:0018171) |
| 0.1 |
1.4 |
GO:0018146 |
keratan sulfate biosynthetic process(GO:0018146) |
| 0.1 |
0.2 |
GO:0032914 |
positive regulation of transforming growth factor beta1 production(GO:0032914) |
| 0.1 |
0.5 |
GO:0071498 |
cellular response to fluid shear stress(GO:0071498) |
| 0.1 |
4.5 |
GO:0015701 |
bicarbonate transport(GO:0015701) |
| 0.1 |
0.6 |
GO:0006686 |
sphingomyelin biosynthetic process(GO:0006686) |
| 0.1 |
0.1 |
GO:0097476 |
spinal cord motor neuron migration(GO:0097476) |
| 0.1 |
0.1 |
GO:0046416 |
D-amino acid metabolic process(GO:0046416) |
| 0.1 |
0.2 |
GO:0000349 |
generation of catalytic spliceosome for first transesterification step(GO:0000349) |
| 0.1 |
0.3 |
GO:0018106 |
peptidyl-histidine phosphorylation(GO:0018106) |
| 0.1 |
0.3 |
GO:0009149 |
pyrimidine nucleoside triphosphate catabolic process(GO:0009149) pyrimidine deoxyribonucleoside triphosphate catabolic process(GO:0009213) |
| 0.1 |
0.3 |
GO:0048749 |
compound eye development(GO:0048749) |
| 0.1 |
4.3 |
GO:1902476 |
chloride transmembrane transport(GO:1902476) |
| 0.1 |
0.5 |
GO:0033555 |
multicellular organismal response to stress(GO:0033555) |
| 0.1 |
0.6 |
GO:0042373 |
vitamin K metabolic process(GO:0042373) |
| 0.1 |
7.9 |
GO:0071805 |
cellular potassium ion transport(GO:0071804) potassium ion transmembrane transport(GO:0071805) |
| 0.1 |
0.5 |
GO:0006659 |
phosphatidylserine biosynthetic process(GO:0006659) |
| 0.1 |
1.1 |
GO:0097576 |
vacuole fusion(GO:0097576) |
| 0.1 |
0.3 |
GO:0045947 |
negative regulation of translational initiation(GO:0045947) |
| 0.1 |
0.2 |
GO:0016256 |
N-glycan processing to lysosome(GO:0016256) |
| 0.1 |
0.7 |
GO:0031110 |
regulation of microtubule polymerization or depolymerization(GO:0031110) |
| 0.1 |
0.1 |
GO:0035519 |
protein K29-linked ubiquitination(GO:0035519) |
| 0.1 |
5.8 |
GO:0018410 |
C-terminal protein amino acid modification(GO:0018410) |
| 0.1 |
0.7 |
GO:0070294 |
renal sodium ion absorption(GO:0070294) |
| 0.1 |
1.1 |
GO:0003376 |
sphingosine-1-phosphate signaling pathway(GO:0003376) |
| 0.1 |
2.0 |
GO:0043330 |
response to exogenous dsRNA(GO:0043330) |
| 0.1 |
0.1 |
GO:0043266 |
regulation of potassium ion transport(GO:0043266) |
| 0.1 |
0.1 |
GO:0003221 |
right ventricular cardiac muscle tissue morphogenesis(GO:0003221) |
| 0.1 |
0.8 |
GO:0042249 |
establishment of planar polarity of embryonic epithelium(GO:0042249) |
| 0.1 |
0.2 |
GO:1902165 |
regulation of intrinsic apoptotic signaling pathway in response to DNA damage by p53 class mediator(GO:1902165) |
| 0.1 |
0.4 |
GO:0044245 |
polysaccharide digestion(GO:0044245) |
| 0.1 |
0.6 |
GO:0006689 |
ganglioside catabolic process(GO:0006689) |
| 0.1 |
0.7 |
GO:0006776 |
vitamin A metabolic process(GO:0006776) |
| 0.1 |
0.5 |
GO:0007216 |
G-protein coupled glutamate receptor signaling pathway(GO:0007216) |
| 0.1 |
0.8 |
GO:0051602 |
response to electrical stimulus(GO:0051602) |
| 0.1 |
0.1 |
GO:0061055 |
myotome development(GO:0061055) |
| 0.1 |
0.1 |
GO:2000270 |
negative regulation of fibroblast apoptotic process(GO:2000270) |
| 0.1 |
0.1 |
GO:2000721 |
positive regulation of transcription from RNA polymerase II promoter involved in smooth muscle cell differentiation(GO:2000721) |
| 0.1 |
0.2 |
GO:1902527 |
positive regulation of protein monoubiquitination(GO:1902527) |
| 0.1 |
0.5 |
GO:0002138 |
retinoic acid biosynthetic process(GO:0002138) |
| 0.1 |
1.3 |
GO:1903146 |
regulation of mitophagy(GO:1903146) |
| 0.1 |
0.1 |
GO:0030505 |
inorganic diphosphate transport(GO:0030505) |
| 0.1 |
0.4 |
GO:0034058 |
endosomal vesicle fusion(GO:0034058) |
| 0.1 |
0.7 |
GO:0035767 |
endothelial cell chemotaxis(GO:0035767) |
| 0.1 |
0.4 |
GO:0016255 |
attachment of GPI anchor to protein(GO:0016255) |
| 0.1 |
0.2 |
GO:0045209 |
MAPK phosphatase export from nucleus(GO:0045208) MAPK phosphatase export from nucleus, leptomycin B sensitive(GO:0045209) |
| 0.1 |
0.2 |
GO:0000454 |
snoRNA guided rRNA pseudouridine synthesis(GO:0000454) |
| 0.1 |
0.7 |
GO:0006622 |
protein targeting to lysosome(GO:0006622) |
| 0.1 |
0.6 |
GO:0051095 |
regulation of helicase activity(GO:0051095) |
| 0.1 |
0.5 |
GO:0090204 |
protein localization to nuclear pore(GO:0090204) |
| 0.1 |
0.2 |
GO:2000653 |
regulation of genetic imprinting(GO:2000653) |
| 0.1 |
1.6 |
GO:0006607 |
NLS-bearing protein import into nucleus(GO:0006607) |
| 0.1 |
0.2 |
GO:1904749 |
regulation of protein localization to nucleolus(GO:1904749) positive regulation of protein localization to nucleolus(GO:1904751) |
| 0.1 |
0.6 |
GO:0061462 |
protein localization to lysosome(GO:0061462) |
| 0.1 |
0.9 |
GO:0030422 |
production of siRNA involved in RNA interference(GO:0030422) |
| 0.1 |
0.1 |
GO:0070634 |
transepithelial ammonium transport(GO:0070634) |
| 0.1 |
0.5 |
GO:0045876 |
positive regulation of sister chromatid cohesion(GO:0045876) |
| 0.1 |
0.1 |
GO:0090118 |
receptor-mediated endocytosis of low-density lipoprotein particle involved in cholesterol transport(GO:0090118) |
| 0.0 |
0.1 |
GO:1903071 |
positive regulation of ER-associated ubiquitin-dependent protein catabolic process(GO:1903071) |
| 0.0 |
3.6 |
GO:0051865 |
protein autoubiquitination(GO:0051865) |
| 0.0 |
0.7 |
GO:0007271 |
synaptic transmission, cholinergic(GO:0007271) |
| 0.0 |
0.2 |
GO:0046166 |
glyceraldehyde-3-phosphate biosynthetic process(GO:0046166) |
| 0.0 |
0.1 |
GO:0035803 |
egg coat formation(GO:0035803) |
| 0.0 |
0.0 |
GO:0006421 |
asparaginyl-tRNA aminoacylation(GO:0006421) |
| 0.0 |
0.7 |
GO:1901836 |
regulation of transcription of nuclear large rRNA transcript from RNA polymerase I promoter(GO:1901836) positive regulation of transcription of nuclear large rRNA transcript from RNA polymerase I promoter(GO:1901838) |
| 0.0 |
0.2 |
GO:1900245 |
positive regulation of MDA-5 signaling pathway(GO:1900245) |
| 0.0 |
0.2 |
GO:0044546 |
NLRP3 inflammasome complex assembly(GO:0044546) |
| 0.0 |
0.6 |
GO:0000244 |
spliceosomal tri-snRNP complex assembly(GO:0000244) |
| 0.0 |
0.1 |
GO:0072102 |
glomerulus morphogenesis(GO:0072102) |
| 0.0 |
1.0 |
GO:0030865 |
cortical cytoskeleton organization(GO:0030865) |
| 0.0 |
0.6 |
GO:0051220 |
cytoplasmic sequestering of protein(GO:0051220) |
| 0.0 |
0.3 |
GO:0034214 |
protein hexamerization(GO:0034214) |
| 0.0 |
1.8 |
GO:0036092 |
phosphatidylinositol-3-phosphate biosynthetic process(GO:0036092) |
| 0.0 |
0.4 |
GO:0051418 |
interphase microtubule nucleation by interphase microtubule organizing center(GO:0051415) microtubule nucleation by microtubule organizing center(GO:0051418) |
| 0.0 |
0.6 |
GO:0032780 |
negative regulation of ATPase activity(GO:0032780) |
| 0.0 |
0.1 |
GO:0086070 |
SA node cell to atrial cardiac muscle cell communication(GO:0086070) |
| 0.0 |
0.7 |
GO:0071305 |
cellular response to vitamin D(GO:0071305) |
| 0.0 |
0.3 |
GO:0097676 |
histone H3-K36 dimethylation(GO:0097676) |
| 0.0 |
0.1 |
GO:0000354 |
cis assembly of pre-catalytic spliceosome(GO:0000354) |
| 0.0 |
0.3 |
GO:0070163 |
adiponectin secretion(GO:0070162) regulation of adiponectin secretion(GO:0070163) negative regulation of adiponectin secretion(GO:0070164) |
| 0.0 |
0.0 |
GO:1900155 |
regulation of bone trabecula formation(GO:1900154) negative regulation of bone trabecula formation(GO:1900155) |
| 0.0 |
0.1 |
GO:0033578 |
protein glycosylation in Golgi(GO:0033578) |
| 0.0 |
0.1 |
GO:0006663 |
platelet activating factor biosynthetic process(GO:0006663) |
| 0.0 |
0.3 |
GO:0032026 |
response to magnesium ion(GO:0032026) |
| 0.0 |
0.0 |
GO:0010726 |
positive regulation of hydrogen peroxide metabolic process(GO:0010726) |
| 0.0 |
0.1 |
GO:0090161 |
Golgi ribbon formation(GO:0090161) |
| 0.0 |
0.8 |
GO:0006895 |
Golgi to endosome transport(GO:0006895) |
| 0.0 |
0.0 |
GO:0046078 |
pyrimidine deoxyribonucleoside monophosphate metabolic process(GO:0009176) dUMP metabolic process(GO:0046078) |
| 0.0 |
0.1 |
GO:0044313 |
protein K6-linked deubiquitination(GO:0044313) |
| 0.0 |
1.2 |
GO:0007416 |
synapse assembly(GO:0007416) |
| 0.0 |
0.1 |
GO:0048318 |
axial mesoderm development(GO:0048318) |
| 0.0 |
0.3 |
GO:0010934 |
macrophage cytokine production(GO:0010934) |
| 0.0 |
0.5 |
GO:0015747 |
urate transport(GO:0015747) |
| 0.0 |
0.2 |
GO:0097475 |
motor neuron migration(GO:0097475) |
| 0.0 |
0.1 |
GO:0001573 |
ganglioside metabolic process(GO:0001573) |
| 0.0 |
0.1 |
GO:0046984 |
regulation of hemoglobin biosynthetic process(GO:0046984) |
| 0.0 |
0.0 |
GO:0070358 |
actin polymerization-dependent cell motility(GO:0070358) |
| 0.0 |
0.7 |
GO:0030804 |
positive regulation of cyclic nucleotide biosynthetic process(GO:0030804) |
| 0.0 |
0.2 |
GO:0006701 |
progesterone biosynthetic process(GO:0006701) |
| 0.0 |
0.5 |
GO:1902018 |
negative regulation of cilium assembly(GO:1902018) |
| 0.0 |
0.1 |
GO:0098780 |
response to mitochondrial depolarisation(GO:0098780) |
| 0.0 |
0.2 |
GO:0045903 |
positive regulation of translational fidelity(GO:0045903) |
| 0.0 |
0.2 |
GO:0055119 |
relaxation of cardiac muscle(GO:0055119) |
| 0.0 |
0.7 |
GO:0008333 |
endosome to lysosome transport(GO:0008333) |
| 0.0 |
0.1 |
GO:0071680 |
response to indole-3-methanol(GO:0071680) cellular response to indole-3-methanol(GO:0071681) |
| 0.0 |
0.2 |
GO:0090625 |
mRNA cleavage involved in gene silencing by siRNA(GO:0090625) |
| 0.0 |
0.9 |
GO:0060716 |
labyrinthine layer blood vessel development(GO:0060716) |
| 0.0 |
0.2 |
GO:2000394 |
positive regulation of lamellipodium morphogenesis(GO:2000394) |
| 0.0 |
0.5 |
GO:0045899 |
positive regulation of RNA polymerase II transcriptional preinitiation complex assembly(GO:0045899) |
| 0.0 |
0.7 |
GO:1902230 |
negative regulation of intrinsic apoptotic signaling pathway in response to DNA damage(GO:1902230) |
| 0.0 |
5.9 |
GO:0072599 |
establishment of protein localization to endoplasmic reticulum(GO:0072599) |
| 0.0 |
0.8 |
GO:1901685 |
glutathione derivative metabolic process(GO:1901685) glutathione derivative biosynthetic process(GO:1901687) |
| 0.0 |
0.7 |
GO:0036257 |
multivesicular body organization(GO:0036257) |
| 0.0 |
0.7 |
GO:0050812 |
regulation of acyl-CoA biosynthetic process(GO:0050812) |
| 0.0 |
0.1 |
GO:0021999 |
neural plate anterior/posterior regionalization(GO:0021999) neural plate regionalization(GO:0060897) |
| 0.0 |
0.4 |
GO:0043651 |
linoleic acid metabolic process(GO:0043651) |
| 0.0 |
0.3 |
GO:0060056 |
mammary gland involution(GO:0060056) |
| 0.0 |
0.1 |
GO:1905154 |
negative regulation of eosinophil activation(GO:1902567) negative regulation of membrane invagination(GO:1905154) |
| 0.0 |
0.3 |
GO:0045199 |
maintenance of apical/basal cell polarity(GO:0035090) maintenance of epithelial cell apical/basal polarity(GO:0045199) |
| 0.0 |
0.1 |
GO:0002101 |
tRNA wobble cytosine modification(GO:0002101) |
| 0.0 |
2.7 |
GO:0030705 |
cytoskeleton-dependent intracellular transport(GO:0030705) |
| 0.0 |
0.2 |
GO:0019276 |
UDP-N-acetylgalactosamine metabolic process(GO:0019276) |
| 0.0 |
0.0 |
GO:0090191 |
negative regulation of branching involved in ureteric bud morphogenesis(GO:0090191) |
| 0.0 |
2.4 |
GO:0001895 |
retina homeostasis(GO:0001895) |
| 0.0 |
0.3 |
GO:2001046 |
positive regulation of integrin-mediated signaling pathway(GO:2001046) |
| 0.0 |
1.2 |
GO:0044247 |
polysaccharide catabolic process(GO:0000272) glycogen catabolic process(GO:0005980) glucan catabolic process(GO:0009251) cellular polysaccharide catabolic process(GO:0044247) |
| 0.0 |
0.4 |
GO:0002192 |
IRES-dependent translational initiation(GO:0002192) IRES-dependent viral translational initiation(GO:0075522) |
| 0.0 |
0.8 |
GO:0006123 |
mitochondrial electron transport, cytochrome c to oxygen(GO:0006123) |
| 0.0 |
0.6 |
GO:0010664 |
negative regulation of striated muscle cell apoptotic process(GO:0010664) |
| 0.0 |
0.5 |
GO:0006703 |
estrogen biosynthetic process(GO:0006703) |
| 0.0 |
0.5 |
GO:0016558 |
protein import into peroxisome matrix(GO:0016558) |
| 0.0 |
0.0 |
GO:0052572 |
response to immune response of other organism involved in symbiotic interaction(GO:0052564) response to host immune response(GO:0052572) |
| 0.0 |
0.3 |
GO:0061141 |
cell differentiation involved in salivary gland development(GO:0060689) lung ciliated cell differentiation(GO:0061141) regulation of mesenchymal cell proliferation involved in lung development(GO:2000790) negative regulation of mesenchymal cell proliferation involved in lung development(GO:2000791) |
| 0.0 |
0.3 |
GO:0061484 |
hematopoietic stem cell homeostasis(GO:0061484) |
| 0.0 |
1.1 |
GO:0006376 |
mRNA splice site selection(GO:0006376) |
| 0.0 |
1.1 |
GO:0030835 |
negative regulation of actin filament depolymerization(GO:0030835) |
| 0.0 |
4.5 |
GO:0098916 |
chemical synaptic transmission(GO:0007268) anterograde trans-synaptic signaling(GO:0098916) trans-synaptic signaling(GO:0099537) |
| 0.0 |
0.1 |
GO:0035853 |
chromosome passenger complex localization to spindle midzone(GO:0035853) |
| 0.0 |
0.2 |
GO:0046415 |
urate metabolic process(GO:0046415) |
| 0.0 |
0.7 |
GO:0032211 |
negative regulation of telomere maintenance via telomerase(GO:0032211) |
| 0.0 |
0.9 |
GO:1905037 |
autophagosome organization(GO:1905037) |
| 0.0 |
0.3 |
GO:0060736 |
prostate gland growth(GO:0060736) |
| 0.0 |
0.3 |
GO:0090141 |
positive regulation of mitochondrial fission(GO:0090141) |
| 0.0 |
0.1 |
GO:0044829 |
positive regulation by host of viral genome replication(GO:0044829) |
| 0.0 |
1.2 |
GO:0050808 |
synapse organization(GO:0050808) |
| 0.0 |
0.2 |
GO:0018197 |
peptidyl-aspartic acid modification(GO:0018197) peptidyl-aspartic acid hydroxylation(GO:0042264) |
| 0.0 |
0.1 |
GO:1902022 |
lysine transport(GO:0015819) L-lysine transport(GO:1902022) L-lysine transmembrane transport(GO:1903401) |
| 0.0 |
0.1 |
GO:1904100 |
regulation of protein O-linked glycosylation(GO:1904098) positive regulation of protein O-linked glycosylation(GO:1904100) |
| 0.0 |
0.1 |
GO:0072733 |
response to staurosporine(GO:0072733) cellular response to staurosporine(GO:0072734) |
| 0.0 |
0.2 |
GO:2000661 |
positive regulation of interleukin-1-mediated signaling pathway(GO:2000661) |
| 0.0 |
0.1 |
GO:0002396 |
MHC protein complex assembly(GO:0002396) |
| 0.0 |
0.2 |
GO:0007288 |
sperm axoneme assembly(GO:0007288) |
| 0.0 |
0.0 |
GO:0036091 |
positive regulation of transcription from RNA polymerase II promoter in response to oxidative stress(GO:0036091) |
| 0.0 |
0.2 |
GO:0007035 |
vacuolar acidification(GO:0007035) |
| 0.0 |
0.4 |
GO:0010801 |
negative regulation of peptidyl-threonine phosphorylation(GO:0010801) |
| 0.0 |
0.1 |
GO:2000521 |
negative regulation of immunological synapse formation(GO:2000521) |
| 0.0 |
0.1 |
GO:0010286 |
heat acclimation(GO:0010286) cellular heat acclimation(GO:0070370) |
| 0.0 |
0.1 |
GO:0089718 |
amino acid import across plasma membrane(GO:0089718) |
| 0.0 |
2.2 |
GO:1903214 |
regulation of protein targeting to mitochondrion(GO:1903214) |
| 0.0 |
0.1 |
GO:0032185 |
septin cytoskeleton organization(GO:0032185) |
| 0.0 |
0.1 |
GO:0009189 |
deoxyribonucleoside diphosphate biosynthetic process(GO:0009189) |
| 0.0 |
0.4 |
GO:0030150 |
protein import into mitochondrial matrix(GO:0030150) |
| 0.0 |
0.3 |
GO:0034427 |
nuclear-transcribed mRNA catabolic process, exonucleolytic, 3'-5'(GO:0034427) |
| 0.0 |
0.1 |
GO:0017085 |
response to insecticide(GO:0017085) |
| 0.0 |
0.2 |
GO:2000766 |
negative regulation of cytoplasmic translation(GO:2000766) |
| 0.0 |
0.0 |
GO:1990416 |
cellular response to brain-derived neurotrophic factor stimulus(GO:1990416) |
| 0.0 |
0.1 |
GO:0002159 |
desmosome assembly(GO:0002159) |
| 0.0 |
0.0 |
GO:0070305 |
response to cGMP(GO:0070305) |
| 0.0 |
0.1 |
GO:0010694 |
positive regulation of alkaline phosphatase activity(GO:0010694) |
| 0.0 |
0.1 |
GO:1904428 |
negative regulation of tubulin deacetylation(GO:1904428) |
| 0.0 |
0.1 |
GO:0042262 |
DNA protection(GO:0042262) |
| 0.0 |
0.3 |
GO:0031109 |
microtubule polymerization or depolymerization(GO:0031109) |
| 0.0 |
0.0 |
GO:1900019 |
regulation of protein kinase C activity(GO:1900019) positive regulation of protein kinase C activity(GO:1900020) |
| 0.0 |
0.0 |
GO:0060050 |
positive regulation of protein glycosylation(GO:0060050) |
| 0.0 |
0.1 |
GO:0019085 |
early viral transcription(GO:0019085) |
| 0.0 |
0.3 |
GO:0050654 |
chondroitin sulfate proteoglycan metabolic process(GO:0050654) |
| 0.0 |
0.1 |
GO:0006449 |
regulation of translational termination(GO:0006449) |
| 0.0 |
1.0 |
GO:0015949 |
nucleobase-containing small molecule interconversion(GO:0015949) |
| 0.0 |
0.1 |
GO:0006610 |
ribosomal protein import into nucleus(GO:0006610) |
| 0.0 |
0.2 |
GO:1903078 |
positive regulation of protein localization to plasma membrane(GO:1903078) |
| 0.0 |
0.0 |
GO:0034163 |
regulation of toll-like receptor 9 signaling pathway(GO:0034163) |
| 0.0 |
0.1 |
GO:0007185 |
transmembrane receptor protein tyrosine phosphatase signaling pathway(GO:0007185) |
| 0.0 |
0.4 |
GO:0021885 |
forebrain cell migration(GO:0021885) |
| 0.0 |
0.2 |
GO:0021877 |
forebrain neuron fate commitment(GO:0021877) |
| 0.0 |
0.0 |
GO:0016128 |
phytosteroid metabolic process(GO:0016128) phytosteroid biosynthetic process(GO:0016129) |
| 0.0 |
0.2 |
GO:2000042 |
negative regulation of double-strand break repair via homologous recombination(GO:2000042) |
| 0.0 |
0.6 |
GO:0007205 |
protein kinase C-activating G-protein coupled receptor signaling pathway(GO:0007205) |
| 0.0 |
0.3 |
GO:0035067 |
negative regulation of histone acetylation(GO:0035067) |
| 0.0 |
0.3 |
GO:0016559 |
peroxisome fission(GO:0016559) |
| 0.0 |
0.5 |
GO:0046341 |
CDP-diacylglycerol metabolic process(GO:0046341) |
| 0.0 |
0.1 |
GO:1901350 |
cell-cell signaling involved in cell-cell junction organization(GO:1901350) |
| 0.0 |
0.1 |
GO:0019470 |
4-hydroxyproline catabolic process(GO:0019470) |
| 0.0 |
0.2 |
GO:0042407 |
cristae formation(GO:0042407) |
| 0.0 |
0.2 |
GO:0097242 |
beta-amyloid clearance(GO:0097242) |
| 0.0 |
0.1 |
GO:0051389 |
inactivation of MAPKK activity(GO:0051389) |
| 0.0 |
0.1 |
GO:0030174 |
regulation of DNA-dependent DNA replication initiation(GO:0030174) |
| 0.0 |
0.1 |
GO:0000720 |
pyrimidine dimer repair by nucleotide-excision repair(GO:0000720) |
| 0.0 |
0.1 |
GO:0045618 |
positive regulation of keratinocyte differentiation(GO:0045618) |
| 0.0 |
0.0 |
GO:0009794 |
regulation of mitotic cell cycle, embryonic(GO:0009794) mitotic cell cycle, embryonic(GO:0045448) |
| 0.0 |
0.2 |
GO:0034138 |
toll-like receptor 3 signaling pathway(GO:0034138) |
| 0.0 |
0.2 |
GO:0018095 |
protein polyglutamylation(GO:0018095) |
| 0.0 |
0.4 |
GO:0006068 |
ethanol catabolic process(GO:0006068) |
| 0.0 |
0.0 |
GO:0015864 |
pyrimidine nucleoside transport(GO:0015864) |
| 0.0 |
0.0 |
GO:1900194 |
negative regulation of oocyte maturation(GO:1900194) |
| 0.0 |
0.1 |
GO:1901341 |
activation of store-operated calcium channel activity(GO:0032237) positive regulation of store-operated calcium channel activity(GO:1901341) |
| 0.0 |
0.1 |
GO:0070127 |
tRNA aminoacylation for mitochondrial protein translation(GO:0070127) |
| 0.0 |
0.1 |
GO:0010260 |
organ senescence(GO:0010260) |
| 0.0 |
0.2 |
GO:1904871 |
regulation of protein localization to Cajal body(GO:1904869) positive regulation of protein localization to Cajal body(GO:1904871) |
| 0.0 |
0.0 |
GO:0072344 |
rescue of stalled ribosome(GO:0072344) |
| 0.0 |
0.0 |
GO:0098507 |
polynucleotide 5' dephosphorylation(GO:0098507) |
| 0.0 |
0.1 |
GO:0048489 |
synaptic vesicle transport(GO:0048489) establishment of synaptic vesicle localization(GO:0097480) |
| 0.0 |
0.1 |
GO:0016584 |
nucleosome positioning(GO:0016584) |
| 0.0 |
0.1 |
GO:1904354 |
negative regulation of telomere capping(GO:1904354) |
| 0.0 |
0.1 |
GO:1902573 |
positive regulation of serine-type endopeptidase activity(GO:1900005) positive regulation of serine-type peptidase activity(GO:1902573) |
| 0.0 |
0.2 |
GO:0046951 |
ketone body biosynthetic process(GO:0046951) |
| 0.0 |
0.2 |
GO:0009312 |
oligosaccharide biosynthetic process(GO:0009312) |
| 0.0 |
0.1 |
GO:0009437 |
carnitine metabolic process(GO:0009437) |
| 0.0 |
0.3 |
GO:0097341 |
inhibition of cysteine-type endopeptidase activity(GO:0097340) zymogen inhibition(GO:0097341) |
| 0.0 |
0.1 |
GO:0007183 |
SMAD protein complex assembly(GO:0007183) |
| 0.0 |
0.1 |
GO:0006983 |
ER overload response(GO:0006983) |
| 0.0 |
0.0 |
GO:1903450 |
regulation of G1 to G0 transition(GO:1903450) positive regulation of G1 to G0 transition(GO:1903452) |
| 0.0 |
0.0 |
GO:0021558 |
trochlear nerve development(GO:0021558) |
| 0.0 |
0.0 |
GO:0072425 |
signal transduction involved in G2 DNA damage checkpoint(GO:0072425) signal transduction involved in mitotic G2 DNA damage checkpoint(GO:0072434) |
| 0.0 |
0.0 |
GO:0002420 |
natural killer cell mediated cytotoxicity directed against tumor cell target(GO:0002420) natural killer cell mediated immune response to tumor cell(GO:0002423) regulation of natural killer cell mediated immune response to tumor cell(GO:0002855) regulation of natural killer cell mediated cytotoxicity directed against tumor cell target(GO:0002858) |
| 0.0 |
0.4 |
GO:1902017 |
regulation of cilium assembly(GO:1902017) |
| 0.0 |
0.1 |
GO:0015884 |
folic acid transport(GO:0015884) |
| 0.0 |
0.3 |
GO:0035725 |
sodium ion transmembrane transport(GO:0035725) |
| 0.0 |
0.2 |
GO:0030252 |
growth hormone secretion(GO:0030252) |
| 0.0 |
0.0 |
GO:0002581 |
negative regulation of antigen processing and presentation of peptide or polysaccharide antigen via MHC class II(GO:0002581) |
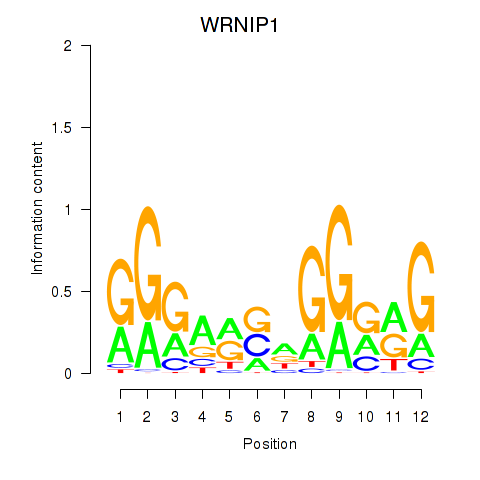
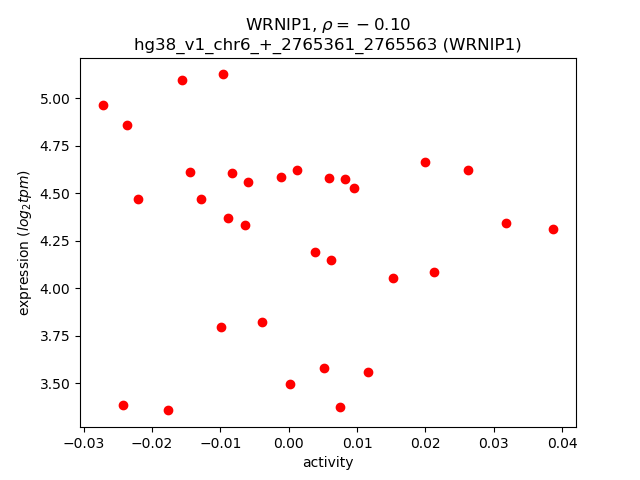

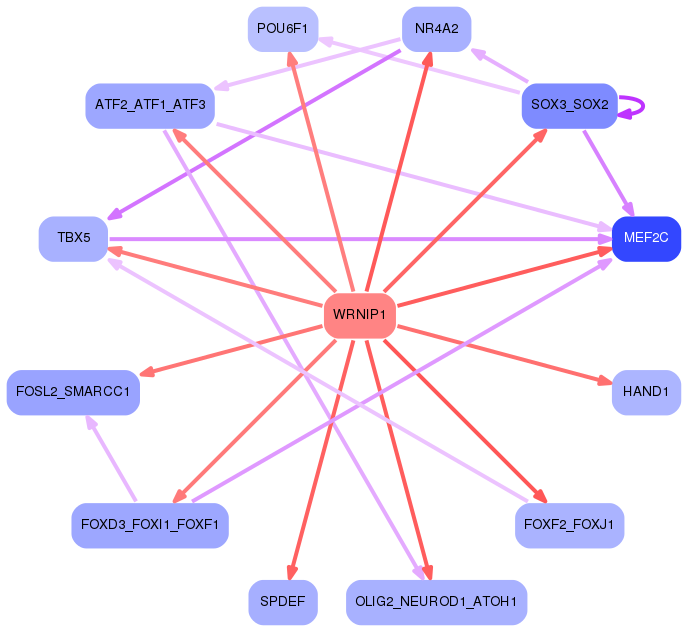