Project
Illumina Body Map 2 (GSE30611)
Navigation
Downloads
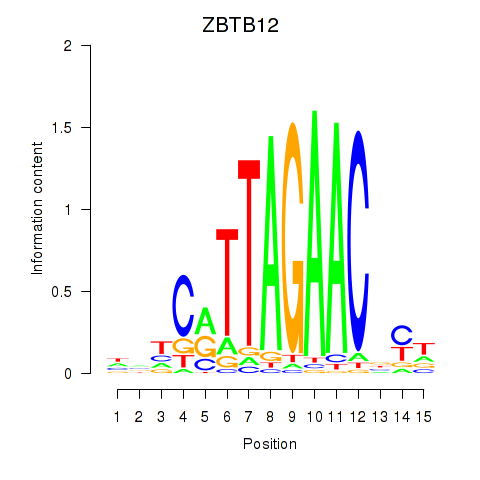
Results for ZBTB12
Z-value: 0.96
Motif logo
Transcription factors associated with ZBTB12
| Gene Symbol | Gene ID | Gene Info |
|---|---|---|
|
ZBTB12
|
ENSG00000204366.4 | zinc finger and BTB domain containing 12 |
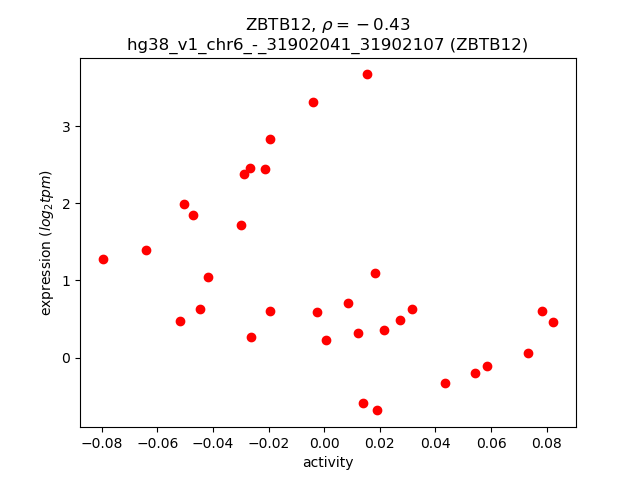
Activity-expression correlation:
| Gene | Promoter | Pearson corr. coef. | P-value | Plot |
|---|---|---|---|---|
| ZBTB12 | hg38_v1_chr6_-_31902041_31902107 | -0.43 | 1.3e-02 | Click! |
Activity profile of ZBTB12 motif
Sorted Z-values of ZBTB12 motif
| Promoter | Log-likelihood | Transcript | Gene | Gene Info |
|---|---|---|---|---|
| chr19_+_51761167 | 2.58 |
ENST00000340023.7
ENST00000599326.1 ENST00000598953.1 |
FPR2
|
formyl peptide receptor 2 |
| chr18_-_26865689 | 2.02 |
ENST00000675739.1
ENST00000383168.9 ENST00000672981.2 ENST00000578776.1 |
AQP4
|
aquaporin 4 |
| chr18_-_26865732 | 1.75 |
ENST00000672188.1
|
AQP4
|
aquaporin 4 |
| chr14_-_23408265 | 1.68 |
ENST00000405093.9
|
MYH6
|
myosin heavy chain 6 |
| chr8_+_2045037 | 1.63 |
ENST00000262113.9
|
MYOM2
|
myomesin 2 |
| chr8_+_2045058 | 1.43 |
ENST00000523438.1
|
MYOM2
|
myomesin 2 |
| chr9_+_124853417 | 1.25 |
ENST00000613760.4
ENST00000618744.4 ENST00000373574.2 |
WDR38
|
WD repeat domain 38 |
| chr11_+_12110569 | 1.22 |
ENST00000683283.1
ENST00000256194.8 |
MICAL2
|
microtubule associated monooxygenase, calponin and LIM domain containing 2 |
| chr19_+_54906140 | 1.20 |
ENST00000291890.9
ENST00000598576.5 ENST00000594765.5 ENST00000350790.9 ENST00000338835.9 ENST00000357397.5 |
NCR1
|
natural cytotoxicity triggering receptor 1 |
| chr3_-_151329539 | 1.05 |
ENST00000325602.6
|
P2RY13
|
purinergic receptor P2Y13 |
| chr8_-_51809414 | 1.01 |
ENST00000356297.5
|
PXDNL
|
peroxidasin like |
| chr11_+_60378494 | 0.97 |
ENST00000534016.5
|
MS4A7
|
membrane spanning 4-domains A7 |
| chr10_+_22928030 | 0.92 |
ENST00000409983.7
ENST00000298032.10 ENST00000409049.7 |
ARMC3
|
armadillo repeat containing 3 |
| chr1_+_66354375 | 0.92 |
ENST00000480109.2
|
PDE4B
|
phosphodiesterase 4B |
| chr11_-_60184415 | 0.87 |
ENST00000532169.5
ENST00000534596.5 |
MS4A6A
|
membrane spanning 4-domains A6A |
| chr1_+_158931539 | 0.83 |
ENST00000368140.6
ENST00000368138.7 ENST00000392254.6 ENST00000392252.7 ENST00000368135.4 |
PYHIN1
|
pyrin and HIN domain family member 1 |
| chr22_-_37175049 | 0.82 |
ENST00000453962.5
ENST00000429622.5 ENST00000445595.1 |
IL2RB
|
interleukin 2 receptor subunit beta |
| chr15_+_85582889 | 0.80 |
ENST00000560340.5
|
AKAP13
|
A-kinase anchoring protein 13 |
| chr11_+_112176364 | 0.79 |
ENST00000526088.5
ENST00000532593.5 ENST00000531169.5 |
BCO2
|
beta-carotene oxygenase 2 |
| chr17_+_11598456 | 0.76 |
ENST00000579828.5
ENST00000262442.9 ENST00000454412.6 |
DNAH9
|
dynein axonemal heavy chain 9 |
| chr11_+_2301987 | 0.76 |
ENST00000612299.4
ENST00000182290.9 |
TSPAN32
|
tetraspanin 32 |
| chr11_+_112175526 | 0.75 |
ENST00000532612.5
ENST00000438022.5 |
BCO2
|
beta-carotene oxygenase 2 |
| chr20_-_8019779 | 0.74 |
ENST00000527925.1
|
TMX4
|
thioredoxin related transmembrane protein 4 |
| chr16_+_14200330 | 0.73 |
ENST00000573051.1
|
MRTFB
|
myocardin related transcription factor B |
| chr11_-_60184633 | 0.73 |
ENST00000529054.5
ENST00000530839.5 ENST00000426738.6 |
MS4A6A
|
membrane spanning 4-domains A6A |
| chr22_-_50085414 | 0.73 |
ENST00000311597.10
|
MLC1
|
modulator of VRAC current 1 |
| chr6_-_55875583 | 0.71 |
ENST00000370830.4
|
BMP5
|
bone morphogenetic protein 5 |
| chr8_-_42502496 | 0.70 |
ENST00000522707.1
|
SLC20A2
|
solute carrier family 20 member 2 |
| chr10_+_61662921 | 0.67 |
ENST00000648843.3
ENST00000330194.2 ENST00000389639.3 |
CABCOCO1
|
ciliary associated calcium binding coiled-coil 1 |
| chr11_+_60378524 | 0.65 |
ENST00000530614.5
ENST00000530027.5 ENST00000300184.8 ENST00000530234.2 ENST00000528215.1 ENST00000531787.5 |
MS4A7
MS4A14
|
membrane spanning 4-domains A7 membrane spanning 4-domains A14 |
| chr11_-_60184481 | 0.65 |
ENST00000531531.1
|
MS4A6A
|
membrane spanning 4-domains A6A |
| chr5_+_36606355 | 0.64 |
ENST00000681909.1
ENST00000513903.5 ENST00000681795.1 ENST00000680125.1 ENST00000612708.5 ENST00000680232.1 ENST00000681776.1 ENST00000681926.1 ENST00000679958.1 ENST00000265113.9 ENST00000504121.5 ENST00000512374.1 ENST00000613445.5 ENST00000679983.1 |
SLC1A3
|
solute carrier family 1 member 3 |
| chr7_+_142455120 | 0.63 |
ENST00000390369.2
|
TRBV7-4
|
T cell receptor beta variable 7-4 |
| chr5_-_43313403 | 0.62 |
ENST00000325110.11
|
HMGCS1
|
3-hydroxy-3-methylglutaryl-CoA synthase 1 |
| chr2_+_112482133 | 0.61 |
ENST00000233336.7
|
TTL
|
tubulin tyrosine ligase |
| chr5_-_43313473 | 0.58 |
ENST00000433297.2
|
HMGCS1
|
3-hydroxy-3-methylglutaryl-CoA synthase 1 |
| chr19_-_51027662 | 0.56 |
ENST00000594768.5
|
KLK11
|
kallikrein related peptidase 11 |
| chr11_+_60378475 | 0.56 |
ENST00000358246.5
|
MS4A7
|
membrane spanning 4-domains A7 |
| chr6_+_108559742 | 0.56 |
ENST00000343882.10
|
FOXO3
|
forkhead box O3 |
| chr1_-_31798755 | 0.54 |
ENST00000452755.6
|
SPOCD1
|
SPOC domain containing 1 |
| chr12_-_123081287 | 0.53 |
ENST00000546049.5
|
PITPNM2
|
phosphatidylinositol transfer protein membrane associated 2 |
| chr17_-_7614824 | 0.53 |
ENST00000571597.1
ENST00000250113.12 |
FXR2
|
FMR1 autosomal homolog 2 |
| chr18_-_55586092 | 0.52 |
ENST00000563888.6
ENST00000540999.5 ENST00000627685.2 |
TCF4
|
transcription factor 4 |
| chr1_+_103656018 | 0.51 |
ENST00000422549.1
|
AMY1A
|
amylase alpha 1A |
| chr19_+_44212614 | 0.51 |
ENST00000586048.1
|
ZNF227
|
zinc finger protein 227 |
| chr15_-_55270249 | 0.51 |
ENST00000568803.1
|
RAB27A
|
RAB27A, member RAS oncogene family |
| chr6_-_49636832 | 0.49 |
ENST00000371175.10
ENST00000646272.1 ENST00000646939.1 ENST00000618248.3 ENST00000229810.9 ENST00000646963.1 |
RHAG
|
Rh associated glycoprotein |
| chr1_-_201023694 | 0.49 |
ENST00000332129.6
ENST00000422435.2 ENST00000461742.7 |
KIF21B
|
kinesin family member 21B |
| chr19_+_52369911 | 0.49 |
ENST00000424032.6
ENST00000422689.3 ENST00000600321.5 ENST00000344085.9 ENST00000597976.5 |
ZNF880
|
zinc finger protein 880 |
| chr10_+_22928010 | 0.48 |
ENST00000376528.8
|
ARMC3
|
armadillo repeat containing 3 |
| chr19_-_51028015 | 0.48 |
ENST00000319720.11
|
KLK11
|
kallikrein related peptidase 11 |
| chr12_-_46372763 | 0.48 |
ENST00000256689.10
|
SLC38A2
|
solute carrier family 38 member 2 |
| chr4_-_40630739 | 0.47 |
ENST00000511902.5
ENST00000505220.1 |
RBM47
|
RNA binding motif protein 47 |
| chr7_+_12504399 | 0.47 |
ENST00000443874.1
ENST00000636804.2 |
ENSG00000226690.9
|
novel protein |
| chr4_-_40630826 | 0.47 |
ENST00000505414.5
ENST00000511598.5 |
RBM47
|
RNA binding motif protein 47 |
| chr13_+_45464995 | 0.47 |
ENST00000617493.1
|
COG3
|
component of oligomeric golgi complex 3 |
| chr19_-_51027954 | 0.46 |
ENST00000391804.7
|
KLK11
|
kallikrein related peptidase 11 |
| chr10_+_22928079 | 0.46 |
ENST00000447081.5
|
ARMC3
|
armadillo repeat containing 3 |
| chr20_-_8019744 | 0.46 |
ENST00000246024.7
|
TMX4
|
thioredoxin related transmembrane protein 4 |
| chr19_-_8321354 | 0.45 |
ENST00000301457.3
|
NDUFA7
|
NADH:ubiquinone oxidoreductase subunit A7 |
| chr18_-_55510753 | 0.45 |
ENST00000543082.5
|
TCF4
|
transcription factor 4 |
| chr3_+_155083523 | 0.45 |
ENST00000680057.1
|
MME
|
membrane metalloendopeptidase |
| chrX_+_134796758 | 0.44 |
ENST00000414371.6
|
PABIR3
|
PABIR family member 3 |
| chr15_-_55270874 | 0.44 |
ENST00000567380.5
ENST00000565972.5 ENST00000569493.5 |
RAB27A
|
RAB27A, member RAS oncogene family |
| chr5_-_88883199 | 0.44 |
ENST00000514015.5
ENST00000503075.1 |
MEF2C
|
myocyte enhancer factor 2C |
| chr19_+_15640880 | 0.42 |
ENST00000586182.6
ENST00000221307.13 ENST00000591058.5 |
CYP4F3
|
cytochrome P450 family 4 subfamily F member 3 |
| chr20_+_34241390 | 0.42 |
ENST00000374954.4
|
ASIP
|
agouti signaling protein |
| chr12_+_49265071 | 0.41 |
ENST00000549183.1
ENST00000639419.1 ENST00000301072.11 |
TUBA1C
|
tubulin alpha 1c |
| chr7_+_142492121 | 0.41 |
ENST00000390374.3
|
TRBV7-6
|
T cell receptor beta variable 7-6 |
| chr7_+_48171451 | 0.40 |
ENST00000435803.6
|
ABCA13
|
ATP binding cassette subfamily A member 13 |
| chr19_-_50333504 | 0.40 |
ENST00000474951.1
|
KCNC3
|
potassium voltage-gated channel subfamily C member 3 |
| chr8_-_101975319 | 0.40 |
ENST00000520690.5
|
NCALD
|
neurocalcin delta |
| chr6_+_18387326 | 0.40 |
ENST00000259939.4
|
RNF144B
|
ring finger protein 144B |
| chrX_+_71118702 | 0.40 |
ENST00000429213.2
|
MED12
|
mediator complex subunit 12 |
| chr5_-_88883420 | 0.39 |
ENST00000437473.6
|
MEF2C
|
myocyte enhancer factor 2C |
| chr12_-_55927756 | 0.38 |
ENST00000549939.1
|
PYM1
|
PYM homolog 1, exon junction complex associated factor |
| chr19_+_11346556 | 0.38 |
ENST00000587531.5
|
CCDC159
|
coiled-coil domain containing 159 |
| chr17_-_4739866 | 0.37 |
ENST00000574412.6
ENST00000293778.12 |
CXCL16
|
C-X-C motif chemokine ligand 16 |
| chr9_-_26946983 | 0.37 |
ENST00000523212.1
|
PLAA
|
phospholipase A2 activating protein |
| chr11_+_72814380 | 0.36 |
ENST00000534905.5
ENST00000321297.10 ENST00000540567.1 |
ATG16L2
|
autophagy related 16 like 2 |
| chr4_-_167234266 | 0.36 |
ENST00000511269.5
ENST00000506697.5 ENST00000512042.1 |
SPOCK3
|
SPARC (osteonectin), cwcv and kazal like domains proteoglycan 3 |
| chr12_-_122974558 | 0.36 |
ENST00000543935.1
|
ABCB9
|
ATP binding cassette subfamily B member 9 |
| chr4_-_167234552 | 0.36 |
ENST00000512648.5
|
SPOCK3
|
SPARC (osteonectin), cwcv and kazal like domains proteoglycan 3 |
| chr5_-_88883147 | 0.36 |
ENST00000513252.5
ENST00000506554.5 ENST00000508569.5 ENST00000637732.1 ENST00000504921.7 ENST00000637481.1 ENST00000510942.5 |
MEF2C
|
myocyte enhancer factor 2C |
| chr5_+_55024250 | 0.36 |
ENST00000231009.3
|
GZMK
|
granzyme K |
| chr8_-_63086031 | 0.35 |
ENST00000260116.5
|
TTPA
|
alpha tocopherol transfer protein |
| chr1_+_100133186 | 0.35 |
ENST00000370139.1
|
TRMT13
|
tRNA methyltransferase 13 homolog |
| chr10_-_96513911 | 0.35 |
ENST00000357947.4
|
TLL2
|
tolloid like 2 |
| chr17_+_47941721 | 0.35 |
ENST00000641511.1
|
PNPO
|
pyridoxamine 5'-phosphate oxidase |
| chr9_+_100427254 | 0.34 |
ENST00000374885.5
|
MSANTD3
|
Myb/SANT DNA binding domain containing 3 |
| chr12_+_95218230 | 0.34 |
ENST00000551311.5
ENST00000546445.5 |
VEZT
|
vezatin, adherens junctions transmembrane protein |
| chr22_-_41688799 | 0.34 |
ENST00000469028.2
ENST00000463675.6 ENST00000649479.1 ENST00000469522.1 |
SNU13
|
small nuclear ribonucleoprotein 13 |
| chr1_-_93879130 | 0.34 |
ENST00000528680.1
|
DNTTIP2
|
deoxynucleotidyltransferase terminal interacting protein 2 |
| chr8_+_38901218 | 0.33 |
ENST00000521746.5
ENST00000616927.4 |
PLEKHA2
|
pleckstrin homology domain containing A2 |
| chr14_-_74493275 | 0.33 |
ENST00000541064.5
|
NPC2
|
NPC intracellular cholesterol transporter 2 |
| chr2_-_196068812 | 0.33 |
ENST00000410072.5
ENST00000312428.11 |
DNAH7
|
dynein axonemal heavy chain 7 |
| chr3_+_133573637 | 0.33 |
ENST00000264993.8
|
CDV3
|
CDV3 homolog |
| chr14_+_22096017 | 0.32 |
ENST00000390452.2
|
TRDV1
|
T cell receptor delta variable 1 |
| chr4_-_23881282 | 0.32 |
ENST00000613098.4
|
PPARGC1A
|
PPARG coactivator 1 alpha |
| chr14_-_74493322 | 0.32 |
ENST00000553490.5
ENST00000557510.5 |
NPC2
|
NPC intracellular cholesterol transporter 2 |
| chr7_+_142407663 | 0.32 |
ENST00000390367.3
|
TRBV11-1
|
T cell receptor beta variable 11-1 |
| chr17_+_47941694 | 0.31 |
ENST00000584061.6
|
PNPO
|
pyridoxamine 5'-phosphate oxidase |
| chr4_+_26857678 | 0.31 |
ENST00000494628.6
|
STIM2
|
stromal interaction molecule 2 |
| chr5_-_88883701 | 0.30 |
ENST00000636998.1
|
MEF2C
|
myocyte enhancer factor 2C |
| chr1_+_100038087 | 0.29 |
ENST00000370152.8
|
MFSD14A
|
major facilitator superfamily domain containing 14A |
| chr11_+_63506073 | 0.29 |
ENST00000255684.10
ENST00000394618.9 |
LGALS12
|
galectin 12 |
| chr7_-_22194709 | 0.28 |
ENST00000458533.5
|
RAPGEF5
|
Rap guanine nucleotide exchange factor 5 |
| chr10_+_70093626 | 0.28 |
ENST00000678195.1
|
MACROH2A2
|
macroH2A.2 histone |
| chr5_+_69217798 | 0.28 |
ENST00000512880.5
ENST00000602380.1 |
MRPS36
|
mitochondrial ribosomal protein S36 |
| chr9_+_100427123 | 0.28 |
ENST00000395067.7
|
MSANTD3
|
Myb/SANT DNA binding domain containing 3 |
| chr19_+_39296399 | 0.27 |
ENST00000333625.3
|
IFNL1
|
interferon lambda 1 |
| chr11_+_123590939 | 0.25 |
ENST00000646146.1
|
GRAMD1B
|
GRAM domain containing 1B |
| chr14_-_93955258 | 0.25 |
ENST00000556062.5
|
ASB2
|
ankyrin repeat and SOCS box containing 2 |
| chr15_-_55270280 | 0.25 |
ENST00000564609.5
|
RAB27A
|
RAB27A, member RAS oncogene family |
| chr18_-_55423757 | 0.24 |
ENST00000675707.1
|
TCF4
|
transcription factor 4 |
| chr11_-_66002123 | 0.24 |
ENST00000532707.5
ENST00000526451.5 ENST00000312234.6 ENST00000533544.6 ENST00000530462.5 ENST00000525767.5 ENST00000529964.5 ENST00000527249.5 |
EIF1AD
|
eukaryotic translation initiation factor 1A domain containing |
| chr8_-_143944737 | 0.23 |
ENST00000398774.6
|
PLEC
|
plectin |
| chr10_-_124450027 | 0.23 |
ENST00000451024.5
|
NKX1-2
|
NK1 homeobox 2 |
| chr14_+_21736136 | 0.23 |
ENST00000390426.2
|
TRAV4
|
T cell receptor alpha variable 4 |
| chr3_-_157499538 | 0.23 |
ENST00000392832.6
|
VEPH1
|
ventricular zone expressed PH domain containing 1 |
| chr19_-_35528221 | 0.22 |
ENST00000588674.5
ENST00000452271.7 ENST00000518157.1 |
SBSN
|
suprabasin |
| chr9_-_35812142 | 0.22 |
ENST00000497810.1
ENST00000484764.5 |
SPAG8
|
sperm associated antigen 8 |
| chr11_+_63506046 | 0.22 |
ENST00000674247.1
|
LGALS12
|
galectin 12 |
| chr16_-_67936808 | 0.21 |
ENST00000358514.9
|
PSMB10
|
proteasome 20S subunit beta 10 |
| chr11_-_119381629 | 0.21 |
ENST00000260187.7
ENST00000455332.6 |
USP2
|
ubiquitin specific peptidase 2 |
| chr8_+_117520832 | 0.21 |
ENST00000522839.1
|
MED30
|
mediator complex subunit 30 |
| chr8_-_30812867 | 0.21 |
ENST00000518243.5
|
PPP2CB
|
protein phosphatase 2 catalytic subunit beta |
| chr7_-_75486286 | 0.21 |
ENST00000615331.5
|
POM121C
|
POM121 transmembrane nucleoporin C |
| chr6_-_33192454 | 0.20 |
ENST00000395194.1
ENST00000341947.7 ENST00000374708.8 |
COL11A2
|
collagen type XI alpha 2 chain |
| chr4_-_95549199 | 0.20 |
ENST00000504962.1
ENST00000506749.5 |
UNC5C
|
unc-5 netrin receptor C |
| chr17_+_38752731 | 0.20 |
ENST00000619426.5
ENST00000610434.4 |
PSMB3
|
proteasome 20S subunit beta 3 |
| chr2_-_105396750 | 0.20 |
ENST00000447958.1
|
FHL2
|
four and a half LIM domains 2 |
| chr11_+_24496988 | 0.19 |
ENST00000336930.11
|
LUZP2
|
leucine zipper protein 2 |
| chr6_-_129861278 | 0.19 |
ENST00000368143.6
|
TMEM244
|
transmembrane protein 244 |
| chrX_-_24672654 | 0.19 |
ENST00000379145.5
|
PCYT1B
|
phosphate cytidylyltransferase 1, choline, beta |
| chr1_+_150257247 | 0.19 |
ENST00000647854.1
|
CA14
|
carbonic anhydrase 14 |
| chr3_+_35641421 | 0.19 |
ENST00000449196.5
|
ARPP21
|
cAMP regulated phosphoprotein 21 |
| chr13_+_23570370 | 0.18 |
ENST00000403372.6
ENST00000248484.9 |
TNFRSF19
|
TNF receptor superfamily member 19 |
| chr1_+_34755039 | 0.18 |
ENST00000338513.1
|
GJB5
|
gap junction protein beta 5 |
| chr10_+_27504328 | 0.18 |
ENST00000375802.7
|
RAB18
|
RAB18, member RAS oncogene family |
| chr6_-_11232658 | 0.18 |
ENST00000379433.5
ENST00000379446.10 ENST00000620854.4 |
NEDD9
|
neural precursor cell expressed, developmentally down-regulated 9 |
| chr19_-_11578136 | 0.17 |
ENST00000589792.5
|
ACP5
|
acid phosphatase 5, tartrate resistant |
| chr4_-_167234579 | 0.17 |
ENST00000502330.5
ENST00000357154.7 ENST00000421836.6 |
SPOCK3
|
SPARC (osteonectin), cwcv and kazal like domains proteoglycan 3 |
| chr10_+_63133247 | 0.17 |
ENST00000435510.6
|
NRBF2
|
nuclear receptor binding factor 2 |
| chr14_+_22496887 | 0.17 |
ENST00000390495.1
|
TRAJ42
|
T cell receptor alpha joining 42 |
| chr11_-_60183957 | 0.17 |
ENST00000533409.1
|
MS4A6A
|
membrane spanning 4-domains A6A |
| chr19_+_13116839 | 0.17 |
ENST00000586171.2
|
NACC1
|
nucleus accumbens associated 1 |
| chr18_-_49460630 | 0.16 |
ENST00000675505.1
ENST00000442713.6 ENST00000269445.10 |
DYM
|
dymeclin |
| chr1_+_11273188 | 0.16 |
ENST00000376810.6
|
UBIAD1
|
UbiA prenyltransferase domain containing 1 |
| chr7_-_151205496 | 0.16 |
ENST00000615129.4
|
IQCA1L
|
IQ motif containing with AAA domain 1 like |
| chr2_+_127648080 | 0.16 |
ENST00000423019.1
|
GPR17
|
G protein-coupled receptor 17 |
| chr6_+_2988606 | 0.16 |
ENST00000380472.7
ENST00000605901.1 ENST00000454015.1 |
NQO2
LINC01011
|
N-ribosyldihydronicotinamide:quinone reductase 2 long intergenic non-protein coding RNA 1011 |
| chr5_-_38557459 | 0.16 |
ENST00000511561.1
|
LIFR
|
LIF receptor subunit alpha |
| chr13_+_42138042 | 0.15 |
ENST00000628433.2
ENST00000536612.3 |
DGKH
|
diacylglycerol kinase eta |
| chr20_-_46364385 | 0.15 |
ENST00000243896.6
ENST00000543605.5 ENST00000372230.10 ENST00000317734.12 |
SLC35C2
|
solute carrier family 35 member C2 |
| chr1_+_148952341 | 0.15 |
ENST00000529945.2
|
PDE4DIP
|
phosphodiesterase 4D interacting protein |
| chr17_-_41521719 | 0.15 |
ENST00000393976.6
|
KRT15
|
keratin 15 |
| chr1_+_11779817 | 0.15 |
ENST00000449278.1
|
C1orf167
|
chromosome 1 open reading frame 167 |
| chr14_+_96482982 | 0.15 |
ENST00000554706.1
|
AK7
|
adenylate kinase 7 |
| chr15_+_81182579 | 0.15 |
ENST00000302987.9
|
IL16
|
interleukin 16 |
| chr4_+_183905266 | 0.15 |
ENST00000308497.9
|
STOX2
|
storkhead box 2 |
| chr19_+_57746799 | 0.15 |
ENST00000317178.10
ENST00000431353.1 |
ZNF776
|
zinc finger protein 776 |
| chr1_-_152806628 | 0.15 |
ENST00000606576.1
ENST00000607093.2 |
LCE1C
|
late cornified envelope 1C |
| chr4_-_139556756 | 0.14 |
ENST00000404104.7
|
SETD7
|
SET domain containing 7, histone lysine methyltransferase |
| chr14_-_22469673 | 0.14 |
ENST00000535880.2
|
TRDV3
|
T cell receptor delta variable 3 |
| chr11_+_124012997 | 0.14 |
ENST00000641521.1
ENST00000641722.1 |
OR10G4
|
olfactory receptor family 10 subfamily G member 4 |
| chrX_+_71118576 | 0.14 |
ENST00000374080.8
|
MED12
|
mediator complex subunit 12 |
| chr12_-_11062294 | 0.14 |
ENST00000533467.1
|
TAS2R46
|
taste 2 receptor member 46 |
| chr11_+_74592567 | 0.14 |
ENST00000263681.7
ENST00000527458.5 ENST00000532497.5 ENST00000530511.5 |
POLD3
|
DNA polymerase delta 3, accessory subunit |
| chr17_+_75261864 | 0.13 |
ENST00000245539.11
ENST00000579002.5 |
MRPS7
|
mitochondrial ribosomal protein S7 |
| chr20_-_63463843 | 0.13 |
ENST00000637193.1
|
KCNQ2
|
potassium voltage-gated channel subfamily Q member 2 |
| chrX_+_71118675 | 0.13 |
ENST00000374102.5
|
MED12
|
mediator complex subunit 12 |
| chr8_+_103880412 | 0.13 |
ENST00000436393.6
|
RIMS2
|
regulating synaptic membrane exocytosis 2 |
| chr7_-_90321308 | 0.12 |
ENST00000637645.1
|
FAM237B
|
family with sequence similarity 237 member B |
| chr7_+_90383672 | 0.12 |
ENST00000416322.5
|
CLDN12
|
claudin 12 |
| chrX_-_30577759 | 0.12 |
ENST00000378962.4
|
TASL
|
TLR adaptor interacting with endolysosomal SLC15A4 |
| chr1_+_11778931 | 0.11 |
ENST00000444493.5
|
C1orf167
|
chromosome 1 open reading frame 167 |
| chr3_-_114624193 | 0.11 |
ENST00000481632.5
|
ZBTB20
|
zinc finger and BTB domain containing 20 |
| chrX_+_71118515 | 0.11 |
ENST00000333646.10
|
MED12
|
mediator complex subunit 12 |
| chr19_+_44002931 | 0.11 |
ENST00000429154.7
ENST00000585632.5 |
ZNF230
|
zinc finger protein 230 |
| chr20_+_11892493 | 0.11 |
ENST00000422390.5
ENST00000618918.4 |
BTBD3
|
BTB domain containing 3 |
| chr6_+_2987965 | 0.11 |
ENST00000450238.5
ENST00000445000.2 ENST00000426637.5 |
LINC01011
NQO2
|
long intergenic non-protein coding RNA 1011 N-ribosyldihydronicotinamide:quinone reductase 2 |
| chr5_+_69217721 | 0.10 |
ENST00000256441.5
|
MRPS36
|
mitochondrial ribosomal protein S36 |
| chr8_-_30812773 | 0.10 |
ENST00000221138.9
|
PPP2CB
|
protein phosphatase 2 catalytic subunit beta |
| chr14_+_94619313 | 0.10 |
ENST00000621603.1
|
SERPINA3
|
serpin family A member 3 |
| chr10_+_55599041 | 0.10 |
ENST00000512524.4
|
MTRNR2L5
|
MT-RNR2 like 5 |
| chr17_-_29078857 | 0.10 |
ENST00000359450.6
|
TIAF1
|
TGFB1-induced anti-apoptotic factor 1 |
| chr8_-_140718345 | 0.10 |
ENST00000521562.5
|
PTK2
|
protein tyrosine kinase 2 |
| chr3_-_52770856 | 0.10 |
ENST00000461689.5
ENST00000535191.5 ENST00000383721.8 ENST00000233027.10 |
NEK4
|
NIMA related kinase 4 |
| chr6_+_69867416 | 0.09 |
ENST00000478620.2
|
COL19A1
|
collagen type XIX alpha 1 chain |
| chr5_-_157345559 | 0.09 |
ENST00000520782.1
|
FNDC9
|
fibronectin type III domain containing 9 |
| chr11_-_101129706 | 0.09 |
ENST00000534013.5
|
PGR
|
progesterone receptor |
| chr1_-_46551215 | 0.09 |
ENST00000396314.3
|
KNCN
|
kinocilin |
| chr20_+_62302093 | 0.09 |
ENST00000491935.5
|
ADRM1
|
adhesion regulating molecule 1 |
| chr21_-_30881572 | 0.09 |
ENST00000332378.6
|
KRTAP11-1
|
keratin associated protein 11-1 |
| chr9_-_4666347 | 0.08 |
ENST00000381890.9
ENST00000682582.1 |
SPATA6L
|
spermatogenesis associated 6 like |
| chr1_+_159015665 | 0.08 |
ENST00000567661.5
ENST00000474473.1 |
IFI16
|
interferon gamma inducible protein 16 |
| chr11_+_63506339 | 0.08 |
ENST00000340246.10
|
LGALS12
|
galectin 12 |
| chr4_-_10116724 | 0.08 |
ENST00000502702.5
|
WDR1
|
WD repeat domain 1 |
| chr20_-_25339731 | 0.08 |
ENST00000450393.5
ENST00000491682.5 |
ABHD12
|
abhydrolase domain containing 12, lysophospholipase |
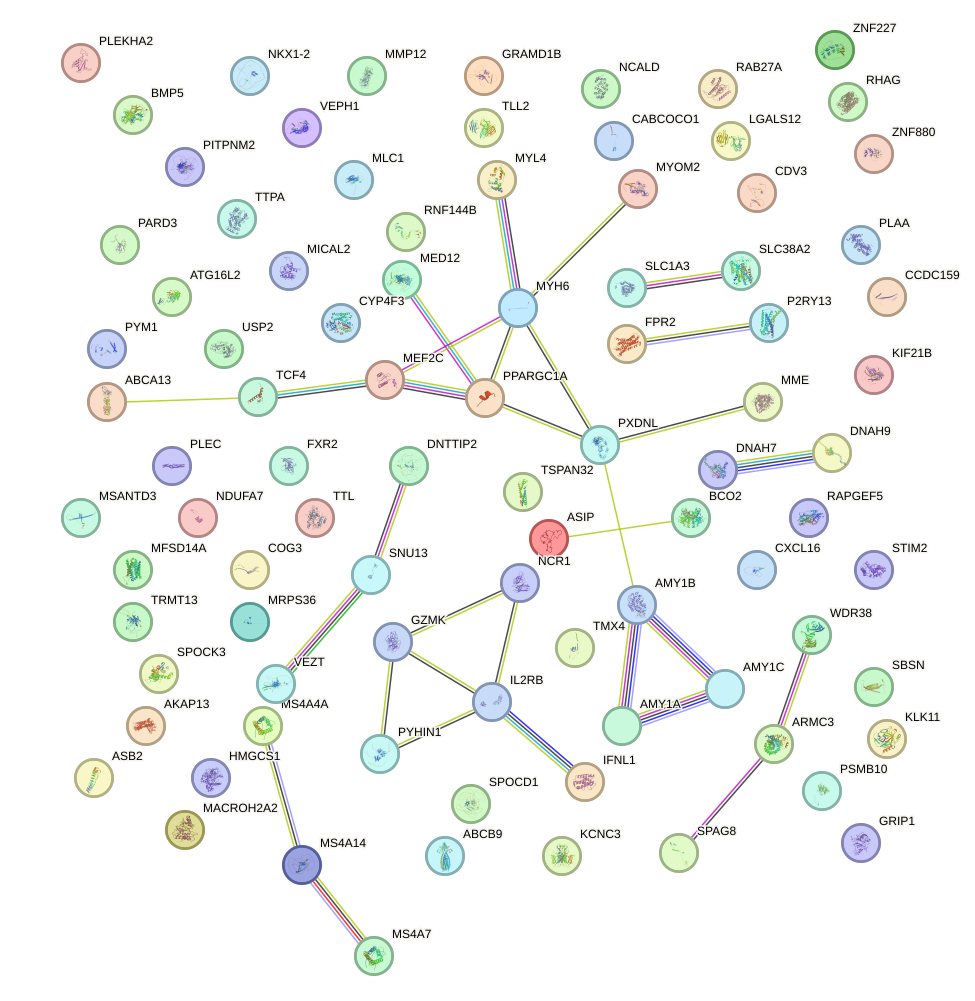
Network of associatons between targets according to the STRING database.
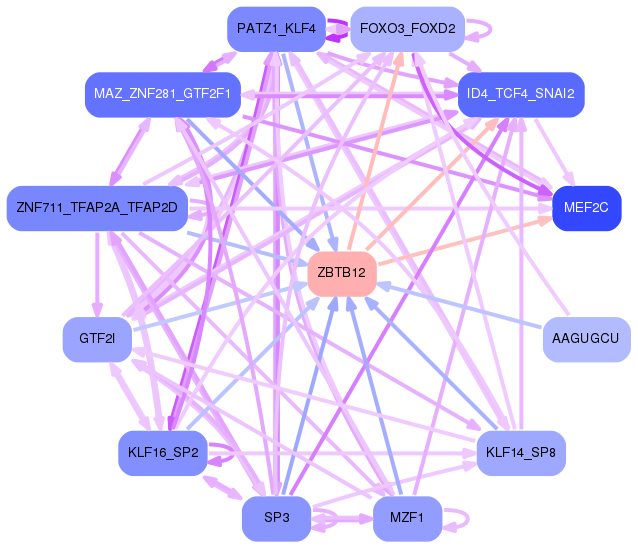
First level regulatory network of ZBTB12
Gene Ontology Analysis
Gene overrepresentation in biological process category:
| Log-likelihood per target | Total log-likelihood | Term | Description |
|---|---|---|---|
| 0.5 | 1.5 | GO:0046247 | tetraterpenoid metabolic process(GO:0016108) carotenoid metabolic process(GO:0016116) carotene catabolic process(GO:0016121) xanthophyll metabolic process(GO:0016122) terpene catabolic process(GO:0046247) |
| 0.4 | 1.2 | GO:0019417 | sulfur oxidation(GO:0019417) |
| 0.4 | 3.1 | GO:0002074 | extraocular skeletal muscle development(GO:0002074) |
| 0.2 | 0.7 | GO:0071676 | negative regulation of mononuclear cell migration(GO:0071676) |
| 0.2 | 1.7 | GO:0003228 | atrial cardiac muscle tissue development(GO:0003228) atrial cardiac muscle tissue morphogenesis(GO:0055009) |
| 0.2 | 0.6 | GO:0001544 | initiation of primordial ovarian follicle growth(GO:0001544) |
| 0.2 | 1.3 | GO:1903435 | positive regulation of constitutive secretory pathway(GO:1903435) |
| 0.2 | 0.5 | GO:0035378 | carbon dioxide transmembrane transport(GO:0035378) |
| 0.2 | 2.6 | GO:0002430 | complement receptor mediated signaling pathway(GO:0002430) |
| 0.1 | 0.4 | GO:1903259 | exon-exon junction complex disassembly(GO:1903259) |
| 0.1 | 1.5 | GO:0003172 | primary heart field specification(GO:0003138) sinoatrial valve development(GO:0003172) sinoatrial valve morphogenesis(GO:0003185) |
| 0.1 | 0.7 | GO:0019747 | regulation of isoprenoid metabolic process(GO:0019747) |
| 0.1 | 0.3 | GO:0042360 | vitamin E metabolic process(GO:0042360) |
| 0.1 | 0.7 | GO:0042819 | pyridoxine metabolic process(GO:0008614) pyridoxine biosynthetic process(GO:0008615) vitamin B6 biosynthetic process(GO:0042819) |
| 0.1 | 0.8 | GO:0030886 | negative regulation of myeloid dendritic cell activation(GO:0030886) |
| 0.1 | 0.3 | GO:2000184 | cellular response to nitrite(GO:0071250) response to nitrite(GO:0080033) glomerular visceral epithelial cell apoptotic process(GO:1903210) regulation of glomerular visceral epithelial cell apoptotic process(GO:1904633) positive regulation of glomerular visceral epithelial cell apoptotic process(GO:1904635) response to resveratrol(GO:1904638) cellular response to resveratrol(GO:1904639) positive regulation of progesterone biosynthetic process(GO:2000184) |
| 0.1 | 3.5 | GO:0006833 | water transport(GO:0006833) |
| 0.1 | 1.9 | GO:0071397 | cellular response to cholesterol(GO:0071397) |
| 0.1 | 0.8 | GO:1900169 | regulation of glucocorticoid mediated signaling pathway(GO:1900169) |
| 0.1 | 0.8 | GO:0090245 | axis elongation involved in somitogenesis(GO:0090245) |
| 0.1 | 0.8 | GO:0038110 | interleukin-2-mediated signaling pathway(GO:0038110) |
| 0.1 | 0.9 | GO:0016554 | cytidine to uridine editing(GO:0016554) |
| 0.1 | 0.4 | GO:1901569 | leukotriene catabolic process(GO:0036100) leukotriene B4 catabolic process(GO:0036101) leukotriene B4 metabolic process(GO:0036102) icosanoid catabolic process(GO:1901523) fatty acid derivative catabolic process(GO:1901569) |
| 0.1 | 0.4 | GO:0039689 | negative stranded viral RNA replication(GO:0039689) multi-organism biosynthetic process(GO:0044034) |
| 0.1 | 0.4 | GO:0040030 | regulation of molecular function, epigenetic(GO:0040030) |
| 0.1 | 0.3 | GO:0048631 | regulation of skeletal muscle tissue growth(GO:0048631) |
| 0.1 | 0.9 | GO:1901898 | negative regulation of relaxation of cardiac muscle(GO:1901898) |
| 0.1 | 0.6 | GO:0006537 | glutamate biosynthetic process(GO:0006537) |
| 0.0 | 0.2 | GO:0060708 | spongiotrophoblast differentiation(GO:0060708) |
| 0.0 | 1.1 | GO:0035589 | G-protein coupled purinergic nucleotide receptor signaling pathway(GO:0035589) |
| 0.0 | 0.9 | GO:0019800 | peptide cross-linking via chondroitin 4-sulfate glycosaminoglycan(GO:0019800) |
| 0.0 | 0.4 | GO:0035672 | oligopeptide transmembrane transport(GO:0035672) |
| 0.0 | 0.7 | GO:0044341 | sodium-dependent phosphate transport(GO:0044341) |
| 0.0 | 0.4 | GO:0071492 | cellular response to UV-A(GO:0071492) |
| 0.0 | 0.5 | GO:0032328 | alanine transport(GO:0032328) |
| 0.0 | 0.2 | GO:0009233 | menaquinone metabolic process(GO:0009233) |
| 0.0 | 0.2 | GO:0048861 | leukemia inhibitory factor signaling pathway(GO:0048861) |
| 0.0 | 0.3 | GO:1901341 | activation of store-operated calcium channel activity(GO:0032237) positive regulation of store-operated calcium channel activity(GO:1901341) |
| 0.0 | 0.2 | GO:0060023 | soft palate development(GO:0060023) |
| 0.0 | 0.1 | GO:0060748 | tertiary branching involved in mammary gland duct morphogenesis(GO:0060748) |
| 0.0 | 0.3 | GO:0032696 | negative regulation of interleukin-13 production(GO:0032696) |
| 0.0 | 0.4 | GO:0000492 | box C/D snoRNP assembly(GO:0000492) |
| 0.0 | 1.2 | GO:0042269 | regulation of natural killer cell mediated cytotoxicity(GO:0042269) |
| 0.0 | 0.8 | GO:0042744 | hydrogen peroxide catabolic process(GO:0042744) |
| 0.0 | 0.1 | GO:0016334 | morphogenesis of follicular epithelium(GO:0016333) establishment or maintenance of polarity of follicular epithelium(GO:0016334) establishment of planar polarity of follicular epithelium(GO:0042247) |
| 0.0 | 0.2 | GO:0032929 | negative regulation of superoxide anion generation(GO:0032929) |
| 0.0 | 0.1 | GO:0046462 | monoacylglycerol metabolic process(GO:0046462) monoacylglycerol catabolic process(GO:0052651) |
| 0.0 | 0.1 | GO:0055014 | atrial cardiac muscle cell differentiation(GO:0055011) atrial cardiac muscle cell development(GO:0055014) |
| 0.0 | 0.2 | GO:0006657 | CDP-choline pathway(GO:0006657) |
| 0.0 | 0.3 | GO:0036159 | inner dynein arm assembly(GO:0036159) |
| 0.0 | 0.1 | GO:0072734 | response to staurosporine(GO:0072733) cellular response to staurosporine(GO:0072734) |
| 0.0 | 0.0 | GO:0050717 | positive regulation of interleukin-1 alpha secretion(GO:0050717) |
| 0.0 | 0.4 | GO:0010818 | T cell chemotaxis(GO:0010818) |
| 0.0 | 0.4 | GO:0010992 | ubiquitin homeostasis(GO:0010992) |
| 0.0 | 0.2 | GO:0002862 | negative regulation of inflammatory response to antigenic stimulus(GO:0002862) |
| 0.0 | 0.1 | GO:0098814 | spontaneous neurotransmitter secretion(GO:0061669) spontaneous synaptic transmission(GO:0098814) |
| 0.0 | 0.8 | GO:0003341 | cilium movement(GO:0003341) |
| 0.0 | 0.2 | GO:0015781 | pyrimidine nucleotide-sugar transport(GO:0015781) |
| 0.0 | 0.2 | GO:0045475 | locomotor rhythm(GO:0045475) |
| 0.0 | 1.2 | GO:0045454 | cell redox homeostasis(GO:0045454) |
Gene overrepresentation in cellular component category:
| Log-likelihood per target | Total log-likelihood | Term | Description |
|---|---|---|---|
| 0.1 | 4.7 | GO:0032982 | myosin filament(GO:0032982) |
| 0.1 | 0.3 | GO:1990844 | subsarcolemmal mitochondrion(GO:1990843) interfibrillar mitochondrion(GO:1990844) |
| 0.1 | 0.3 | GO:0032002 | interleukin-28 receptor complex(GO:0032002) |
| 0.1 | 0.4 | GO:0001651 | dense fibrillar component(GO:0001651) |
| 0.1 | 0.2 | GO:0005592 | collagen type XI trimer(GO:0005592) |
| 0.1 | 0.3 | GO:0036156 | inner dynein arm(GO:0036156) |
| 0.1 | 1.3 | GO:0033093 | Weibel-Palade body(GO:0033093) |
| 0.0 | 0.4 | GO:0005947 | mitochondrial alpha-ketoglutarate dehydrogenase complex(GO:0005947) |
| 0.0 | 0.9 | GO:0000930 | gamma-tubulin complex(GO:0000930) |
| 0.0 | 0.4 | GO:0019774 | proteasome core complex, beta-subunit complex(GO:0019774) |
| 0.0 | 1.2 | GO:0016514 | SWI/SNF complex(GO:0016514) |
| 0.0 | 0.5 | GO:0017119 | Golgi transport complex(GO:0017119) |
| 0.0 | 0.1 | GO:0043625 | delta DNA polymerase complex(GO:0043625) |
| 0.0 | 2.6 | GO:0101003 | ficolin-1-rich granule membrane(GO:0101003) |
| 0.0 | 0.2 | GO:0035032 | phosphatidylinositol 3-kinase complex, class III(GO:0035032) |
| 0.0 | 0.4 | GO:0030130 | clathrin coat of trans-Golgi network vesicle(GO:0030130) |
| 0.0 | 0.1 | GO:0042643 | actomyosin, actin portion(GO:0042643) |
| 0.0 | 0.4 | GO:0032591 | dendritic spine membrane(GO:0032591) |
| 0.0 | 0.8 | GO:0008305 | integrin complex(GO:0008305) |
| 0.0 | 0.1 | GO:0032437 | cuticular plate(GO:0032437) |
| 0.0 | 0.8 | GO:0016592 | mediator complex(GO:0016592) |
| 0.0 | 0.8 | GO:0030286 | dynein complex(GO:0030286) |
| 0.0 | 0.4 | GO:0035145 | exon-exon junction complex(GO:0035145) |
Gene overrepresentation in molecular function category:
| Log-likelihood per target | Total log-likelihood | Term | Description |
|---|---|---|---|
| 0.5 | 0.5 | GO:0035379 | carbon dioxide transmembrane transporter activity(GO:0035379) |
| 0.4 | 1.2 | GO:0004421 | hydroxymethylglutaryl-CoA synthase activity(GO:0004421) |
| 0.4 | 2.6 | GO:0004982 | N-formyl peptide receptor activity(GO:0004982) |
| 0.2 | 1.7 | GO:0017018 | myosin phosphatase activity(GO:0017018) |
| 0.2 | 3.5 | GO:0015250 | water channel activity(GO:0015250) |
| 0.2 | 0.7 | GO:0004733 | pyridoxamine-phosphate oxidase activity(GO:0004733) |
| 0.2 | 0.8 | GO:0004911 | interleukin-2 receptor activity(GO:0004911) interleukin-2 binding(GO:0019976) |
| 0.1 | 0.6 | GO:0030395 | lactose binding(GO:0030395) |
| 0.1 | 0.4 | GO:0097259 | tocopherol omega-hydroxylase activity(GO:0052870) alpha-tocopherol omega-hydroxylase activity(GO:0052871) 20-hydroxy-leukotriene B4 omega oxidase activity(GO:0097258) 20-aldehyde-leukotriene B4 20-monooxygenase activity(GO:0097259) |
| 0.1 | 0.4 | GO:0016005 | phospholipase A2 activator activity(GO:0016005) |
| 0.1 | 0.4 | GO:0034512 | box C/D snoRNA binding(GO:0034512) |
| 0.1 | 0.5 | GO:0004556 | alpha-amylase activity(GO:0004556) |
| 0.1 | 3.1 | GO:0097493 | structural molecule activity conferring elasticity(GO:0097493) |
| 0.1 | 0.3 | GO:0008431 | vitamin E binding(GO:0008431) |
| 0.1 | 0.7 | GO:0015319 | sodium:inorganic phosphate symporter activity(GO:0015319) |
| 0.1 | 1.5 | GO:0003680 | AT DNA binding(GO:0003680) |
| 0.1 | 0.3 | GO:1904408 | dihydronicotinamide riboside quinone reductase activity(GO:0001512) melatonin binding(GO:1904408) |
| 0.1 | 0.4 | GO:0031781 | melanocortin receptor binding(GO:0031779) type 3 melanocortin receptor binding(GO:0031781) type 4 melanocortin receptor binding(GO:0031782) |
| 0.1 | 0.4 | GO:0035673 | oligopeptide transmembrane transporter activity(GO:0035673) |
| 0.0 | 0.7 | GO:0070700 | BMP receptor binding(GO:0070700) |
| 0.0 | 0.8 | GO:0005078 | MAP-kinase scaffold activity(GO:0005078) |
| 0.0 | 0.6 | GO:0015501 | glutamate:sodium symporter activity(GO:0015501) |
| 0.0 | 1.1 | GO:0001608 | G-protein coupled nucleotide receptor activity(GO:0001608) G-protein coupled purinergic nucleotide receptor activity(GO:0045028) |
| 0.0 | 1.2 | GO:0071949 | FAD binding(GO:0071949) |
| 0.0 | 0.2 | GO:0004923 | leukemia inhibitory factor receptor activity(GO:0004923) |
| 0.0 | 1.2 | GO:0001011 | transcription factor activity, sequence-specific DNA binding, RNA polymerase recruiting(GO:0001011) transcription factor activity, TFIIB-class binding(GO:0001087) |
| 0.0 | 1.2 | GO:0016864 | protein disulfide isomerase activity(GO:0003756) intramolecular oxidoreductase activity, transposing S-S bonds(GO:0016864) |
| 0.0 | 1.3 | GO:0031489 | myosin V binding(GO:0031489) |
| 0.0 | 0.2 | GO:0004105 | choline-phosphate cytidylyltransferase activity(GO:0004105) |
| 0.0 | 0.5 | GO:0008526 | phosphatidylinositol transporter activity(GO:0008526) |
| 0.0 | 1.5 | GO:0016702 | oxidoreductase activity, acting on single donors with incorporation of molecular oxygen, incorporation of two atoms of oxygen(GO:0016702) |
| 0.0 | 0.8 | GO:0042809 | vitamin D receptor binding(GO:0042809) |
| 0.0 | 1.1 | GO:0045503 | dynein light chain binding(GO:0045503) |
| 0.0 | 0.3 | GO:0015279 | store-operated calcium channel activity(GO:0015279) |
| 0.0 | 0.2 | GO:0004127 | cytidylate kinase activity(GO:0004127) |
| 0.0 | 0.3 | GO:0042975 | peroxisome proliferator activated receptor binding(GO:0042975) |
| 0.0 | 0.9 | GO:0004115 | 3',5'-cyclic-AMP phosphodiesterase activity(GO:0004115) |
| 0.0 | 0.1 | GO:0008332 | low voltage-gated calcium channel activity(GO:0008332) |
| 0.0 | 0.3 | GO:0017034 | Rap guanyl-nucleotide exchange factor activity(GO:0017034) |
| 0.0 | 0.4 | GO:0070003 | threonine-type endopeptidase activity(GO:0004298) threonine-type peptidase activity(GO:0070003) |
| 0.0 | 0.2 | GO:0030020 | extracellular matrix structural constituent conferring tensile strength(GO:0030020) |
| 0.0 | 0.8 | GO:0004601 | peroxidase activity(GO:0004601) |
Gene overrepresentation in curated gene sets: canonical pathways category:
| Log-likelihood per target | Total log-likelihood | Term | Description |
|---|---|---|---|
| 0.0 | 2.6 | PID UPA UPAR PATHWAY | Urokinase-type plasminogen activator (uPA) and uPAR-mediated signaling |
| 0.0 | 1.0 | PID HDAC CLASSIII PATHWAY | Signaling events mediated by HDAC Class III |
| 0.0 | 1.4 | PID MAPK TRK PATHWAY | Trk receptor signaling mediated by the MAPK pathway |
| 0.0 | 0.9 | NABA PROTEOGLYCANS | Genes encoding proteoglycans |
| 0.0 | 1.2 | PID HNF3B PATHWAY | FOXA2 and FOXA3 transcription factor networks |
Gene overrepresentation in curated gene sets: REACTOME pathways category:
| Log-likelihood per target | Total log-likelihood | Term | Description |
|---|---|---|---|
| 0.2 | 3.8 | REACTOME PASSIVE TRANSPORT BY AQUAPORINS | Genes involved in Passive Transport by Aquaporins |
| 0.1 | 1.2 | REACTOME P2Y RECEPTORS | Genes involved in P2Y receptors |
| 0.0 | 1.3 | REACTOME INSULIN SYNTHESIS AND PROCESSING | Genes involved in Insulin Synthesis and Processing |
| 0.0 | 0.5 | REACTOME DIGESTION OF DIETARY CARBOHYDRATE | Genes involved in Digestion of dietary carbohydrate |
| 0.0 | 1.7 | REACTOME ERK MAPK TARGETS | Genes involved in ERK/MAPK targets |
| 0.0 | 1.2 | REACTOME CHOLESTEROL BIOSYNTHESIS | Genes involved in Cholesterol biosynthesis |
| 0.0 | 1.7 | REACTOME STRIATED MUSCLE CONTRACTION | Genes involved in Striated Muscle Contraction |
| 0.0 | 1.2 | REACTOME MYOGENESIS | Genes involved in Myogenesis |
| 0.0 | 0.9 | REACTOME DARPP 32 EVENTS | Genes involved in DARPP-32 events |
| 0.0 | 0.4 | REACTOME IONOTROPIC ACTIVITY OF KAINATE RECEPTORS | Genes involved in Ionotropic activity of Kainate Receptors |
| 0.0 | 0.0 | REACTOME RORA ACTIVATES CIRCADIAN EXPRESSION | Genes involved in RORA Activates Circadian Expression |
| 0.0 | 0.6 | REACTOME SIGNALING BY NODAL | Genes involved in Signaling by NODAL |
| 0.0 | 0.5 | REACTOME GLUTAMATE NEUROTRANSMITTER RELEASE CYCLE | Genes involved in Glutamate Neurotransmitter Release Cycle |
| 0.0 | 0.8 | REACTOME IL RECEPTOR SHC SIGNALING | Genes involved in Interleukin receptor SHC signaling |
| 0.0 | 0.4 | REACTOME POST CHAPERONIN TUBULIN FOLDING PATHWAY | Genes involved in Post-chaperonin tubulin folding pathway |