Project
Illumina Body Map 2 (GSE30611)
Navigation
Downloads
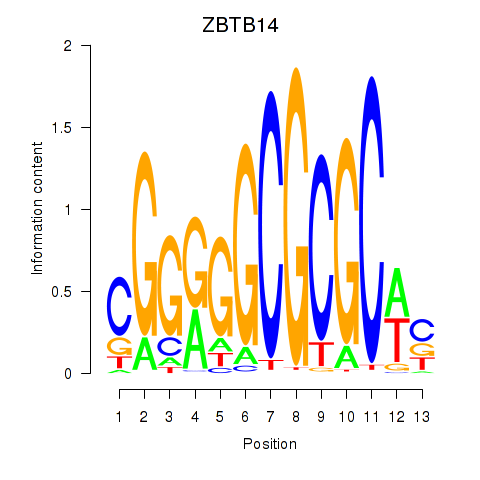
Results for ZBTB14
Z-value: 1.40
Motif logo
Transcription factors associated with ZBTB14
| Gene Symbol | Gene ID | Gene Info |
|---|---|---|
|
ZBTB14
|
ENSG00000198081.11 | zinc finger and BTB domain containing 14 |
Activity-expression correlation:
| Gene | Promoter | Pearson corr. coef. | P-value | Plot |
|---|---|---|---|---|
| ZBTB14 | hg38_v1_chr18_-_5296139_5296195 | 0.16 | 3.8e-01 | Click! |
Activity profile of ZBTB14 motif
Sorted Z-values of ZBTB14 motif
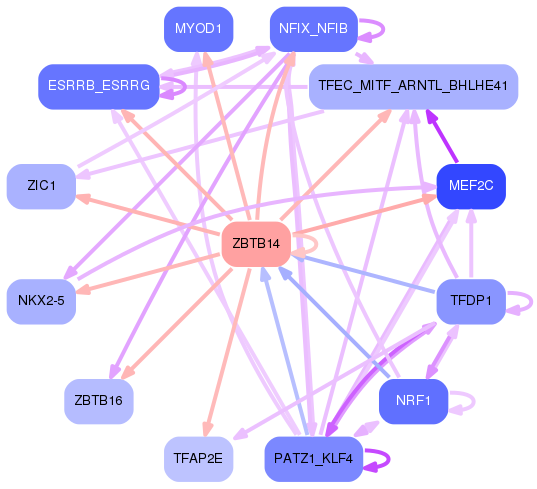
Network of associatons between targets according to the STRING database.

First level regulatory network of ZBTB14
Gene Ontology Analysis
Gene overrepresentation in biological process category:
| Log-likelihood per target | Total log-likelihood | Term | Description |
|---|---|---|---|
| 1.2 | 3.5 | GO:0008355 | olfactory learning(GO:0008355) cellular alkene metabolic process(GO:0043449) |
| 1.0 | 3.0 | GO:0050760 | negative regulation of thymidylate synthase biosynthetic process(GO:0050760) |
| 0.9 | 8.5 | GO:0016560 | protein import into peroxisome matrix, docking(GO:0016560) |
| 0.8 | 5.6 | GO:0090258 | negative regulation of mitochondrial fission(GO:0090258) |
| 0.8 | 3.8 | GO:1905205 | positive regulation of connective tissue replacement(GO:1905205) |
| 0.7 | 2.2 | GO:2000296 | negative regulation of hydrogen peroxide catabolic process(GO:2000296) regulation of oxygen metabolic process(GO:2000374) |
| 0.7 | 4.4 | GO:0044805 | late nucleophagy(GO:0044805) |
| 0.7 | 19.0 | GO:0051823 | regulation of synapse structural plasticity(GO:0051823) |
| 0.7 | 2.0 | GO:0060927 | Purkinje myocyte differentiation(GO:0003168) cardiac pacemaker cell fate commitment(GO:0060927) atrioventricular node cell fate commitment(GO:0060929) |
| 0.5 | 1.5 | GO:0015734 | taurine transport(GO:0015734) |
| 0.5 | 1.8 | GO:0033693 | neurofilament bundle assembly(GO:0033693) |
| 0.4 | 1.3 | GO:1990927 | calcium ion regulated lysosome exocytosis(GO:1990927) |
| 0.4 | 4.8 | GO:0003138 | primary heart field specification(GO:0003138) sinoatrial valve development(GO:0003172) sinoatrial valve morphogenesis(GO:0003185) |
| 0.4 | 1.3 | GO:0043490 | malate-aspartate shuttle(GO:0043490) |
| 0.4 | 3.3 | GO:0048170 | positive regulation of long-term neuronal synaptic plasticity(GO:0048170) |
| 0.4 | 2.5 | GO:1903566 | positive regulation of protein localization to cilium(GO:1903566) |
| 0.4 | 1.6 | GO:0098971 | anterograde dendritic transport of neurotransmitter receptor complex(GO:0098971) |
| 0.4 | 2.3 | GO:0051138 | positive regulation of NK T cell differentiation(GO:0051138) |
| 0.4 | 1.1 | GO:0072720 | response to dithiothreitol(GO:0072720) |
| 0.4 | 2.9 | GO:0019236 | response to pheromone(GO:0019236) |
| 0.4 | 1.4 | GO:0051228 | mitotic spindle disassembly(GO:0051228) spindle disassembly(GO:0051230) |
| 0.4 | 2.2 | GO:1904209 | regulation of chemokine (C-C motif) ligand 2 secretion(GO:1904207) positive regulation of chemokine (C-C motif) ligand 2 secretion(GO:1904209) |
| 0.4 | 1.1 | GO:0001928 | regulation of exocyst assembly(GO:0001928) regulation of exocyst localization(GO:0060178) |
| 0.3 | 4.2 | GO:0070120 | ciliary neurotrophic factor-mediated signaling pathway(GO:0070120) |
| 0.3 | 1.0 | GO:0031445 | regulation of heterochromatin assembly(GO:0031445) positive regulation of heterochromatin assembly(GO:0031453) |
| 0.3 | 1.4 | GO:0060024 | rhythmic synaptic transmission(GO:0060024) |
| 0.3 | 2.3 | GO:1905123 | regulation of glucosylceramidase activity(GO:1905123) |
| 0.3 | 1.3 | GO:0015910 | peroxisomal long-chain fatty acid import(GO:0015910) |
| 0.3 | 1.3 | GO:0040040 | thermosensory behavior(GO:0040040) |
| 0.3 | 4.9 | GO:0040032 | post-embryonic body morphogenesis(GO:0040032) |
| 0.3 | 1.5 | GO:0030070 | insulin processing(GO:0030070) |
| 0.3 | 0.9 | GO:0098928 | presynaptic signal transduction(GO:0098928) presynapse to nucleus signaling pathway(GO:0099526) |
| 0.3 | 1.7 | GO:0043988 | histone H3-S28 phosphorylation(GO:0043988) |
| 0.3 | 2.3 | GO:0007412 | axon target recognition(GO:0007412) |
| 0.3 | 1.7 | GO:1900220 | semaphorin-plexin signaling pathway involved in bone trabecula morphogenesis(GO:1900220) |
| 0.3 | 2.5 | GO:0006499 | N-terminal protein myristoylation(GO:0006499) |
| 0.3 | 1.4 | GO:0033031 | positive regulation of neutrophil apoptotic process(GO:0033031) |
| 0.3 | 3.0 | GO:1990034 | calcium ion export from cell(GO:1990034) |
| 0.3 | 1.0 | GO:1903445 | intermembrane transport(GO:0046909) protein transport from ciliary membrane to plasma membrane(GO:1903445) |
| 0.3 | 0.8 | GO:0007518 | myoblast fate determination(GO:0007518) |
| 0.3 | 0.8 | GO:1903450 | regulation of G1 to G0 transition(GO:1903450) positive regulation of G1 to G0 transition(GO:1903452) |
| 0.3 | 1.0 | GO:0031443 | fast-twitch skeletal muscle fiber contraction(GO:0031443) |
| 0.3 | 0.8 | GO:0036353 | histone H2A-K119 monoubiquitination(GO:0036353) |
| 0.2 | 0.7 | GO:1903004 | flavin adenine dinucleotide metabolic process(GO:0072387) regulation of protein K63-linked deubiquitination(GO:1903004) positive regulation of protein K63-linked deubiquitination(GO:1903006) |
| 0.2 | 0.7 | GO:0021793 | chemorepulsion of branchiomotor axon(GO:0021793) |
| 0.2 | 0.7 | GO:0001544 | initiation of primordial ovarian follicle growth(GO:0001544) |
| 0.2 | 0.7 | GO:2000656 | regulation of apolipoprotein binding(GO:2000656) negative regulation of apolipoprotein binding(GO:2000657) |
| 0.2 | 3.5 | GO:1900028 | negative regulation of ruffle assembly(GO:1900028) |
| 0.2 | 1.2 | GO:0071603 | endothelial cell-cell adhesion(GO:0071603) |
| 0.2 | 0.7 | GO:0036304 | umbilical cord morphogenesis(GO:0036304) umbilical cord development(GO:0061027) |
| 0.2 | 1.1 | GO:0035750 | protein localization to myelin sheath abaxonal region(GO:0035750) |
| 0.2 | 3.0 | GO:0098535 | de novo centriole assembly(GO:0098535) |
| 0.2 | 3.0 | GO:0016191 | synaptic vesicle uncoating(GO:0016191) |
| 0.2 | 1.7 | GO:1900383 | regulation of synaptic plasticity by receptor localization to synapse(GO:1900383) |
| 0.2 | 1.9 | GO:0035494 | SNARE complex disassembly(GO:0035494) |
| 0.2 | 0.6 | GO:1902598 | creatine transport(GO:0015881) creatine transmembrane transport(GO:1902598) |
| 0.2 | 3.4 | GO:0070444 | oligodendrocyte progenitor proliferation(GO:0070444) regulation of oligodendrocyte progenitor proliferation(GO:0070445) |
| 0.2 | 2.5 | GO:1904263 | positive regulation of TORC1 signaling(GO:1904263) |
| 0.2 | 0.9 | GO:0002528 | regulation of vascular permeability involved in acute inflammatory response(GO:0002528) |
| 0.2 | 0.9 | GO:1903070 | negative regulation of ER-associated ubiquitin-dependent protein catabolic process(GO:1903070) |
| 0.2 | 1.3 | GO:0006083 | acetate metabolic process(GO:0006083) |
| 0.2 | 0.9 | GO:1901526 | positive regulation of macromitophagy(GO:1901526) positive regulation of mitophagy in response to mitochondrial depolarization(GO:1904925) |
| 0.2 | 0.3 | GO:0033861 | negative regulation of NAD(P)H oxidase activity(GO:0033861) |
| 0.2 | 1.2 | GO:0045196 | establishment or maintenance of neuroblast polarity(GO:0045196) establishment of neuroblast polarity(GO:0045200) |
| 0.2 | 1.0 | GO:0015853 | adenine transport(GO:0015853) |
| 0.2 | 0.7 | GO:0021913 | regulation of transcription from RNA polymerase II promoter involved in ventral spinal cord interneuron specification(GO:0021913) |
| 0.2 | 1.0 | GO:0050915 | sensory perception of sour taste(GO:0050915) |
| 0.2 | 0.6 | GO:0032252 | secretory granule localization(GO:0032252) |
| 0.2 | 0.5 | GO:0001543 | ovarian follicle rupture(GO:0001543) |
| 0.2 | 1.2 | GO:0086047 | response to pyrethroid(GO:0046684) membrane depolarization during Purkinje myocyte cell action potential(GO:0086047) |
| 0.1 | 2.1 | GO:0071313 | cellular response to caffeine(GO:0071313) |
| 0.1 | 1.0 | GO:0015888 | thiamine transport(GO:0015888) |
| 0.1 | 0.6 | GO:0061357 | positive regulation of Wnt protein secretion(GO:0061357) |
| 0.1 | 0.8 | GO:0071051 | polyadenylation-dependent snoRNA 3'-end processing(GO:0071051) |
| 0.1 | 3.0 | GO:0045162 | clustering of voltage-gated sodium channels(GO:0045162) |
| 0.1 | 1.9 | GO:0090336 | positive regulation of brown fat cell differentiation(GO:0090336) |
| 0.1 | 9.9 | GO:0006891 | intra-Golgi vesicle-mediated transport(GO:0006891) |
| 0.1 | 1.4 | GO:0060052 | neurofilament cytoskeleton organization(GO:0060052) |
| 0.1 | 2.2 | GO:0046689 | response to mercury ion(GO:0046689) |
| 0.1 | 2.2 | GO:0015824 | proline transport(GO:0015824) |
| 0.1 | 0.4 | GO:0000494 | box C/D snoRNA 3'-end processing(GO:0000494) box C/D snoRNA metabolic process(GO:0033967) box C/D snoRNA processing(GO:0034963) histone glutamine methylation(GO:1990258) |
| 0.1 | 0.5 | GO:0045212 | negative regulation of synaptic transmission, cholinergic(GO:0032223) neurotransmitter receptor biosynthetic process(GO:0045212) |
| 0.1 | 0.6 | GO:0070213 | protein auto-ADP-ribosylation(GO:0070213) |
| 0.1 | 0.8 | GO:0035617 | stress granule disassembly(GO:0035617) |
| 0.1 | 0.3 | GO:1904616 | regulation of actin filament binding(GO:1904529) regulation of actin binding(GO:1904616) |
| 0.1 | 0.7 | GO:1904800 | regulation of neuron remodeling(GO:1904799) negative regulation of neuron remodeling(GO:1904800) negative regulation of branching morphogenesis of a nerve(GO:2000173) |
| 0.1 | 3.4 | GO:0042759 | long-chain fatty acid biosynthetic process(GO:0042759) |
| 0.1 | 2.4 | GO:0070070 | proton-transporting V-type ATPase complex assembly(GO:0070070) vacuolar proton-transporting V-type ATPase complex assembly(GO:0070072) |
| 0.1 | 0.5 | GO:2001016 | positive regulation of skeletal muscle cell differentiation(GO:2001016) |
| 0.1 | 0.4 | GO:0072579 | molybdenum incorporation into molybdenum-molybdopterin complex(GO:0018315) metal incorporation into metallo-molybdopterin complex(GO:0042040) glycine receptor clustering(GO:0072579) |
| 0.1 | 0.6 | GO:0072365 | regulation of cellular ketone metabolic process by negative regulation of transcription from RNA polymerase II promoter(GO:0072365) |
| 0.1 | 0.4 | GO:0031548 | regulation of brain-derived neurotrophic factor receptor signaling pathway(GO:0031548) |
| 0.1 | 0.6 | GO:0097056 | selenocysteinyl-tRNA(Sec) biosynthetic process(GO:0097056) |
| 0.1 | 2.9 | GO:0048172 | regulation of short-term neuronal synaptic plasticity(GO:0048172) |
| 0.1 | 0.8 | GO:1900452 | regulation of long term synaptic depression(GO:1900452) |
| 0.1 | 0.8 | GO:0009138 | pyrimidine nucleoside diphosphate metabolic process(GO:0009138) |
| 0.1 | 0.8 | GO:1904694 | negative regulation of vascular smooth muscle contraction(GO:1904694) |
| 0.1 | 1.0 | GO:0035879 | plasma membrane lactate transport(GO:0035879) |
| 0.1 | 2.0 | GO:0007253 | cytoplasmic sequestering of NF-kappaB(GO:0007253) |
| 0.1 | 1.0 | GO:0006003 | fructose 2,6-bisphosphate metabolic process(GO:0006003) |
| 0.1 | 1.5 | GO:0060385 | axonogenesis involved in innervation(GO:0060385) |
| 0.1 | 0.3 | GO:1902630 | regulation of membrane hyperpolarization(GO:1902630) |
| 0.1 | 0.6 | GO:0098528 | skeletal muscle fiber differentiation(GO:0098528) |
| 0.1 | 0.9 | GO:2000786 | positive regulation of autophagosome assembly(GO:2000786) |
| 0.1 | 2.7 | GO:0070262 | peptidyl-serine dephosphorylation(GO:0070262) |
| 0.1 | 0.6 | GO:0015742 | alpha-ketoglutarate transport(GO:0015742) |
| 0.1 | 0.5 | GO:1904059 | regulation of locomotor rhythm(GO:1904059) |
| 0.1 | 0.5 | GO:0000379 | tRNA-type intron splice site recognition and cleavage(GO:0000379) |
| 0.1 | 1.3 | GO:0006307 | DNA dealkylation involved in DNA repair(GO:0006307) |
| 0.1 | 0.5 | GO:1900224 | positive regulation of nodal signaling pathway involved in determination of lateral mesoderm left/right asymmetry(GO:1900224) |
| 0.1 | 0.4 | GO:1904693 | midbrain morphogenesis(GO:1904693) |
| 0.1 | 1.0 | GO:0010748 | regulation of plasma membrane long-chain fatty acid transport(GO:0010746) negative regulation of plasma membrane long-chain fatty acid transport(GO:0010748) |
| 0.1 | 0.3 | GO:0045715 | negative regulation of low-density lipoprotein particle receptor biosynthetic process(GO:0045715) |
| 0.1 | 0.5 | GO:0098886 | modification of dendritic spine(GO:0098886) |
| 0.1 | 0.8 | GO:1900045 | negative regulation of histone ubiquitination(GO:0033183) negative regulation of protein K63-linked ubiquitination(GO:1900045) regulation of histone H2A K63-linked ubiquitination(GO:1901314) negative regulation of histone H2A K63-linked ubiquitination(GO:1901315) negative regulation of protein polyubiquitination(GO:1902915) |
| 0.1 | 0.5 | GO:0075071 | autophagy of host cells involved in interaction with symbiont(GO:0075044) autophagy involved in symbiotic interaction(GO:0075071) |
| 0.1 | 0.6 | GO:0045113 | regulation of integrin biosynthetic process(GO:0045113) |
| 0.1 | 1.1 | GO:0021942 | radial glia guided migration of Purkinje cell(GO:0021942) |
| 0.1 | 1.2 | GO:0045475 | locomotor rhythm(GO:0045475) |
| 0.1 | 0.3 | GO:0072233 | thick ascending limb development(GO:0072023) metanephric thick ascending limb development(GO:0072233) |
| 0.1 | 0.6 | GO:0032383 | regulation of intracellular lipid transport(GO:0032377) regulation of intracellular sterol transport(GO:0032380) regulation of intracellular cholesterol transport(GO:0032383) |
| 0.1 | 0.4 | GO:0032849 | positive regulation of cellular pH reduction(GO:0032849) |
| 0.1 | 1.7 | GO:0038007 | netrin-activated signaling pathway(GO:0038007) |
| 0.1 | 0.8 | GO:0097338 | response to clozapine(GO:0097338) |
| 0.1 | 0.5 | GO:0071500 | cellular response to nitrosative stress(GO:0071500) regulation of mitochondrial DNA metabolic process(GO:1901858) |
| 0.1 | 0.6 | GO:0097428 | protein maturation by iron-sulfur cluster transfer(GO:0097428) |
| 0.1 | 0.3 | GO:0051311 | meiotic metaphase I plate congression(GO:0043060) meiotic spindle midzone assembly(GO:0051257) meiotic metaphase plate congression(GO:0051311) |
| 0.1 | 0.5 | GO:2000672 | negative regulation of motor neuron apoptotic process(GO:2000672) |
| 0.1 | 1.5 | GO:0035330 | regulation of hippo signaling(GO:0035330) |
| 0.1 | 0.3 | GO:0014022 | neural plate elongation(GO:0014022) convergent extension involved in neural plate elongation(GO:0022007) |
| 0.1 | 0.3 | GO:0034402 | recruitment of 3'-end processing factors to RNA polymerase II holoenzyme complex(GO:0034402) |
| 0.1 | 0.3 | GO:0009305 | protein biotinylation(GO:0009305) histone biotinylation(GO:0071110) |
| 0.1 | 0.4 | GO:0072752 | cellular response to rapamycin(GO:0072752) |
| 0.1 | 0.3 | GO:0006556 | S-adenosylmethionine biosynthetic process(GO:0006556) |
| 0.1 | 1.7 | GO:0009312 | oligosaccharide biosynthetic process(GO:0009312) |
| 0.1 | 1.1 | GO:1902746 | regulation of lens fiber cell differentiation(GO:1902746) |
| 0.1 | 1.1 | GO:0050966 | detection of mechanical stimulus involved in sensory perception of pain(GO:0050966) |
| 0.1 | 0.3 | GO:1900454 | positive regulation of long term synaptic depression(GO:1900454) |
| 0.1 | 0.6 | GO:0030860 | regulation of polarized epithelial cell differentiation(GO:0030860) |
| 0.1 | 1.3 | GO:0034497 | protein localization to pre-autophagosomal structure(GO:0034497) |
| 0.1 | 0.6 | GO:0007070 | negative regulation of transcription during mitosis(GO:0007068) negative regulation of transcription from RNA polymerase II promoter during mitosis(GO:0007070) |
| 0.1 | 0.3 | GO:2001247 | positive regulation of phosphatidylcholine biosynthetic process(GO:2001247) |
| 0.1 | 0.9 | GO:0042373 | vitamin K metabolic process(GO:0042373) |
| 0.1 | 1.2 | GO:0030497 | fatty acid elongation(GO:0030497) |
| 0.1 | 3.4 | GO:0010738 | regulation of protein kinase A signaling(GO:0010738) |
| 0.1 | 4.0 | GO:0035235 | ionotropic glutamate receptor signaling pathway(GO:0035235) |
| 0.1 | 0.2 | GO:0001732 | formation of cytoplasmic translation initiation complex(GO:0001732) translation reinitiation(GO:0002188) |
| 0.1 | 0.3 | GO:0044240 | multicellular organism lipid catabolic process(GO:0044240) |
| 0.1 | 0.6 | GO:1902365 | regulation of spindle elongation(GO:0032887) regulation of mitotic spindle elongation(GO:0032888) anastral spindle assembly(GO:0055048) protein localization to spindle pole body(GO:0071988) regulation of protein localization to spindle pole body(GO:1902363) positive regulation of protein localization to spindle pole body(GO:1902365) positive regulation of mitotic spindle elongation(GO:1902846) |
| 0.1 | 0.6 | GO:0060136 | embryonic process involved in female pregnancy(GO:0060136) |
| 0.1 | 3.1 | GO:0060074 | synapse maturation(GO:0060074) |
| 0.1 | 1.0 | GO:0034720 | histone H3-K4 demethylation(GO:0034720) |
| 0.1 | 0.4 | GO:0072396 | response to cell cycle checkpoint signaling(GO:0072396) response to DNA integrity checkpoint signaling(GO:0072402) response to DNA damage checkpoint signaling(GO:0072423) |
| 0.1 | 0.3 | GO:0050893 | sensory processing(GO:0050893) |
| 0.1 | 0.3 | GO:0035803 | egg coat formation(GO:0035803) |
| 0.1 | 6.0 | GO:0051965 | positive regulation of synapse assembly(GO:0051965) |
| 0.1 | 0.3 | GO:0030950 | establishment or maintenance of actin cytoskeleton polarity(GO:0030950) |
| 0.1 | 3.0 | GO:0097503 | sialylation(GO:0097503) |
| 0.1 | 0.1 | GO:0001579 | medium-chain fatty acid transport(GO:0001579) |
| 0.1 | 0.3 | GO:0071477 | hypotonic salinity response(GO:0042539) cellular hypotonic salinity response(GO:0071477) |
| 0.1 | 2.0 | GO:0046339 | diacylglycerol metabolic process(GO:0046339) |
| 0.1 | 1.3 | GO:0086016 | AV node cell action potential(GO:0086016) AV node cell to bundle of His cell signaling(GO:0086027) |
| 0.1 | 0.6 | GO:0019375 | galactosylceramide biosynthetic process(GO:0006682) galactolipid biosynthetic process(GO:0019375) |
| 0.1 | 0.8 | GO:0050884 | neuromuscular process controlling posture(GO:0050884) |
| 0.1 | 1.0 | GO:0060124 | positive regulation of growth hormone secretion(GO:0060124) |
| 0.1 | 1.4 | GO:0006474 | N-terminal protein amino acid acetylation(GO:0006474) |
| 0.1 | 0.2 | GO:1904562 | phosphatidylinositol 5-phosphate metabolic process(GO:1904562) |
| 0.1 | 0.5 | GO:0060267 | positive regulation of respiratory burst(GO:0060267) |
| 0.1 | 1.3 | GO:0090331 | negative regulation of platelet aggregation(GO:0090331) |
| 0.1 | 0.2 | GO:1902775 | mitochondrial large ribosomal subunit assembly(GO:1902775) |
| 0.1 | 0.4 | GO:0030242 | pexophagy(GO:0030242) |
| 0.1 | 0.6 | GO:0019919 | peptidyl-arginine methylation, to asymmetrical-dimethyl arginine(GO:0019919) |
| 0.1 | 0.6 | GO:0071816 | tail-anchored membrane protein insertion into ER membrane(GO:0071816) |
| 0.1 | 0.1 | GO:0071930 | negative regulation of transcription involved in G1/S transition of mitotic cell cycle(GO:0071930) |
| 0.1 | 0.8 | GO:0006655 | phosphatidylglycerol biosynthetic process(GO:0006655) |
| 0.1 | 0.2 | GO:0003221 | right ventricular cardiac muscle tissue morphogenesis(GO:0003221) |
| 0.1 | 1.0 | GO:0043117 | positive regulation of vascular permeability(GO:0043117) |
| 0.1 | 1.1 | GO:0010510 | regulation of acetyl-CoA biosynthetic process from pyruvate(GO:0010510) |
| 0.0 | 0.3 | GO:1905245 | regulation of aspartic-type endopeptidase activity involved in amyloid precursor protein catabolic process(GO:1902959) positive regulation of aspartic-type endopeptidase activity involved in amyloid precursor protein catabolic process(GO:1902961) regulation of aspartic-type peptidase activity(GO:1905245) positive regulation of aspartic-type peptidase activity(GO:1905247) |
| 0.0 | 0.9 | GO:0032957 | inositol trisphosphate metabolic process(GO:0032957) |
| 0.0 | 1.0 | GO:0043306 | positive regulation of mast cell activation involved in immune response(GO:0033008) positive regulation of mast cell degranulation(GO:0043306) |
| 0.0 | 3.1 | GO:0046839 | phospholipid dephosphorylation(GO:0046839) |
| 0.0 | 0.4 | GO:0008626 | granzyme-mediated apoptotic signaling pathway(GO:0008626) |
| 0.0 | 1.1 | GO:0006012 | galactose metabolic process(GO:0006012) |
| 0.0 | 0.2 | GO:0035021 | negative regulation of Rac protein signal transduction(GO:0035021) |
| 0.0 | 0.1 | GO:1903031 | regulation of microtubule plus-end binding(GO:1903031) positive regulation of microtubule plus-end binding(GO:1903033) |
| 0.0 | 0.5 | GO:0018230 | peptidyl-L-cysteine S-palmitoylation(GO:0018230) peptidyl-S-diacylglycerol-L-cysteine biosynthetic process from peptidyl-cysteine(GO:0018231) |
| 0.0 | 0.5 | GO:0035405 | histone-threonine phosphorylation(GO:0035405) |
| 0.0 | 1.9 | GO:0021952 | central nervous system projection neuron axonogenesis(GO:0021952) |
| 0.0 | 0.3 | GO:1901896 | positive regulation of calcium-transporting ATPase activity(GO:1901896) |
| 0.0 | 0.3 | GO:0090241 | negative regulation of histone H4 acetylation(GO:0090241) regulation of transcription from RNA polymerase II promoter by histone modification(GO:1903756) negative regulation of transcription from RNA polymerase II promoter by histone modification(GO:1903758) |
| 0.0 | 0.4 | GO:0055005 | ventricular cardiac myofibril assembly(GO:0055005) |
| 0.0 | 0.5 | GO:0000160 | phosphorelay signal transduction system(GO:0000160) |
| 0.0 | 0.7 | GO:0051386 | regulation of neurotrophin TRK receptor signaling pathway(GO:0051386) |
| 0.0 | 0.6 | GO:0006384 | transcription initiation from RNA polymerase III promoter(GO:0006384) |
| 0.0 | 0.4 | GO:0036123 | histone H3-K9 dimethylation(GO:0036123) |
| 0.0 | 2.2 | GO:0035640 | exploration behavior(GO:0035640) |
| 0.0 | 0.8 | GO:2001135 | regulation of endocytic recycling(GO:2001135) |
| 0.0 | 0.6 | GO:0043374 | CD8-positive, alpha-beta T cell differentiation(GO:0043374) |
| 0.0 | 0.2 | GO:0014051 | gamma-aminobutyric acid secretion(GO:0014051) |
| 0.0 | 0.7 | GO:0097151 | positive regulation of inhibitory postsynaptic potential(GO:0097151) modulation of inhibitory postsynaptic potential(GO:0098828) |
| 0.0 | 3.1 | GO:0032784 | regulation of DNA-templated transcription, elongation(GO:0032784) |
| 0.0 | 0.1 | GO:0035520 | monoubiquitinated protein deubiquitination(GO:0035520) |
| 0.0 | 0.1 | GO:0048560 | establishment of anatomical structure orientation(GO:0048560) establishment of organ orientation(GO:0048561) |
| 0.0 | 0.5 | GO:2000601 | positive regulation of Arp2/3 complex-mediated actin nucleation(GO:2000601) |
| 0.0 | 0.1 | GO:1902595 | regulation of DNA replication origin binding(GO:1902595) |
| 0.0 | 0.2 | GO:1902083 | negative regulation of peptidyl-cysteine S-nitrosylation(GO:1902083) |
| 0.0 | 0.2 | GO:0032439 | endosome localization(GO:0032439) |
| 0.0 | 0.3 | GO:0044791 | modulation by host of viral release from host cell(GO:0044789) positive regulation by host of viral release from host cell(GO:0044791) negative regulation by host of viral genome replication(GO:0044828) |
| 0.0 | 0.2 | GO:0035900 | response to isolation stress(GO:0035900) |
| 0.0 | 0.5 | GO:0045075 | interleukin-12 biosynthetic process(GO:0042090) regulation of interleukin-12 biosynthetic process(GO:0045075) |
| 0.0 | 0.5 | GO:0016926 | protein desumoylation(GO:0016926) |
| 0.0 | 2.3 | GO:0033173 | calcineurin-NFAT signaling cascade(GO:0033173) |
| 0.0 | 1.9 | GO:0043278 | response to isoquinoline alkaloid(GO:0014072) response to morphine(GO:0043278) |
| 0.0 | 0.3 | GO:2000576 | positive regulation of microtubule motor activity(GO:2000576) |
| 0.0 | 0.4 | GO:0061366 | behavioral response to chemical pain(GO:0061366) behavioral response to formalin induced pain(GO:0061368) |
| 0.0 | 0.3 | GO:0036148 | phosphatidylglycerol acyl-chain remodeling(GO:0036148) |
| 0.0 | 0.4 | GO:0021860 | pyramidal neuron development(GO:0021860) |
| 0.0 | 0.3 | GO:0048280 | vesicle fusion with Golgi apparatus(GO:0048280) |
| 0.0 | 0.4 | GO:0072386 | plus-end-directed organelle transport along microtubule(GO:0072386) |
| 0.0 | 1.9 | GO:0070534 | protein K63-linked ubiquitination(GO:0070534) |
| 0.0 | 0.5 | GO:0033299 | secretion of lysosomal enzymes(GO:0033299) |
| 0.0 | 0.2 | GO:0010732 | protein glutathionylation(GO:0010731) regulation of protein glutathionylation(GO:0010732) negative regulation of protein glutathionylation(GO:0010734) |
| 0.0 | 0.8 | GO:0090169 | regulation of spindle assembly(GO:0090169) regulation of mitotic spindle assembly(GO:1901673) |
| 0.0 | 0.1 | GO:1904016 | response to Thyroglobulin triiodothyronine(GO:1904016) cellular response to Thyroglobulin triiodothyronine(GO:1904017) |
| 0.0 | 0.1 | GO:2001184 | positive regulation of interleukin-12 secretion(GO:2001184) |
| 0.0 | 0.1 | GO:1903644 | regulation of chaperone-mediated protein folding(GO:1903644) |
| 0.0 | 0.2 | GO:0060040 | retinal bipolar neuron differentiation(GO:0060040) |
| 0.0 | 0.9 | GO:0048011 | neurotrophin TRK receptor signaling pathway(GO:0048011) |
| 0.0 | 0.7 | GO:0007158 | neuron cell-cell adhesion(GO:0007158) |
| 0.0 | 2.6 | GO:1901385 | regulation of voltage-gated calcium channel activity(GO:1901385) |
| 0.0 | 0.2 | GO:1900242 | regulation of synaptic vesicle endocytosis(GO:1900242) |
| 0.0 | 1.0 | GO:0006309 | apoptotic DNA fragmentation(GO:0006309) |
| 0.0 | 2.6 | GO:0051205 | protein insertion into membrane(GO:0051205) |
| 0.0 | 0.1 | GO:0097032 | mitochondrial electron transport, succinate to ubiquinone(GO:0006121) respiratory chain complex II assembly(GO:0034552) mitochondrial respiratory chain complex II assembly(GO:0034553) mitochondrial respiratory chain complex II biogenesis(GO:0097032) |
| 0.0 | 1.6 | GO:0021762 | substantia nigra development(GO:0021762) |
| 0.0 | 0.7 | GO:0009157 | deoxyribonucleoside monophosphate biosynthetic process(GO:0009157) |
| 0.0 | 0.5 | GO:0002315 | marginal zone B cell differentiation(GO:0002315) |
| 0.0 | 0.1 | GO:0019227 | neuronal action potential propagation(GO:0019227) action potential propagation(GO:0098870) |
| 0.0 | 0.3 | GO:0030050 | vesicle transport along actin filament(GO:0030050) |
| 0.0 | 1.4 | GO:0008045 | motor neuron axon guidance(GO:0008045) |
| 0.0 | 1.1 | GO:0050901 | leukocyte tethering or rolling(GO:0050901) |
| 0.0 | 0.5 | GO:0001778 | plasma membrane repair(GO:0001778) |
| 0.0 | 1.5 | GO:0050771 | negative regulation of axonogenesis(GO:0050771) |
| 0.0 | 0.3 | GO:0048148 | behavioral response to cocaine(GO:0048148) |
| 0.0 | 0.4 | GO:0007258 | JUN phosphorylation(GO:0007258) |
| 0.0 | 1.7 | GO:0007274 | neuromuscular synaptic transmission(GO:0007274) |
| 0.0 | 0.3 | GO:0048149 | behavioral response to ethanol(GO:0048149) |
| 0.0 | 0.4 | GO:2000780 | negative regulation of double-strand break repair(GO:2000780) |
| 0.0 | 0.3 | GO:0007042 | lysosomal lumen acidification(GO:0007042) |
| 0.0 | 2.6 | GO:0003254 | regulation of membrane depolarization(GO:0003254) |
| 0.0 | 0.2 | GO:0032287 | peripheral nervous system myelin maintenance(GO:0032287) |
| 0.0 | 0.2 | GO:0070979 | protein K11-linked ubiquitination(GO:0070979) |
| 0.0 | 0.7 | GO:0036149 | phosphatidylinositol acyl-chain remodeling(GO:0036149) |
| 0.0 | 2.0 | GO:0048791 | calcium ion-regulated exocytosis of neurotransmitter(GO:0048791) |
| 0.0 | 0.1 | GO:0003056 | regulation of vascular smooth muscle contraction(GO:0003056) |
| 0.0 | 1.6 | GO:0030866 | cortical actin cytoskeleton organization(GO:0030866) |
| 0.0 | 0.1 | GO:0071955 | recycling endosome to Golgi transport(GO:0071955) |
| 0.0 | 1.0 | GO:0007628 | adult walking behavior(GO:0007628) |
| 0.0 | 1.4 | GO:2000649 | regulation of sodium ion transmembrane transporter activity(GO:2000649) |
| 0.0 | 0.6 | GO:0045974 | miRNA mediated inhibition of translation(GO:0035278) negative regulation of translation, ncRNA-mediated(GO:0040033) regulation of translation, ncRNA-mediated(GO:0045974) |
| 0.0 | 2.3 | GO:0000381 | regulation of alternative mRNA splicing, via spliceosome(GO:0000381) |
| 0.0 | 0.3 | GO:0032228 | regulation of synaptic transmission, GABAergic(GO:0032228) |
| 0.0 | 1.0 | GO:2000810 | regulation of bicellular tight junction assembly(GO:2000810) |
| 0.0 | 0.2 | GO:0022027 | interkinetic nuclear migration(GO:0022027) |
| 0.0 | 0.4 | GO:0000338 | protein deneddylation(GO:0000338) |
| 0.0 | 0.3 | GO:1903800 | positive regulation of production of miRNAs involved in gene silencing by miRNA(GO:1903800) |
| 0.0 | 1.6 | GO:0002028 | regulation of sodium ion transport(GO:0002028) |
| 0.0 | 0.8 | GO:0016339 | calcium-dependent cell-cell adhesion via plasma membrane cell adhesion molecules(GO:0016339) |
| 0.0 | 0.2 | GO:0071104 | response to interleukin-9(GO:0071104) |
| 0.0 | 1.0 | GO:0010107 | potassium ion import(GO:0010107) |
| 0.0 | 0.1 | GO:0019348 | polyprenol catabolic process(GO:0016095) dolichol metabolic process(GO:0019348) |
| 0.0 | 0.2 | GO:0090315 | negative regulation of protein targeting to membrane(GO:0090315) |
| 0.0 | 0.2 | GO:1901836 | regulation of transcription of nuclear large rRNA transcript from RNA polymerase I promoter(GO:1901836) positive regulation of transcription of nuclear large rRNA transcript from RNA polymerase I promoter(GO:1901838) |
| 0.0 | 1.5 | GO:0035249 | synaptic transmission, glutamatergic(GO:0035249) |
| 0.0 | 0.5 | GO:0018027 | peptidyl-lysine dimethylation(GO:0018027) |
| 0.0 | 0.2 | GO:0060573 | ventral spinal cord interneuron specification(GO:0021521) cell fate specification involved in pattern specification(GO:0060573) |
| 0.0 | 1.1 | GO:0005980 | glycogen catabolic process(GO:0005980) |
| 0.0 | 0.4 | GO:1902259 | regulation of delayed rectifier potassium channel activity(GO:1902259) |
| 0.0 | 1.2 | GO:0008344 | adult locomotory behavior(GO:0008344) |
| 0.0 | 0.4 | GO:0032486 | Rap protein signal transduction(GO:0032486) |
| 0.0 | 0.6 | GO:0006123 | mitochondrial electron transport, cytochrome c to oxygen(GO:0006123) |
| 0.0 | 0.2 | GO:0002318 | myeloid progenitor cell differentiation(GO:0002318) |
| 0.0 | 1.3 | GO:0070536 | protein K63-linked deubiquitination(GO:0070536) |
| 0.0 | 0.7 | GO:2000171 | negative regulation of dendrite development(GO:2000171) |
| 0.0 | 0.4 | GO:1904322 | response to forskolin(GO:1904321) cellular response to forskolin(GO:1904322) |
| 0.0 | 0.4 | GO:0071108 | protein K48-linked deubiquitination(GO:0071108) |
| 0.0 | 0.4 | GO:0016255 | attachment of GPI anchor to protein(GO:0016255) |
| 0.0 | 0.7 | GO:0016578 | histone deubiquitination(GO:0016578) |
| 0.0 | 0.3 | GO:0002091 | negative regulation of receptor internalization(GO:0002091) |
| 0.0 | 0.0 | GO:0051795 | positive regulation of catagen(GO:0051795) |
| 0.0 | 4.2 | GO:0006836 | neurotransmitter transport(GO:0006836) |
| 0.0 | 1.0 | GO:0006198 | cAMP catabolic process(GO:0006198) |
| 0.0 | 0.1 | GO:0021886 | hypothalamus gonadotrophin-releasing hormone neuron differentiation(GO:0021886) hypothalamus gonadotrophin-releasing hormone neuron development(GO:0021888) |
| 0.0 | 1.6 | GO:0000186 | activation of MAPKK activity(GO:0000186) |
| 0.0 | 0.5 | GO:0007021 | tubulin complex assembly(GO:0007021) |
| 0.0 | 0.2 | GO:0015760 | hexose phosphate transport(GO:0015712) glucose-6-phosphate transport(GO:0015760) |
| 0.0 | 0.3 | GO:0035563 | positive regulation of chromatin binding(GO:0035563) |
| 0.0 | 0.5 | GO:0006020 | inositol metabolic process(GO:0006020) |
| 0.0 | 0.2 | GO:0035583 | sequestering of TGFbeta in extracellular matrix(GO:0035583) |
| 0.0 | 0.2 | GO:0002176 | male germ cell proliferation(GO:0002176) germ cell proliferation(GO:0036093) |
| 0.0 | 0.2 | GO:0033127 | regulation of histone phosphorylation(GO:0033127) |
| 0.0 | 1.2 | GO:0045773 | positive regulation of axon extension(GO:0045773) |
| 0.0 | 0.3 | GO:0001767 | establishment of lymphocyte polarity(GO:0001767) |
| 0.0 | 1.3 | GO:0071391 | cellular response to estrogen stimulus(GO:0071391) |
| 0.0 | 0.7 | GO:0009083 | branched-chain amino acid catabolic process(GO:0009083) |
| 0.0 | 1.0 | GO:0051646 | mitochondrion localization(GO:0051646) |
| 0.0 | 0.2 | GO:0015727 | lactate transport(GO:0015727) lactate transmembrane transport(GO:0035873) |
| 0.0 | 0.3 | GO:0070131 | positive regulation of mitochondrial translation(GO:0070131) |
| 0.0 | 1.1 | GO:0016239 | positive regulation of macroautophagy(GO:0016239) |
| 0.0 | 0.1 | GO:0016584 | nucleosome positioning(GO:0016584) |
| 0.0 | 2.1 | GO:0046847 | filopodium assembly(GO:0046847) |
| 0.0 | 0.3 | GO:0097094 | craniofacial suture morphogenesis(GO:0097094) |
| 0.0 | 0.4 | GO:0031646 | positive regulation of neurological system process(GO:0031646) |
| 0.0 | 0.6 | GO:0045332 | phospholipid translocation(GO:0045332) |
| 0.0 | 0.3 | GO:2001032 | regulation of double-strand break repair via nonhomologous end joining(GO:2001032) |
| 0.0 | 0.4 | GO:0000028 | ribosomal small subunit assembly(GO:0000028) |
| 0.0 | 1.3 | GO:0030049 | muscle filament sliding(GO:0030049) actin-myosin filament sliding(GO:0033275) |
| 0.0 | 1.2 | GO:0051865 | protein autoubiquitination(GO:0051865) |
| 0.0 | 0.7 | GO:0045746 | negative regulation of Notch signaling pathway(GO:0045746) |
| 0.0 | 0.1 | GO:0000715 | nucleotide-excision repair, DNA damage recognition(GO:0000715) |
| 0.0 | 0.1 | GO:2000210 | positive regulation of anoikis(GO:2000210) |
| 0.0 | 0.9 | GO:0050690 | regulation of defense response to virus by virus(GO:0050690) |
| 0.0 | 0.3 | GO:0019371 | cyclooxygenase pathway(GO:0019371) |
| 0.0 | 0.0 | GO:0036323 | vascular endothelial growth factor receptor-1 signaling pathway(GO:0036323) |
| 0.0 | 0.1 | GO:0045040 | protein import into mitochondrial outer membrane(GO:0045040) |
| 0.0 | 0.1 | GO:0044376 | RNA polymerase II complex import to nucleus(GO:0044376) RNA polymerase III complex localization to nucleus(GO:1990022) |
| 0.0 | 2.7 | GO:0006661 | phosphatidylinositol biosynthetic process(GO:0006661) |
| 0.0 | 0.3 | GO:1901570 | icosanoid biosynthetic process(GO:0046456) fatty acid derivative biosynthetic process(GO:1901570) |
| 0.0 | 0.2 | GO:2001181 | positive regulation of interleukin-10 secretion(GO:2001181) |
| 0.0 | 0.2 | GO:0021902 | forebrain neuron fate commitment(GO:0021877) commitment of neuronal cell to specific neuron type in forebrain(GO:0021902) |
| 0.0 | 1.1 | GO:0030201 | heparan sulfate proteoglycan metabolic process(GO:0030201) |
| 0.0 | 2.2 | GO:1990823 | response to leukemia inhibitory factor(GO:1990823) cellular response to leukemia inhibitory factor(GO:1990830) |
| 0.0 | 1.0 | GO:0043171 | peptide catabolic process(GO:0043171) |
| 0.0 | 1.0 | GO:0090307 | mitotic spindle assembly(GO:0090307) |
| 0.0 | 0.2 | GO:0038203 | TORC2 signaling(GO:0038203) |
| 0.0 | 0.2 | GO:0006268 | DNA unwinding involved in DNA replication(GO:0006268) |
| 0.0 | 0.1 | GO:0046604 | positive regulation of mitotic centrosome separation(GO:0046604) |
| 0.0 | 1.7 | GO:0001578 | microtubule bundle formation(GO:0001578) |
| 0.0 | 0.3 | GO:0010745 | negative regulation of macrophage derived foam cell differentiation(GO:0010745) |
| 0.0 | 0.1 | GO:0032929 | negative regulation of superoxide anion generation(GO:0032929) |
| 0.0 | 0.2 | GO:0035269 | protein O-linked mannosylation(GO:0035269) |
| 0.0 | 1.3 | GO:0031146 | SCF-dependent proteasomal ubiquitin-dependent protein catabolic process(GO:0031146) |
| 0.0 | 1.1 | GO:0097031 | NADH dehydrogenase complex assembly(GO:0010257) mitochondrial respiratory chain complex I assembly(GO:0032981) mitochondrial respiratory chain complex I biogenesis(GO:0097031) |
| 0.0 | 2.6 | GO:0042787 | protein ubiquitination involved in ubiquitin-dependent protein catabolic process(GO:0042787) |
| 0.0 | 0.7 | GO:0051972 | regulation of telomerase activity(GO:0051972) |
| 0.0 | 0.1 | GO:2000174 | regulation of pro-T cell differentiation(GO:2000174) positive regulation of pro-T cell differentiation(GO:2000176) |
| 0.0 | 0.3 | GO:0006851 | mitochondrial calcium ion transport(GO:0006851) |
| 0.0 | 0.4 | GO:0071549 | cellular response to dexamethasone stimulus(GO:0071549) |
| 0.0 | 0.2 | GO:0030516 | regulation of axon extension(GO:0030516) |
| 0.0 | 1.3 | GO:0008543 | fibroblast growth factor receptor signaling pathway(GO:0008543) |
| 0.0 | 0.3 | GO:0097186 | amelogenesis(GO:0097186) |
| 0.0 | 0.1 | GO:0043248 | proteasome assembly(GO:0043248) |
| 0.0 | 0.1 | GO:0006044 | N-acetylglucosamine metabolic process(GO:0006044) |
| 0.0 | 0.4 | GO:0050650 | chondroitin sulfate proteoglycan biosynthetic process(GO:0050650) |
| 0.0 | 0.2 | GO:0006048 | UDP-N-acetylglucosamine biosynthetic process(GO:0006048) |
| 0.0 | 0.3 | GO:0033539 | fatty acid beta-oxidation using acyl-CoA dehydrogenase(GO:0033539) |
| 0.0 | 0.0 | GO:0016267 | O-glycan processing, core 1(GO:0016267) |
| 0.0 | 0.2 | GO:0097240 | meiotic telomere tethering at nuclear periphery(GO:0044821) meiotic attachment of telomere to nuclear envelope(GO:0070197) chromosome attachment to the nuclear envelope(GO:0097240) |
| 0.0 | 0.2 | GO:0001946 | lymphangiogenesis(GO:0001946) |
Gene overrepresentation in cellular component category:
| Log-likelihood per target | Total log-likelihood | Term | Description |
|---|---|---|---|
| 0.9 | 4.6 | GO:0097059 | CNTFR-CLCF1 complex(GO:0097059) |
| 0.7 | 5.6 | GO:0045298 | tubulin complex(GO:0045298) |
| 0.7 | 3.4 | GO:0072534 | perineuronal net(GO:0072534) |
| 0.4 | 4.9 | GO:1990761 | growth cone lamellipodium(GO:1990761) |
| 0.4 | 2.4 | GO:0043291 | RAVE complex(GO:0043291) |
| 0.4 | 2.8 | GO:0098843 | postsynaptic endocytic zone(GO:0098843) |
| 0.3 | 6.2 | GO:0043083 | synaptic cleft(GO:0043083) |
| 0.3 | 4.1 | GO:0005955 | calcineurin complex(GO:0005955) |
| 0.3 | 1.3 | GO:0032798 | Swi5-Sfr1 complex(GO:0032798) |
| 0.3 | 0.9 | GO:0098831 | cytoskeleton of presynaptic active zone(GO:0048788) presynaptic active zone cytoplasmic component(GO:0098831) presynaptic cytoskeleton(GO:0099569) |
| 0.3 | 1.7 | GO:1990131 | Gtr1-Gtr2 GTPase complex(GO:1990131) |
| 0.2 | 0.2 | GO:0043614 | multi-eIF complex(GO:0043614) |
| 0.2 | 1.5 | GO:0031417 | NatC complex(GO:0031417) |
| 0.2 | 1.1 | GO:0097454 | Schwann cell microvillus(GO:0097454) |
| 0.2 | 1.0 | GO:0060053 | neurofilament cytoskeleton(GO:0060053) |
| 0.2 | 3.3 | GO:0005883 | neurofilament(GO:0005883) |
| 0.2 | 0.8 | GO:0097636 | intrinsic component of autophagosome membrane(GO:0097636) integral component of autophagosome membrane(GO:0097637) |
| 0.2 | 0.7 | GO:1990730 | VCP-NSFL1C complex(GO:1990730) |
| 0.2 | 2.2 | GO:0033269 | internode region of axon(GO:0033269) |
| 0.2 | 16.6 | GO:0033017 | sarcoplasmic reticulum membrane(GO:0033017) |
| 0.2 | 0.9 | GO:0016938 | kinesin I complex(GO:0016938) |
| 0.2 | 0.5 | GO:0097058 | CRLF-CLCF1 complex(GO:0097058) |
| 0.2 | 1.4 | GO:0048787 | presynaptic active zone membrane(GO:0048787) |
| 0.2 | 2.0 | GO:0070852 | cell body fiber(GO:0070852) |
| 0.1 | 0.7 | GO:0071008 | U2-type post-mRNA release spliceosomal complex(GO:0071008) |
| 0.1 | 2.8 | GO:0005686 | U2 snRNP(GO:0005686) |
| 0.1 | 0.6 | GO:0045272 | plasma membrane respiratory chain complex I(GO:0045272) |
| 0.1 | 5.7 | GO:0000407 | pre-autophagosomal structure(GO:0000407) |
| 0.1 | 2.2 | GO:0097450 | astrocyte end-foot(GO:0097450) |
| 0.1 | 1.3 | GO:0032009 | early phagosome(GO:0032009) |
| 0.1 | 0.4 | GO:0043293 | apoptosome(GO:0043293) |
| 0.1 | 12.0 | GO:0031903 | peroxisomal membrane(GO:0005778) microbody membrane(GO:0031903) |
| 0.1 | 2.8 | GO:0001518 | voltage-gated sodium channel complex(GO:0001518) |
| 0.1 | 1.3 | GO:0070552 | BRISC complex(GO:0070552) |
| 0.1 | 0.3 | GO:0048269 | methionine adenosyltransferase complex(GO:0048269) |
| 0.1 | 1.4 | GO:0000137 | Golgi cis cisterna(GO:0000137) |
| 0.1 | 0.6 | GO:0044214 | spanning component of plasma membrane(GO:0044214) spanning component of membrane(GO:0089717) |
| 0.1 | 1.9 | GO:0097427 | microtubule bundle(GO:0097427) |
| 0.1 | 1.2 | GO:0001939 | female pronucleus(GO:0001939) |
| 0.1 | 5.8 | GO:0016528 | sarcoplasm(GO:0016528) |
| 0.1 | 0.7 | GO:0005947 | mitochondrial alpha-ketoglutarate dehydrogenase complex(GO:0005947) |
| 0.1 | 1.3 | GO:0035253 | ciliary rootlet(GO:0035253) |
| 0.1 | 0.3 | GO:0034686 | integrin alphav-beta8 complex(GO:0034686) |
| 0.1 | 0.4 | GO:0044294 | dendritic growth cone(GO:0044294) |
| 0.1 | 0.3 | GO:0005715 | late recombination nodule(GO:0005715) |
| 0.1 | 0.5 | GO:0000214 | tRNA-intron endonuclease complex(GO:0000214) |
| 0.1 | 2.0 | GO:0031254 | uropod(GO:0001931) cell trailing edge(GO:0031254) |
| 0.1 | 6.6 | GO:0005834 | heterotrimeric G-protein complex(GO:0005834) |
| 0.1 | 0.5 | GO:0032444 | activin responsive factor complex(GO:0032444) |
| 0.1 | 1.4 | GO:0000815 | ESCRT III complex(GO:0000815) |
| 0.1 | 10.1 | GO:0030672 | synaptic vesicle membrane(GO:0030672) exocytic vesicle membrane(GO:0099501) |
| 0.1 | 1.1 | GO:0035749 | myelin sheath adaxonal region(GO:0035749) |
| 0.1 | 2.0 | GO:0097440 | apical dendrite(GO:0097440) |
| 0.1 | 1.7 | GO:0000786 | nucleosome(GO:0000786) |
| 0.1 | 1.0 | GO:0000322 | storage vacuole(GO:0000322) |
| 0.1 | 1.1 | GO:0031010 | ISWI-type complex(GO:0031010) |
| 0.1 | 0.5 | GO:0000125 | PCAF complex(GO:0000125) |
| 0.1 | 1.9 | GO:0000145 | exocyst(GO:0000145) |
| 0.1 | 0.6 | GO:0043190 | ATP-binding cassette (ABC) transporter complex(GO:0043190) |
| 0.1 | 5.5 | GO:0043195 | terminal bouton(GO:0043195) |
| 0.1 | 5.1 | GO:0043198 | dendritic shaft(GO:0043198) |
| 0.1 | 0.4 | GO:0033553 | rDNA heterochromatin(GO:0033553) |
| 0.1 | 0.8 | GO:0000176 | nuclear exosome (RNase complex)(GO:0000176) |
| 0.1 | 2.8 | GO:0000159 | protein phosphatase type 2A complex(GO:0000159) |
| 0.1 | 0.3 | GO:0031510 | SUMO activating enzyme complex(GO:0031510) |
| 0.1 | 0.6 | GO:0072379 | BAT3 complex(GO:0071818) ER membrane insertion complex(GO:0072379) |
| 0.1 | 1.1 | GO:0042405 | nuclear inclusion body(GO:0042405) |
| 0.0 | 0.9 | GO:0008091 | spectrin(GO:0008091) |
| 0.0 | 1.0 | GO:0032591 | dendritic spine membrane(GO:0032591) |
| 0.0 | 0.6 | GO:0017146 | NMDA selective glutamate receptor complex(GO:0017146) |
| 0.0 | 1.4 | GO:0000242 | pericentriolar material(GO:0000242) |
| 0.0 | 1.4 | GO:0046930 | pore complex(GO:0046930) |
| 0.0 | 0.4 | GO:0034388 | Pwp2p-containing subcomplex of 90S preribosome(GO:0034388) |
| 0.0 | 1.5 | GO:0005849 | mRNA cleavage factor complex(GO:0005849) |
| 0.0 | 0.1 | GO:0030981 | cortical microtubule cytoskeleton(GO:0030981) |
| 0.0 | 1.4 | GO:0030119 | AP-type membrane coat adaptor complex(GO:0030119) |
| 0.0 | 4.0 | GO:0019005 | SCF ubiquitin ligase complex(GO:0019005) |
| 0.0 | 0.8 | GO:0031080 | nuclear pore outer ring(GO:0031080) |
| 0.0 | 1.8 | GO:0031527 | filopodium membrane(GO:0031527) |
| 0.0 | 1.8 | GO:0048786 | presynaptic active zone(GO:0048786) |
| 0.0 | 1.5 | GO:0005942 | phosphatidylinositol 3-kinase complex(GO:0005942) |
| 0.0 | 0.4 | GO:0031428 | box C/D snoRNP complex(GO:0031428) |
| 0.0 | 0.2 | GO:0005850 | eukaryotic translation initiation factor 2 complex(GO:0005850) |
| 0.0 | 2.0 | GO:0005859 | muscle myosin complex(GO:0005859) |
| 0.0 | 1.8 | GO:0002080 | acrosomal membrane(GO:0002080) |
| 0.0 | 0.5 | GO:0031209 | SCAR complex(GO:0031209) |
| 0.0 | 6.9 | GO:0005814 | centriole(GO:0005814) |
| 0.0 | 0.6 | GO:0000124 | SAGA complex(GO:0000124) |
| 0.0 | 15.5 | GO:0060076 | excitatory synapse(GO:0060076) |
| 0.0 | 1.7 | GO:0032281 | AMPA glutamate receptor complex(GO:0032281) |
| 0.0 | 0.8 | GO:0098827 | endoplasmic reticulum tubular network(GO:0071782) endoplasmic reticulum subcompartment(GO:0098827) |
| 0.0 | 0.2 | GO:0097232 | lamellar body membrane(GO:0097232) alveolar lamellar body membrane(GO:0097233) |
| 0.0 | 0.9 | GO:0005952 | cAMP-dependent protein kinase complex(GO:0005952) |
| 0.0 | 0.5 | GO:0042587 | glycogen granule(GO:0042587) |
| 0.0 | 0.1 | GO:0035189 | Rb-E2F complex(GO:0035189) |
| 0.0 | 0.6 | GO:0005751 | mitochondrial respiratory chain complex IV(GO:0005751) |
| 0.0 | 6.8 | GO:0042383 | sarcolemma(GO:0042383) |
| 0.0 | 3.1 | GO:0008021 | synaptic vesicle(GO:0008021) |
| 0.0 | 3.2 | GO:0031463 | Cul3-RING ubiquitin ligase complex(GO:0031463) |
| 0.0 | 4.5 | GO:0008076 | voltage-gated potassium channel complex(GO:0008076) |
| 0.0 | 0.1 | GO:0098984 | asymmetric synapse(GO:0032279) neuron to neuron synapse(GO:0098984) |
| 0.0 | 0.2 | GO:0033565 | ESCRT-0 complex(GO:0033565) |
| 0.0 | 0.4 | GO:0031931 | TORC1 complex(GO:0031931) |
| 0.0 | 0.2 | GO:0070876 | SOSS complex(GO:0070876) |
| 0.0 | 0.3 | GO:0000220 | vacuolar proton-transporting V-type ATPase, V0 domain(GO:0000220) |
| 0.0 | 0.7 | GO:0016580 | Sin3 complex(GO:0016580) |
| 0.0 | 0.2 | GO:0036449 | microtubule minus-end(GO:0036449) |
| 0.0 | 0.3 | GO:0016593 | Cdc73/Paf1 complex(GO:0016593) |
| 0.0 | 4.5 | GO:0030665 | clathrin-coated vesicle membrane(GO:0030665) |
| 0.0 | 2.3 | GO:0005871 | kinesin complex(GO:0005871) |
| 0.0 | 0.2 | GO:0097452 | GAIT complex(GO:0097452) |
| 0.0 | 0.6 | GO:0030904 | retromer complex(GO:0030904) |
| 0.0 | 5.0 | GO:0005793 | endoplasmic reticulum-Golgi intermediate compartment(GO:0005793) |
| 0.0 | 0.7 | GO:0030877 | beta-catenin destruction complex(GO:0030877) |
| 0.0 | 0.1 | GO:0071942 | XPC complex(GO:0071942) |
| 0.0 | 1.0 | GO:0044306 | neuron projection terminus(GO:0044306) |
| 0.0 | 1.0 | GO:0080008 | Cul4-RING E3 ubiquitin ligase complex(GO:0080008) |
| 0.0 | 0.2 | GO:0000308 | cytoplasmic cyclin-dependent protein kinase holoenzyme complex(GO:0000308) |
| 0.0 | 0.2 | GO:0030688 | preribosome, small subunit precursor(GO:0030688) |
| 0.0 | 0.4 | GO:0005666 | DNA-directed RNA polymerase III complex(GO:0005666) |
| 0.0 | 2.5 | GO:0043204 | perikaryon(GO:0043204) |
| 0.0 | 0.1 | GO:0097123 | cyclin A1-CDK2 complex(GO:0097123) |
| 0.0 | 0.1 | GO:1990726 | Lsm1-7-Pat1 complex(GO:1990726) |
| 0.0 | 1.4 | GO:0055038 | recycling endosome membrane(GO:0055038) |
| 0.0 | 0.6 | GO:0042629 | mast cell granule(GO:0042629) |
| 0.0 | 0.2 | GO:0000127 | transcription factor TFIIIC complex(GO:0000127) |
| 0.0 | 0.4 | GO:0016461 | unconventional myosin complex(GO:0016461) |
| 0.0 | 2.0 | GO:0031234 | extrinsic component of cytoplasmic side of plasma membrane(GO:0031234) |
| 0.0 | 1.4 | GO:0005844 | polysome(GO:0005844) |
| 0.0 | 0.2 | GO:0035748 | myelin sheath abaxonal region(GO:0035748) |
| 0.0 | 1.0 | GO:0045171 | intercellular bridge(GO:0045171) |
| 0.0 | 0.9 | GO:0016235 | aggresome(GO:0016235) |
| 0.0 | 1.6 | GO:0000502 | proteasome complex(GO:0000502) |
| 0.0 | 0.4 | GO:0070971 | endoplasmic reticulum exit site(GO:0070971) |
| 0.0 | 0.1 | GO:0032389 | MutLalpha complex(GO:0032389) |
| 0.0 | 0.4 | GO:0005665 | DNA-directed RNA polymerase II, core complex(GO:0005665) |
| 0.0 | 0.2 | GO:0031362 | anchored component of external side of plasma membrane(GO:0031362) |
| 0.0 | 0.1 | GO:0008290 | F-actin capping protein complex(GO:0008290) |
| 0.0 | 0.1 | GO:0036157 | outer dynein arm(GO:0036157) |
| 0.0 | 0.3 | GO:0038201 | TOR complex(GO:0038201) |
| 0.0 | 0.3 | GO:0031265 | CD95 death-inducing signaling complex(GO:0031265) |
| 0.0 | 0.3 | GO:0005892 | acetylcholine-gated channel complex(GO:0005892) |
| 0.0 | 2.7 | GO:0005802 | trans-Golgi network(GO:0005802) |
| 0.0 | 0.2 | GO:0034993 | microtubule organizing center attachment site(GO:0034992) LINC complex(GO:0034993) |
| 0.0 | 0.9 | GO:0005776 | autophagosome(GO:0005776) |
| 0.0 | 0.1 | GO:0032301 | MutSalpha complex(GO:0032301) |
| 0.0 | 0.4 | GO:0030867 | rough endoplasmic reticulum membrane(GO:0030867) |
| 0.0 | 0.1 | GO:0031314 | extrinsic component of mitochondrial inner membrane(GO:0031314) |
Gene overrepresentation in molecular function category:
| Log-likelihood per target | Total log-likelihood | Term | Description |
|---|---|---|---|
| 1.4 | 5.6 | GO:0099609 | microtubule lateral binding(GO:0099609) |
| 0.9 | 8.5 | GO:0005052 | peroxisome matrix targeting signal-1 binding(GO:0005052) |
| 0.5 | 2.0 | GO:0010736 | serum response element binding(GO:0010736) |
| 0.5 | 1.5 | GO:0005369 | taurine transmembrane transporter activity(GO:0005368) taurine:sodium symporter activity(GO:0005369) |
| 0.5 | 2.0 | GO:0052810 | 1-phosphatidylinositol-5-kinase activity(GO:0052810) |
| 0.5 | 6.3 | GO:0033192 | calmodulin-dependent protein phosphatase activity(GO:0033192) |
| 0.4 | 2.8 | GO:0008467 | [heparan sulfate]-glucosamine 3-sulfotransferase 1 activity(GO:0008467) |
| 0.4 | 3.5 | GO:1904315 | neurotransmitter receptor activity involved in regulation of postsynaptic membrane potential(GO:0099529) transmitter-gated ion channel activity involved in regulation of postsynaptic membrane potential(GO:1904315) |
| 0.4 | 1.2 | GO:0080023 | 3R-hydroxyacyl-CoA dehydratase activity(GO:0080023) |
| 0.4 | 4.2 | GO:0004897 | ciliary neurotrophic factor receptor activity(GO:0004897) |
| 0.4 | 3.3 | GO:0099580 | ion antiporter activity involved in regulation of postsynaptic membrane potential(GO:0099580) |
| 0.4 | 0.4 | GO:0004723 | calcium-dependent protein serine/threonine phosphatase activity(GO:0004723) |
| 0.3 | 2.0 | GO:0032038 | myosin II heavy chain binding(GO:0032038) |
| 0.3 | 10.6 | GO:0031489 | myosin V binding(GO:0031489) |
| 0.3 | 1.6 | GO:0052798 | beta-galactoside alpha-2,3-sialyltransferase activity(GO:0052798) |
| 0.3 | 0.9 | GO:0047325 | inositol tetrakisphosphate 1-kinase activity(GO:0047325) inositol-1,3,4-trisphosphate 6-kinase activity(GO:0052725) inositol-1,3,4-trisphosphate 5-kinase activity(GO:0052726) inositol-1,3,4,5,6-pentakisphosphate 1-phosphatase activity(GO:0052825) inositol-1,3,4,6-tetrakisphosphate 6-phosphatase activity(GO:0052830) inositol-1,3,4,6-tetrakisphosphate 1-phosphatase activity(GO:0052831) inositol-3,4,6-trisphosphate 1-kinase activity(GO:0052835) |
| 0.3 | 1.5 | GO:0047273 | galactosylgalactosylglucosylceramide beta-D-acetylgalactosaminyltransferase activity(GO:0047273) |
| 0.3 | 0.9 | GO:0008193 | tRNA guanylyltransferase activity(GO:0008193) |
| 0.3 | 0.9 | GO:0052811 | 1-phosphatidylinositol-5-phosphate 4-kinase activity(GO:0016309) 1-phosphatidylinositol-3-phosphate 4-kinase activity(GO:0052811) |
| 0.3 | 2.8 | GO:0086006 | voltage-gated sodium channel activity involved in cardiac muscle cell action potential(GO:0086006) |
| 0.3 | 6.8 | GO:0051430 | corticotropin-releasing hormone receptor 1 binding(GO:0051430) |
| 0.3 | 1.3 | GO:0000268 | peroxisome targeting sequence binding(GO:0000268) |
| 0.2 | 17.8 | GO:0004683 | calmodulin-dependent protein kinase activity(GO:0004683) |
| 0.2 | 2.2 | GO:0008597 | calcium-dependent protein serine/threonine phosphatase regulator activity(GO:0008597) |
| 0.2 | 2.8 | GO:0004971 | AMPA glutamate receptor activity(GO:0004971) |
| 0.2 | 1.3 | GO:0015183 | L-aspartate transmembrane transporter activity(GO:0015183) |
| 0.2 | 1.5 | GO:0030144 | alpha-1,6-mannosylglycoprotein 6-beta-N-acetylglucosaminyltransferase activity(GO:0030144) |
| 0.2 | 4.8 | GO:0003680 | AT DNA binding(GO:0003680) |
| 0.2 | 0.8 | GO:0004605 | phosphatidate cytidylyltransferase activity(GO:0004605) |
| 0.2 | 0.6 | GO:0070336 | flap-structured DNA binding(GO:0070336) |
| 0.2 | 0.6 | GO:0005308 | creatine transmembrane transporter activity(GO:0005308) |
| 0.2 | 0.6 | GO:0031783 | corticotropin hormone receptor binding(GO:0031780) type 5 melanocortin receptor binding(GO:0031783) |
| 0.2 | 1.0 | GO:0044736 | acid-sensing ion channel activity(GO:0044736) |
| 0.2 | 0.6 | GO:0015140 | malate transmembrane transporter activity(GO:0015140) |
| 0.2 | 1.3 | GO:0005324 | long-chain fatty acid transporter activity(GO:0005324) |
| 0.2 | 0.9 | GO:0031694 | alpha-2A adrenergic receptor binding(GO:0031694) |
| 0.2 | 1.1 | GO:0004741 | [pyruvate dehydrogenase (lipoamide)] phosphatase activity(GO:0004741) |
| 0.2 | 1.4 | GO:0045134 | uridine-diphosphatase activity(GO:0045134) |
| 0.2 | 0.9 | GO:0008466 | glycogenin glucosyltransferase activity(GO:0008466) |
| 0.2 | 0.7 | GO:0035939 | microsatellite binding(GO:0035939) |
| 0.2 | 1.0 | GO:0047696 | beta-adrenergic receptor kinase activity(GO:0047696) |
| 0.2 | 1.1 | GO:0008273 | calcium, potassium:sodium antiporter activity(GO:0008273) |
| 0.2 | 1.5 | GO:0004727 | prenylated protein tyrosine phosphatase activity(GO:0004727) |
| 0.2 | 1.4 | GO:0003828 | alpha-N-acetylneuraminate alpha-2,8-sialyltransferase activity(GO:0003828) |
| 0.2 | 0.6 | GO:0047676 | arachidonate-CoA ligase activity(GO:0047676) |
| 0.1 | 2.2 | GO:0046870 | cadmium ion binding(GO:0046870) |
| 0.1 | 0.6 | GO:0035241 | protein-arginine omega-N monomethyltransferase activity(GO:0035241) |
| 0.1 | 0.9 | GO:0016900 | oxidoreductase activity, acting on the CH-OH group of donors, disulfide as acceptor(GO:0016900) vitamin-K-epoxide reductase (warfarin-sensitive) activity(GO:0047057) |
| 0.1 | 0.4 | GO:0036009 | protein-glutamine N-methyltransferase activity(GO:0036009) histone-glutamine methyltransferase activity(GO:1990259) |
| 0.1 | 0.6 | GO:0048763 | calcium-induced calcium release activity(GO:0048763) |
| 0.1 | 0.8 | GO:0015018 | galactosylgalactosylxylosylprotein 3-beta-glucuronosyltransferase activity(GO:0015018) |
| 0.1 | 0.7 | GO:0005298 | proline:sodium symporter activity(GO:0005298) |
| 0.1 | 0.7 | GO:0035800 | deubiquitinase activator activity(GO:0035800) |
| 0.1 | 0.5 | GO:0001626 | nociceptin receptor activity(GO:0001626) |
| 0.1 | 0.4 | GO:0061598 | nitrate reductase activity(GO:0008940) molybdopterin adenylyltransferase activity(GO:0061598) molybdopterin molybdotransferase activity(GO:0061599) |
| 0.1 | 0.4 | GO:0008294 | calcium- and calmodulin-responsive adenylate cyclase activity(GO:0008294) |
| 0.1 | 1.0 | GO:0003873 | 6-phosphofructo-2-kinase activity(GO:0003873) |
| 0.1 | 0.3 | GO:0003826 | alpha-ketoacid dehydrogenase activity(GO:0003826) 3-methyl-2-oxobutanoate dehydrogenase (2-methylpropanoyl-transferring) activity(GO:0003863) |
| 0.1 | 1.5 | GO:0035005 | 1-phosphatidylinositol-4-phosphate 3-kinase activity(GO:0035005) |
| 0.1 | 0.4 | GO:0030550 | acetylcholine receptor inhibitor activity(GO:0030550) |
| 0.1 | 1.4 | GO:0015288 | porin activity(GO:0015288) |
| 0.1 | 1.0 | GO:0034648 | histone demethylase activity (H3-dimethyl-K4 specific)(GO:0034648) |
| 0.1 | 1.1 | GO:0016286 | small conductance calcium-activated potassium channel activity(GO:0016286) |
| 0.1 | 1.4 | GO:0008568 | microtubule-severing ATPase activity(GO:0008568) |
| 0.1 | 0.8 | GO:0031849 | olfactory receptor binding(GO:0031849) |
| 0.1 | 0.5 | GO:0003990 | acetylcholinesterase activity(GO:0003990) |
| 0.1 | 0.6 | GO:0001888 | glucuronyl-galactosyl-proteoglycan 4-alpha-N-acetylglucosaminyltransferase activity(GO:0001888) |
| 0.1 | 0.6 | GO:0004719 | protein-L-isoaspartate (D-aspartate) O-methyltransferase activity(GO:0004719) |
| 0.1 | 3.0 | GO:0048156 | tau protein binding(GO:0048156) |
| 0.1 | 2.2 | GO:0005537 | mannose binding(GO:0005537) |
| 0.1 | 0.8 | GO:0004972 | NMDA glutamate receptor activity(GO:0004972) |
| 0.1 | 0.5 | GO:0005127 | ciliary neurotrophic factor receptor binding(GO:0005127) |
| 0.1 | 0.9 | GO:0050682 | AF-2 domain binding(GO:0050682) |
| 0.1 | 0.9 | GO:0033857 | diphosphoinositol-pentakisphosphate kinase activity(GO:0033857) |
| 0.1 | 1.4 | GO:0050291 | sphingosine N-acyltransferase activity(GO:0050291) |
| 0.1 | 0.9 | GO:0004396 | glucokinase activity(GO:0004340) hexokinase activity(GO:0004396) fructokinase activity(GO:0008865) mannokinase activity(GO:0019158) |
| 0.1 | 0.4 | GO:0048403 | brain-derived neurotrophic factor binding(GO:0048403) |
| 0.1 | 0.7 | GO:0004137 | deoxycytidine kinase activity(GO:0004137) |
| 0.1 | 0.3 | GO:0001588 | dopamine neurotransmitter receptor activity, coupled via Gs(GO:0001588) |
| 0.1 | 2.5 | GO:0043422 | protein kinase B binding(GO:0043422) |
| 0.1 | 0.7 | GO:0004614 | phosphoglucomutase activity(GO:0004614) |
| 0.1 | 1.1 | GO:0001162 | RNA polymerase II intronic transcription regulatory region sequence-specific DNA binding(GO:0001162) |
| 0.1 | 0.8 | GO:1990226 | histone methyltransferase binding(GO:1990226) |
| 0.1 | 1.1 | GO:0015129 | lactate transmembrane transporter activity(GO:0015129) |
| 0.1 | 0.3 | GO:0004077 | biotin-[acetyl-CoA-carboxylase] ligase activity(GO:0004077) biotin-[methylcrotonoyl-CoA-carboxylase] ligase activity(GO:0004078) biotin-[methylmalonyl-CoA-carboxytransferase] ligase activity(GO:0004079) biotin-[propionyl-CoA-carboxylase (ATP-hydrolyzing)] ligase activity(GO:0004080) biotin-protein ligase activity(GO:0018271) |
| 0.1 | 1.7 | GO:0052629 | phosphatidylinositol-3,5-bisphosphate 3-phosphatase activity(GO:0052629) |
| 0.1 | 1.4 | GO:0004596 | peptide alpha-N-acetyltransferase activity(GO:0004596) |
| 0.1 | 1.9 | GO:0004143 | diacylglycerol kinase activity(GO:0004143) |
| 0.1 | 0.4 | GO:0035515 | oxidative RNA demethylase activity(GO:0035515) |
| 0.1 | 1.1 | GO:0047144 | 2-acylglycerol-3-phosphate O-acyltransferase activity(GO:0047144) |
| 0.1 | 0.1 | GO:0000404 | heteroduplex DNA loop binding(GO:0000404) |
| 0.1 | 0.4 | GO:0070004 | cysteine-type carboxypeptidase activity(GO:0016807) cysteine-type exopeptidase activity(GO:0070004) |
| 0.1 | 2.6 | GO:0030506 | ankyrin binding(GO:0030506) |
| 0.1 | 1.8 | GO:0008191 | metalloendopeptidase inhibitor activity(GO:0008191) |
| 0.1 | 0.2 | GO:0001003 | polymerase III regulatory region sequence-specific DNA binding(GO:0000992) RNA polymerase III type 1 promoter sequence-specific DNA binding(GO:0001002) RNA polymerase III type 2 promoter sequence-specific DNA binding(GO:0001003) |
| 0.1 | 0.3 | GO:0004698 | calcium-dependent protein kinase C activity(GO:0004698) calcium-dependent protein serine/threonine kinase activity(GO:0009931) calcium-dependent protein kinase activity(GO:0010857) |
| 0.1 | 0.6 | GO:0046974 | histone methyltransferase activity (H3-K9 specific)(GO:0046974) |
| 0.1 | 1.3 | GO:0019911 | structural constituent of myelin sheath(GO:0019911) |
| 0.1 | 2.9 | GO:0003785 | actin monomer binding(GO:0003785) |
| 0.1 | 0.2 | GO:0005169 | neurotrophin TRKB receptor binding(GO:0005169) |
| 0.1 | 0.6 | GO:0015277 | kainate selective glutamate receptor activity(GO:0015277) |
| 0.1 | 1.2 | GO:0042577 | lipid phosphatase activity(GO:0042577) |
| 0.1 | 1.5 | GO:0030215 | semaphorin receptor binding(GO:0030215) |
| 0.1 | 0.5 | GO:0001517 | N-acetylglucosamine 6-O-sulfotransferase activity(GO:0001517) |
| 0.1 | 3.1 | GO:0017075 | syntaxin-1 binding(GO:0017075) |
| 0.1 | 0.3 | GO:0046933 | proton-transporting ATP synthase activity, rotational mechanism(GO:0046933) |
| 0.1 | 0.3 | GO:0050220 | prostaglandin-E synthase activity(GO:0050220) |
| 0.1 | 0.3 | GO:0045485 | omega-6 fatty acid desaturase activity(GO:0045485) |
| 0.1 | 4.5 | GO:0042169 | SH2 domain binding(GO:0042169) |
| 0.1 | 0.4 | GO:0004111 | creatine kinase activity(GO:0004111) |
| 0.1 | 0.9 | GO:0015379 | potassium:chloride symporter activity(GO:0015379) potassium ion symporter activity(GO:0022820) |
| 0.1 | 1.4 | GO:0005328 | neurotransmitter:sodium symporter activity(GO:0005328) |
| 0.1 | 0.5 | GO:0000213 | tRNA-intron endonuclease activity(GO:0000213) |
| 0.1 | 1.4 | GO:0005068 | transmembrane receptor protein tyrosine kinase adaptor activity(GO:0005068) |
| 0.1 | 0.3 | GO:1990430 | extracellular matrix protein binding(GO:1990430) |
| 0.1 | 1.0 | GO:0004115 | 3',5'-cyclic-AMP phosphodiesterase activity(GO:0004115) |
| 0.1 | 2.0 | GO:0008331 | high voltage-gated calcium channel activity(GO:0008331) |
| 0.1 | 0.2 | GO:0005093 | Rab GDP-dissociation inhibitor activity(GO:0005093) |
| 0.0 | 0.4 | GO:0097109 | neuroligin family protein binding(GO:0097109) |
| 0.0 | 1.5 | GO:0042043 | neurexin family protein binding(GO:0042043) |
| 0.0 | 0.5 | GO:0000155 | phosphorelay sensor kinase activity(GO:0000155) |
| 0.0 | 0.3 | GO:0003987 | acetate-CoA ligase activity(GO:0003987) |
| 0.0 | 0.1 | GO:0010698 | acetyltransferase activator activity(GO:0010698) |
| 0.0 | 0.5 | GO:0019784 | NEDD8-specific protease activity(GO:0019784) |
| 0.0 | 1.6 | GO:0008574 | ATP-dependent microtubule motor activity, plus-end-directed(GO:0008574) |
| 0.0 | 0.2 | GO:0046921 | glycoprotein 6-alpha-L-fucosyltransferase activity(GO:0008424) alpha-(1->6)-fucosyltransferase activity(GO:0046921) |
| 0.0 | 4.1 | GO:0051018 | protein kinase A binding(GO:0051018) |
| 0.0 | 1.2 | GO:0043495 | protein anchor(GO:0043495) |
| 0.0 | 1.4 | GO:0016505 | peptidase activator activity involved in apoptotic process(GO:0016505) |
| 0.0 | 1.0 | GO:0015467 | G-protein activated inward rectifier potassium channel activity(GO:0015467) |
| 0.0 | 0.4 | GO:0051959 | dynein light intermediate chain binding(GO:0051959) |
| 0.0 | 0.7 | GO:0086080 | protein binding involved in heterotypic cell-cell adhesion(GO:0086080) |
| 0.0 | 0.1 | GO:0050146 | nucleoside phosphotransferase activity(GO:0050146) |
| 0.0 | 0.5 | GO:0046975 | histone methyltransferase activity (H3-K36 specific)(GO:0046975) |
| 0.0 | 0.4 | GO:0005078 | MAP-kinase scaffold activity(GO:0005078) |
| 0.0 | 3.5 | GO:0045182 | translation regulator activity(GO:0045182) |
| 0.0 | 1.9 | GO:0001784 | phosphotyrosine binding(GO:0001784) |
| 0.0 | 2.2 | GO:0015459 | potassium channel regulator activity(GO:0015459) |
| 0.0 | 0.8 | GO:0010485 | H4 histone acetyltransferase activity(GO:0010485) |
| 0.0 | 3.2 | GO:0019003 | GDP binding(GO:0019003) |
| 0.0 | 1.5 | GO:0008157 | protein phosphatase 1 binding(GO:0008157) |
| 0.0 | 0.3 | GO:0016618 | hydroxypyruvate reductase activity(GO:0016618) glyoxylate reductase (NADP) activity(GO:0030267) |
| 0.0 | 0.3 | GO:0032190 | acrosin binding(GO:0032190) |
| 0.0 | 1.1 | GO:0051537 | 2 iron, 2 sulfur cluster binding(GO:0051537) |
| 0.0 | 0.9 | GO:0008266 | poly(U) RNA binding(GO:0008266) |
| 0.0 | 2.2 | GO:0030552 | cAMP binding(GO:0030552) |
| 0.0 | 1.1 | GO:0015269 | calcium-activated potassium channel activity(GO:0015269) |
| 0.0 | 10.0 | GO:0003729 | mRNA binding(GO:0003729) poly(A) RNA binding(GO:0044822) |
| 0.0 | 0.2 | GO:0035402 | histone kinase activity (H3-T11 specific)(GO:0035402) |
| 0.0 | 1.7 | GO:0017091 | AU-rich element binding(GO:0017091) |
| 0.0 | 1.6 | GO:0004709 | MAP kinase kinase kinase activity(GO:0004709) |
| 0.0 | 0.2 | GO:0061513 | hexose phosphate transmembrane transporter activity(GO:0015119) organophosphate:inorganic phosphate antiporter activity(GO:0015315) hexose-phosphate:inorganic phosphate antiporter activity(GO:0015526) glucose 6-phosphate:inorganic phosphate antiporter activity(GO:0061513) |
| 0.0 | 0.3 | GO:0030160 | GKAP/Homer scaffold activity(GO:0030160) |
| 0.0 | 0.2 | GO:0004803 | transposase activity(GO:0004803) |
| 0.0 | 3.1 | GO:0005544 | calcium-dependent phospholipid binding(GO:0005544) |
| 0.0 | 0.4 | GO:0032137 | guanine/thymine mispair binding(GO:0032137) |
| 0.0 | 0.9 | GO:0051010 | microtubule plus-end binding(GO:0051010) |
| 0.0 | 1.2 | GO:0005001 | transmembrane receptor protein tyrosine phosphatase activity(GO:0005001) transmembrane receptor protein phosphatase activity(GO:0019198) |
| 0.0 | 0.1 | GO:0045504 | dynein heavy chain binding(GO:0045504) |
| 0.0 | 6.9 | GO:0017137 | Rab GTPase binding(GO:0017137) |
| 0.0 | 2.1 | GO:0017080 | sodium channel regulator activity(GO:0017080) |
| 0.0 | 1.0 | GO:0005388 | calcium-transporting ATPase activity(GO:0005388) |
| 0.0 | 0.5 | GO:0008093 | cytoskeletal adaptor activity(GO:0008093) |
| 0.0 | 0.5 | GO:0030618 | transforming growth factor beta receptor, pathway-specific cytoplasmic mediator activity(GO:0030618) |
| 0.0 | 2.8 | GO:0003777 | microtubule motor activity(GO:0003777) |
| 0.0 | 0.8 | GO:0097602 | cullin family protein binding(GO:0097602) |
| 0.0 | 0.2 | GO:0005499 | vitamin D binding(GO:0005499) |
| 0.0 | 0.2 | GO:0034597 | phosphatidylinositol-3,4-bisphosphate 4-phosphatase activity(GO:0016316) inositol-1,3,4-trisphosphate 4-phosphatase activity(GO:0017161) phosphatidylinositol-4,5-bisphosphate 4-phosphatase activity(GO:0034597) inositol-3,4-bisphosphate 4-phosphatase activity(GO:0052828) |
| 0.0 | 0.8 | GO:0004653 | polypeptide N-acetylgalactosaminyltransferase activity(GO:0004653) |
| 0.0 | 0.4 | GO:0001056 | RNA polymerase III activity(GO:0001056) |
| 0.0 | 0.6 | GO:0001013 | RNA polymerase I regulatory region DNA binding(GO:0001013) RNA polymerase I regulatory region sequence-specific DNA binding(GO:0001163) RNA polymerase I CORE element sequence-specific DNA binding(GO:0001164) |
| 0.0 | 0.9 | GO:0043548 | phosphatidylinositol 3-kinase binding(GO:0043548) |
| 0.0 | 5.1 | GO:0005178 | integrin binding(GO:0005178) |
| 0.0 | 1.4 | GO:0005154 | epidermal growth factor receptor binding(GO:0005154) |
| 0.0 | 0.1 | GO:0047751 | 3-oxo-5-alpha-steroid 4-dehydrogenase activity(GO:0003865) steroid dehydrogenase activity, acting on the CH-CH group of donors(GO:0033765) cholestenone 5-alpha-reductase activity(GO:0047751) |
| 0.0 | 5.9 | GO:0005200 | structural constituent of cytoskeleton(GO:0005200) |
| 0.0 | 0.1 | GO:0033142 | progesterone receptor binding(GO:0033142) |
| 0.0 | 3.0 | GO:0030165 | PDZ domain binding(GO:0030165) |
| 0.0 | 0.8 | GO:0017160 | Ral GTPase binding(GO:0017160) |
| 0.0 | 0.4 | GO:0031681 | G-protein beta-subunit binding(GO:0031681) |
| 0.0 | 1.1 | GO:0004693 | cyclin-dependent protein serine/threonine kinase activity(GO:0004693) |
| 0.0 | 0.1 | GO:0030911 | TPR domain binding(GO:0030911) |
| 0.0 | 0.4 | GO:0016247 | channel regulator activity(GO:0016247) |
| 0.0 | 0.4 | GO:0001055 | RNA polymerase II activity(GO:0001055) |
| 0.0 | 0.1 | GO:0031871 | proteinase activated receptor binding(GO:0031871) |
| 0.0 | 0.2 | GO:0001225 | RNA polymerase II transcription coactivator binding(GO:0001225) |
| 0.0 | 0.5 | GO:0015929 | hexosaminidase activity(GO:0015929) |
| 0.0 | 0.9 | GO:0046966 | thyroid hormone receptor binding(GO:0046966) |
| 0.0 | 1.4 | GO:0005246 | calcium channel regulator activity(GO:0005246) |
| 0.0 | 0.4 | GO:0004089 | carbonate dehydratase activity(GO:0004089) |
| 0.0 | 0.4 | GO:0004017 | adenylate kinase activity(GO:0004017) |
| 0.0 | 1.0 | GO:0005164 | tumor necrosis factor receptor binding(GO:0005164) |
| 0.0 | 2.0 | GO:0004722 | protein serine/threonine phosphatase activity(GO:0004722) |
| 0.0 | 0.7 | GO:0000993 | RNA polymerase II core binding(GO:0000993) |
| 0.0 | 0.6 | GO:0004012 | phospholipid-translocating ATPase activity(GO:0004012) |
| 0.0 | 0.2 | GO:0032794 | GTPase activating protein binding(GO:0032794) |
| 0.0 | 0.3 | GO:0017081 | chloride channel regulator activity(GO:0017081) |
| 0.0 | 1.1 | GO:0030332 | cyclin binding(GO:0030332) |
| 0.0 | 0.2 | GO:0038132 | neuregulin binding(GO:0038132) |
| 0.0 | 2.8 | GO:0044325 | ion channel binding(GO:0044325) |
| 0.0 | 0.2 | GO:0043008 | ATP-dependent protein binding(GO:0043008) |
| 0.0 | 0.5 | GO:0043395 | heparan sulfate proteoglycan binding(GO:0043395) |
| 0.0 | 0.7 | GO:0031210 | phosphatidylcholine binding(GO:0031210) |
| 0.0 | 0.2 | GO:0016176 | superoxide-generating NADPH oxidase activator activity(GO:0016176) |
| 0.0 | 0.6 | GO:0004129 | cytochrome-c oxidase activity(GO:0004129) heme-copper terminal oxidase activity(GO:0015002) oxidoreductase activity, acting on a heme group of donors, oxygen as acceptor(GO:0016676) |
| 0.0 | 0.2 | GO:0004985 | opioid receptor activity(GO:0004985) |
| 0.0 | 0.2 | GO:0070569 | uridylyltransferase activity(GO:0070569) |
| 0.0 | 0.1 | GO:0016907 | G-protein coupled acetylcholine receptor activity(GO:0016907) |
| 0.0 | 0.5 | GO:0046965 | retinoid X receptor binding(GO:0046965) |
| 0.0 | 1.9 | GO:0001618 | virus receptor activity(GO:0001618) |
| 0.0 | 1.0 | GO:0061631 | ubiquitin conjugating enzyme activity(GO:0061631) |
| 0.0 | 0.1 | GO:0008321 | Ral guanyl-nucleotide exchange factor activity(GO:0008321) |
| 0.0 | 0.0 | GO:0036332 | VEGF-A-activated receptor activity(GO:0036326) VEGF-B-activated receptor activity(GO:0036327) placental growth factor-activated receptor activity(GO:0036332) |
| 0.0 | 0.3 | GO:0030955 | potassium ion binding(GO:0030955) |
| 0.0 | 0.8 | GO:0008188 | neuropeptide receptor activity(GO:0008188) |
| 0.0 | 2.3 | GO:0004867 | serine-type endopeptidase inhibitor activity(GO:0004867) |
| 0.0 | 0.1 | GO:0035198 | miRNA binding(GO:0035198) |
| 0.0 | 0.3 | GO:0008140 | cAMP response element binding protein binding(GO:0008140) |
| 0.0 | 0.5 | GO:0046875 | ephrin receptor binding(GO:0046875) |
| 0.0 | 0.2 | GO:0005021 | vascular endothelial growth factor-activated receptor activity(GO:0005021) |
| 0.0 | 0.0 | GO:0070052 | collagen V binding(GO:0070052) |
| 0.0 | 2.7 | GO:0017124 | SH3 domain binding(GO:0017124) |
| 0.0 | 0.2 | GO:0005225 | volume-sensitive anion channel activity(GO:0005225) |
| 0.0 | 0.4 | GO:0070016 | armadillo repeat domain binding(GO:0070016) |
| 0.0 | 0.0 | GO:0052841 | endopolyphosphatase activity(GO:0000298) diphosphoinositol-polyphosphate diphosphatase activity(GO:0008486) bis(5'-adenosyl)-hexaphosphatase activity(GO:0034431) bis(5'-adenosyl)-pentaphosphatase activity(GO:0034432) inositol diphosphate tetrakisphosphate diphosphatase activity(GO:0052840) inositol bisdiphosphate tetrakisphosphate diphosphatase activity(GO:0052841) inositol diphosphate pentakisphosphate diphosphatase activity(GO:0052842) inositol-1-diphosphate-2,3,4,5,6-pentakisphosphate diphosphatase activity(GO:0052843) inositol-3-diphosphate-1,2,4,5,6-pentakisphosphate diphosphatase activity(GO:0052844) inositol-5-diphosphate-1,2,3,4,6-pentakisphosphate diphosphatase activity(GO:0052845) inositol-1,5-bisdiphosphate-2,3,4,6-tetrakisphosphate 1-diphosphatase activity(GO:0052846) inositol-1,5-bisdiphosphate-2,3,4,6-tetrakisphosphate 5-diphosphatase activity(GO:0052847) inositol-3,5-bisdiphosphate-2,3,4,6-tetrakisphosphate 5-diphosphatase activity(GO:0052848) |
| 0.0 | 0.3 | GO:0070006 | metalloaminopeptidase activity(GO:0070006) |
| 0.0 | 0.6 | GO:0003950 | NAD+ ADP-ribosyltransferase activity(GO:0003950) |
| 0.0 | 0.4 | GO:0070530 | K63-linked polyubiquitin binding(GO:0070530) |
| 0.0 | 0.1 | GO:1990247 | N6-methyladenosine-containing RNA binding(GO:1990247) |
| 0.0 | 0.2 | GO:0016290 | palmitoyl-CoA hydrolase activity(GO:0016290) |
| 0.0 | 0.1 | GO:0102008 | cytosolic dipeptidase activity(GO:0102008) |
| 0.0 | 0.1 | GO:0015245 | fatty acid transporter activity(GO:0015245) |
| 0.0 | 0.0 | GO:0016263 | glycoprotein-N-acetylgalactosamine 3-beta-galactosyltransferase activity(GO:0016263) |
| 0.0 | 0.6 | GO:0000049 | tRNA binding(GO:0000049) |
| 0.0 | 0.2 | GO:0098505 | G-rich strand telomeric DNA binding(GO:0098505) |
| 0.0 | 0.9 | GO:0008080 | N-acetyltransferase activity(GO:0008080) |
| 0.0 | 0.1 | GO:0042975 | peroxisome proliferator activated receptor binding(GO:0042975) |
| 0.0 | 0.2 | GO:0015095 | magnesium ion transmembrane transporter activity(GO:0015095) |
| 0.0 | 0.3 | GO:0102391 | decanoate--CoA ligase activity(GO:0102391) |
| 0.0 | 0.4 | GO:0030515 | snoRNA binding(GO:0030515) |
Gene overrepresentation in curated gene sets: canonical pathways category:
| Log-likelihood per target | Total log-likelihood | Term | Description |
|---|---|---|---|
| 0.3 | 16.6 | PID P38 MKK3 6PATHWAY | p38 MAPK signaling pathway |
| 0.3 | 5.8 | PID P38 GAMMA DELTA PATHWAY | Signaling mediated by p38-gamma and p38-delta |
| 0.2 | 1.2 | PID MET PATHWAY | Signaling events mediated by Hepatocyte Growth Factor Receptor (c-Met) |
| 0.1 | 7.7 | PID MAPK TRK PATHWAY | Trk receptor signaling mediated by the MAPK pathway |
| 0.1 | 0.3 | PID IFNG PATHWAY | IFN-gamma pathway |
| 0.1 | 5.1 | PID TCR CALCIUM PATHWAY | Calcium signaling in the CD4+ TCR pathway |
| 0.1 | 7.9 | PID ERBB1 INTERNALIZATION PATHWAY | Internalization of ErbB1 |
| 0.1 | 1.5 | PID S1P S1P4 PATHWAY | S1P4 pathway |
| 0.1 | 2.4 | PID PRL SIGNALING EVENTS PATHWAY | Signaling events mediated by PRL |
| 0.0 | 0.6 | PID ERB GENOMIC PATHWAY | Validated nuclear estrogen receptor beta network |
| 0.0 | 2.1 | PID ERBB2 ERBB3 PATHWAY | ErbB2/ErbB3 signaling events |
| 0.0 | 2.7 | PID NCADHERIN PATHWAY | N-cadherin signaling events |
| 0.0 | 5.3 | PID ERA GENOMIC PATHWAY | Validated nuclear estrogen receptor alpha network |
| 0.0 | 1.8 | PID HDAC CLASSIII PATHWAY | Signaling events mediated by HDAC Class III |
| 0.0 | 1.7 | PID RET PATHWAY | Signaling events regulated by Ret tyrosine kinase |
| 0.0 | 4.3 | ST FAS SIGNALING PATHWAY | Fas Signaling Pathway |
| 0.0 | 1.7 | PID P38 ALPHA BETA PATHWAY | Regulation of p38-alpha and p38-beta |
| 0.0 | 0.5 | PID RAC1 PATHWAY | RAC1 signaling pathway |
| 0.0 | 0.7 | PID FANCONI PATHWAY | Fanconi anemia pathway |
| 0.0 | 1.2 | PID SMAD2 3PATHWAY | Regulation of cytoplasmic and nuclear SMAD2/3 signaling |
| 0.0 | 0.6 | ST G ALPHA S PATHWAY | G alpha s Pathway |
| 0.0 | 1.4 | PID FCER1 PATHWAY | Fc-epsilon receptor I signaling in mast cells |
| 0.0 | 1.7 | PID ATR PATHWAY | ATR signaling pathway |
| 0.0 | 0.9 | PID ALPHA SYNUCLEIN PATHWAY | Alpha-synuclein signaling |
| 0.0 | 0.7 | PID REELIN PATHWAY | Reelin signaling pathway |
| 0.0 | 1.5 | PID MTOR 4PATHWAY | mTOR signaling pathway |
| 0.0 | 1.8 | PID CASPASE PATHWAY | Caspase cascade in apoptosis |
| 0.0 | 2.2 | PID RAC1 REG PATHWAY | Regulation of RAC1 activity |
| 0.0 | 1.0 | PID KIT PATHWAY | Signaling events mediated by Stem cell factor receptor (c-Kit) |
| 0.0 | 0.4 | SA PROGRAMMED CELL DEATH | Programmed cell death, or apoptosis, eliminates damaged or unneeded cells. |
| 0.0 | 0.5 | PID PI3K PLC TRK PATHWAY | Trk receptor signaling mediated by PI3K and PLC-gamma |
| 0.0 | 0.2 | PID EPHA2 FWD PATHWAY | EPHA2 forward signaling |
| 0.0 | 1.4 | PID P75 NTR PATHWAY | p75(NTR)-mediated signaling |
| 0.0 | 0.3 | PID AP1 PATHWAY | AP-1 transcription factor network |
| 0.0 | 0.6 | PID BCR 5PATHWAY | BCR signaling pathway |
| 0.0 | 0.3 | PID RANBP2 PATHWAY | Sumoylation by RanBP2 regulates transcriptional repression |
| 0.0 | 0.5 | PID WNT CANONICAL PATHWAY | Canonical Wnt signaling pathway |
| 0.0 | 0.3 | PID NECTIN PATHWAY | Nectin adhesion pathway |
| 0.0 | 1.2 | PID ILK PATHWAY | Integrin-linked kinase signaling |
| 0.0 | 0.9 | NABA PROTEOGLYCANS | Genes encoding proteoglycans |
| 0.0 | 0.3 | ST P38 MAPK PATHWAY | p38 MAPK Pathway |
| 0.0 | 0.3 | PID INSULIN PATHWAY | Insulin Pathway |
| 0.0 | 0.2 | PID GLYPICAN 1PATHWAY | Glypican 1 network |
| 0.0 | 0.3 | ST B CELL ANTIGEN RECEPTOR | B Cell Antigen Receptor |
| 0.0 | 0.4 | PID TNF PATHWAY | TNF receptor signaling pathway |
| 0.0 | 0.4 | SIG INSULIN RECEPTOR PATHWAY IN CARDIAC MYOCYTES | Genes related to the insulin receptor pathway |
| 0.0 | 0.2 | PID UPA UPAR PATHWAY | Urokinase-type plasminogen activator (uPA) and uPAR-mediated signaling |
| 0.0 | 0.5 | PID CD8 TCR DOWNSTREAM PATHWAY | Downstream signaling in naïve CD8+ T cells |
Gene overrepresentation in curated gene sets: REACTOME pathways category:
| Log-likelihood per target | Total log-likelihood | Term | Description |
|---|---|---|---|
| 0.5 | 21.4 | REACTOME RAS ACTIVATION UOPN CA2 INFUX THROUGH NMDA RECEPTOR | Genes involved in Ras activation uopn Ca2+ infux through NMDA receptor |
| 0.2 | 2.8 | REACTOME UNBLOCKING OF NMDA RECEPTOR GLUTAMATE BINDING AND ACTIVATION | Genes involved in Unblocking of NMDA receptor, glutamate binding and activation |
| 0.2 | 2.2 | REACTOME TRAFFICKING OF GLUR2 CONTAINING AMPA RECEPTORS | Genes involved in Trafficking of GluR2-containing AMPA receptors |
| 0.2 | 6.5 | REACTOME CASPASE MEDIATED CLEAVAGE OF CYTOSKELETAL PROTEINS | Genes involved in Caspase-mediated cleavage of cytoskeletal proteins |
| 0.1 | 7.6 | REACTOME ERK MAPK TARGETS | Genes involved in ERK/MAPK targets |
| 0.1 | 5.3 | REACTOME PROSTACYCLIN SIGNALLING THROUGH PROSTACYCLIN RECEPTOR | Genes involved in Prostacyclin signalling through prostacyclin receptor |
| 0.1 | 4.2 | REACTOME PYRUVATE METABOLISM | Genes involved in Pyruvate metabolism |
| 0.1 | 3.2 | REACTOME RETROGRADE NEUROTROPHIN SIGNALLING | Genes involved in Retrograde neurotrophin signalling |
| 0.1 | 5.0 | REACTOME DARPP 32 EVENTS | Genes involved in DARPP-32 events |
| 0.1 | 2.4 | REACTOME INSULIN SYNTHESIS AND PROCESSING | Genes involved in Insulin Synthesis and Processing |
| 0.1 | 1.8 | REACTOME P38MAPK EVENTS | Genes involved in p38MAPK events |
| 0.1 | 2.4 | REACTOME DOPAMINE NEUROTRANSMITTER RELEASE CYCLE | Genes involved in Dopamine Neurotransmitter Release Cycle |
| 0.1 | 3.5 | REACTOME KINESINS | Genes involved in Kinesins |
| 0.1 | 2.1 | REACTOME ABCA TRANSPORTERS IN LIPID HOMEOSTASIS | Genes involved in ABCA transporters in lipid homeostasis |
| 0.1 | 4.9 | REACTOME SYNTHESIS OF PIPS AT THE PLASMA MEMBRANE | Genes involved in Synthesis of PIPs at the plasma membrane |
| 0.1 | 2.5 | REACTOME NA CL DEPENDENT NEUROTRANSMITTER TRANSPORTERS | Genes involved in Na+/Cl- dependent neurotransmitter transporters |
| 0.1 | 2.6 | REACTOME P130CAS LINKAGE TO MAPK SIGNALING FOR INTEGRINS | Genes involved in p130Cas linkage to MAPK signaling for integrins |
| 0.1 | 1.9 | REACTOME G PROTEIN ACTIVATION | Genes involved in G-protein activation |
| 0.1 | 4.0 | REACTOME ADHERENS JUNCTIONS INTERACTIONS | Genes involved in Adherens junctions interactions |
| 0.1 | 0.3 | REACTOME ACYL CHAIN REMODELLING OF PS | Genes involved in Acyl chain remodelling of PS |
| 0.1 | 1.0 | REACTOME SOS MEDIATED SIGNALLING | Genes involved in SOS-mediated signalling |
| 0.1 | 1.2 | REACTOME GABA SYNTHESIS RELEASE REUPTAKE AND DEGRADATION | Genes involved in GABA synthesis, release, reuptake and degradation |
| 0.1 | 3.2 | REACTOME INTERACTION BETWEEN L1 AND ANKYRINS | Genes involved in Interaction between L1 and Ankyrins |
| 0.1 | 1.2 | REACTOME RECRUITMENT OF NUMA TO MITOTIC CENTROSOMES | Genes involved in Recruitment of NuMA to mitotic centrosomes |
| 0.1 | 2.4 | REACTOME SIGNALING BY NODAL | Genes involved in Signaling by NODAL |
| 0.1 | 1.5 | REACTOME PROCESSING OF INTRONLESS PRE MRNAS | Genes involved in Processing of Intronless Pre-mRNAs |
| 0.0 | 0.8 | REACTOME SYNTHESIS OF PIPS AT THE LATE ENDOSOME MEMBRANE | Genes involved in Synthesis of PIPs at the late endosome membrane |
| 0.0 | 0.7 | REACTOME MRNA DECAY BY 3 TO 5 EXORIBONUCLEASE | Genes involved in mRNA Decay by 3' to 5' Exoribonuclease |
| 0.0 | 1.6 | REACTOME REGULATION OF AMPK ACTIVITY VIA LKB1 | Genes involved in Regulation of AMPK activity via LKB1 |
| 0.0 | 0.8 | REACTOME NEF MEDIATED DOWNREGULATION OF MHC CLASS I COMPLEX CELL SURFACE EXPRESSION | Genes involved in Nef mediated downregulation of MHC class I complex cell surface expression |
| 0.0 | 2.7 | REACTOME SIGNALING BY ROBO RECEPTOR | Genes involved in Signaling by Robo receptor |
| 0.0 | 0.9 | REACTOME GLYCOGEN BREAKDOWN GLYCOGENOLYSIS | Genes involved in Glycogen breakdown (glycogenolysis) |
| 0.0 | 1.7 | REACTOME SEMA4D INDUCED CELL MIGRATION AND GROWTH CONE COLLAPSE | Genes involved in Sema4D induced cell migration and growth-cone collapse |
| 0.0 | 0.5 | REACTOME KERATAN SULFATE KERATIN METABOLISM | Genes involved in Keratan sulfate/keratin metabolism |
| 0.0 | 1.0 | REACTOME INHIBITION OF VOLTAGE GATED CA2 CHANNELS VIA GBETA GAMMA SUBUNITS | Genes involved in Inhibition of voltage gated Ca2+ channels via Gbeta/gamma subunits |
| 0.0 | 1.4 | REACTOME CELL EXTRACELLULAR MATRIX INTERACTIONS | Genes involved in Cell-extracellular matrix interactions |
| 0.0 | 1.2 | REACTOME IL RECEPTOR SHC SIGNALING | Genes involved in Interleukin receptor SHC signaling |
| 0.0 | 1.9 | REACTOME ASSOCIATION OF TRIC CCT WITH TARGET PROTEINS DURING BIOSYNTHESIS | Genes involved in Association of TriC/CCT with target proteins during biosynthesis |
| 0.0 | 0.9 | REACTOME EGFR DOWNREGULATION | Genes involved in EGFR downregulation |
| 0.0 | 2.0 | REACTOME GLUCOSE TRANSPORT | Genes involved in Glucose transport |
| 0.0 | 0.7 | REACTOME LYSOSOME VESICLE BIOGENESIS | Genes involved in Lysosome Vesicle Biogenesis |
| 0.0 | 2.9 | REACTOME GLUCOSE METABOLISM | Genes involved in Glucose metabolism |
| 0.0 | 2.0 | REACTOME STRIATED MUSCLE CONTRACTION | Genes involved in Striated Muscle Contraction |
| 0.0 | 0.7 | REACTOME ACYL CHAIN REMODELLING OF PI | Genes involved in Acyl chain remodelling of PI |
| 0.0 | 0.6 | REACTOME SIGNALING BY ERBB2 | Genes involved in Signaling by ERBB2 |
| 0.0 | 0.9 | REACTOME RAP1 SIGNALLING | Genes involved in Rap1 signalling |
| 0.0 | 0.7 | REACTOME PURINE SALVAGE | Genes involved in Purine salvage |
| 0.0 | 3.0 | REACTOME NRAGE SIGNALS DEATH THROUGH JNK | Genes involved in NRAGE signals death through JNK |
| 0.0 | 2.4 | REACTOME RECRUITMENT OF MITOTIC CENTROSOME PROTEINS AND COMPLEXES | Genes involved in Recruitment of mitotic centrosome proteins and complexes |
| 0.0 | 0.4 | REACTOME RNA POL III CHAIN ELONGATION | Genes involved in RNA Polymerase III Chain Elongation |
| 0.0 | 0.4 | REACTOME REVERSIBLE HYDRATION OF CARBON DIOXIDE | Genes involved in Reversible Hydration of Carbon Dioxide |
| 0.0 | 0.9 | REACTOME SYNTHESIS OF VERY LONG CHAIN FATTY ACYL COAS | Genes involved in Synthesis of very long-chain fatty acyl-CoAs |
| 0.0 | 3.8 | REACTOME SIGNALING BY RHO GTPASES | Genes involved in Signaling by Rho GTPases |
| 0.0 | 7.5 | REACTOME ANTIGEN PROCESSING UBIQUITINATION PROTEASOME DEGRADATION | Genes involved in Antigen processing: Ubiquitination & Proteasome degradation |
| 0.0 | 0.9 | REACTOME REGULATORY RNA PATHWAYS | Genes involved in Regulatory RNA pathways |
| 0.0 | 0.8 | REACTOME PLATELET CALCIUM HOMEOSTASIS | Genes involved in Platelet calcium homeostasis |
| 0.0 | 0.6 | REACTOME IONOTROPIC ACTIVITY OF KAINATE RECEPTORS | Genes involved in Ionotropic activity of Kainate Receptors |
| 0.0 | 0.4 | REACTOME PRE NOTCH PROCESSING IN GOLGI | Genes involved in Pre-NOTCH Processing in Golgi |
| 0.0 | 0.3 | REACTOME ETHANOL OXIDATION | Genes involved in Ethanol oxidation |
| 0.0 | 1.6 | REACTOME RESPIRATORY ELECTRON TRANSPORT | Genes involved in Respiratory electron transport |
| 0.0 | 0.4 | REACTOME ACTIVATION OF NMDA RECEPTOR UPON GLUTAMATE BINDING AND POSTSYNAPTIC EVENTS | Genes involved in Activation of NMDA receptor upon glutamate binding and postsynaptic events |
| 0.0 | 3.2 | REACTOME TRANSMISSION ACROSS CHEMICAL SYNAPSES | Genes involved in Transmission across Chemical Synapses |
| 0.0 | 2.2 | REACTOME POTASSIUM CHANNELS | Genes involved in Potassium Channels |
| 0.0 | 0.7 | REACTOME POST TRANSLATIONAL MODIFICATION SYNTHESIS OF GPI ANCHORED PROTEINS | Genes involved in Post-translational modification: synthesis of GPI-anchored proteins |
| 0.0 | 0.3 | REACTOME PECAM1 INTERACTIONS | Genes involved in PECAM1 interactions |
| 0.0 | 0.3 | REACTOME ALPHA LINOLENIC ACID ALA METABOLISM | Genes involved in alpha-linolenic acid (ALA) metabolism |
| 0.0 | 0.1 | REACTOME IRAK1 RECRUITS IKK COMPLEX | Genes involved in IRAK1 recruits IKK complex |
| 0.0 | 0.8 | REACTOME P75 NTR RECEPTOR MEDIATED SIGNALLING | Genes involved in p75 NTR receptor-mediated signalling |
| 0.0 | 1.6 | REACTOME MITOTIC PROMETAPHASE | Genes involved in Mitotic Prometaphase |
| 0.0 | 0.1 | REACTOME REGULATION OF THE FANCONI ANEMIA PATHWAY | Genes involved in Regulation of the Fanconi anemia pathway |
| 0.0 | 0.2 | REACTOME BILE SALT AND ORGANIC ANION SLC TRANSPORTERS | Genes involved in Bile salt and organic anion SLC transporters |
| 0.0 | 0.1 | REACTOME RNA POL III TRANSCRIPTION TERMINATION | Genes involved in RNA Polymerase III Transcription Termination |