Project
Illumina Body Map 2 (GSE30611)
Navigation
Downloads
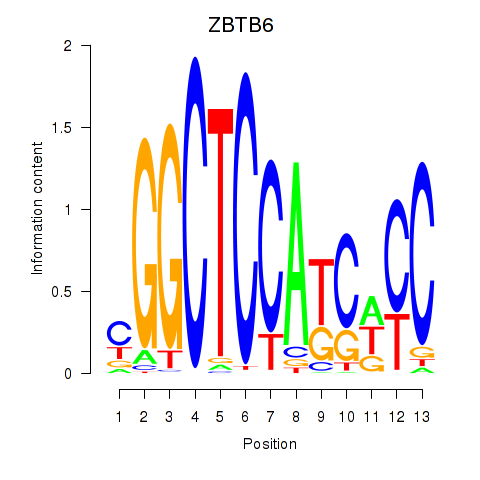
Results for ZBTB6
Z-value: 1.30
Motif logo
Transcription factors associated with ZBTB6
| Gene Symbol | Gene ID | Gene Info |
|---|---|---|
|
ZBTB6
|
ENSG00000186130.5 | zinc finger and BTB domain containing 6 |
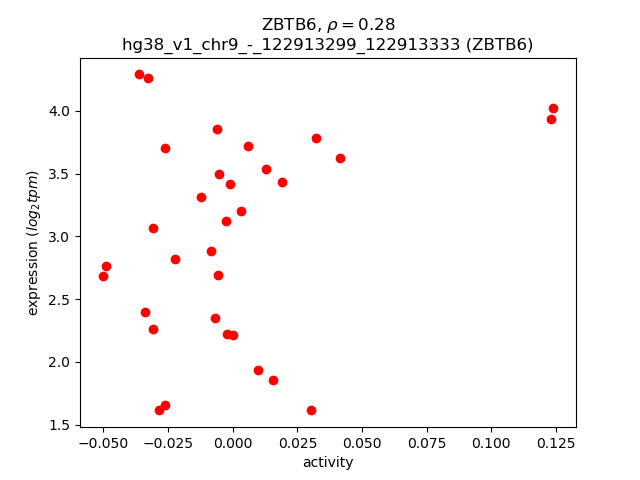
Activity-expression correlation:
| Gene | Promoter | Pearson corr. coef. | P-value | Plot |
|---|---|---|---|---|
| ZBTB6 | hg38_v1_chr9_-_122913299_122913333 | 0.28 | 1.1e-01 | Click! |
Activity profile of ZBTB6 motif
Sorted Z-values of ZBTB6 motif
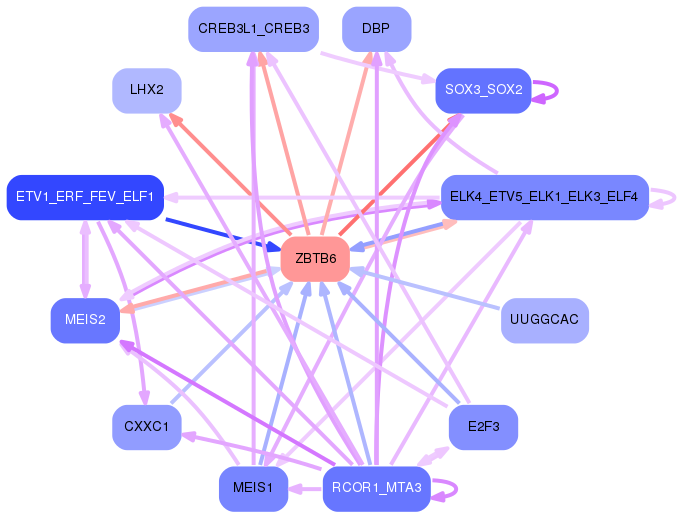
Network of associatons between targets according to the STRING database.

First level regulatory network of ZBTB6
Gene Ontology Analysis
Gene overrepresentation in biological process category:
| Log-likelihood per target | Total log-likelihood | Term | Description |
|---|---|---|---|
| 1.3 | 3.8 | GO:0099538 | synaptic signaling via neuropeptide(GO:0099538) trans-synaptic signaling by neuropeptide(GO:0099540) trans-synaptic signaling by neuropeptide, modulating synaptic transmission(GO:0099551) |
| 1.2 | 3.6 | GO:1904692 | positive regulation of type B pancreatic cell proliferation(GO:1904692) |
| 0.9 | 3.5 | GO:1904980 | positive regulation of endosome organization(GO:1904980) |
| 0.7 | 5.8 | GO:0051935 | amino acid neurotransmitter reuptake(GO:0051933) glutamate reuptake(GO:0051935) |
| 0.6 | 1.9 | GO:0042137 | sequestering of neurotransmitter(GO:0042137) |
| 0.6 | 1.8 | GO:0072720 | response to dithiothreitol(GO:0072720) |
| 0.5 | 2.5 | GO:1903575 | cornified envelope assembly(GO:1903575) |
| 0.4 | 1.3 | GO:0051877 | pigment granule aggregation in cell center(GO:0051877) |
| 0.4 | 2.9 | GO:1904048 | regulation of spontaneous neurotransmitter secretion(GO:1904048) |
| 0.4 | 1.2 | GO:0045175 | basal protein localization(GO:0045175) |
| 0.4 | 1.1 | GO:0051939 | gamma-aminobutyric acid import(GO:0051939) |
| 0.3 | 1.0 | GO:0042660 | positive regulation of cell fate specification(GO:0042660) |
| 0.3 | 1.0 | GO:1904864 | regulation of beta-catenin-TCF complex assembly(GO:1904863) negative regulation of beta-catenin-TCF complex assembly(GO:1904864) |
| 0.3 | 2.4 | GO:0045113 | regulation of integrin biosynthetic process(GO:0045113) |
| 0.3 | 2.0 | GO:1903566 | positive regulation of protein localization to cilium(GO:1903566) |
| 0.3 | 1.0 | GO:0000412 | histone peptidyl-prolyl isomerization(GO:0000412) |
| 0.3 | 0.9 | GO:0000494 | box C/D snoRNA 3'-end processing(GO:0000494) box C/D snoRNA metabolic process(GO:0033967) box C/D snoRNA processing(GO:0034963) histone glutamine methylation(GO:1990258) |
| 0.3 | 4.1 | GO:1902866 | regulation of retina development in camera-type eye(GO:1902866) |
| 0.3 | 1.7 | GO:0035063 | nuclear speck organization(GO:0035063) |
| 0.3 | 1.1 | GO:0018125 | peptidyl-cysteine methylation(GO:0018125) |
| 0.3 | 1.6 | GO:0089712 | L-aspartate transport(GO:0070778) L-aspartate transmembrane transport(GO:0089712) |
| 0.3 | 3.4 | GO:0015803 | branched-chain amino acid transport(GO:0015803) leucine transport(GO:0015820) alanine transport(GO:0032328) |
| 0.3 | 2.1 | GO:1902612 | regulation of anti-Mullerian hormone signaling pathway(GO:1902612) negative regulation of anti-Mullerian hormone signaling pathway(GO:1902613) anti-Mullerian hormone signaling pathway(GO:1990262) |
| 0.3 | 1.0 | GO:1903644 | regulation of chaperone-mediated protein folding(GO:1903644) |
| 0.3 | 1.3 | GO:0014050 | negative regulation of glutamate secretion(GO:0014050) |
| 0.3 | 0.8 | GO:0030974 | thiamine pyrophosphate transport(GO:0030974) |
| 0.3 | 1.5 | GO:0061669 | spontaneous neurotransmitter secretion(GO:0061669) spontaneous synaptic transmission(GO:0098814) |
| 0.3 | 1.3 | GO:2001074 | regulation of metanephric ureteric bud development(GO:2001074) positive regulation of metanephric ureteric bud development(GO:2001076) |
| 0.2 | 2.7 | GO:1902897 | regulation of postsynaptic density protein 95 clustering(GO:1902897) |
| 0.2 | 1.0 | GO:1901421 | positive regulation of response to alcohol(GO:1901421) |
| 0.2 | 1.2 | GO:0007198 | adenylate cyclase-inhibiting serotonin receptor signaling pathway(GO:0007198) |
| 0.2 | 1.9 | GO:0007412 | axon target recognition(GO:0007412) |
| 0.2 | 2.1 | GO:0031914 | negative regulation of synaptic plasticity(GO:0031914) |
| 0.2 | 1.8 | GO:0019236 | response to pheromone(GO:0019236) |
| 0.2 | 2.5 | GO:0001714 | endodermal cell fate specification(GO:0001714) |
| 0.2 | 0.9 | GO:0042335 | cuticle development(GO:0042335) |
| 0.2 | 0.9 | GO:0050915 | sensory perception of sour taste(GO:0050915) |
| 0.2 | 10.7 | GO:1903861 | positive regulation of dendrite extension(GO:1903861) |
| 0.2 | 1.3 | GO:0015692 | lead ion transport(GO:0015692) |
| 0.2 | 14.7 | GO:0006891 | intra-Golgi vesicle-mediated transport(GO:0006891) |
| 0.2 | 5.1 | GO:0015812 | gamma-aminobutyric acid transport(GO:0015812) |
| 0.2 | 3.3 | GO:0008627 | intrinsic apoptotic signaling pathway in response to osmotic stress(GO:0008627) |
| 0.2 | 1.5 | GO:0051684 | maintenance of Golgi location(GO:0051684) |
| 0.2 | 0.6 | GO:0071262 | regulation of eIF2 alpha phosphorylation by amino acid starvation(GO:0060733) regulation of translational initiation in response to starvation(GO:0071262) positive regulation of translational initiation in response to starvation(GO:0071264) |
| 0.2 | 6.2 | GO:0035641 | locomotory exploration behavior(GO:0035641) |
| 0.2 | 3.6 | GO:0031915 | positive regulation of synaptic plasticity(GO:0031915) |
| 0.2 | 0.7 | GO:0048560 | establishment of anatomical structure orientation(GO:0048560) |
| 0.2 | 0.7 | GO:0001560 | regulation of cell growth by extracellular stimulus(GO:0001560) |
| 0.2 | 0.6 | GO:1904247 | positive regulation of polynucleotide adenylyltransferase activity(GO:1904247) |
| 0.2 | 3.8 | GO:0050966 | detection of mechanical stimulus involved in sensory perception of pain(GO:0050966) |
| 0.2 | 0.2 | GO:0003308 | negative regulation of Wnt signaling pathway involved in heart development(GO:0003308) |
| 0.2 | 1.1 | GO:0060084 | synaptic transmission involved in micturition(GO:0060084) |
| 0.2 | 1.9 | GO:0007185 | transmembrane receptor protein tyrosine phosphatase signaling pathway(GO:0007185) |
| 0.2 | 2.0 | GO:0010593 | negative regulation of lamellipodium assembly(GO:0010593) |
| 0.2 | 2.1 | GO:0016198 | axon choice point recognition(GO:0016198) |
| 0.2 | 0.6 | GO:0018283 | metal incorporation into metallo-sulfur cluster(GO:0018282) iron incorporation into metallo-sulfur cluster(GO:0018283) |
| 0.2 | 0.5 | GO:1901228 | positive regulation of transcription from RNA polymerase II promoter involved in myocardial precursor cell differentiation(GO:0003257) regulation of bone trabecula formation(GO:1900154) negative regulation of bone trabecula formation(GO:1900155) positive regulation of transcription from RNA polymerase II promoter involved in heart development(GO:1901228) |
| 0.2 | 10.3 | GO:0034219 | carbohydrate transmembrane transport(GO:0034219) |
| 0.2 | 0.3 | GO:0007206 | phospholipase C-activating G-protein coupled glutamate receptor signaling pathway(GO:0007206) |
| 0.2 | 0.9 | GO:0016185 | synaptic vesicle budding from presynaptic endocytic zone membrane(GO:0016185) |
| 0.2 | 1.2 | GO:0046952 | ketone body catabolic process(GO:0046952) |
| 0.1 | 3.8 | GO:0033689 | negative regulation of osteoblast proliferation(GO:0033689) |
| 0.1 | 3.3 | GO:0007220 | Notch receptor processing(GO:0007220) |
| 0.1 | 0.7 | GO:0046167 | glycerol-3-phosphate biosynthetic process(GO:0046167) |
| 0.1 | 0.4 | GO:0099550 | trans-synaptic signalling, modulating synaptic transmission(GO:0099550) trans-synaptic signaling by lipid, modulating synaptic transmission(GO:0099552) trans-synaptic signaling by endocannabinoid, modulating synaptic transmission(GO:0099553) |
| 0.1 | 1.5 | GO:0000160 | phosphorelay signal transduction system(GO:0000160) |
| 0.1 | 1.8 | GO:0042985 | negative regulation of amyloid precursor protein biosynthetic process(GO:0042985) |
| 0.1 | 0.4 | GO:0019085 | early viral transcription(GO:0019085) |
| 0.1 | 10.1 | GO:0021762 | substantia nigra development(GO:0021762) |
| 0.1 | 0.8 | GO:0060295 | regulation of cilium movement involved in cell motility(GO:0060295) regulation of cilium beat frequency involved in ciliary motility(GO:0060296) regulation of cilium-dependent cell motility(GO:1902019) |
| 0.1 | 0.4 | GO:2000744 | anterior head development(GO:0097065) regulation of anterior head development(GO:2000742) positive regulation of anterior head development(GO:2000744) |
| 0.1 | 0.3 | GO:1900454 | positive regulation of long term synaptic depression(GO:1900454) |
| 0.1 | 0.5 | GO:0034085 | establishment of sister chromatid cohesion(GO:0034085) cohesin loading(GO:0071921) regulation of cohesin loading(GO:0071922) |
| 0.1 | 1.1 | GO:0070278 | extracellular matrix constituent secretion(GO:0070278) |
| 0.1 | 3.1 | GO:0021681 | cerebellar granular layer development(GO:0021681) |
| 0.1 | 0.6 | GO:0034334 | adherens junction maintenance(GO:0034334) |
| 0.1 | 1.8 | GO:0007258 | JUN phosphorylation(GO:0007258) |
| 0.1 | 1.2 | GO:0061366 | behavioral response to chemical pain(GO:0061366) behavioral response to formalin induced pain(GO:0061368) |
| 0.1 | 1.8 | GO:0007288 | sperm axoneme assembly(GO:0007288) |
| 0.1 | 1.1 | GO:0033564 | anterior/posterior axon guidance(GO:0033564) |
| 0.1 | 0.9 | GO:0021816 | extension of a leading process involved in cell motility in cerebral cortex radial glia guided migration(GO:0021816) |
| 0.1 | 1.2 | GO:0099566 | regulation of postsynaptic cytosolic calcium ion concentration(GO:0099566) |
| 0.1 | 3.5 | GO:0015800 | acidic amino acid transport(GO:0015800) L-glutamate transport(GO:0015813) |
| 0.1 | 0.6 | GO:0030047 | actin modification(GO:0030047) |
| 0.1 | 2.3 | GO:0061302 | smooth muscle cell-matrix adhesion(GO:0061302) |
| 0.1 | 0.2 | GO:0050976 | detection of mechanical stimulus involved in sensory perception of touch(GO:0050976) |
| 0.1 | 1.8 | GO:0019227 | neuronal action potential propagation(GO:0019227) action potential propagation(GO:0098870) |
| 0.1 | 2.4 | GO:0043031 | negative regulation of macrophage activation(GO:0043031) |
| 0.1 | 1.0 | GO:0060406 | positive regulation of penile erection(GO:0060406) |
| 0.1 | 6.4 | GO:0043278 | response to isoquinoline alkaloid(GO:0014072) response to morphine(GO:0043278) |
| 0.1 | 2.1 | GO:0046415 | urate metabolic process(GO:0046415) |
| 0.1 | 0.9 | GO:0016188 | synaptic vesicle maturation(GO:0016188) |
| 0.1 | 1.3 | GO:0035542 | regulation of SNARE complex assembly(GO:0035542) |
| 0.1 | 0.7 | GO:1901529 | positive regulation of anion channel activity(GO:1901529) |
| 0.1 | 0.5 | GO:0071421 | manganese ion transmembrane transport(GO:0071421) |
| 0.1 | 0.8 | GO:0007000 | nucleolus organization(GO:0007000) |
| 0.1 | 1.4 | GO:0006600 | creatine metabolic process(GO:0006600) |
| 0.1 | 0.9 | GO:0072383 | plus-end-directed vesicle transport along microtubule(GO:0072383) |
| 0.1 | 2.7 | GO:0032793 | positive regulation of CREB transcription factor activity(GO:0032793) |
| 0.1 | 1.2 | GO:0032286 | central nervous system myelin maintenance(GO:0032286) |
| 0.1 | 0.3 | GO:2000588 | positive regulation of platelet-derived growth factor receptor-beta signaling pathway(GO:2000588) |
| 0.1 | 3.3 | GO:0044458 | motile cilium assembly(GO:0044458) |
| 0.1 | 0.7 | GO:0046604 | positive regulation of mitotic centrosome separation(GO:0046604) |
| 0.1 | 1.0 | GO:0010739 | positive regulation of protein kinase A signaling(GO:0010739) |
| 0.1 | 1.1 | GO:0031987 | locomotion involved in locomotory behavior(GO:0031987) |
| 0.1 | 1.6 | GO:0090091 | positive regulation of extracellular matrix disassembly(GO:0090091) |
| 0.1 | 4.8 | GO:0035735 | intraciliary transport involved in cilium morphogenesis(GO:0035735) |
| 0.1 | 1.8 | GO:1900364 | negative regulation of mRNA polyadenylation(GO:1900364) |
| 0.1 | 0.6 | GO:0071918 | urea transmembrane transport(GO:0071918) |
| 0.1 | 1.1 | GO:0032914 | positive regulation of transforming growth factor beta1 production(GO:0032914) |
| 0.1 | 0.6 | GO:0071947 | protein deubiquitination involved in ubiquitin-dependent protein catabolic process(GO:0071947) |
| 0.1 | 0.4 | GO:1902626 | assembly of large subunit precursor of preribosome(GO:1902626) |
| 0.1 | 0.8 | GO:1904779 | regulation of protein localization to centrosome(GO:1904779) |
| 0.1 | 1.7 | GO:0045199 | maintenance of apical/basal cell polarity(GO:0035090) maintenance of epithelial cell apical/basal polarity(GO:0045199) |
| 0.1 | 1.3 | GO:1904321 | response to forskolin(GO:1904321) cellular response to forskolin(GO:1904322) |
| 0.1 | 0.6 | GO:0051835 | positive regulation of synapse structural plasticity(GO:0051835) |
| 0.1 | 0.7 | GO:0055129 | L-proline biosynthetic process(GO:0055129) |
| 0.1 | 0.2 | GO:1901389 | regulation of transforming growth factor beta activation(GO:1901388) negative regulation of transforming growth factor beta activation(GO:1901389) |
| 0.1 | 0.5 | GO:0015015 | heparan sulfate proteoglycan biosynthetic process, enzymatic modification(GO:0015015) |
| 0.1 | 1.2 | GO:0048172 | regulation of short-term neuronal synaptic plasticity(GO:0048172) |
| 0.1 | 0.9 | GO:0046600 | negative regulation of centriole replication(GO:0046600) |
| 0.1 | 0.3 | GO:0036367 | adaptation of rhodopsin mediated signaling(GO:0016062) light adaption(GO:0036367) |
| 0.1 | 0.7 | GO:0044268 | multicellular organismal protein metabolic process(GO:0044268) |
| 0.1 | 0.5 | GO:1903288 | positive regulation of potassium ion import(GO:1903288) |
| 0.1 | 0.3 | GO:0009405 | pathogenesis(GO:0009405) |
| 0.1 | 1.2 | GO:0010839 | negative regulation of keratinocyte proliferation(GO:0010839) |
| 0.1 | 0.4 | GO:0014826 | vein smooth muscle contraction(GO:0014826) |
| 0.1 | 2.5 | GO:0043252 | sodium-independent organic anion transport(GO:0043252) |
| 0.1 | 0.6 | GO:0071787 | endoplasmic reticulum tubular network assembly(GO:0071787) |
| 0.1 | 0.3 | GO:0072675 | osteoclast fusion(GO:0072675) |
| 0.1 | 0.8 | GO:0006268 | DNA unwinding involved in DNA replication(GO:0006268) |
| 0.1 | 0.9 | GO:2000389 | regulation of neutrophil extravasation(GO:2000389) |
| 0.1 | 1.3 | GO:0070262 | peptidyl-serine dephosphorylation(GO:0070262) |
| 0.1 | 0.3 | GO:0061762 | CAMKK-AMPK signaling cascade(GO:0061762) |
| 0.1 | 0.6 | GO:2000609 | regulation of thyroid hormone generation(GO:2000609) |
| 0.1 | 1.0 | GO:0045198 | establishment of epithelial cell apical/basal polarity(GO:0045198) |
| 0.1 | 0.2 | GO:1904398 | positive regulation of neuromuscular junction development(GO:1904398) |
| 0.1 | 0.3 | GO:1903527 | positive regulation of membrane tubulation(GO:1903527) |
| 0.1 | 0.4 | GO:0071394 | cellular response to testosterone stimulus(GO:0071394) |
| 0.0 | 0.3 | GO:2000234 | positive regulation of ribosome biogenesis(GO:0090070) positive regulation of rRNA processing(GO:2000234) |
| 0.0 | 0.1 | GO:1903348 | establishment of blood-nerve barrier(GO:0008065) positive regulation of bicellular tight junction assembly(GO:1903348) |
| 0.0 | 2.5 | GO:0035082 | axoneme assembly(GO:0035082) |
| 0.0 | 0.3 | GO:0033489 | cholesterol biosynthetic process via desmosterol(GO:0033489) cholesterol biosynthetic process via lathosterol(GO:0033490) |
| 0.0 | 0.2 | GO:0070213 | protein auto-ADP-ribosylation(GO:0070213) |
| 0.0 | 0.3 | GO:1902410 | mitotic cytokinetic process(GO:1902410) |
| 0.0 | 0.1 | GO:0007037 | vacuolar phosphate transport(GO:0007037) negative regulation of fibroblast growth factor production(GO:0090272) positive regulation of mitotic cell cycle DNA replication(GO:1903465) positive regulation of parathyroid hormone secretion(GO:2000830) |
| 0.0 | 0.4 | GO:0043653 | mitochondrial fragmentation involved in apoptotic process(GO:0043653) |
| 0.0 | 1.0 | GO:2000480 | negative regulation of cAMP-dependent protein kinase activity(GO:2000480) |
| 0.0 | 1.3 | GO:0035855 | megakaryocyte development(GO:0035855) |
| 0.0 | 0.2 | GO:1902269 | positive regulation of polyamine transmembrane transport(GO:1902269) |
| 0.0 | 0.7 | GO:0051152 | positive regulation of smooth muscle cell differentiation(GO:0051152) |
| 0.0 | 0.4 | GO:2000576 | positive regulation of microtubule motor activity(GO:2000576) |
| 0.0 | 3.5 | GO:0015701 | bicarbonate transport(GO:0015701) |
| 0.0 | 0.7 | GO:0086046 | membrane depolarization during SA node cell action potential(GO:0086046) |
| 0.0 | 0.5 | GO:0033314 | mitotic DNA replication checkpoint(GO:0033314) |
| 0.0 | 2.1 | GO:0018146 | keratan sulfate biosynthetic process(GO:0018146) |
| 0.0 | 0.7 | GO:1901750 | leukotriene D4 metabolic process(GO:1901748) leukotriene D4 biosynthetic process(GO:1901750) |
| 0.0 | 0.9 | GO:0006054 | N-acetylneuraminate metabolic process(GO:0006054) |
| 0.0 | 0.5 | GO:0090487 | toxin catabolic process(GO:0009407) secondary metabolite catabolic process(GO:0090487) |
| 0.0 | 0.2 | GO:0033629 | negative regulation of cell adhesion mediated by integrin(GO:0033629) |
| 0.0 | 0.1 | GO:2000118 | regulation of sodium-dependent phosphate transport(GO:2000118) |
| 0.0 | 1.7 | GO:0032012 | regulation of ARF protein signal transduction(GO:0032012) |
| 0.0 | 1.3 | GO:0006884 | cell volume homeostasis(GO:0006884) |
| 0.0 | 0.7 | GO:0070389 | chaperone cofactor-dependent protein refolding(GO:0070389) |
| 0.0 | 1.3 | GO:0055003 | cardiac myofibril assembly(GO:0055003) |
| 0.0 | 0.3 | GO:0033591 | response to L-ascorbic acid(GO:0033591) |
| 0.0 | 0.3 | GO:0002870 | lymphocyte anergy(GO:0002249) regulation of T cell anergy(GO:0002667) T cell anergy(GO:0002870) regulation of lymphocyte anergy(GO:0002911) |
| 0.0 | 0.6 | GO:0010561 | negative regulation of glycoprotein biosynthetic process(GO:0010561) |
| 0.0 | 1.2 | GO:0048268 | clathrin coat assembly(GO:0048268) |
| 0.0 | 0.6 | GO:2000291 | regulation of myoblast proliferation(GO:2000291) |
| 0.0 | 4.1 | GO:0006501 | C-terminal protein lipidation(GO:0006501) |
| 0.0 | 0.2 | GO:0032439 | endosome localization(GO:0032439) |
| 0.0 | 0.8 | GO:0014046 | dopamine secretion(GO:0014046) regulation of dopamine secretion(GO:0014059) |
| 0.0 | 1.0 | GO:0031115 | negative regulation of microtubule polymerization(GO:0031115) |
| 0.0 | 0.2 | GO:0042659 | regulation of cell fate specification(GO:0042659) |
| 0.0 | 1.0 | GO:0071447 | cellular response to hydroperoxide(GO:0071447) |
| 0.0 | 0.3 | GO:0033353 | S-adenosylmethionine cycle(GO:0033353) |
| 0.0 | 0.7 | GO:1902018 | negative regulation of cilium assembly(GO:1902018) |
| 0.0 | 0.7 | GO:0010991 | negative regulation of SMAD protein complex assembly(GO:0010991) |
| 0.0 | 0.2 | GO:0032226 | positive regulation of synaptic transmission, dopaminergic(GO:0032226) |
| 0.0 | 0.2 | GO:0035407 | histone H3-T11 phosphorylation(GO:0035407) |
| 0.0 | 0.7 | GO:0032780 | negative regulation of ATPase activity(GO:0032780) |
| 0.0 | 1.1 | GO:0021772 | olfactory bulb development(GO:0021772) |
| 0.0 | 0.2 | GO:0044154 | positive regulation of gluconeogenesis by positive regulation of transcription from RNA polymerase II promoter(GO:0035948) histone H3-K14 acetylation(GO:0044154) |
| 0.0 | 1.4 | GO:0048168 | regulation of neuronal synaptic plasticity(GO:0048168) |
| 0.0 | 0.8 | GO:0019511 | peptidyl-proline hydroxylation(GO:0019511) |
| 0.0 | 1.2 | GO:0022400 | regulation of rhodopsin mediated signaling pathway(GO:0022400) |
| 0.0 | 0.5 | GO:0009957 | epidermal cell fate specification(GO:0009957) |
| 0.0 | 0.2 | GO:0090074 | negative regulation of protein homodimerization activity(GO:0090074) |
| 0.0 | 0.5 | GO:0003322 | pancreatic A cell development(GO:0003322) |
| 0.0 | 0.1 | GO:0030070 | insulin processing(GO:0030070) |
| 0.0 | 0.4 | GO:0021794 | thalamus development(GO:0021794) |
| 0.0 | 0.4 | GO:0032020 | ISG15-protein conjugation(GO:0032020) |
| 0.0 | 1.6 | GO:0010107 | potassium ion import(GO:0010107) |
| 0.0 | 0.4 | GO:0043090 | amino acid import(GO:0043090) |
| 0.0 | 0.8 | GO:0090141 | positive regulation of mitochondrial fission(GO:0090141) |
| 0.0 | 1.2 | GO:0014003 | oligodendrocyte development(GO:0014003) |
| 0.0 | 2.0 | GO:0006749 | glutathione metabolic process(GO:0006749) |
| 0.0 | 0.1 | GO:1900138 | negative regulation of phospholipase A2 activity(GO:1900138) |
| 0.0 | 0.3 | GO:0070995 | NADPH oxidation(GO:0070995) |
| 0.0 | 0.2 | GO:0033274 | response to vitamin B2(GO:0033274) heterochromatin maintenance(GO:0070829) |
| 0.0 | 0.2 | GO:0006659 | phosphatidylserine biosynthetic process(GO:0006659) |
| 0.0 | 0.4 | GO:1900028 | negative regulation of ruffle assembly(GO:1900028) |
| 0.0 | 0.5 | GO:0060219 | camera-type eye photoreceptor cell differentiation(GO:0060219) |
| 0.0 | 0.3 | GO:0035608 | protein deglutamylation(GO:0035608) |
| 0.0 | 0.1 | GO:0034421 | post-translational protein acetylation(GO:0034421) |
| 0.0 | 0.2 | GO:0009414 | response to water deprivation(GO:0009414) |
| 0.0 | 0.5 | GO:0021796 | cerebral cortex regionalization(GO:0021796) |
| 0.0 | 1.2 | GO:0048791 | calcium ion-regulated exocytosis of neurotransmitter(GO:0048791) |
| 0.0 | 0.4 | GO:0006702 | androgen biosynthetic process(GO:0006702) |
| 0.0 | 0.4 | GO:0015074 | DNA integration(GO:0015074) |
| 0.0 | 0.6 | GO:2001224 | positive regulation of neuron migration(GO:2001224) |
| 0.0 | 0.3 | GO:0031936 | negative regulation of chromatin silencing(GO:0031936) |
| 0.0 | 0.9 | GO:0035338 | long-chain fatty-acyl-CoA biosynthetic process(GO:0035338) |
| 0.0 | 0.2 | GO:0031860 | telomeric 3' overhang formation(GO:0031860) |
| 0.0 | 2.0 | GO:1901379 | regulation of potassium ion transmembrane transport(GO:1901379) |
| 0.0 | 1.5 | GO:1904893 | negative regulation of JAK-STAT cascade(GO:0046426) negative regulation of STAT cascade(GO:1904893) |
| 0.0 | 2.3 | GO:0006334 | nucleosome assembly(GO:0006334) |
| 0.0 | 0.8 | GO:0051703 | social behavior(GO:0035176) intraspecies interaction between organisms(GO:0051703) |
| 0.0 | 0.1 | GO:0044806 | G-quadruplex DNA unwinding(GO:0044806) |
| 0.0 | 0.3 | GO:0007614 | short-term memory(GO:0007614) |
| 0.0 | 2.0 | GO:1900034 | regulation of cellular response to heat(GO:1900034) |
| 0.0 | 0.2 | GO:0045955 | negative regulation of calcium ion-dependent exocytosis(GO:0045955) |
| 0.0 | 0.0 | GO:0032971 | regulation of muscle filament sliding(GO:0032971) |
| 0.0 | 0.2 | GO:0000338 | protein deneddylation(GO:0000338) |
| 0.0 | 0.4 | GO:2000369 | regulation of clathrin-mediated endocytosis(GO:2000369) |
| 0.0 | 0.0 | GO:0090675 | intermicrovillar adhesion(GO:0090675) |
| 0.0 | 0.6 | GO:0007602 | phototransduction(GO:0007602) |
| 0.0 | 0.1 | GO:0035754 | B cell chemotaxis(GO:0035754) |
| 0.0 | 0.1 | GO:0051415 | interphase microtubule nucleation by interphase microtubule organizing center(GO:0051415) microtubule nucleation by microtubule organizing center(GO:0051418) |
| 0.0 | 0.1 | GO:0097011 | cellular response to granulocyte macrophage colony-stimulating factor stimulus(GO:0097011) response to granulocyte macrophage colony-stimulating factor(GO:0097012) |
| 0.0 | 2.4 | GO:0046854 | phosphatidylinositol phosphorylation(GO:0046854) |
| 0.0 | 0.3 | GO:0030207 | chondroitin sulfate catabolic process(GO:0030207) |
| 0.0 | 2.0 | GO:0072332 | intrinsic apoptotic signaling pathway by p53 class mediator(GO:0072332) |
| 0.0 | 0.1 | GO:0038170 | somatostatin receptor signaling pathway(GO:0038169) somatostatin signaling pathway(GO:0038170) |
| 0.0 | 0.4 | GO:0003016 | respiratory system process(GO:0003016) |
| 0.0 | 0.9 | GO:0046677 | response to antibiotic(GO:0046677) |
| 0.0 | 0.1 | GO:0072710 | response to hydroxyurea(GO:0072710) cellular response to hydroxyurea(GO:0072711) |
| 0.0 | 0.3 | GO:0042953 | lipoprotein transport(GO:0042953) lipoprotein localization(GO:0044872) |
| 0.0 | 0.2 | GO:1904424 | regulation of GTP binding(GO:1904424) |
| 0.0 | 0.4 | GO:0045494 | photoreceptor cell maintenance(GO:0045494) |
| 0.0 | 0.0 | GO:0036515 | serotonergic neuron axon guidance(GO:0036515) |
Gene overrepresentation in cellular component category:
| Log-likelihood per target | Total log-likelihood | Term | Description |
|---|---|---|---|
| 0.4 | 3.6 | GO:0070554 | synaptobrevin 2-SNAP-25-syntaxin-3-complexin complex(GO:0070554) |
| 0.4 | 3.0 | GO:0005594 | collagen type IX trimer(GO:0005594) |
| 0.3 | 1.8 | GO:0090498 | extrinsic component of Golgi membrane(GO:0090498) |
| 0.2 | 2.6 | GO:0072687 | meiotic spindle(GO:0072687) |
| 0.2 | 4.1 | GO:0035749 | myelin sheath adaxonal region(GO:0035749) |
| 0.2 | 2.1 | GO:0044305 | calyx of Held(GO:0044305) |
| 0.2 | 1.3 | GO:0070826 | paraferritin complex(GO:0070826) |
| 0.2 | 1.2 | GO:1990769 | proximal neuron projection(GO:1990769) |
| 0.2 | 1.7 | GO:0048787 | presynaptic active zone membrane(GO:0048787) |
| 0.2 | 1.0 | GO:0044308 | axonal spine(GO:0044308) |
| 0.2 | 0.2 | GO:0070381 | endosome to plasma membrane transport vesicle(GO:0070381) |
| 0.2 | 5.3 | GO:0098563 | integral component of synaptic vesicle membrane(GO:0030285) intrinsic component of synaptic vesicle membrane(GO:0098563) |
| 0.2 | 1.1 | GO:0032144 | 4-aminobutyrate transaminase complex(GO:0032144) |
| 0.2 | 2.5 | GO:0034464 | BBSome(GO:0034464) |
| 0.2 | 1.3 | GO:0032279 | asymmetric synapse(GO:0032279) |
| 0.2 | 4.2 | GO:0033270 | paranode region of axon(GO:0033270) |
| 0.1 | 4.8 | GO:0030992 | intraciliary transport particle B(GO:0030992) |
| 0.1 | 1.2 | GO:0031428 | box C/D snoRNP complex(GO:0031428) |
| 0.1 | 1.1 | GO:0032021 | NELF complex(GO:0032021) |
| 0.1 | 1.0 | GO:0002177 | manchette(GO:0002177) |
| 0.1 | 1.2 | GO:0044326 | dendritic spine neck(GO:0044326) |
| 0.1 | 0.7 | GO:0032044 | DSIF complex(GO:0032044) |
| 0.1 | 1.6 | GO:0005828 | kinetochore microtubule(GO:0005828) |
| 0.1 | 3.3 | GO:0016342 | catenin complex(GO:0016342) |
| 0.1 | 2.5 | GO:0001931 | uropod(GO:0001931) cell trailing edge(GO:0031254) |
| 0.1 | 0.6 | GO:0019034 | viral replication complex(GO:0019034) |
| 0.1 | 0.6 | GO:1990031 | pinceau fiber(GO:1990031) |
| 0.1 | 0.8 | GO:0002116 | semaphorin receptor complex(GO:0002116) |
| 0.1 | 6.3 | GO:0005834 | heterotrimeric G-protein complex(GO:0005834) |
| 0.1 | 0.4 | GO:0097425 | smooth endoplasmic reticulum membrane(GO:0030868) smooth endoplasmic reticulum part(GO:0097425) |
| 0.1 | 0.2 | GO:1990917 | sperm head plasma membrane(GO:1990913) ooplasm(GO:1990917) |
| 0.1 | 6.9 | GO:0045334 | clathrin-coated endocytic vesicle(GO:0045334) |
| 0.1 | 14.4 | GO:0005793 | endoplasmic reticulum-Golgi intermediate compartment(GO:0005793) |
| 0.1 | 0.8 | GO:0061673 | mitotic spindle astral microtubule(GO:0061673) |
| 0.1 | 1.5 | GO:0036038 | MKS complex(GO:0036038) |
| 0.1 | 3.0 | GO:0030132 | clathrin coat of coated pit(GO:0030132) |
| 0.1 | 1.5 | GO:0005952 | cAMP-dependent protein kinase complex(GO:0005952) |
| 0.1 | 1.1 | GO:0008074 | guanylate cyclase complex, soluble(GO:0008074) |
| 0.1 | 5.1 | GO:0097610 | cleavage furrow(GO:0032154) cell surface furrow(GO:0097610) |
| 0.1 | 1.8 | GO:0043194 | axon initial segment(GO:0043194) |
| 0.1 | 0.4 | GO:0070436 | Grb2-EGFR complex(GO:0070436) |
| 0.1 | 1.7 | GO:0000145 | exocyst(GO:0000145) |
| 0.0 | 5.7 | GO:0030672 | synaptic vesicle membrane(GO:0030672) exocytic vesicle membrane(GO:0099501) |
| 0.0 | 0.8 | GO:0031209 | SCAR complex(GO:0031209) |
| 0.0 | 0.8 | GO:0044300 | cerebellar mossy fiber(GO:0044300) |
| 0.0 | 1.2 | GO:0097381 | photoreceptor disc membrane(GO:0097381) |
| 0.0 | 0.8 | GO:1990023 | mitotic spindle midzone(GO:1990023) |
| 0.0 | 7.0 | GO:0043679 | axon terminus(GO:0043679) |
| 0.0 | 0.8 | GO:0042555 | MCM complex(GO:0042555) |
| 0.0 | 1.5 | GO:0042101 | T cell receptor complex(GO:0042101) |
| 0.0 | 0.4 | GO:0097427 | microtubule bundle(GO:0097427) |
| 0.0 | 1.9 | GO:0044306 | neuron projection terminus(GO:0044306) |
| 0.0 | 2.1 | GO:0000159 | protein phosphatase type 2A complex(GO:0000159) |
| 0.0 | 0.0 | GO:0044214 | spanning component of plasma membrane(GO:0044214) spanning component of membrane(GO:0089717) |
| 0.0 | 1.8 | GO:0032281 | AMPA glutamate receptor complex(GO:0032281) |
| 0.0 | 1.2 | GO:0005892 | acetylcholine-gated channel complex(GO:0005892) |
| 0.0 | 2.9 | GO:0005905 | clathrin-coated pit(GO:0005905) |
| 0.0 | 1.4 | GO:0048786 | presynaptic active zone(GO:0048786) |
| 0.0 | 0.9 | GO:0030877 | beta-catenin destruction complex(GO:0030877) |
| 0.0 | 1.2 | GO:0030056 | hemidesmosome(GO:0030056) |
| 0.0 | 0.8 | GO:0030131 | clathrin adaptor complex(GO:0030131) |
| 0.0 | 0.1 | GO:0038038 | G-protein coupled receptor homodimeric complex(GO:0038038) |
| 0.0 | 3.3 | GO:0005791 | rough endoplasmic reticulum(GO:0005791) |
| 0.0 | 7.3 | GO:0031225 | anchored component of membrane(GO:0031225) |
| 0.0 | 0.4 | GO:0042622 | photoreceptor outer segment membrane(GO:0042622) |
| 0.0 | 1.9 | GO:0060170 | ciliary membrane(GO:0060170) |
| 0.0 | 0.8 | GO:0032045 | guanyl-nucleotide exchange factor complex(GO:0032045) |
| 0.0 | 0.5 | GO:0097450 | astrocyte end-foot(GO:0097450) glial limiting end-foot(GO:0097451) |
| 0.0 | 0.4 | GO:0044666 | MLL3/4 complex(GO:0044666) |
| 0.0 | 0.5 | GO:0005890 | sodium:potassium-exchanging ATPase complex(GO:0005890) |
| 0.0 | 0.3 | GO:0035869 | ciliary transition zone(GO:0035869) |
| 0.0 | 1.3 | GO:0008180 | COP9 signalosome(GO:0008180) |
| 0.0 | 0.5 | GO:0008278 | cohesin complex(GO:0008278) |
| 0.0 | 0.2 | GO:0045179 | apical cortex(GO:0045179) |
| 0.0 | 0.8 | GO:0044298 | neuronal cell body membrane(GO:0032809) cell body membrane(GO:0044298) |
| 0.0 | 0.8 | GO:0000314 | organellar small ribosomal subunit(GO:0000314) mitochondrial small ribosomal subunit(GO:0005763) |
| 0.0 | 0.6 | GO:0042405 | nuclear inclusion body(GO:0042405) |
| 0.0 | 8.6 | GO:0016323 | basolateral plasma membrane(GO:0016323) |
| 0.0 | 0.2 | GO:0005816 | spindle pole body(GO:0005816) |
| 0.0 | 0.5 | GO:1990454 | L-type voltage-gated calcium channel complex(GO:1990454) |
| 0.0 | 2.6 | GO:0030426 | growth cone(GO:0030426) |
| 0.0 | 1.0 | GO:0034707 | chloride channel complex(GO:0034707) |
| 0.0 | 1.0 | GO:0001917 | photoreceptor inner segment(GO:0001917) |
| 0.0 | 3.4 | GO:0005814 | centriole(GO:0005814) |
| 0.0 | 0.3 | GO:0000813 | ESCRT I complex(GO:0000813) |
| 0.0 | 0.2 | GO:0044327 | dendritic spine head(GO:0044327) |
| 0.0 | 0.5 | GO:0071682 | endocytic vesicle lumen(GO:0071682) |
| 0.0 | 2.2 | GO:0005930 | axoneme(GO:0005930) ciliary plasm(GO:0097014) |
| 0.0 | 2.0 | GO:0034705 | potassium channel complex(GO:0034705) |
| 0.0 | 1.6 | GO:0044309 | dendritic spine(GO:0043197) neuron spine(GO:0044309) |
| 0.0 | 0.2 | GO:0016602 | CCAAT-binding factor complex(GO:0016602) |
| 0.0 | 2.5 | GO:0043204 | perikaryon(GO:0043204) |
| 0.0 | 0.2 | GO:0000242 | pericentriolar material(GO:0000242) |
| 0.0 | 0.2 | GO:0000322 | storage vacuole(GO:0000322) |
| 0.0 | 1.0 | GO:0005891 | voltage-gated calcium channel complex(GO:0005891) |
| 0.0 | 0.3 | GO:0005868 | cytoplasmic dynein complex(GO:0005868) |
| 0.0 | 4.6 | GO:0045211 | postsynaptic membrane(GO:0045211) |
| 0.0 | 5.5 | GO:0043025 | neuronal cell body(GO:0043025) |
| 0.0 | 1.0 | GO:0043198 | dendritic shaft(GO:0043198) |
| 0.0 | 0.2 | GO:0030870 | Mre11 complex(GO:0030870) |
| 0.0 | 0.1 | GO:0033165 | interphotoreceptor matrix(GO:0033165) |
| 0.0 | 0.9 | GO:0015030 | Cajal body(GO:0015030) |
| 0.0 | 0.1 | GO:0031390 | Ctf18 RFC-like complex(GO:0031390) |
| 0.0 | 0.2 | GO:0030914 | STAGA complex(GO:0030914) |
| 0.0 | 0.0 | GO:0005863 | striated muscle myosin thick filament(GO:0005863) |
Gene overrepresentation in molecular function category:
| Log-likelihood per target | Total log-likelihood | Term | Description |
|---|---|---|---|
| 1.4 | 5.4 | GO:0004113 | 2',3'-cyclic-nucleotide 3'-phosphodiesterase activity(GO:0004113) |
| 1.3 | 3.8 | GO:0060175 | brain-derived neurotrophic factor-activated receptor activity(GO:0060175) |
| 0.7 | 2.0 | GO:1990175 | EH domain binding(GO:1990175) |
| 0.5 | 1.9 | GO:0052810 | 1-phosphatidylinositol-5-kinase activity(GO:0052810) |
| 0.5 | 5.8 | GO:0015272 | ATP-activated inward rectifier potassium channel activity(GO:0015272) |
| 0.5 | 1.9 | GO:0035373 | chondroitin sulfate proteoglycan binding(GO:0035373) |
| 0.5 | 15.4 | GO:0031489 | myosin V binding(GO:0031489) |
| 0.4 | 3.5 | GO:0043812 | phosphatidylinositol-4-phosphate phosphatase activity(GO:0043812) |
| 0.4 | 4.1 | GO:0042835 | BRE binding(GO:0042835) |
| 0.4 | 2.0 | GO:0005294 | neutral L-amino acid secondary active transmembrane transporter activity(GO:0005294) |
| 0.4 | 0.4 | GO:0005119 | smoothened binding(GO:0005119) |
| 0.4 | 6.4 | GO:0031821 | G-protein coupled serotonin receptor binding(GO:0031821) |
| 0.4 | 0.4 | GO:0052812 | phosphatidylinositol-3,4-bisphosphate 5-kinase activity(GO:0052812) |
| 0.3 | 3.2 | GO:0005332 | gamma-aminobutyric acid:sodium symporter activity(GO:0005332) |
| 0.3 | 2.2 | GO:0051021 | GDP-dissociation inhibitor binding(GO:0051021) Rho GDP-dissociation inhibitor binding(GO:0051022) |
| 0.3 | 4.1 | GO:0005005 | transmembrane-ephrin receptor activity(GO:0005005) |
| 0.3 | 0.9 | GO:1990259 | protein-glutamine N-methyltransferase activity(GO:0036009) histone-glutamine methyltransferase activity(GO:1990259) |
| 0.3 | 1.2 | GO:0008260 | 3-oxoacid CoA-transferase activity(GO:0008260) |
| 0.3 | 0.9 | GO:0086059 | voltage-gated calcium channel activity involved SA node cell action potential(GO:0086059) |
| 0.3 | 1.6 | GO:0015183 | L-aspartate transmembrane transporter activity(GO:0015183) |
| 0.3 | 1.3 | GO:0070905 | serine binding(GO:0070905) |
| 0.3 | 0.8 | GO:0090422 | thiamine pyrophosphate transporter activity(GO:0090422) |
| 0.2 | 1.5 | GO:0031694 | alpha-2A adrenergic receptor binding(GO:0031694) |
| 0.2 | 1.2 | GO:0052829 | inositol-1,4-bisphosphate 1-phosphatase activity(GO:0004441) inositol-1,3,4-trisphosphate 1-phosphatase activity(GO:0052829) |
| 0.2 | 0.6 | GO:0015265 | urea channel activity(GO:0015265) |
| 0.2 | 0.6 | GO:0031071 | cysteine desulfurase activity(GO:0031071) |
| 0.2 | 1.3 | GO:0015087 | cadmium ion transmembrane transporter activity(GO:0015086) cobalt ion transmembrane transporter activity(GO:0015087) lead ion transmembrane transporter activity(GO:0015094) ferrous iron uptake transmembrane transporter activity(GO:0015639) |
| 0.2 | 1.9 | GO:0015319 | sodium:inorganic phosphate symporter activity(GO:0015319) |
| 0.2 | 0.8 | GO:0070259 | tyrosyl-DNA phosphodiesterase activity(GO:0070259) |
| 0.2 | 2.0 | GO:0008158 | hedgehog receptor activity(GO:0008158) |
| 0.2 | 3.0 | GO:0030020 | extracellular matrix structural constituent conferring tensile strength(GO:0030020) |
| 0.2 | 0.6 | GO:0052816 | medium-chain acyl-CoA hydrolase activity(GO:0052815) long-chain acyl-CoA hydrolase activity(GO:0052816) |
| 0.2 | 0.9 | GO:0044736 | acid-sensing ion channel activity(GO:0044736) |
| 0.2 | 1.4 | GO:0004111 | creatine kinase activity(GO:0004111) |
| 0.2 | 1.2 | GO:0047288 | monosialoganglioside sialyltransferase activity(GO:0047288) |
| 0.2 | 1.1 | GO:0032145 | 4-aminobutyrate transaminase activity(GO:0003867) succinate-semialdehyde dehydrogenase binding(GO:0032145) (S)-3-amino-2-methylpropionate transaminase activity(GO:0047298) |
| 0.2 | 0.5 | GO:0019781 | NEDD8 activating enzyme activity(GO:0019781) |
| 0.2 | 1.5 | GO:0000155 | phosphorelay sensor kinase activity(GO:0000155) |
| 0.1 | 1.3 | GO:0001517 | N-acetylglucosamine 6-O-sulfotransferase activity(GO:0001517) |
| 0.1 | 3.4 | GO:0005328 | neurotransmitter:sodium symporter activity(GO:0005328) |
| 0.1 | 0.7 | GO:0004370 | glycerol kinase activity(GO:0004370) |
| 0.1 | 1.8 | GO:0016909 | JUN kinase activity(GO:0004705) SAP kinase activity(GO:0016909) |
| 0.1 | 12.1 | GO:1901476 | carbohydrate transmembrane transporter activity(GO:0015144) carbohydrate transporter activity(GO:1901476) |
| 0.1 | 0.5 | GO:0034041 | sterol-transporting ATPase activity(GO:0034041) |
| 0.1 | 0.4 | GO:0019777 | Atg12 transferase activity(GO:0019777) |
| 0.1 | 2.3 | GO:0038062 | protein tyrosine kinase collagen receptor activity(GO:0038062) |
| 0.1 | 0.6 | GO:0003839 | gamma-glutamylcyclotransferase activity(GO:0003839) |
| 0.1 | 0.7 | GO:0003998 | acylphosphatase activity(GO:0003998) |
| 0.1 | 2.1 | GO:0005078 | MAP-kinase scaffold activity(GO:0005078) |
| 0.1 | 10.5 | GO:0001786 | phosphatidylserine binding(GO:0001786) |
| 0.1 | 1.2 | GO:0099583 | neurotransmitter receptor activity involved in regulation of postsynaptic cytosolic calcium ion concentration(GO:0099583) |
| 0.1 | 1.8 | GO:0050291 | sphingosine N-acyltransferase activity(GO:0050291) |
| 0.1 | 3.5 | GO:0008510 | sodium:bicarbonate symporter activity(GO:0008510) |
| 0.1 | 0.3 | GO:0042284 | sphingolipid delta-4 desaturase activity(GO:0042284) |
| 0.1 | 0.4 | GO:0004949 | cannabinoid receptor activity(GO:0004949) |
| 0.1 | 3.3 | GO:0005112 | Notch binding(GO:0005112) |
| 0.1 | 1.2 | GO:0043176 | amine binding(GO:0043176) serotonin binding(GO:0051378) |
| 0.1 | 5.0 | GO:0017075 | syntaxin-1 binding(GO:0017075) |
| 0.1 | 0.5 | GO:0005384 | manganese ion transmembrane transporter activity(GO:0005384) |
| 0.1 | 2.4 | GO:0015125 | bile acid transmembrane transporter activity(GO:0015125) |
| 0.1 | 0.5 | GO:0038025 | reelin receptor activity(GO:0038025) |
| 0.1 | 0.5 | GO:0004886 | 9-cis retinoic acid receptor activity(GO:0004886) |
| 0.1 | 2.1 | GO:0008179 | adenylate cyclase binding(GO:0008179) |
| 0.1 | 0.4 | GO:0004668 | protein-arginine deiminase activity(GO:0004668) |
| 0.1 | 0.4 | GO:0002134 | pyrimidine nucleoside binding(GO:0001884) UTP binding(GO:0002134) pyrimidine ribonucleoside binding(GO:0032551) |
| 0.1 | 2.7 | GO:0045294 | alpha-catenin binding(GO:0045294) |
| 0.1 | 0.4 | GO:0004769 | steroid delta-isomerase activity(GO:0004769) |
| 0.1 | 0.7 | GO:0004735 | pyrroline-5-carboxylate reductase activity(GO:0004735) |
| 0.1 | 0.6 | GO:0004430 | 1-phosphatidylinositol 4-kinase activity(GO:0004430) |
| 0.1 | 0.6 | GO:0004656 | procollagen-proline 4-dioxygenase activity(GO:0004656) |
| 0.1 | 0.8 | GO:0070097 | delta-catenin binding(GO:0070097) |
| 0.1 | 0.8 | GO:0001042 | RNA polymerase I core binding(GO:0001042) |
| 0.1 | 1.0 | GO:0052658 | inositol-1,4,5-trisphosphate 5-phosphatase activity(GO:0052658) |
| 0.1 | 2.0 | GO:0043422 | protein kinase B binding(GO:0043422) |
| 0.1 | 0.2 | GO:0097604 | temperature-gated cation channel activity(GO:0097604) |
| 0.1 | 1.6 | GO:0015467 | G-protein activated inward rectifier potassium channel activity(GO:0015467) |
| 0.1 | 1.1 | GO:0070567 | cytidylyltransferase activity(GO:0070567) |
| 0.1 | 0.4 | GO:0047179 | platelet-activating factor acetyltransferase activity(GO:0047179) |
| 0.1 | 0.9 | GO:0016174 | NAD(P)H oxidase activity(GO:0016174) |
| 0.1 | 0.8 | GO:1904929 | coreceptor activity involved in Wnt signaling pathway, planar cell polarity pathway(GO:1904929) |
| 0.1 | 0.5 | GO:0008467 | [heparan sulfate]-glucosamine 3-sulfotransferase 1 activity(GO:0008467) |
| 0.1 | 0.8 | GO:0005280 | hydrogen:amino acid symporter activity(GO:0005280) |
| 0.1 | 1.5 | GO:0008603 | cAMP-dependent protein kinase regulator activity(GO:0008603) |
| 0.1 | 0.4 | GO:0050610 | glutathione dehydrogenase (ascorbate) activity(GO:0045174) methylarsonate reductase activity(GO:0050610) |
| 0.1 | 2.1 | GO:0008484 | sulfuric ester hydrolase activity(GO:0008484) |
| 0.1 | 1.0 | GO:0010314 | phosphatidylinositol-5-phosphate binding(GO:0010314) |
| 0.1 | 0.7 | GO:0031685 | adenosine receptor binding(GO:0031685) |
| 0.1 | 0.2 | GO:0035402 | histone kinase activity (H3-T11 specific)(GO:0035402) |
| 0.1 | 1.7 | GO:0005247 | voltage-gated chloride channel activity(GO:0005247) |
| 0.1 | 1.8 | GO:0017049 | GTP-Rho binding(GO:0017049) |
| 0.1 | 0.4 | GO:0031708 | endothelin B receptor binding(GO:0031708) |
| 0.1 | 2.2 | GO:0008331 | high voltage-gated calcium channel activity(GO:0008331) |
| 0.1 | 0.7 | GO:0015279 | store-operated calcium channel activity(GO:0015279) |
| 0.1 | 1.9 | GO:0035198 | miRNA binding(GO:0035198) |
| 0.1 | 1.8 | GO:0002162 | dystroglycan binding(GO:0002162) |
| 0.1 | 0.7 | GO:0035612 | AP-2 adaptor complex binding(GO:0035612) |
| 0.0 | 1.6 | GO:0031005 | filamin binding(GO:0031005) |
| 0.0 | 1.2 | GO:0042043 | neurexin family protein binding(GO:0042043) |
| 0.0 | 0.2 | GO:0052836 | inositol 5-diphosphate pentakisphosphate 5-kinase activity(GO:0052836) inositol diphosphate tetrakisphosphate kinase activity(GO:0052839) |
| 0.0 | 1.9 | GO:0005092 | GDP-dissociation inhibitor activity(GO:0005092) |
| 0.0 | 0.8 | GO:0030306 | ADP-ribosylation factor binding(GO:0030306) |
| 0.0 | 0.8 | GO:0032794 | GTPase activating protein binding(GO:0032794) |
| 0.0 | 3.6 | GO:0030507 | spectrin binding(GO:0030507) |
| 0.0 | 0.7 | GO:0036374 | glutathione hydrolase activity(GO:0036374) |
| 0.0 | 0.7 | GO:0004865 | protein serine/threonine phosphatase inhibitor activity(GO:0004865) |
| 0.0 | 0.6 | GO:0008526 | phosphatidylinositol transporter activity(GO:0008526) |
| 0.0 | 1.5 | GO:0005248 | voltage-gated sodium channel activity(GO:0005248) voltage-gated ion channel activity involved in regulation of postsynaptic membrane potential(GO:1905030) |
| 0.0 | 1.1 | GO:0005234 | extracellular-glutamate-gated ion channel activity(GO:0005234) |
| 0.0 | 1.8 | GO:0008157 | protein phosphatase 1 binding(GO:0008157) |
| 0.0 | 0.5 | GO:0016015 | morphogen activity(GO:0016015) |
| 0.0 | 0.3 | GO:0004013 | adenosylhomocysteinase activity(GO:0004013) trialkylsulfonium hydrolase activity(GO:0016802) |
| 0.0 | 3.3 | GO:0001540 | beta-amyloid binding(GO:0001540) |
| 0.0 | 1.5 | GO:0001671 | ATPase activator activity(GO:0001671) |
| 0.0 | 1.1 | GO:0022848 | acetylcholine-gated cation channel activity(GO:0022848) |
| 0.0 | 0.4 | GO:0042296 | ISG15 transferase activity(GO:0042296) |
| 0.0 | 1.0 | GO:0102391 | decanoate--CoA ligase activity(GO:0102391) |
| 0.0 | 0.2 | GO:0019798 | procollagen-proline dioxygenase activity(GO:0019798) |
| 0.0 | 0.3 | GO:1990226 | histone methyltransferase binding(GO:1990226) |
| 0.0 | 1.6 | GO:0005540 | hyaluronic acid binding(GO:0005540) |
| 0.0 | 2.1 | GO:0001103 | RNA polymerase II repressing transcription factor binding(GO:0001103) |
| 0.0 | 1.6 | GO:0071889 | 14-3-3 protein binding(GO:0071889) |
| 0.0 | 0.7 | GO:0005049 | nuclear export signal receptor activity(GO:0005049) |
| 0.0 | 0.4 | GO:0097322 | 7SK snRNA binding(GO:0097322) |
| 0.0 | 0.9 | GO:0019992 | diacylglycerol binding(GO:0019992) |
| 0.0 | 0.1 | GO:0005169 | neurotrophin TRKB receptor binding(GO:0005169) |
| 0.0 | 0.1 | GO:0019785 | ISG15-specific protease activity(GO:0019785) |
| 0.0 | 4.3 | GO:0015459 | potassium channel regulator activity(GO:0015459) |
| 0.0 | 0.3 | GO:0016176 | superoxide-generating NADPH oxidase activator activity(GO:0016176) |
| 0.0 | 0.1 | GO:0030379 | neurotensin receptor activity, non-G-protein coupled(GO:0030379) |
| 0.0 | 0.2 | GO:0017169 | CDP-alcohol phosphatidyltransferase activity(GO:0017169) |
| 0.0 | 0.1 | GO:0004618 | phosphoglycerate kinase activity(GO:0004618) |
| 0.0 | 3.8 | GO:0002039 | p53 binding(GO:0002039) |
| 0.0 | 1.0 | GO:0030506 | ankyrin binding(GO:0030506) |
| 0.0 | 0.1 | GO:0004449 | isocitrate dehydrogenase (NAD+) activity(GO:0004449) |
| 0.0 | 0.2 | GO:0004489 | methylenetetrahydrofolate reductase (NAD(P)H) activity(GO:0004489) |
| 0.0 | 2.6 | GO:0048365 | Rac GTPase binding(GO:0048365) |
| 0.0 | 1.1 | GO:0030676 | Rac guanyl-nucleotide exchange factor activity(GO:0030676) |
| 0.0 | 1.3 | GO:0005086 | ARF guanyl-nucleotide exchange factor activity(GO:0005086) |
| 0.0 | 0.1 | GO:0004782 | sulfinoalanine decarboxylase activity(GO:0004782) |
| 0.0 | 0.1 | GO:0004616 | phosphogluconate dehydrogenase (decarboxylating) activity(GO:0004616) |
| 0.0 | 0.2 | GO:0001665 | alpha-N-acetylgalactosaminide alpha-2,6-sialyltransferase activity(GO:0001665) |
| 0.0 | 0.9 | GO:0030552 | cAMP binding(GO:0030552) |
| 0.0 | 0.2 | GO:0042978 | ornithine decarboxylase activator activity(GO:0042978) |
| 0.0 | 0.1 | GO:0048101 | calcium- and calmodulin-regulated 3',5'-cyclic-GMP phosphodiesterase activity(GO:0048101) |
| 0.0 | 0.2 | GO:0010484 | H3 histone acetyltransferase activity(GO:0010484) |
| 0.0 | 0.8 | GO:0004806 | triglyceride lipase activity(GO:0004806) |
| 0.0 | 0.6 | GO:0047555 | 3',5'-cyclic-GMP phosphodiesterase activity(GO:0047555) |
| 0.0 | 0.7 | GO:0035497 | cAMP response element binding(GO:0035497) |
| 0.0 | 0.9 | GO:0004198 | calcium-dependent cysteine-type endopeptidase activity(GO:0004198) |
| 0.0 | 0.5 | GO:0030296 | protein tyrosine kinase activator activity(GO:0030296) |
| 0.0 | 0.0 | GO:0030614 | oxidoreductase activity, acting on phosphorus or arsenic in donors(GO:0030613) oxidoreductase activity, acting on phosphorus or arsenic in donors, disulfide as acceptor(GO:0030614) |
| 0.0 | 1.3 | GO:0005546 | phosphatidylinositol-4,5-bisphosphate binding(GO:0005546) |
| 0.0 | 0.0 | GO:0043891 | glyceraldehyde-3-phosphate dehydrogenase (NAD+) (phosphorylating) activity(GO:0004365) glyceraldehyde-3-phosphate dehydrogenase (NAD(P)+) (phosphorylating) activity(GO:0043891) |
| 0.0 | 0.1 | GO:0005017 | platelet-derived growth factor-activated receptor activity(GO:0005017) |
| 0.0 | 0.3 | GO:0052650 | NADP-retinol dehydrogenase activity(GO:0052650) |
| 0.0 | 0.3 | GO:0004112 | cyclic-nucleotide phosphodiesterase activity(GO:0004112) |
| 0.0 | 0.1 | GO:1902444 | riboflavin binding(GO:1902444) |
| 0.0 | 0.8 | GO:0004003 | ATP-dependent DNA helicase activity(GO:0004003) |
| 0.0 | 0.2 | GO:0047498 | calcium-dependent phospholipase A2 activity(GO:0047498) |
| 0.0 | 0.4 | GO:0019789 | SUMO transferase activity(GO:0019789) |
| 0.0 | 0.6 | GO:0051010 | microtubule plus-end binding(GO:0051010) |
| 0.0 | 0.7 | GO:0004364 | glutathione transferase activity(GO:0004364) |
| 0.0 | 1.2 | GO:0070412 | R-SMAD binding(GO:0070412) |
| 0.0 | 1.2 | GO:0052742 | phosphatidylinositol kinase activity(GO:0052742) |
| 0.0 | 0.2 | GO:0015280 | ligand-gated sodium channel activity(GO:0015280) |
| 0.0 | 0.7 | GO:0008028 | monocarboxylic acid transmembrane transporter activity(GO:0008028) |
| 0.0 | 0.1 | GO:0051011 | microtubule minus-end binding(GO:0051011) |
| 0.0 | 0.2 | GO:0051880 | G-quadruplex DNA binding(GO:0051880) |
| 0.0 | 0.1 | GO:0004994 | somatostatin receptor activity(GO:0004994) |
| 0.0 | 0.1 | GO:0033170 | DNA clamp loader activity(GO:0003689) protein-DNA loading ATPase activity(GO:0033170) |
| 0.0 | 0.3 | GO:0005251 | delayed rectifier potassium channel activity(GO:0005251) |
| 0.0 | 0.3 | GO:1990380 | Lys48-specific deubiquitinase activity(GO:1990380) |
| 0.0 | 0.2 | GO:0005522 | profilin binding(GO:0005522) |
| 0.0 | 0.1 | GO:0015321 | sodium-dependent phosphate transmembrane transporter activity(GO:0015321) |
| 0.0 | 0.2 | GO:0005176 | ErbB-2 class receptor binding(GO:0005176) |
| 0.0 | 0.2 | GO:0004745 | retinol dehydrogenase activity(GO:0004745) |
| 0.0 | 4.3 | GO:0008017 | microtubule binding(GO:0008017) |
| 0.0 | 0.4 | GO:0008536 | Ran GTPase binding(GO:0008536) |
Gene overrepresentation in curated gene sets: canonical pathways category:
| Log-likelihood per target | Total log-likelihood | Term | Description |
|---|---|---|---|
| 0.2 | 6.4 | PID S1P S1P4 PATHWAY | S1P4 pathway |
| 0.1 | 0.5 | SA G1 AND S PHASES | Cdk2, 4, and 6 bind cyclin D in G1, while cdk2/cyclin E promotes the G1/S transition. |
| 0.1 | 7.6 | PID EPHB FWD PATHWAY | EPHB forward signaling |
| 0.1 | 3.6 | ST GRANULE CELL SURVIVAL PATHWAY | Granule Cell Survival Pathway is a specific case of more general PAC1 Receptor Pathway. |
| 0.1 | 1.6 | PID WNT CANONICAL PATHWAY | Canonical Wnt signaling pathway |
| 0.1 | 3.0 | PID NETRIN PATHWAY | Netrin-mediated signaling events |
| 0.1 | 5.4 | PID AJDISS 2PATHWAY | Posttranslational regulation of adherens junction stability and dissassembly |
| 0.1 | 1.4 | PID LPA4 PATHWAY | LPA4-mediated signaling events |
| 0.0 | 0.6 | PID AVB3 INTEGRIN PATHWAY | Integrins in angiogenesis |
| 0.0 | 0.5 | PID BETA CATENIN DEG PATHWAY | Degradation of beta catenin |
| 0.0 | 3.4 | PID ATR PATHWAY | ATR signaling pathway |
| 0.0 | 1.0 | PID SYNDECAN 3 PATHWAY | Syndecan-3-mediated signaling events |
| 0.0 | 1.3 | PID ERBB1 RECEPTOR PROXIMAL PATHWAY | EGF receptor (ErbB1) signaling pathway |
| 0.0 | 3.0 | ST WNT BETA CATENIN PATHWAY | Wnt/beta-catenin Pathway |
| 0.0 | 1.5 | ST WNT CA2 CYCLIC GMP PATHWAY | Wnt/Ca2+/cyclic GMP signaling. |
| 0.0 | 1.2 | ST DIFFERENTIATION PATHWAY IN PC12 CELLS | Differentiation Pathway in PC12 Cells; this is a specific case of PAC1 Receptor Pathway. |
| 0.0 | 1.4 | PID EPHA FWDPATHWAY | EPHA forward signaling |
| 0.0 | 2.2 | PID INTEGRIN A4B1 PATHWAY | Alpha4 beta1 integrin signaling events |
| 0.0 | 1.4 | PID SYNDECAN 4 PATHWAY | Syndecan-4-mediated signaling events |
| 0.0 | 1.5 | PID ALPHA SYNUCLEIN PATHWAY | Alpha-synuclein signaling |
| 0.0 | 0.3 | PID CD40 PATHWAY | CD40/CD40L signaling |
| 0.0 | 0.4 | PID ENDOTHELIN PATHWAY | Endothelins |
| 0.0 | 0.4 | PID NCADHERIN PATHWAY | N-cadherin signaling events |
| 0.0 | 0.8 | PID LIS1 PATHWAY | Lissencephaly gene (LIS1) in neuronal migration and development |
| 0.0 | 2.1 | PID NOTCH PATHWAY | Notch signaling pathway |
| 0.0 | 1.5 | ST FAS SIGNALING PATHWAY | Fas Signaling Pathway |
| 0.0 | 0.9 | PID ARF6 PATHWAY | Arf6 signaling events |
| 0.0 | 0.4 | PID ECADHERIN STABILIZATION PATHWAY | Stabilization and expansion of the E-cadherin adherens junction |
| 0.0 | 1.0 | PID ARF6 TRAFFICKING PATHWAY | Arf6 trafficking events |
| 0.0 | 0.1 | PID IL6 7 PATHWAY | IL6-mediated signaling events |
| 0.0 | 2.0 | PID MYC REPRESS PATHWAY | Validated targets of C-MYC transcriptional repression |
| 0.0 | 0.2 | PID MAPK TRK PATHWAY | Trk receptor signaling mediated by the MAPK pathway |
| 0.0 | 0.2 | SIG PIP3 SIGNALING IN B LYMPHOCYTES | Genes related to PIP3 signaling in B lymphocytes |
| 0.0 | 0.4 | SIG PIP3 SIGNALING IN CARDIAC MYOCTES | Genes related to PIP3 signaling in cardiac myocytes |
Gene overrepresentation in curated gene sets: REACTOME pathways category:
| Log-likelihood per target | Total log-likelihood | Term | Description |
|---|---|---|---|
| 0.2 | 7.5 | REACTOME INHIBITION OF INSULIN SECRETION BY ADRENALINE NORADRENALINE | Genes involved in Inhibition of Insulin Secretion by Adrenaline/Noradrenaline |
| 0.1 | 7.4 | REACTOME INHIBITION OF VOLTAGE GATED CA2 CHANNELS VIA GBETA GAMMA SUBUNITS | Genes involved in Inhibition of voltage gated Ca2+ channels via Gbeta/gamma subunits |
| 0.1 | 2.4 | REACTOME RECYCLING OF BILE ACIDS AND SALTS | Genes involved in Recycling of bile acids and salts |
| 0.1 | 1.8 | REACTOME ROLE OF DCC IN REGULATING APOPTOSIS | Genes involved in Role of DCC in regulating apoptosis |
| 0.1 | 4.6 | REACTOME AMINE COMPOUND SLC TRANSPORTERS | Genes involved in Amine compound SLC transporters |
| 0.1 | 1.9 | REACTOME TETRAHYDROBIOPTERIN BH4 SYNTHESIS RECYCLING SALVAGE AND REGULATION | Genes involved in Tetrahydrobiopterin (BH4) synthesis, recycling, salvage and regulation |
| 0.1 | 2.9 | REACTOME OTHER SEMAPHORIN INTERACTIONS | Genes involved in Other semaphorin interactions |
| 0.1 | 3.5 | REACTOME GLUTAMATE NEUROTRANSMITTER RELEASE CYCLE | Genes involved in Glutamate Neurotransmitter Release Cycle |
| 0.1 | 3.3 | REACTOME ACTIVATED NOTCH1 TRANSMITS SIGNAL TO THE NUCLEUS | Genes involved in Activated NOTCH1 Transmits Signal to the Nucleus |
| 0.1 | 5.2 | REACTOME SYNTHESIS OF PIPS AT THE PLASMA MEMBRANE | Genes involved in Synthesis of PIPs at the plasma membrane |
| 0.1 | 4.1 | REACTOME INTERACTION BETWEEN L1 AND ANKYRINS | Genes involved in Interaction between L1 and Ankyrins |
| 0.1 | 1.0 | REACTOME SEROTONIN RECEPTORS | Genes involved in Serotonin receptors |
| 0.1 | 1.4 | REACTOME CLASS C 3 METABOTROPIC GLUTAMATE PHEROMONE RECEPTORS | Genes involved in Class C/3 (Metabotropic glutamate/pheromone receptors) |
| 0.1 | 1.3 | REACTOME THE ACTIVATION OF ARYLSULFATASES | Genes involved in The activation of arylsulfatases |
| 0.1 | 0.7 | REACTOME ROLE OF SECOND MESSENGERS IN NETRIN1 SIGNALING | Genes involved in Role of second messengers in netrin-1 signaling |
| 0.1 | 1.2 | REACTOME PROTEOLYTIC CLEAVAGE OF SNARE COMPLEX PROTEINS | Genes involved in Proteolytic cleavage of SNARE complex proteins |
| 0.1 | 1.9 | REACTOME JNK C JUN KINASES PHOSPHORYLATION AND ACTIVATION MEDIATED BY ACTIVATED HUMAN TAK1 | Genes involved in JNK (c-Jun kinases) phosphorylation and activation mediated by activated human TAK1 |
| 0.0 | 1.2 | REACTOME SYNTHESIS OF PIPS AT THE GOLGI MEMBRANE | Genes involved in Synthesis of PIPs at the Golgi membrane |
| 0.0 | 1.1 | REACTOME PRESYNAPTIC NICOTINIC ACETYLCHOLINE RECEPTORS | Genes involved in Presynaptic nicotinic acetylcholine receptors |
| 0.0 | 1.0 | REACTOME GABA SYNTHESIS RELEASE REUPTAKE AND DEGRADATION | Genes involved in GABA synthesis, release, reuptake and degradation |
| 0.0 | 0.8 | REACTOME UNWINDING OF DNA | Genes involved in Unwinding of DNA |
| 0.0 | 2.7 | REACTOME ADHERENS JUNCTIONS INTERACTIONS | Genes involved in Adherens junctions interactions |
| 0.0 | 2.2 | REACTOME BASIGIN INTERACTIONS | Genes involved in Basigin interactions |
| 0.0 | 1.1 | REACTOME ACTIVATION OF NF KAPPAB IN B CELLS | Genes involved in Activation of NF-kappaB in B Cells |
| 0.0 | 0.4 | REACTOME ANDROGEN BIOSYNTHESIS | Genes involved in Androgen biosynthesis |
| 0.0 | 1.5 | REACTOME PKA MEDIATED PHOSPHORYLATION OF CREB | Genes involved in PKA-mediated phosphorylation of CREB |
| 0.0 | 0.9 | REACTOME SYNTHESIS OF BILE ACIDS AND BILE SALTS | Genes involved in Synthesis of bile acids and bile salts |
| 0.0 | 0.3 | REACTOME MEMBRANE BINDING AND TARGETTING OF GAG PROTEINS | Genes involved in Membrane binding and targetting of GAG proteins |
| 0.0 | 0.9 | REACTOME GAP JUNCTION DEGRADATION | Genes involved in Gap junction degradation |
| 0.0 | 0.7 | REACTOME P2Y RECEPTORS | Genes involved in P2Y receptors |
| 0.0 | 0.6 | REACTOME SIGNALING BY ACTIVATED POINT MUTANTS OF FGFR1 | Genes involved in Signaling by activated point mutants of FGFR1 |
| 0.0 | 0.5 | REACTOME ENDOGENOUS STEROLS | Genes involved in Endogenous sterols |
| 0.0 | 1.0 | REACTOME TRAFFICKING OF GLUR2 CONTAINING AMPA RECEPTORS | Genes involved in Trafficking of GluR2-containing AMPA receptors |
| 0.0 | 1.4 | REACTOME FATTY ACYL COA BIOSYNTHESIS | Genes involved in Fatty Acyl-CoA Biosynthesis |
| 0.0 | 1.1 | REACTOME ELONGATION ARREST AND RECOVERY | Genes involved in Elongation arrest and recovery |
| 0.0 | 0.5 | REACTOME PLATELET SENSITIZATION BY LDL | Genes involved in Platelet sensitization by LDL |
| 0.0 | 0.2 | REACTOME SYNTHESIS OF PIPS AT THE EARLY ENDOSOME MEMBRANE | Genes involved in Synthesis of PIPs at the early endosome membrane |
| 0.0 | 0.9 | REACTOME KERATAN SULFATE BIOSYNTHESIS | Genes involved in Keratan sulfate biosynthesis |
| 0.0 | 0.2 | REACTOME PRE NOTCH PROCESSING IN GOLGI | Genes involved in Pre-NOTCH Processing in Golgi |
| 0.0 | 0.8 | REACTOME FORMATION OF TUBULIN FOLDING INTERMEDIATES BY CCT TRIC | Genes involved in Formation of tubulin folding intermediates by CCT/TriC |
| 0.0 | 0.5 | REACTOME ABCA TRANSPORTERS IN LIPID HOMEOSTASIS | Genes involved in ABCA transporters in lipid homeostasis |
| 0.0 | 0.3 | REACTOME NEGATIVE REGULATION OF THE PI3K AKT NETWORK | Genes involved in Negative regulation of the PI3K/AKT network |
| 0.0 | 1.2 | REACTOME VOLTAGE GATED POTASSIUM CHANNELS | Genes involved in Voltage gated Potassium channels |
| 0.0 | 0.8 | REACTOME SEMA4D INDUCED CELL MIGRATION AND GROWTH CONE COLLAPSE | Genes involved in Sema4D induced cell migration and growth-cone collapse |
| 0.0 | 0.8 | REACTOME GLUTATHIONE CONJUGATION | Genes involved in Glutathione conjugation |
| 0.0 | 0.2 | REACTOME REGULATION OF WATER BALANCE BY RENAL AQUAPORINS | Genes involved in Regulation of Water Balance by Renal Aquaporins |
| 0.0 | 1.0 | REACTOME BMAL1 CLOCK NPAS2 ACTIVATES CIRCADIAN EXPRESSION | Genes involved in BMAL1:CLOCK/NPAS2 Activates Circadian Expression |
| 0.0 | 0.7 | REACTOME CGMP EFFECTS | Genes involved in cGMP effects |
| 0.0 | 0.9 | REACTOME SIGNALING BY FGFR MUTANTS | Genes involved in Signaling by FGFR mutants |
| 0.0 | 0.3 | REACTOME CS DS DEGRADATION | Genes involved in CS/DS degradation |
| 0.0 | 0.5 | REACTOME SYNTHESIS SECRETION AND INACTIVATION OF GLP1 | Genes involved in Synthesis, Secretion, and Inactivation of Glucagon-like Peptide-1 (GLP-1) |
| 0.0 | 0.2 | REACTOME THE NLRP3 INFLAMMASOME | Genes involved in The NLRP3 inflammasome |